Guamanian/Chamorro Child Poverty Under the Age of 5

COMPARE

Guamanian/Chamorro
Race
Ancestry
AfghanAfricanAlaska NativeAlaskan AthabascanAlbanianAleutAlsatianAmericanApacheArabArapahoArgentineanArmenianAssyrian/Chaldean/SyriacAustralianAustrianBahamianBangladeshiBarbadianBasqueBelgianBelizeanBermudanBhutaneseBlackfeetBolivianBrazilianBritishBritish West IndianBulgarianBurmeseCajunCambodianCanadianCape VerdeanCarpatho RusynCelticCentral AmericanCentral American IndianCherokeeCheyenneChickasawChileanChineseChippewaChoctawColombianColvilleComancheCosta RicanCreeCreekCroatianCrowCubanCypriotCzechCzechoslovakianDanishDelawareDominicanDutchDutch West IndianEastern EuropeanEcuadorianEgyptianEnglishEstonianEthiopianEuropeanFijianFilipinoFinnishFrenchFrench American IndianFrench CanadianGermanGerman RussianGhanaianGreekGuamanian/ChamorroGuatemalanGuyaneseHaitianHmongHonduranHopiHoumaHungarianIcelanderIndian (Asian)IndonesianInupiatIranianIraqiIrishIroquoisIsraeliItalianJamaicanJapaneseJordanianKenyanKiowaKoreanLaotianLatvianLebaneseLiberianLithuanianLumbeeLuxembourgerMacedonianMalaysianMalteseMarshalleseMenomineeMexicanMexican American IndianMongolianMoroccanNative HawaiianNavajoNepaleseNew ZealanderNicaraguanNigerianNorthern EuropeanNorwegianOkinawanOsageOttawaPaiutePakistaniPalestinianPanamanianParaguayanPennsylvania GermanPeruvianPimaPolishPortuguesePotawatomiPuebloPuerto RicanPuget Sound SalishRomanianRussianSalvadoranSamoanScandinavianScotch-IrishScottishSeminoleSenegaleseSerbianShoshoneSierra LeoneanSiouxSlavicSlovakSloveneSomaliSouth AfricanSouth AmericanSouth American IndianSoviet UnionSpaniardSpanishSpanish AmericanSpanish American IndianSri LankanSubsaharan AfricanSudaneseSwedishSwissSyrianTaiwaneseThaiTlingit-HaidaTohono O'OdhamTonganTrinidadian and TobagonianTsimshianTurkishU.S. Virgin IslanderUgandanUkrainianUruguayanUteVenezuelanVietnameseWelshWest IndianYakamaYaquiYugoslavianYumanYup'ikZimbabwean
Immigration
NonimmigrantsImmigrantsAfghanistanAfricaAlbaniaArgentinaArmeniaAsiaAustraliaAustriaBahamasBangladeshBarbadosBelarusBelgiumBelizeBoliviaBosnia and HerzegovinaBrazilBulgariaBurma/MyanmarCabo VerdeCambodiaCameroonCanadaCaribbeanCentral AmericaChileChinaColombiaCongoCosta RicaCroatiaCubaCzechoslovakiaDenmarkDominicaDominican RepublicEastern AfricaEastern AsiaEastern EuropeEcuadorEgyptEl SalvadorEnglandEritreaEthiopiaEuropeFijiFranceGermanyGhanaGreeceGrenadaGuatemalaGuyanaHaitiHondurasHong KongHungaryIndiaIndonesiaIranIraqIrelandIsraelItalyJamaicaJapanJordanKazakhstanKenyaKoreaKuwaitLaosLatin AmericaLatviaLebanonLiberiaLithuaniaMalaysiaMexicoMicronesiaMiddle AfricaMoldovaMoroccoNepalNetherlandsNicaraguaNigeriaNorth AmericaNorth MacedoniaNorthern AfricaNorthern EuropeNorwayOceaniaPakistanPanamaPeruPhilippinesPolandPortugalRomaniaRussiaSaudi ArabiaScotlandSenegalSerbiaSierra LeoneSingaporeSomaliaSouth AfricaSouth AmericaSouth Central AsiaSouth Eastern AsiaSouthern EuropeSpainSri LankaSt. Vincent and the GrenadinesSudanSwedenSwitzerlandSyriaTaiwanThailandTrinidad and TobagoTurkeyUgandaUkraineUruguayUzbekistanVenezuelaVietnamWest IndiesWestern AfricaWestern AsiaWestern EuropeYemenZaireZimbabweAzores
Select to Compare
Race
Ancestry
AfghanAfricanAlaska NativeAlaskan AthabascanAlbanianAleutAlsatianAmericanApacheArabArapahoArgentineanArmenianAssyrian/Chaldean/SyriacAustralianAustrianBahamianBangladeshiBarbadianBasqueBelgianBelizeanBermudanBhutaneseBlackfeetBolivianBrazilianBritishBritish West IndianBulgarianBurmeseCajunCambodianCanadianCape VerdeanCarpatho RusynCelticCentral AmericanCentral American IndianCherokeeCheyenneChickasawChileanChineseChippewaChoctawColombianColvilleComancheCosta RicanCreeCreekCroatianCrowCubanCypriotCzechCzechoslovakianDanishDelawareDominicanDutchDutch West IndianEastern EuropeanEcuadorianEgyptianEnglishEstonianEthiopianEuropeanFijianFilipinoFinnishFrenchFrench American IndianFrench CanadianGermanGerman RussianGhanaianGreekGuatemalanGuyaneseHaitianHmongHonduranHopiHoumaHungarianIcelanderIndian (Asian)IndonesianInupiatIranianIraqiIrishIroquoisIsraeliItalianJamaicanJapaneseJordanianKenyanKiowaKoreanLaotianLatvianLebaneseLiberianLithuanianLumbeeLuxembourgerMacedonianMalaysianMalteseMarshalleseMenomineeMexicanMexican American IndianMongolianMoroccanNative HawaiianNavajoNepaleseNew ZealanderNicaraguanNigerianNorthern EuropeanNorwegianOkinawanOsageOttawaPaiutePakistaniPalestinianPanamanianParaguayanPennsylvania GermanPeruvianPimaPolishPortuguesePotawatomiPuebloPuerto RicanPuget Sound SalishRomanianRussianSalvadoranSamoanScandinavianScotch-IrishScottishSeminoleSenegaleseSerbianShoshoneSierra LeoneanSiouxSlavicSlovakSloveneSomaliSouth AfricanSouth AmericanSouth American IndianSoviet UnionSpaniardSpanishSpanish AmericanSpanish American IndianSri LankanSubsaharan AfricanSudaneseSwedishSwissSyrianTaiwaneseThaiTlingit-HaidaTohono O'OdhamTonganTrinidadian and TobagonianTsimshianTurkishU.S. Virgin IslanderUgandanUkrainianUruguayanUteVenezuelanVietnameseWelshWest IndianYakamaYaquiYugoslavianYumanYup'ikZimbabwean
Immigration
NonimmigrantsImmigrantsAfghanistanAfricaAlbaniaArgentinaArmeniaAsiaAustraliaAustriaBahamasBangladeshBarbadosBelarusBelgiumBelizeBoliviaBosnia and HerzegovinaBrazilBulgariaBurma/MyanmarCabo VerdeCambodiaCameroonCanadaCaribbeanCentral AmericaChileChinaColombiaCongoCosta RicaCroatiaCubaCzechoslovakiaDenmarkDominicaDominican RepublicEastern AfricaEastern AsiaEastern EuropeEcuadorEgyptEl SalvadorEnglandEritreaEthiopiaEuropeFijiFranceGermanyGhanaGreeceGrenadaGuatemalaGuyanaHaitiHondurasHong KongHungaryIndiaIndonesiaIranIraqIrelandIsraelItalyJamaicaJapanJordanKazakhstanKenyaKoreaKuwaitLaosLatin AmericaLatviaLebanonLiberiaLithuaniaMalaysiaMexicoMicronesiaMiddle AfricaMoldovaMoroccoNepalNetherlandsNicaraguaNigeriaNorth AmericaNorth MacedoniaNorthern AfricaNorthern EuropeNorwayOceaniaPakistanPanamaPeruPhilippinesPolandPortugalRomaniaRussiaSaudi ArabiaScotlandSenegalSerbiaSierra LeoneSingaporeSomaliaSouth AfricaSouth AmericaSouth Central AsiaSouth Eastern AsiaSouthern EuropeSpainSri LankaSt. Vincent and the GrenadinesSudanSwedenSwitzerlandSyriaTaiwanThailandTrinidad and TobagoTurkeyUgandaUkraineUruguayUzbekistanVenezuelaVietnamWest IndiesWestern AfricaWestern AsiaWestern EuropeYemenZaireZimbabweAzores
Child Poverty Under the Age of 5
Income
Poverty
Unemployment
Labor Participation
Family Structure
Vehicle Availability
Education Level
Disability

Guamanian/Chamorro Child Poverty Under the Age of 5
Excellent

16.5%
POVERTY | CHILDREN < 5
84.2/ 100
METRIC RATING
140th/ 347
METRIC RANK

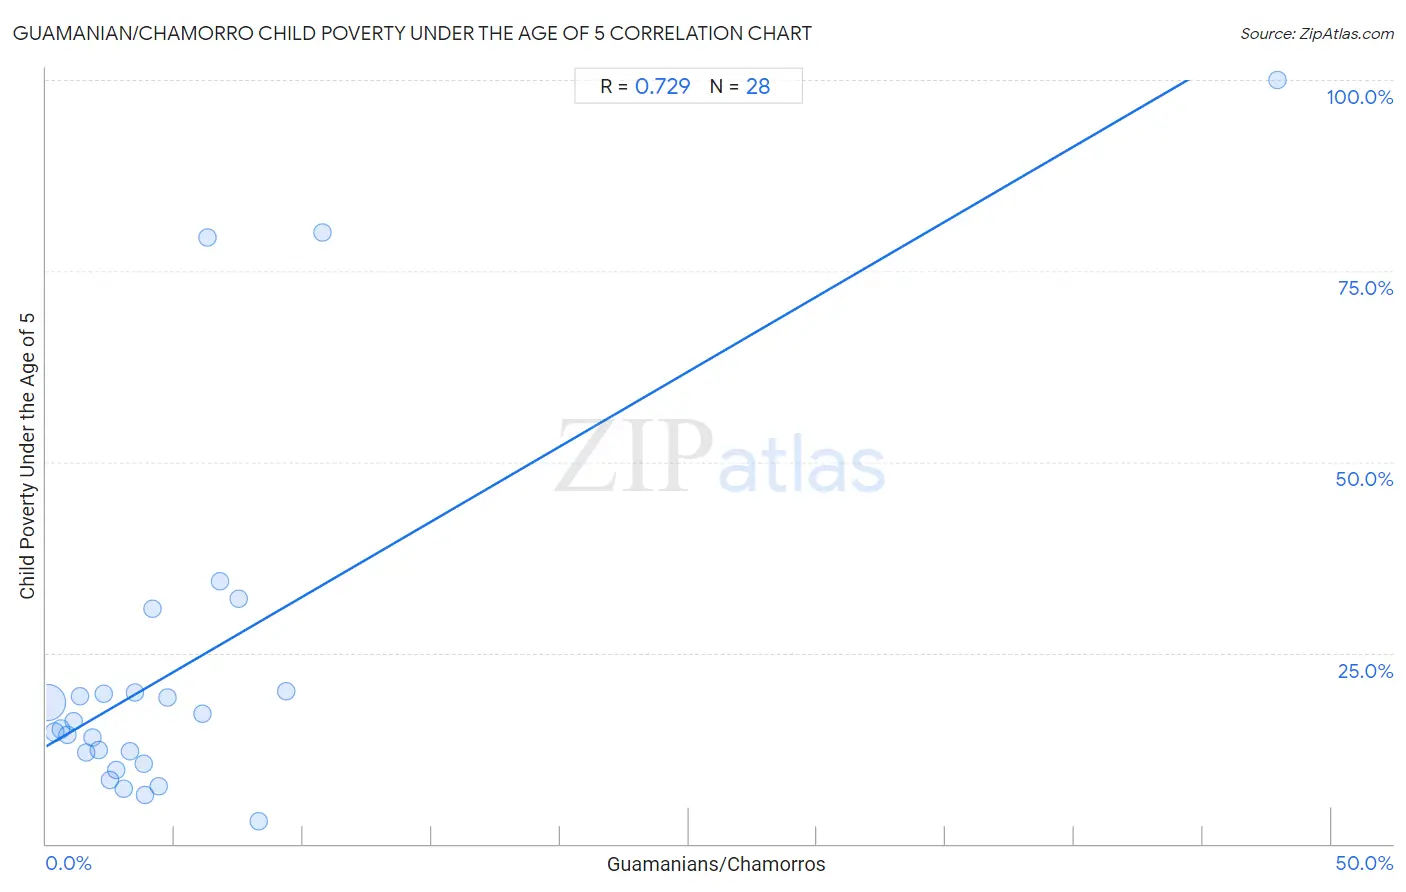
Guamanian/Chamorro Child Poverty Under the Age of 5 Correlation Chart

The statistical analysis conducted on geographies consisting of 218,115,058 people shows a strong positive correlation between the proportion of Guamanians/Chamorros and poverty level among children under the age of 5 in the United States with a correlation coefficient (R) of 0.729 and weighted average of 16.5%. On average, for every 1% (one percent) increase in Guamanians/Chamorros within a typical geography, there is an increase of 2.0% in poverty level among children under the age of 5.
Guamanian/Chamorro Child Poverty Under the Age of 5
It is essential to understand that the correlation between the percentage of Guamanians/Chamorros and poverty level among children under the age of 5 does not imply a direct cause-and-effect relationship. It remains uncertain whether the presence of Guamanians/Chamorros influences an upward or downward trend in the level of poverty level among children under the age of 5 within an area, or if Guamanians/Chamorros simply ended up residing in those areas with higher or lower levels of poverty level among children under the age of 5 due to other factors.

Demographics Similar to Guamanians/Chamorros by Child Poverty Under the Age of 5

In terms of child poverty under the age of 5, the demographic groups most similar to Guamanians/Chamorros are Immigrants from Hungary (16.5%, a difference of 0.070%), German (16.5%, a difference of 0.13%), Immigrants from Western Europe (16.5%, a difference of 0.19%), Immigrants from Chile (16.4%, a difference of 0.23%), and Portuguese (16.5%, a difference of 0.23%).
DemographicsRating | RankChild Poverty Under the Age of 5
Icelanders
87.9
/100
|
#133
Excellent
16.3%
Immigrants from North Macedonia
87.8
/100
|
#134
Excellent
16.4%
Brazilians
87.8
/100
|
#135
Excellent
16.4%
Immigrants from Northern Africa
87.5
/100
|
#136
Excellent
16.4%
Immigrants from Chile
85.3
/100
|
#137
Excellent
16.4%
Germans
84.8
/100
|
#138
Excellent
16.5%
Immigrants from Hungary
84.5
/100
|
#139
Excellent
16.5%
Guamanians/Chamorros
84.2
/100
|
#140
Excellent
16.5%
Immigrants from Western Europe
83.3
/100
|
#141
Excellent
16.5%
Portuguese
83.0
/100
|
#142
Excellent
16.5%
Samoans
83.0
/100
|
#143
Excellent
16.5%
Ethiopians
82.7
/100
|
#144
Excellent
16.5%
Immigrants from Ethiopia
82.1
/100
|
#145
Excellent
16.6%
Israelis
82.0
/100
|
#146
Excellent
16.6%
Immigrants from Nepal
80.3
/100
|
#147
Excellent
16.6%

Guamanian/Chamorro Child Poverty Under the Age of 5 Correlation Summary

MeasurementGuamanian/Chamorro DataChild Poverty Under the Age of 5 Data
Minimum0.065%3.0%
Maximum47.9%100.0%
Range47.8%97.0%
Mean5.4%23.3%
Median3.3%15.5%
Interquartile 25% (IQ1)1.7%11.2%
Interquartile 75% (IQ3)6.2%19.9%
Interquartile Range (IQR)4.5%8.6%
Standard Deviation (Sample)8.8%23.7%
Standard Deviation (Population)8.6%23.3%

Correlation Details

Guamanian/Chamorro PercentileSample SizeChild Poverty Under the Age of 5
[
0.0%
-
0.5%
]
0.065%
188,292,56118.5%
[
0.0%
-
0.5%
]
0.33%
19,473,79214.6%
[
0.5%
-
1.0%
]
0.58%
5,383,38015.0%
[
0.5%
-
1.0%
]
0.82%
2,474,78614.2%
[
1.0%
-
1.5%
]
1.08%
1,157,90216.1%
[
1.0%
-
1.5%
]
1.29%
403,63319.3%
[
1.5%
-
2.0%
]
1.54%
379,50111.9%
[
1.5%
-
2.0%
]
1.79%
176,22114.0%
[
2.0%
-
2.5%
]
2.05%
130,22212.3%
[
2.0%
-
2.5%
]
2.22%
64,17619.7%
[
2.0%
-
2.5%
]
2.48%
40,6978.3%
[
2.5%
-
3.0%
]
2.71%
13,2539.7%
[
3.0%
-
3.5%
]
3.00%
20,6567.2%
[
3.0%
-
3.5%
]
3.26%
20,10612.1%
[
3.0%
-
3.5%
]
3.43%
31,44119.7%
[
3.5%
-
4.0%
]
3.81%
3,30410.5%
[
3.5%
-
4.0%
]
3.87%
4,2436.4%
[
4.0%
-
4.5%
]
4.15%
4,62930.8%
[
4.0%
-
4.5%
]
4.39%
3,8737.6%
[
4.5%
-
5.0%
]
4.73%
24,56919.2%
[
6.0%
-
6.5%
]
6.09%
2,64317.1%
[
6.0%
-
6.5%
]
6.27%
1,61179.3%
[
6.5%
-
7.0%
]
6.75%
85934.4%
[
7.0%
-
7.5%
]
7.50%
92032.1%
[
8.0%
-
8.5%
]
8.29%
5,2623.0%
[
9.0%
-
9.5%
]
9.34%
57820.0%
[
10.5%
-
11.0%
]
10.74%
12180.0%
[
47.5%
-
48.0%
]
47.90%
119100.0%