Guamanian/Chamorro Median Male Earnings
COMPARE
Guamanian/Chamorro
Select to Compare
Median Male Earnings
Guamanian/Chamorro Median Male Earnings
$53,661
EARNINGS | MALES
30.7/ 100
METRIC RATING
191st/ 347
METRIC RANK
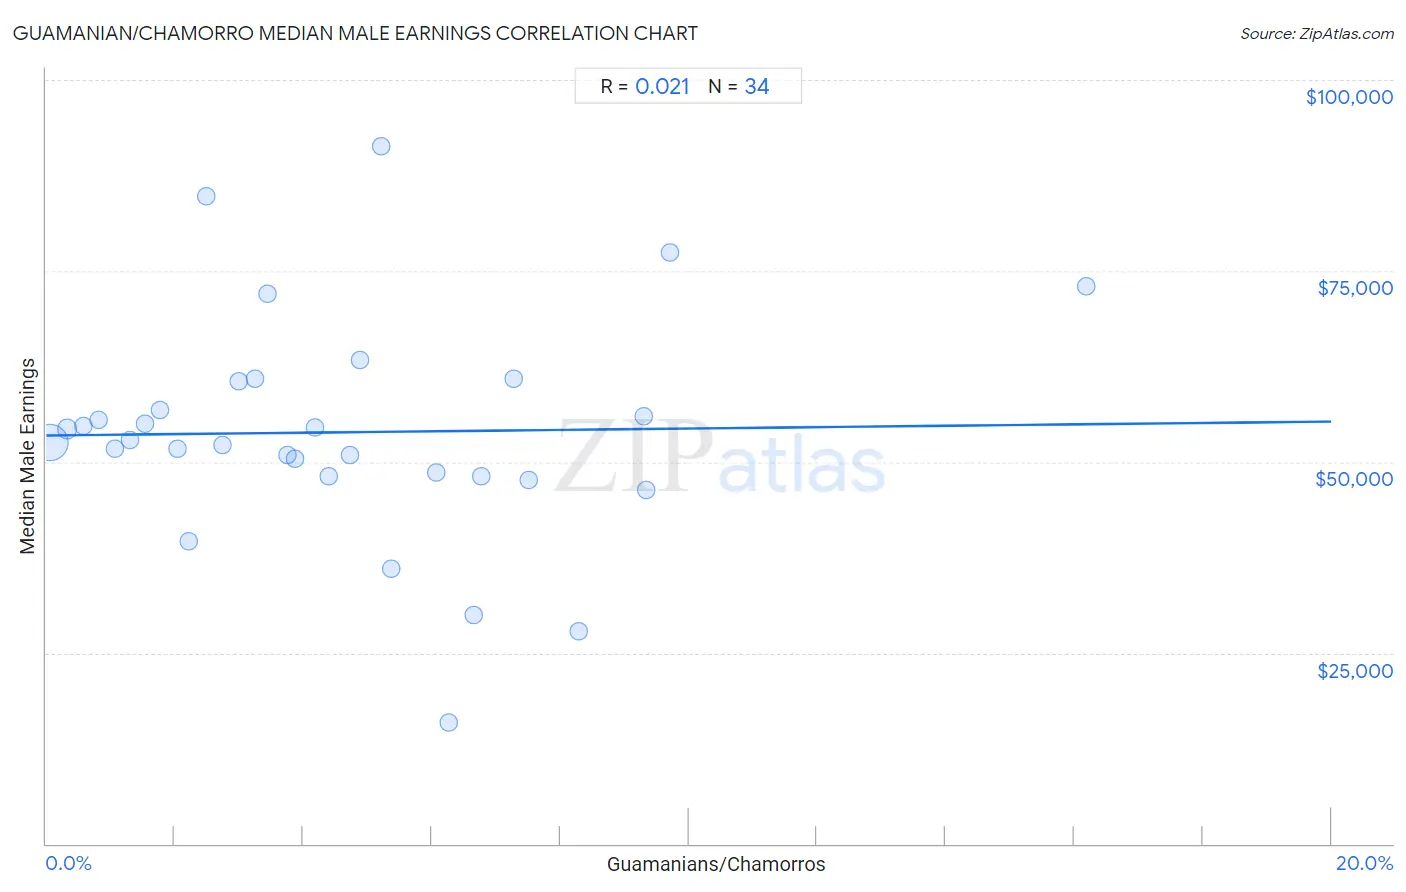
Guamanian/Chamorro Median Male Earnings Correlation Chart
The statistical analysis conducted on geographies consisting of 221,944,725 people shows no correlation between the proportion of Guamanians/Chamorros and median male earnings in the United States with a correlation coefficient (R) of 0.021 and weighted average of $53,661. On average, for every 1% (one percent) increase in Guamanians/Chamorros within a typical geography, there is an increase of $91 in median male earnings.
It is essential to understand that the correlation between the percentage of Guamanians/Chamorros and median male earnings does not imply a direct cause-and-effect relationship. It remains uncertain whether the presence of Guamanians/Chamorros influences an upward or downward trend in the level of median male earnings within an area, or if Guamanians/Chamorros simply ended up residing in those areas with higher or lower levels of median male earnings due to other factors.
Demographics Similar to Guamanians/Chamorros by Median Male Earnings
In terms of median male earnings, the demographic groups most similar to Guamanians/Chamorros are Scotch-Irish ($53,658, a difference of 0.010%), Kenyan ($53,647, a difference of 0.030%), Uruguayan ($53,680, a difference of 0.040%), Puget Sound Salish ($53,704, a difference of 0.080%), and Immigrants from Eritrea ($53,715, a difference of 0.10%).
| Demographics | Rating | Rank | Median Male Earnings |
| Whites/Caucasians | 36.5 /100 | #184 | Fair $53,925 |
| Immigrants from Sierra Leone | 36.0 /100 | #185 | Fair $53,905 |
| Colombians | 34.4 /100 | #186 | Fair $53,832 |
| Immigrants from Eritrea | 31.8 /100 | #187 | Fair $53,715 |
| Immigrants from Eastern Africa | 31.8 /100 | #188 | Fair $53,713 |
| Puget Sound Salish | 31.6 /100 | #189 | Fair $53,704 |
| Uruguayans | 31.1 /100 | #190 | Fair $53,680 |
| Guamanians/Chamorros | 30.7 /100 | #191 | Fair $53,661 |
| Scotch-Irish | 30.6 /100 | #192 | Fair $53,658 |
| Kenyans | 30.4 /100 | #193 | Fair $53,647 |
| Spanish | 29.0 /100 | #194 | Fair $53,576 |
| Immigrants from the Azores | 27.5 /100 | #195 | Fair $53,503 |
| Immigrants from Africa | 26.6 /100 | #196 | Fair $53,457 |
| Immigrants from Kenya | 26.0 /100 | #197 | Fair $53,427 |
| Immigrants from Costa Rica | 22.6 /100 | #198 | Fair $53,237 |
Guamanian/Chamorro Median Male Earnings Correlation Summary
| Measurement | Guamanian/Chamorro Data | Median Male Earnings Data |
| Minimum | 0.066% | $15,938 |
| Maximum | 16.2% | $91,265 |
| Range | 16.1% | $75,327 |
| Mean | 4.6% | $53,880 |
| Median | 4.0% | $52,699 |
| Interquartile 25% (IQ1) | 2.0% | $48,166 |
| Interquartile 75% (IQ3) | 6.7% | $60,575 |
| Interquartile Range (IQR) | 4.6% | $12,408 |
| Standard Deviation (Sample) | 3.4% | $14,873 |
| Standard Deviation (Population) | 3.4% | $14,653 |
Correlation Details
| Guamanian/Chamorro Percentile | Sample Size | Median Male Earnings |
[ 0.0% - 0.5% ] 0.066% | 190,868,971 | $52,569 |
[ 0.0% - 0.5% ] 0.33% | 20,073,458 | $54,274 |
[ 0.5% - 1.0% ] 0.58% | 5,638,920 | $54,690 |
[ 0.5% - 1.0% ] 0.82% | 2,555,873 | $55,535 |
[ 1.0% - 1.5% ] 1.08% | 1,257,939 | $51,723 |
[ 1.0% - 1.5% ] 1.29% | 481,224 | $52,828 |
[ 1.5% - 2.0% ] 1.55% | 409,564 | $54,930 |
[ 1.5% - 2.0% ] 1.78% | 203,350 | $56,823 |
[ 2.0% - 2.5% ] 2.04% | 134,861 | $51,770 |
[ 2.0% - 2.5% ] 2.22% | 66,181 | $39,559 |
[ 2.0% - 2.5% ] 2.49% | 49,312 | $84,742 |
[ 2.5% - 3.0% ] 2.74% | 25,136 | $52,151 |
[ 2.5% - 3.0% ] 2.99% | 29,862 | $60,575 |
[ 3.0% - 3.5% ] 3.26% | 27,988 | $60,930 |
[ 3.0% - 3.5% ] 3.45% | 45,984 | $71,981 |
[ 3.5% - 4.0% ] 3.75% | 10,775 | $50,919 |
[ 3.5% - 4.0% ] 3.86% | 4,608 | $50,353 |
[ 4.0% - 4.5% ] 4.19% | 7,782 | $54,442 |
[ 4.0% - 4.5% ] 4.40% | 4,230 | $48,045 |
[ 4.5% - 5.0% ] 4.72% | 25,535 | $50,960 |
[ 4.5% - 5.0% ] 4.88% | 3,748 | $63,281 |
[ 5.0% - 5.5% ] 5.22% | 1,974 | $91,265 |
[ 5.0% - 5.5% ] 5.38% | 186 | $36,000 |
[ 6.0% - 6.5% ] 6.07% | 4,758 | $48,651 |
[ 6.0% - 6.5% ] 6.27% | 1,611 | $15,938 |
[ 6.5% - 7.0% ] 6.65% | 857 | $29,964 |
[ 6.5% - 7.0% ] 6.77% | 1,388 | $48,166 |
[ 7.0% - 7.5% ] 7.27% | 1,211 | $60,938 |
[ 7.0% - 7.5% ] 7.50% | 920 | $47,623 |
[ 8.0% - 8.5% ] 8.29% | 5,262 | $27,757 |
[ 9.0% - 9.5% ] 9.30% | 172 | $55,909 |
[ 9.0% - 9.5% ] 9.34% | 578 | $46,250 |
[ 9.5% - 10.0% ] 9.70% | 402 | $77,333 |
[ 16.0% - 16.5% ] 16.19% | 105 | $73,036 |