South American Self-Care Disability
COMPARE
South American
Select to Compare
Self-Care Disability
South American Self-Care Disability
2.4%
SELF-CARE DISABILITY
93.2/ 100
METRIC RATING
113th/ 347
METRIC RANK
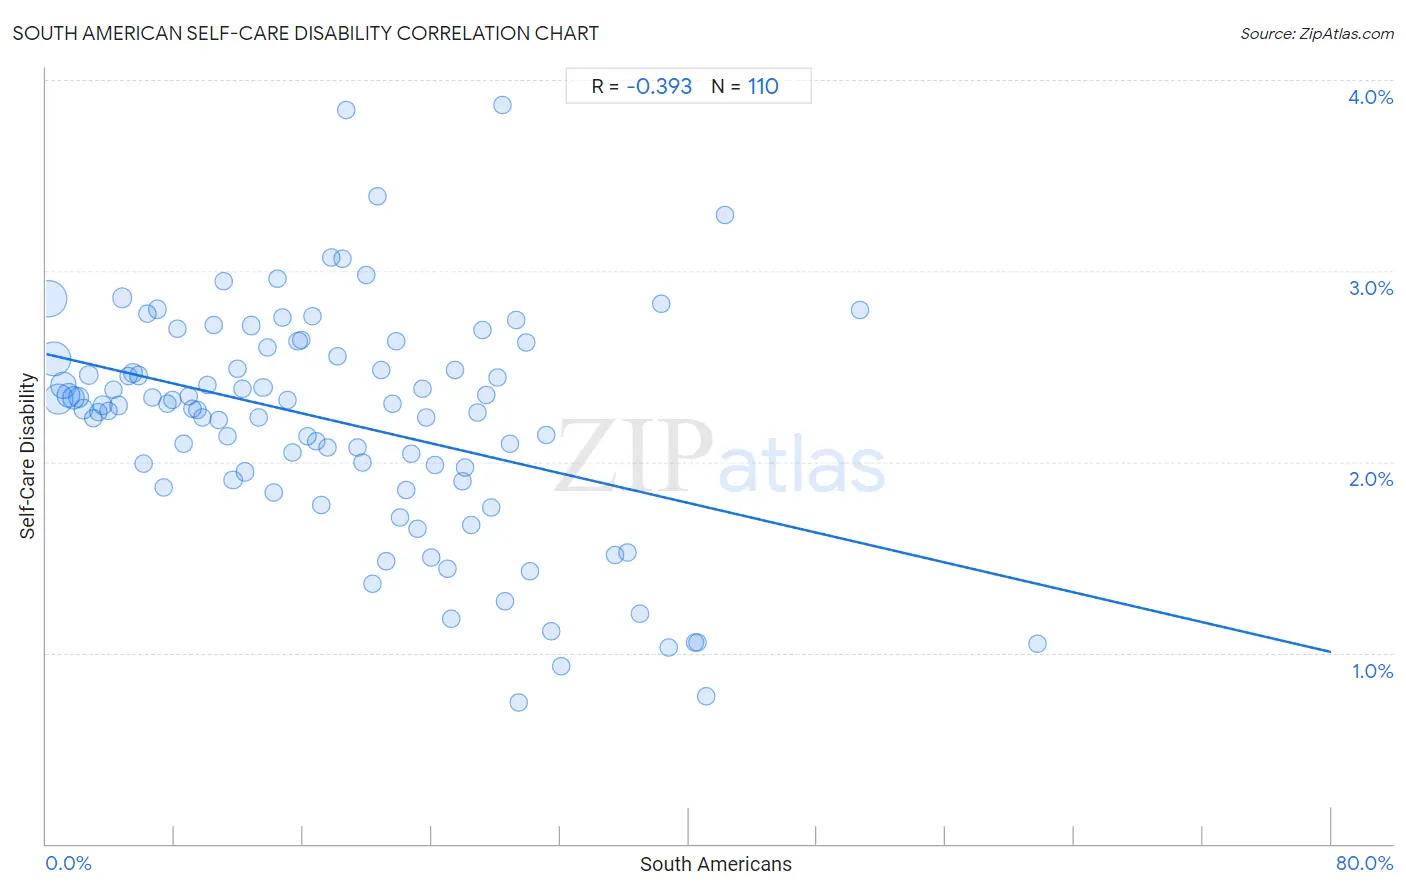
South American Self-Care Disability Correlation Chart
The statistical analysis conducted on geographies consisting of 493,131,874 people shows a mild negative correlation between the proportion of South Americans and percentage of population with self-care disability in the United States with a correlation coefficient (R) of -0.393 and weighted average of 2.4%. On average, for every 1% (one percent) increase in South Americans within a typical geography, there is a decrease of 0.020% in percentage of population with self-care disability.
It is essential to understand that the correlation between the percentage of South Americans and percentage of population with self-care disability does not imply a direct cause-and-effect relationship. It remains uncertain whether the presence of South Americans influences an upward or downward trend in the level of percentage of population with self-care disability within an area, or if South Americans simply ended up residing in those areas with higher or lower levels of percentage of population with self-care disability due to other factors.
Demographics Similar to South Americans by Self-Care Disability
In terms of self-care disability, the demographic groups most similar to South Americans are Immigrants from North Macedonia (2.4%, a difference of 0.0%), Immigrants from Hong Kong (2.4%, a difference of 0.010%), Scandinavian (2.4%, a difference of 0.060%), Northern European (2.4%, a difference of 0.060%), and Serbian (2.4%, a difference of 0.090%).
| Demographics | Rating | Rank | Self-Care Disability |
| Immigrants from Indonesia | 94.3 /100 | #106 | Exceptional 2.4% |
| British | 94.3 /100 | #107 | Exceptional 2.4% |
| Greeks | 94.1 /100 | #108 | Exceptional 2.4% |
| Slovenes | 94.1 /100 | #109 | Exceptional 2.4% |
| Immigrants from Africa | 93.7 /100 | #110 | Exceptional 2.4% |
| Serbians | 93.6 /100 | #111 | Exceptional 2.4% |
| Scandinavians | 93.5 /100 | #112 | Exceptional 2.4% |
| South Americans | 93.2 /100 | #113 | Exceptional 2.4% |
| Immigrants from North Macedonia | 93.1 /100 | #114 | Exceptional 2.4% |
| Immigrants from Hong Kong | 93.1 /100 | #115 | Exceptional 2.4% |
| Northern Europeans | 92.9 /100 | #116 | Exceptional 2.4% |
| Taiwanese | 92.5 /100 | #117 | Exceptional 2.4% |
| Immigrants from Canada | 92.0 /100 | #118 | Exceptional 2.4% |
| Immigrants from Sierra Leone | 91.8 /100 | #119 | Exceptional 2.4% |
| Uruguayans | 91.5 /100 | #120 | Exceptional 2.4% |
South American Self-Care Disability Correlation Summary
| Measurement | South American Data | Self-Care Disability Data |
| Minimum | 0.16% | 0.74% |
| Maximum | 61.7% | 3.9% |
| Range | 61.6% | 3.1% |
| Mean | 18.2% | 2.2% |
| Median | 17.0% | 2.3% |
| Interquartile 25% (IQ1) | 8.5% | 1.9% |
| Interquartile 75% (IQ3) | 26.1% | 2.6% |
| Interquartile Range (IQR) | 17.5% | 0.65% |
| Standard Deviation (Sample) | 12.0% | 0.60% |
| Standard Deviation (Population) | 12.0% | 0.59% |
Correlation Details
| South American Percentile | Sample Size | Self-Care Disability |
[ 0.0% - 0.5% ] 0.16% | 114,291,689 | 2.9% |
[ 0.0% - 0.5% ] 0.46% | 97,120,975 | 2.5% |
[ 0.5% - 1.0% ] 0.76% | 72,253,059 | 2.3% |
[ 1.0% - 1.5% ] 1.08% | 49,553,341 | 2.4% |
[ 1.0% - 1.5% ] 1.39% | 34,095,388 | 2.3% |
[ 1.5% - 2.0% ] 1.70% | 26,161,832 | 2.3% |
[ 2.0% - 2.5% ] 2.01% | 16,215,336 | 2.3% |
[ 2.0% - 2.5% ] 2.30% | 11,485,673 | 2.3% |
[ 2.5% - 3.0% ] 2.62% | 7,266,203 | 2.5% |
[ 2.5% - 3.0% ] 2.94% | 6,024,664 | 2.2% |
[ 3.0% - 3.5% ] 3.24% | 4,678,403 | 2.3% |
[ 3.5% - 4.0% ] 3.54% | 5,159,582 | 2.3% |
[ 3.5% - 4.0% ] 3.87% | 3,824,853 | 2.3% |
[ 4.0% - 4.5% ] 4.18% | 2,935,825 | 2.4% |
[ 4.0% - 4.5% ] 4.49% | 2,486,341 | 2.3% |
[ 4.5% - 5.0% ] 4.75% | 11,214,203 | 2.9% |
[ 5.0% - 5.5% ] 5.12% | 2,534,459 | 2.4% |
[ 5.0% - 5.5% ] 5.40% | 1,721,980 | 2.5% |
[ 5.5% - 6.0% ] 5.72% | 1,892,844 | 2.5% |
[ 6.0% - 6.5% ] 6.03% | 1,517,059 | 2.0% |
[ 6.0% - 6.5% ] 6.32% | 1,134,217 | 2.8% |
[ 6.5% - 7.0% ] 6.63% | 903,510 | 2.3% |
[ 6.5% - 7.0% ] 6.93% | 1,422,624 | 2.8% |
[ 7.0% - 7.5% ] 7.29% | 716,709 | 1.9% |
[ 7.5% - 8.0% ] 7.56% | 851,038 | 2.3% |
[ 7.5% - 8.0% ] 7.87% | 609,820 | 2.3% |
[ 8.0% - 8.5% ] 8.17% | 729,601 | 2.7% |
[ 8.5% - 9.0% ] 8.53% | 771,914 | 2.1% |
[ 8.5% - 9.0% ] 8.85% | 460,827 | 2.3% |
[ 9.0% - 9.5% ] 9.12% | 547,982 | 2.3% |
[ 9.0% - 9.5% ] 9.43% | 764,131 | 2.3% |
[ 9.5% - 10.0% ] 9.71% | 332,098 | 2.2% |
[ 10.0% - 10.5% ] 10.03% | 520,979 | 2.4% |
[ 10.0% - 10.5% ] 10.40% | 322,806 | 2.7% |
[ 10.5% - 11.0% ] 10.71% | 353,797 | 2.2% |
[ 11.0% - 11.5% ] 11.07% | 750,084 | 2.9% |
[ 11.0% - 11.5% ] 11.29% | 201,300 | 2.1% |
[ 11.5% - 12.0% ] 11.63% | 349,117 | 1.9% |
[ 11.5% - 12.0% ] 11.89% | 690,878 | 2.5% |
[ 12.0% - 12.5% ] 12.19% | 156,662 | 2.4% |
[ 12.0% - 12.5% ] 12.41% | 280,842 | 1.9% |
[ 12.5% - 13.0% ] 12.76% | 806,726 | 2.7% |
[ 13.0% - 13.5% ] 13.20% | 406,624 | 2.2% |
[ 13.5% - 14.0% ] 13.50% | 191,017 | 2.4% |
[ 13.5% - 14.0% ] 13.76% | 441,354 | 2.6% |
[ 14.0% - 14.5% ] 14.14% | 325,390 | 1.8% |
[ 14.0% - 14.5% ] 14.42% | 221,127 | 3.0% |
[ 14.5% - 15.0% ] 14.69% | 204,687 | 2.8% |
[ 14.5% - 15.0% ] 14.99% | 234,005 | 2.3% |
[ 15.0% - 15.5% ] 15.33% | 406,294 | 2.0% |
[ 15.5% - 16.0% ] 15.68% | 266,981 | 2.6% |
[ 15.5% - 16.0% ] 15.89% | 187,486 | 2.6% |
[ 16.0% - 16.5% ] 16.26% | 312,081 | 2.1% |
[ 16.5% - 17.0% ] 16.54% | 241,894 | 2.8% |
[ 16.5% - 17.0% ] 16.83% | 150,168 | 2.1% |
[ 17.0% - 17.5% ] 17.14% | 88,938 | 1.8% |
[ 17.5% - 18.0% ] 17.52% | 19,785 | 2.1% |
[ 17.5% - 18.0% ] 17.77% | 240,694 | 3.1% |
[ 18.0% - 18.5% ] 18.10% | 85,976 | 2.6% |
[ 18.0% - 18.5% ] 18.44% | 88,154 | 3.1% |
[ 18.5% - 19.0% ] 18.69% | 40,042 | 3.8% |
[ 19.0% - 19.5% ] 19.39% | 111,443 | 2.1% |
[ 19.5% - 20.0% ] 19.70% | 84,368 | 2.0% |
[ 19.5% - 20.0% ] 19.96% | 147,015 | 3.0% |
[ 20.0% - 20.5% ] 20.33% | 22,724 | 1.4% |
[ 20.5% - 21.0% ] 20.60% | 71,060 | 3.4% |
[ 20.5% - 21.0% ] 20.84% | 158,259 | 2.5% |
[ 21.0% - 21.5% ] 21.17% | 109,134 | 1.5% |
[ 21.5% - 22.0% ] 21.54% | 31,140 | 2.3% |
[ 21.5% - 22.0% ] 21.81% | 240,484 | 2.6% |
[ 22.0% - 22.5% ] 22.04% | 57,533 | 1.7% |
[ 22.0% - 22.5% ] 22.42% | 103,687 | 1.9% |
[ 22.5% - 23.0% ] 22.72% | 10,396 | 2.0% |
[ 23.0% - 23.5% ] 23.10% | 64,260 | 1.7% |
[ 23.0% - 23.5% ] 23.39% | 174,565 | 2.4% |
[ 23.5% - 24.0% ] 23.68% | 230,887 | 2.2% |
[ 23.5% - 24.0% ] 23.96% | 59,843 | 1.5% |
[ 24.0% - 24.5% ] 24.18% | 8,718 | 2.0% |
[ 24.5% - 25.0% ] 24.95% | 20,760 | 1.4% |
[ 25.0% - 25.5% ] 25.23% | 5,164 | 1.2% |
[ 25.0% - 25.5% ] 25.42% | 101,739 | 2.5% |
[ 25.5% - 26.0% ] 25.90% | 35,967 | 1.9% |
[ 26.0% - 26.5% ] 26.05% | 56,757 | 2.0% |
[ 26.0% - 26.5% ] 26.50% | 21,935 | 1.7% |
[ 26.5% - 27.0% ] 26.89% | 89,647 | 2.3% |
[ 27.0% - 27.5% ] 27.16% | 42,956 | 2.7% |
[ 27.0% - 27.5% ] 27.42% | 44,878 | 2.3% |
[ 27.5% - 28.0% ] 27.69% | 89,577 | 1.8% |
[ 28.0% - 28.5% ] 28.08% | 67,001 | 2.4% |
[ 28.0% - 28.5% ] 28.39% | 155 | 3.9% |
[ 28.5% - 29.0% ] 28.57% | 20,971 | 1.3% |
[ 28.5% - 29.0% ] 28.90% | 80,522 | 2.1% |
[ 29.0% - 29.5% ] 29.27% | 26,364 | 2.7% |
[ 29.0% - 29.5% ] 29.41% | 22,540 | 0.74% |
[ 29.5% - 30.0% ] 29.84% | 112,750 | 2.6% |
[ 30.0% - 30.5% ] 30.10% | 23,734 | 1.4% |
[ 31.0% - 31.5% ] 31.13% | 11,069 | 2.1% |
[ 31.0% - 31.5% ] 31.40% | 15,184 | 1.1% |
[ 32.0% - 32.5% ] 32.05% | 2,811 | 0.93% |
[ 35.0% - 35.5% ] 35.42% | 68,029 | 1.5% |
[ 36.0% - 36.5% ] 36.16% | 31,514 | 1.5% |
[ 36.5% - 37.0% ] 36.95% | 249 | 1.2% |
[ 38.0% - 38.5% ] 38.27% | 4,656 | 2.8% |
[ 38.5% - 39.0% ] 38.73% | 1,761 | 1.0% |
[ 40.0% - 40.5% ] 40.36% | 14,639 | 1.1% |
[ 40.5% - 41.0% ] 40.54% | 14,572 | 1.1% |
[ 41.0% - 41.5% ] 41.13% | 5,843 | 0.77% |
[ 42.0% - 42.5% ] 42.26% | 6,186 | 3.3% |
[ 50.5% - 51.0% ] 50.63% | 2,718 | 2.8% |
[ 61.5% - 62.0% ] 61.73% | 139,642 | 1.1% |