Taiwanese Self-Care Disability

COMPARE

Taiwanese
Race
Ancestry
AfghanAfricanAlaska NativeAlaskan AthabascanAlbanianAleutAlsatianAmericanApacheArabArapahoArgentineanArmenianAssyrian/Chaldean/SyriacAustralianAustrianBahamianBangladeshiBarbadianBasqueBelgianBelizeanBermudanBhutaneseBlackfeetBolivianBrazilianBritishBritish West IndianBulgarianBurmeseCajunCambodianCanadianCape VerdeanCarpatho RusynCelticCentral AmericanCentral American IndianCherokeeCheyenneChickasawChileanChineseChippewaChoctawColombianColvilleComancheCosta RicanCreeCreekCroatianCrowCubanCypriotCzechCzechoslovakianDanishDelawareDominicanDutchDutch West IndianEastern EuropeanEcuadorianEgyptianEnglishEstonianEthiopianEuropeanFijianFilipinoFinnishFrenchFrench American IndianFrench CanadianGermanGerman RussianGhanaianGreekGuamanian/ChamorroGuatemalanGuyaneseHaitianHmongHonduranHopiHoumaHungarianIcelanderIndian (Asian)IndonesianInupiatIranianIraqiIrishIroquoisIsraeliItalianJamaicanJapaneseJordanianKenyanKiowaKoreanLaotianLatvianLebaneseLiberianLithuanianLumbeeLuxembourgerMacedonianMalaysianMalteseMarshalleseMenomineeMexicanMexican American IndianMongolianMoroccanNative HawaiianNavajoNepaleseNew ZealanderNicaraguanNigerianNorthern EuropeanNorwegianOkinawanOsageOttawaPaiutePakistaniPalestinianPanamanianParaguayanPennsylvania GermanPeruvianPimaPolishPortuguesePotawatomiPuebloPuerto RicanPuget Sound SalishRomanianRussianSalvadoranSamoanScandinavianScotch-IrishScottishSeminoleSenegaleseSerbianShoshoneSierra LeoneanSiouxSlavicSlovakSloveneSomaliSouth AfricanSouth AmericanSouth American IndianSoviet UnionSpaniardSpanishSpanish AmericanSpanish American IndianSri LankanSubsaharan AfricanSudaneseSwedishSwissSyrianTaiwaneseThaiTlingit-HaidaTohono O'OdhamTonganTrinidadian and TobagonianTsimshianTurkishU.S. Virgin IslanderUgandanUkrainianUruguayanUteVenezuelanVietnameseWelshWest IndianYakamaYaquiYugoslavianYumanYup'ikZimbabwean
Immigration
NonimmigrantsImmigrantsAfghanistanAfricaAlbaniaArgentinaArmeniaAsiaAustraliaAustriaBahamasBangladeshBarbadosBelarusBelgiumBelizeBoliviaBosnia and HerzegovinaBrazilBulgariaBurma/MyanmarCabo VerdeCambodiaCameroonCanadaCaribbeanCentral AmericaChileChinaColombiaCongoCosta RicaCroatiaCubaCzechoslovakiaDenmarkDominicaDominican RepublicEastern AfricaEastern AsiaEastern EuropeEcuadorEgyptEl SalvadorEnglandEritreaEthiopiaEuropeFijiFranceGermanyGhanaGreeceGrenadaGuatemalaGuyanaHaitiHondurasHong KongHungaryIndiaIndonesiaIranIraqIrelandIsraelItalyJamaicaJapanJordanKazakhstanKenyaKoreaKuwaitLaosLatin AmericaLatviaLebanonLiberiaLithuaniaMalaysiaMexicoMicronesiaMiddle AfricaMoldovaMoroccoNepalNetherlandsNicaraguaNigeriaNorth AmericaNorth MacedoniaNorthern AfricaNorthern EuropeNorwayOceaniaPakistanPanamaPeruPhilippinesPolandPortugalRomaniaRussiaSaudi ArabiaScotlandSenegalSerbiaSierra LeoneSingaporeSomaliaSouth AfricaSouth AmericaSouth Central AsiaSouth Eastern AsiaSouthern EuropeSpainSri LankaSt. Vincent and the GrenadinesSudanSwedenSwitzerlandSyriaTaiwanThailandTrinidad and TobagoTurkeyUgandaUkraineUruguayUzbekistanVenezuelaVietnamWest IndiesWestern AfricaWestern AsiaWestern EuropeYemenZaireZimbabweAzores
Select to Compare
Race
Ancestry
AfghanAfricanAlaska NativeAlaskan AthabascanAlbanianAleutAlsatianAmericanApacheArabArapahoArgentineanArmenianAssyrian/Chaldean/SyriacAustralianAustrianBahamianBangladeshiBarbadianBasqueBelgianBelizeanBermudanBhutaneseBlackfeetBolivianBrazilianBritishBritish West IndianBulgarianBurmeseCajunCambodianCanadianCape VerdeanCarpatho RusynCelticCentral AmericanCentral American IndianCherokeeCheyenneChickasawChileanChineseChippewaChoctawColombianColvilleComancheCosta RicanCreeCreekCroatianCrowCubanCypriotCzechCzechoslovakianDanishDelawareDominicanDutchDutch West IndianEastern EuropeanEcuadorianEgyptianEnglishEstonianEthiopianEuropeanFijianFilipinoFinnishFrenchFrench American IndianFrench CanadianGermanGerman RussianGhanaianGreekGuamanian/ChamorroGuatemalanGuyaneseHaitianHmongHonduranHopiHoumaHungarianIcelanderIndian (Asian)IndonesianInupiatIranianIraqiIrishIroquoisIsraeliItalianJamaicanJapaneseJordanianKenyanKiowaKoreanLaotianLatvianLebaneseLiberianLithuanianLumbeeLuxembourgerMacedonianMalaysianMalteseMarshalleseMenomineeMexicanMexican American IndianMongolianMoroccanNative HawaiianNavajoNepaleseNew ZealanderNicaraguanNigerianNorthern EuropeanNorwegianOkinawanOsageOttawaPaiutePakistaniPalestinianPanamanianParaguayanPennsylvania GermanPeruvianPimaPolishPortuguesePotawatomiPuebloPuerto RicanPuget Sound SalishRomanianRussianSalvadoranSamoanScandinavianScotch-IrishScottishSeminoleSenegaleseSerbianShoshoneSierra LeoneanSiouxSlavicSlovakSloveneSomaliSouth AfricanSouth AmericanSouth American IndianSoviet UnionSpaniardSpanishSpanish AmericanSpanish American IndianSri LankanSubsaharan AfricanSudaneseSwedishSwissSyrianThaiTlingit-HaidaTohono O'OdhamTonganTrinidadian and TobagonianTsimshianTurkishU.S. Virgin IslanderUgandanUkrainianUruguayanUteVenezuelanVietnameseWelshWest IndianYakamaYaquiYugoslavianYumanYup'ikZimbabwean
Immigration
NonimmigrantsImmigrantsAfghanistanAfricaAlbaniaArgentinaArmeniaAsiaAustraliaAustriaBahamasBangladeshBarbadosBelarusBelgiumBelizeBoliviaBosnia and HerzegovinaBrazilBulgariaBurma/MyanmarCabo VerdeCambodiaCameroonCanadaCaribbeanCentral AmericaChileChinaColombiaCongoCosta RicaCroatiaCubaCzechoslovakiaDenmarkDominicaDominican RepublicEastern AfricaEastern AsiaEastern EuropeEcuadorEgyptEl SalvadorEnglandEritreaEthiopiaEuropeFijiFranceGermanyGhanaGreeceGrenadaGuatemalaGuyanaHaitiHondurasHong KongHungaryIndiaIndonesiaIranIraqIrelandIsraelItalyJamaicaJapanJordanKazakhstanKenyaKoreaKuwaitLaosLatin AmericaLatviaLebanonLiberiaLithuaniaMalaysiaMexicoMicronesiaMiddle AfricaMoldovaMoroccoNepalNetherlandsNicaraguaNigeriaNorth AmericaNorth MacedoniaNorthern AfricaNorthern EuropeNorwayOceaniaPakistanPanamaPeruPhilippinesPolandPortugalRomaniaRussiaSaudi ArabiaScotlandSenegalSerbiaSierra LeoneSingaporeSomaliaSouth AfricaSouth AmericaSouth Central AsiaSouth Eastern AsiaSouthern EuropeSpainSri LankaSt. Vincent and the GrenadinesSudanSwedenSwitzerlandSyriaTaiwanThailandTrinidad and TobagoTurkeyUgandaUkraineUruguayUzbekistanVenezuelaVietnamWest IndiesWestern AfricaWestern AsiaWestern EuropeYemenZaireZimbabweAzores
Self-Care Disability
Income
Poverty
Unemployment
Labor Participation
Family Structure
Vehicle Availability
Education Level
Disability

Taiwanese Self-Care Disability
Exceptional

2.4%
SELF-CARE DISABILITY
92.5/ 100
METRIC RATING
117th/ 347
METRIC RANK

Taiwanese Self-Care Disability Correlation Chart

The statistical analysis conducted on geographies consisting of 31,709,765 people shows a substantial positive correlation between the proportion of Taiwanese and percentage of population with self-care disability in the United States with a correlation coefficient (R) of 0.564 and weighted average of 2.4%. On average, for every 1% (one percent) increase in Taiwanese within a typical geography, there is an increase of 1.4% in percentage of population with self-care disability.
Taiwanese Self-Care Disability
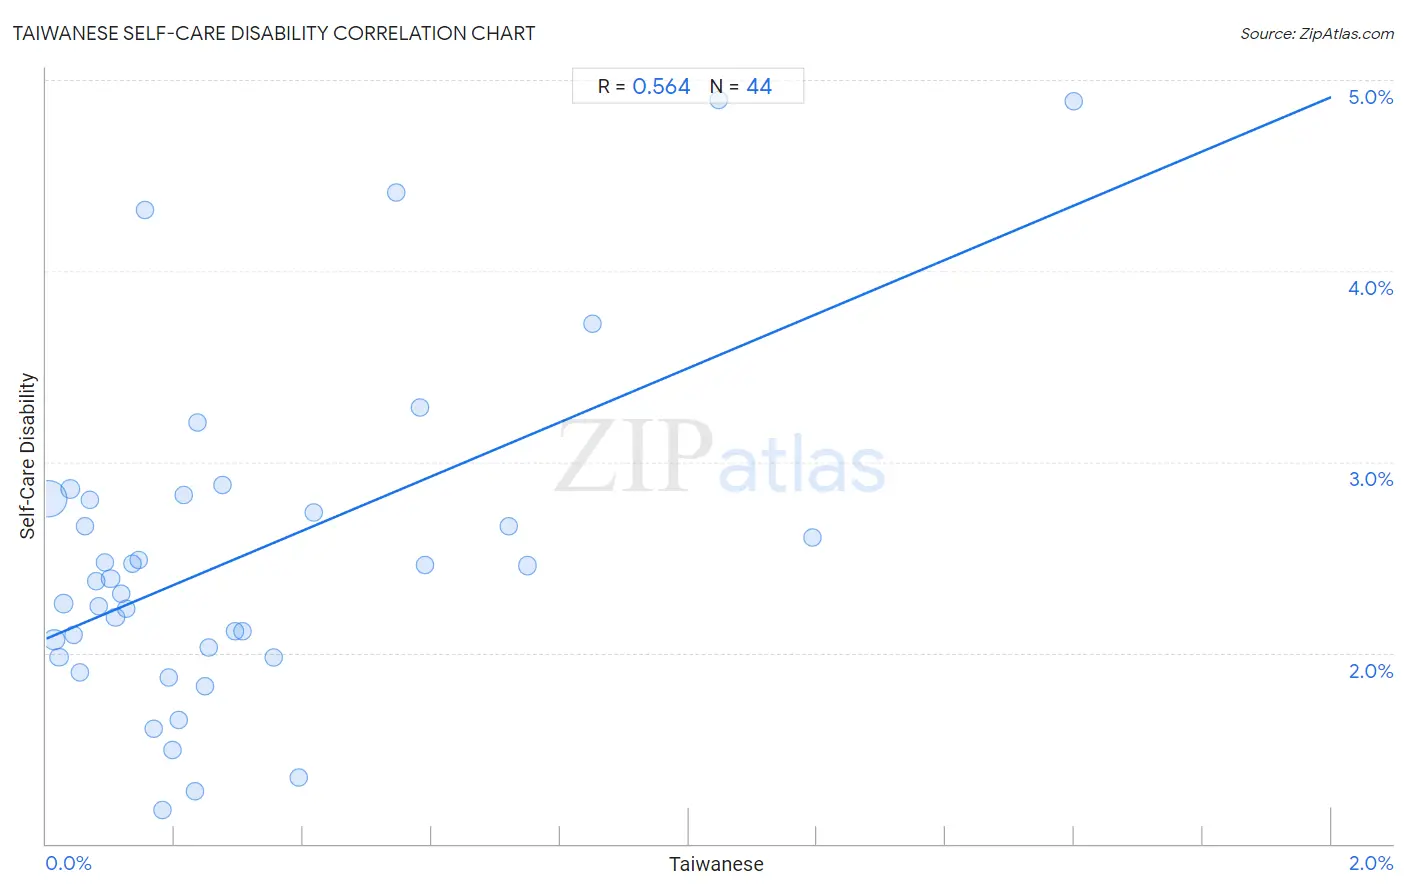
It is essential to understand that the correlation between the percentage of Taiwanese and percentage of population with self-care disability does not imply a direct cause-and-effect relationship. It remains uncertain whether the presence of Taiwanese influences an upward or downward trend in the level of percentage of population with self-care disability within an area, or if Taiwanese simply ended up residing in those areas with higher or lower levels of percentage of population with self-care disability due to other factors.

Demographics Similar to Taiwanese by Self-Care Disability

In terms of self-care disability, the demographic groups most similar to Taiwanese are Northern European (2.4%, a difference of 0.060%), Immigrants from Canada (2.4%, a difference of 0.090%), South American (2.4%, a difference of 0.12%), Immigrants from North Macedonia (2.4%, a difference of 0.12%), and Immigrants from Hong Kong (2.4%, a difference of 0.12%).
DemographicsRating | RankSelf-Care Disability
Immigrants from Africa
93.7
/100
|
#110
Exceptional
2.4%
Serbians
93.6
/100
|
#111
Exceptional
2.4%
Scandinavians
93.5
/100
|
#112
Exceptional
2.4%
South Americans
93.2
/100
|
#113
Exceptional
2.4%
Immigrants from North Macedonia
93.1
/100
|
#114
Exceptional
2.4%
Immigrants from Hong Kong
93.1
/100
|
#115
Exceptional
2.4%
Northern Europeans
92.9
/100
|
#116
Exceptional
2.4%
Taiwanese
92.5
/100
|
#117
Exceptional
2.4%
Immigrants from Canada
92.0
/100
|
#118
Exceptional
2.4%
Immigrants from Sierra Leone
91.8
/100
|
#119
Exceptional
2.4%
Uruguayans
91.5
/100
|
#120
Exceptional
2.4%
Peruvians
91.3
/100
|
#121
Exceptional
2.4%
Belgians
90.9
/100
|
#122
Exceptional
2.4%
Immigrants from Nigeria
90.3
/100
|
#123
Exceptional
2.4%
Immigrants from North America
90.2
/100
|
#124
Exceptional
2.4%
Immigrants from Morocco
90.2
/100
|
#124
Exceptional
2.4%

Taiwanese Self-Care Disability Correlation Summary

MeasurementTaiwanese DataSelf-Care Disability Data
Minimum0.0036%1.2%
Maximum1.6%4.9%
Range1.6%3.7%
Mean0.31%2.5%
Median0.19%2.4%
Interquartile 25% (IQ1)0.087%2.0%
Interquartile 75% (IQ3)0.37%2.8%
Interquartile Range (IQR)0.29%0.80%
Standard Deviation (Sample)0.34%0.86%
Standard Deviation (Population)0.34%0.85%

Correlation Details

Taiwanese PercentileSample SizeSelf-Care Disability
[
0.0%
-
0.5%
]
0.0036%
22,155,7832.8%
[
0.0%
-
0.5%
]
0.012%
3,425,7562.1%
[
0.0%
-
0.5%
]
0.020%
720,5192.0%
[
0.0%
-
0.5%
]
0.027%
1,852,2072.3%
[
0.0%
-
0.5%
]
0.037%
874,9992.9%
[
0.0%
-
0.5%
]
0.043%
240,2642.1%
[
0.0%
-
0.5%
]
0.052%
257,6101.9%
[
0.0%
-
0.5%
]
0.060%
80,6432.7%
[
0.0%
-
0.5%
]
0.068%
303,3512.8%
[
0.0%
-
0.5%
]
0.077%
135,5502.4%
[
0.0%
-
0.5%
]
0.082%
93,6882.2%
[
0.0%
-
0.5%
]
0.091%
204,0482.5%
[
0.0%
-
0.5%
]
0.10%
93,9172.4%
[
0.0%
-
0.5%
]
0.11%
335,5102.2%
[
0.0%
-
0.5%
]
0.12%
66,6582.3%
[
0.0%
-
0.5%
]
0.12%
32,8832.2%
[
0.0%
-
0.5%
]
0.13%
85,5252.5%
[
0.0%
-
0.5%
]
0.14%
47,5492.5%
[
0.0%
-
0.5%
]
0.15%
33,8904.3%
[
0.0%
-
0.5%
]
0.17%
33,2971.6%
[
0.0%
-
0.5%
]
0.18%
71,6791.2%
[
0.0%
-
0.5%
]
0.19%
63,4221.9%
[
0.0%
-
0.5%
]
0.20%
36,8061.5%
[
0.0%
-
0.5%
]
0.21%
61,7571.6%
[
0.0%
-
0.5%
]
0.21%
17,8082.8%
[
0.0%
-
0.5%
]
0.23%
37,2981.3%
[
0.0%
-
0.5%
]
0.23%
21,7123.2%
[
0.0%
-
0.5%
]
0.25%
40,0641.8%
[
0.0%
-
0.5%
]
0.25%
30,5092.0%
[
0.0%
-
0.5%
]
0.28%
18,5362.9%
[
0.0%
-
0.5%
]
0.29%
7,4712.1%
[
0.0%
-
0.5%
]
0.31%
6542.1%
[
0.0%
-
0.5%
]
0.35%
83,4012.0%
[
0.0%
-
0.5%
]
0.39%
7,6261.3%
[
0.0%
-
0.5%
]
0.42%
32,6652.7%
[
0.5%
-
1.0%
]
0.54%
1,4714.4%
[
0.5%
-
1.0%
]
0.58%
23,6893.3%
[
0.5%
-
1.0%
]
0.59%
3,0512.5%
[
0.5%
-
1.0%
]
0.72%
2782.7%
[
0.5%
-
1.0%
]
0.75%
66,2492.5%
[
0.5%
-
1.0%
]
0.85%
4703.7%
[
1.0%
-
1.5%
]
1.05%
4,4874.9%
[
1.0%
-
1.5%
]
1.19%
2,5152.6%
[
1.5%
-
2.0%
]
1.60%
2,5004.9%