Immigrants from Israel Self-Care Disability
COMPARE
Immigrants from Israel
Select to Compare
Self-Care Disability
Immigrants from Israel Self-Care Disability
2.4%
SELF-CARE DISABILITY
96.1/ 100
METRIC RATING
99th/ 347
METRIC RANK
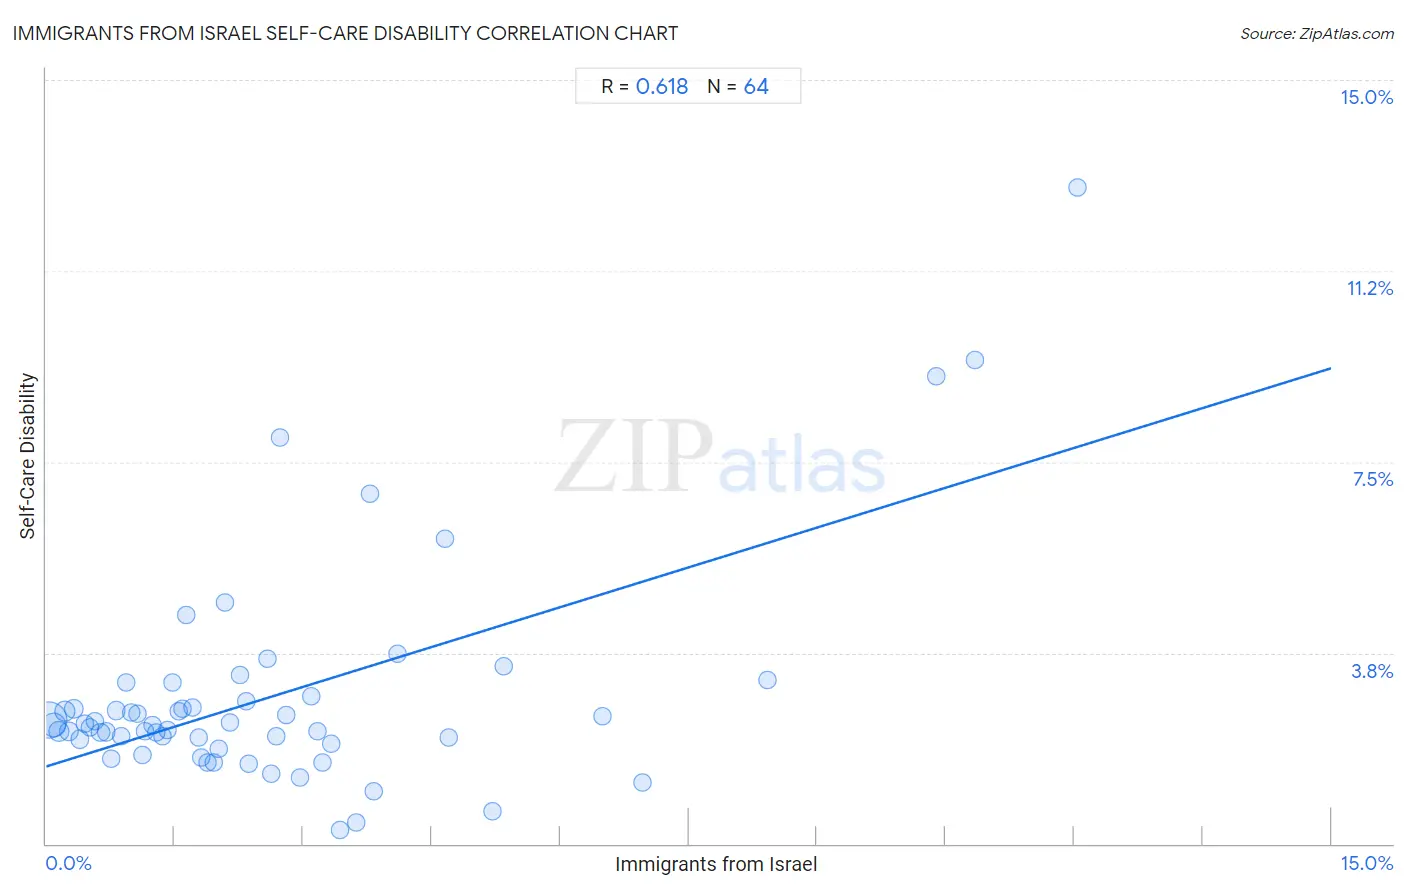
Immigrants from Israel Self-Care Disability Correlation Chart
The statistical analysis conducted on geographies consisting of 209,935,200 people shows a significant positive correlation between the proportion of Immigrants from Israel and percentage of population with self-care disability in the United States with a correlation coefficient (R) of 0.618 and weighted average of 2.4%. On average, for every 1% (one percent) increase in Immigrants from Israel within a typical geography, there is an increase of 0.52% in percentage of population with self-care disability.
It is essential to understand that the correlation between the percentage of Immigrants from Israel and percentage of population with self-care disability does not imply a direct cause-and-effect relationship. It remains uncertain whether the presence of Immigrants from Israel influences an upward or downward trend in the level of percentage of population with self-care disability within an area, or if Immigrants from Israel simply ended up residing in those areas with higher or lower levels of percentage of population with self-care disability due to other factors.
Demographics Similar to Immigrants from Israel by Self-Care Disability
In terms of self-care disability, the demographic groups most similar to Immigrants from Israel are Immigrants from Poland (2.4%, a difference of 0.080%), European (2.4%, a difference of 0.10%), Immigrants from Scotland (2.4%, a difference of 0.15%), Swiss (2.4%, a difference of 0.17%), and Immigrants from Chile (2.4%, a difference of 0.21%).
| Demographics | Rating | Rank | Self-Care Disability |
| Icelanders | 97.4 /100 | #92 | Exceptional 2.4% |
| Immigrants from Latvia | 97.0 /100 | #93 | Exceptional 2.4% |
| Macedonians | 96.9 /100 | #94 | Exceptional 2.4% |
| Immigrants from Asia | 96.9 /100 | #95 | Exceptional 2.4% |
| Immigrants from Chile | 96.7 /100 | #96 | Exceptional 2.4% |
| Swiss | 96.6 /100 | #97 | Exceptional 2.4% |
| Immigrants from Poland | 96.4 /100 | #98 | Exceptional 2.4% |
| Immigrants from Israel | 96.1 /100 | #99 | Exceptional 2.4% |
| Europeans | 95.8 /100 | #100 | Exceptional 2.4% |
| Immigrants from Scotland | 95.7 /100 | #101 | Exceptional 2.4% |
| Croatians | 95.0 /100 | #102 | Exceptional 2.4% |
| Alsatians | 94.9 /100 | #103 | Exceptional 2.4% |
| Bhutanese | 94.5 /100 | #104 | Exceptional 2.4% |
| Carpatho Rusyns | 94.4 /100 | #105 | Exceptional 2.4% |
| Immigrants from Indonesia | 94.3 /100 | #106 | Exceptional 2.4% |
Immigrants from Israel Self-Care Disability Correlation Summary
| Measurement | Immigrants from Israel Data | Self-Care Disability Data |
| Minimum | 0.027% | 0.28% |
| Maximum | 12.0% | 12.9% |
| Range | 12.0% | 12.6% |
| Mean | 2.6% | 2.9% |
| Median | 1.9% | 2.3% |
| Interquartile 25% (IQ1) | 0.97% | 2.0% |
| Interquartile 75% (IQ3) | 3.3% | 2.8% |
| Interquartile Range (IQR) | 2.3% | 0.83% |
| Standard Deviation (Sample) | 2.6% | 2.2% |
| Standard Deviation (Population) | 2.5% | 2.1% |
Correlation Details
| Immigrants from Israel Percentile | Sample Size | Self-Care Disability |
[ 0.0% - 0.5% ] 0.027% | 115,562,536 | 2.4% |
[ 0.0% - 0.5% ] 0.087% | 38,219,744 | 2.3% |
[ 0.0% - 0.5% ] 0.15% | 13,701,505 | 2.2% |
[ 0.0% - 0.5% ] 0.22% | 16,542,499 | 2.6% |
[ 0.0% - 0.5% ] 0.27% | 6,121,913 | 2.2% |
[ 0.0% - 0.5% ] 0.32% | 7,152,291 | 2.7% |
[ 0.0% - 0.5% ] 0.39% | 2,280,717 | 2.1% |
[ 0.0% - 0.5% ] 0.45% | 1,609,827 | 2.4% |
[ 0.5% - 1.0% ] 0.51% | 1,376,649 | 2.3% |
[ 0.5% - 1.0% ] 0.57% | 823,839 | 2.4% |
[ 0.5% - 1.0% ] 0.63% | 950,328 | 2.2% |
[ 0.5% - 1.0% ] 0.70% | 601,376 | 2.2% |
[ 0.5% - 1.0% ] 0.76% | 645,270 | 1.7% |
[ 0.5% - 1.0% ] 0.81% | 479,781 | 2.6% |
[ 0.5% - 1.0% ] 0.87% | 630,807 | 2.1% |
[ 0.5% - 1.0% ] 0.94% | 652,056 | 3.2% |
[ 0.5% - 1.0% ] 1.00% | 218,851 | 2.6% |
[ 1.0% - 1.5% ] 1.06% | 260,244 | 2.6% |
[ 1.0% - 1.5% ] 1.12% | 346,940 | 1.8% |
[ 1.0% - 1.5% ] 1.15% | 186,632 | 2.2% |
[ 1.0% - 1.5% ] 1.24% | 112,624 | 2.3% |
[ 1.0% - 1.5% ] 1.28% | 149,842 | 2.2% |
[ 1.0% - 1.5% ] 1.36% | 88,001 | 2.1% |
[ 1.0% - 1.5% ] 1.41% | 100,014 | 2.2% |
[ 1.0% - 1.5% ] 1.47% | 40,173 | 3.2% |
[ 1.5% - 2.0% ] 1.55% | 87,458 | 2.6% |
[ 1.5% - 2.0% ] 1.59% | 113,181 | 2.7% |
[ 1.5% - 2.0% ] 1.63% | 1,350 | 4.5% |
[ 1.5% - 2.0% ] 1.71% | 49,604 | 2.7% |
[ 1.5% - 2.0% ] 1.78% | 121,872 | 2.1% |
[ 1.5% - 2.0% ] 1.81% | 81,463 | 1.7% |
[ 1.5% - 2.0% ] 1.89% | 5,558 | 1.6% |
[ 1.5% - 2.0% ] 1.95% | 59,070 | 1.6% |
[ 2.0% - 2.5% ] 2.01% | 1,445 | 1.9% |
[ 2.0% - 2.5% ] 2.08% | 6,244 | 4.7% |
[ 2.0% - 2.5% ] 2.14% | 57,239 | 2.4% |
[ 2.0% - 2.5% ] 2.27% | 56,391 | 3.3% |
[ 2.0% - 2.5% ] 2.34% | 13,401 | 2.8% |
[ 2.0% - 2.5% ] 2.37% | 18,693 | 1.6% |
[ 2.5% - 3.0% ] 2.58% | 16,190 | 3.6% |
[ 2.5% - 3.0% ] 2.62% | 62,698 | 1.4% |
[ 2.5% - 3.0% ] 2.69% | 73,051 | 2.1% |
[ 2.5% - 3.0% ] 2.73% | 1,136 | 8.0% |
[ 2.5% - 3.0% ] 2.81% | 39,621 | 2.5% |
[ 2.5% - 3.0% ] 2.96% | 3,818 | 1.3% |
[ 3.0% - 3.5% ] 3.09% | 6,764 | 2.9% |
[ 3.0% - 3.5% ] 3.17% | 42,155 | 2.2% |
[ 3.0% - 3.5% ] 3.23% | 31,910 | 1.6% |
[ 3.0% - 3.5% ] 3.33% | 32,881 | 2.0% |
[ 3.0% - 3.5% ] 3.43% | 962 | 0.28% |
[ 3.5% - 4.0% ] 3.62% | 5,470 | 0.43% |
[ 3.5% - 4.0% ] 3.77% | 106 | 6.9% |
[ 3.5% - 4.0% ] 3.82% | 2,750 | 1.0% |
[ 4.0% - 4.5% ] 4.10% | 20,411 | 3.7% |
[ 4.5% - 5.0% ] 4.66% | 1,438 | 6.0% |
[ 4.5% - 5.0% ] 4.70% | 31,517 | 2.1% |
[ 5.0% - 5.5% ] 5.20% | 3,440 | 0.63% |
[ 5.0% - 5.5% ] 5.35% | 1,066 | 3.5% |
[ 6.0% - 6.5% ] 6.49% | 18,210 | 2.5% |
[ 6.5% - 7.0% ] 6.96% | 9,860 | 1.2% |
[ 8.0% - 8.5% ] 8.42% | 1,366 | 3.2% |
[ 10.0% - 10.5% ] 10.39% | 308 | 9.2% |
[ 10.5% - 11.0% ] 10.85% | 295 | 9.5% |
[ 12.0% - 12.5% ] 12.03% | 349 | 12.9% |