Guamanian/Chamorro College, 1 year or more
COMPARE
Guamanian/Chamorro
Select to Compare
College, 1 year or more
Guamanian/Chamorro College, 1 year or more
58.6%
COLLEGE, 1 YEAR OR MORE
26.2/ 100
METRIC RATING
196th/ 347
METRIC RANK
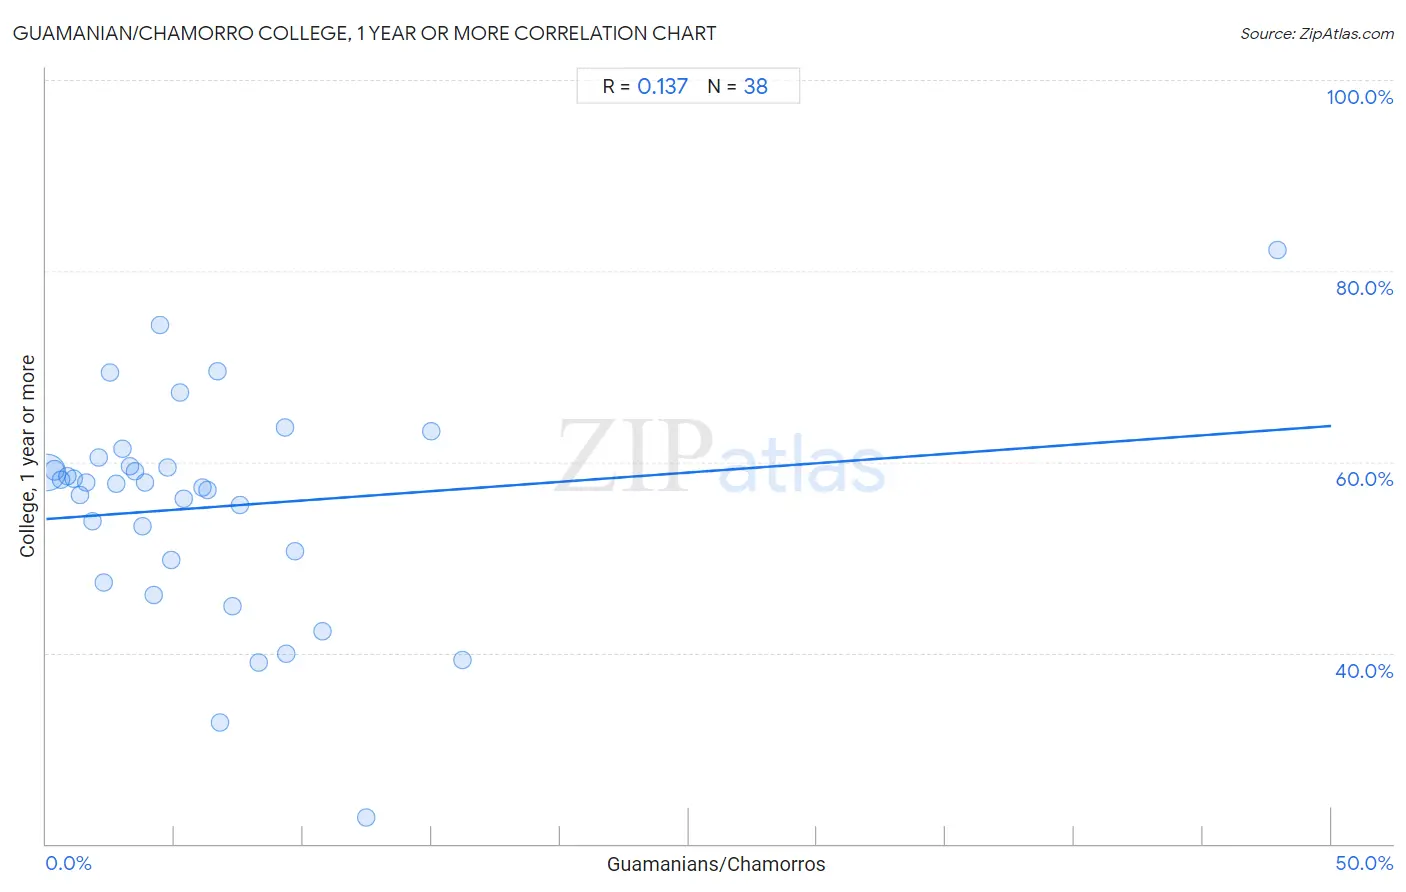
Guamanian/Chamorro College, 1 year or more Correlation Chart
The statistical analysis conducted on geographies consisting of 221,965,751 people shows a poor positive correlation between the proportion of Guamanians/Chamorros and percentage of population with at least college, 1 year or more education in the United States with a correlation coefficient (R) of 0.137 and weighted average of 58.6%. On average, for every 1% (one percent) increase in Guamanians/Chamorros within a typical geography, there is an increase of 0.20% in percentage of population with at least college, 1 year or more education.
It is essential to understand that the correlation between the percentage of Guamanians/Chamorros and percentage of population with at least college, 1 year or more education does not imply a direct cause-and-effect relationship. It remains uncertain whether the presence of Guamanians/Chamorros influences an upward or downward trend in the level of percentage of population with at least college, 1 year or more education within an area, or if Guamanians/Chamorros simply ended up residing in those areas with higher or lower levels of percentage of population with at least college, 1 year or more education due to other factors.
Demographics Similar to Guamanians/Chamorros by College, 1 year or more
In terms of college, 1 year or more, the demographic groups most similar to Guamanians/Chamorros are Dutch (58.6%, a difference of 0.0%), Immigrants from Thailand (58.6%, a difference of 0.010%), Costa Rican (58.6%, a difference of 0.020%), Immigrants from South Eastern Asia (58.5%, a difference of 0.080%), and Peruvian (58.6%, a difference of 0.090%).
| Demographics | Rating | Rank | College, 1 year or more |
| Uruguayans | 31.8 /100 | #189 | Fair 58.8% |
| Immigrants from Cameroon | 31.2 /100 | #190 | Fair 58.8% |
| Immigrants from Philippines | 29.2 /100 | #191 | Fair 58.7% |
| Colombians | 27.6 /100 | #192 | Fair 58.7% |
| Peruvians | 27.5 /100 | #193 | Fair 58.6% |
| Costa Ricans | 26.4 /100 | #194 | Fair 58.6% |
| Dutch | 26.2 /100 | #195 | Fair 58.6% |
| Guamanians/Chamorros | 26.2 /100 | #196 | Fair 58.6% |
| Immigrants from Thailand | 26.0 /100 | #197 | Fair 58.6% |
| Immigrants from South Eastern Asia | 25.1 /100 | #198 | Fair 58.5% |
| Slovaks | 24.6 /100 | #199 | Fair 58.5% |
| Spanish | 24.2 /100 | #200 | Fair 58.5% |
| Nigerians | 23.0 /100 | #201 | Fair 58.5% |
| Immigrants from South America | 21.9 /100 | #202 | Fair 58.4% |
| Ghanaians | 20.9 /100 | #203 | Fair 58.4% |
Guamanian/Chamorro College, 1 year or more Correlation Summary
| Measurement | Guamanian/Chamorro Data | College, 1 year or more Data |
| Minimum | 0.066% | 22.8% |
| Maximum | 47.9% | 82.3% |
| Range | 47.8% | 59.5% |
| Mean | 6.4% | 55.2% |
| Median | 4.6% | 57.7% |
| Interquartile 25% (IQ1) | 2.2% | 49.7% |
| Interquartile 75% (IQ3) | 7.5% | 59.5% |
| Interquartile Range (IQR) | 5.3% | 9.9% |
| Standard Deviation (Sample) | 8.0% | 11.3% |
| Standard Deviation (Population) | 7.9% | 11.2% |
Correlation Details
| Guamanian/Chamorro Percentile | Sample Size | College, 1 year or more |
[ 0.0% - 0.5% ] 0.066% | 190,874,624 | 58.9% |
[ 0.0% - 0.5% ] 0.33% | 20,076,615 | 59.1% |
[ 0.5% - 1.0% ] 0.58% | 5,638,920 | 58.1% |
[ 0.5% - 1.0% ] 0.82% | 2,559,515 | 58.5% |
[ 1.0% - 1.5% ] 1.08% | 1,257,939 | 58.2% |
[ 1.0% - 1.5% ] 1.29% | 482,955 | 56.5% |
[ 1.5% - 2.0% ] 1.54% | 411,419 | 57.8% |
[ 1.5% - 2.0% ] 1.78% | 203,350 | 53.7% |
[ 2.0% - 2.5% ] 2.04% | 135,642 | 60.5% |
[ 2.0% - 2.5% ] 2.22% | 66,564 | 47.4% |
[ 2.0% - 2.5% ] 2.49% | 49,703 | 69.3% |
[ 2.5% - 3.0% ] 2.74% | 25,519 | 57.7% |
[ 2.5% - 3.0% ] 2.99% | 30,241 | 61.4% |
[ 3.0% - 3.5% ] 3.26% | 27,988 | 59.5% |
[ 3.0% - 3.5% ] 3.45% | 45,984 | 59.1% |
[ 3.5% - 4.0% ] 3.75% | 10,775 | 53.3% |
[ 3.5% - 4.0% ] 3.86% | 4,608 | 57.8% |
[ 4.0% - 4.5% ] 4.19% | 7,782 | 46.0% |
[ 4.0% - 4.5% ] 4.40% | 5,199 | 74.3% |
[ 4.5% - 5.0% ] 4.72% | 25,535 | 59.4% |
[ 4.5% - 5.0% ] 4.88% | 3,748 | 49.7% |
[ 5.0% - 5.5% ] 5.22% | 1,974 | 67.3% |
[ 5.0% - 5.5% ] 5.36% | 261 | 56.1% |
[ 6.0% - 6.5% ] 6.07% | 4,758 | 57.3% |
[ 6.0% - 6.5% ] 6.27% | 1,642 | 57.0% |
[ 6.5% - 7.0% ] 6.65% | 857 | 69.5% |
[ 6.5% - 7.0% ] 6.77% | 1,388 | 32.7% |
[ 7.0% - 7.5% ] 7.27% | 1,211 | 44.9% |
[ 7.5% - 8.0% ] 7.55% | 1,669 | 55.5% |
[ 8.0% - 8.5% ] 8.29% | 5,262 | 39.0% |
[ 9.0% - 9.5% ] 9.30% | 172 | 63.6% |
[ 9.0% - 9.5% ] 9.34% | 578 | 39.9% |
[ 9.5% - 10.0% ] 9.70% | 402 | 50.6% |
[ 10.5% - 11.0% ] 10.74% | 121 | 42.3% |
[ 12.0% - 12.5% ] 12.46% | 313 | 22.8% |
[ 14.5% - 15.0% ] 14.97% | 294 | 63.3% |
[ 16.0% - 16.5% ] 16.19% | 105 | 39.3% |
[ 47.5% - 48.0% ] 47.90% | 119 | 82.3% |