Guamanian/Chamorro Male Unemployment
COMPARE
Guamanian/Chamorro
Select to Compare
Male Unemployment
Guamanian/Chamorro Male Unemployment
5.4%
UNEMPLOYMENT | MALES
12.3/ 100
METRIC RATING
204th/ 347
METRIC RANK
Guamanian/Chamorro Male Unemployment Correlation Chart
The statistical analysis conducted on geographies consisting of 221,364,428 people shows a mild positive correlation between the proportion of Guamanians/Chamorros and unemployment rate among males in the United States with a correlation coefficient (R) of 0.337 and weighted average of 5.4%. On average, for every 1% (one percent) increase in Guamanians/Chamorros within a typical geography, there is an increase of 0.54% in unemployment rate among males.
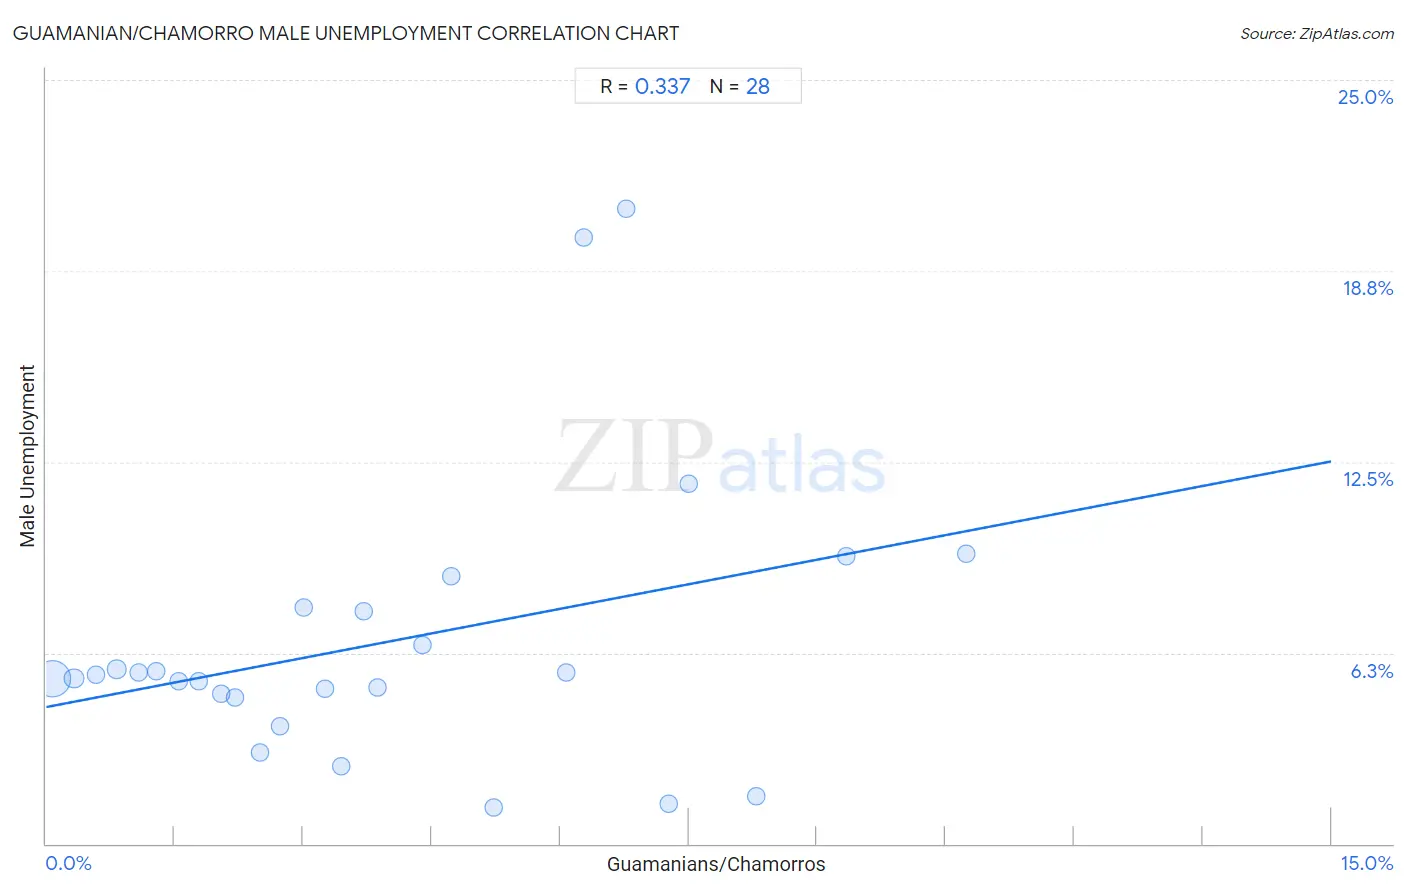
It is essential to understand that the correlation between the percentage of Guamanians/Chamorros and unemployment rate among males does not imply a direct cause-and-effect relationship. It remains uncertain whether the presence of Guamanians/Chamorros influences an upward or downward trend in the level of unemployment rate among males within an area, or if Guamanians/Chamorros simply ended up residing in those areas with higher or lower levels of unemployment rate among males due to other factors.
Demographics Similar to Guamanians/Chamorros by Male Unemployment
In terms of male unemployment, the demographic groups most similar to Guamanians/Chamorros are Immigrants from Laos (5.4%, a difference of 0.090%), Nonimmigrants (5.4%, a difference of 0.10%), Immigrants from Costa Rica (5.5%, a difference of 0.13%), Immigrants from Philippines (5.4%, a difference of 0.15%), and Immigrants from Zaire (5.4%, a difference of 0.17%).
| Demographics | Rating | Rank | Male Unemployment |
| Alsatians | 16.7 /100 | #197 | Poor 5.4% |
| Immigrants from Thailand | 14.7 /100 | #198 | Poor 5.4% |
| Immigrants from Greece | 14.5 /100 | #199 | Poor 5.4% |
| Immigrants from Zaire | 13.7 /100 | #200 | Poor 5.4% |
| Immigrants from Philippines | 13.5 /100 | #201 | Poor 5.4% |
| Nonimmigrants | 13.1 /100 | #202 | Poor 5.4% |
| Immigrants from Laos | 13.0 /100 | #203 | Poor 5.4% |
| Guamanians/Chamorros | 12.3 /100 | #204 | Poor 5.4% |
| Immigrants from Costa Rica | 11.4 /100 | #205 | Poor 5.5% |
| Immigrants from Ukraine | 9.9 /100 | #206 | Tragic 5.5% |
| Immigrants from Syria | 9.3 /100 | #207 | Tragic 5.5% |
| Immigrants from Lebanon | 8.6 /100 | #208 | Tragic 5.5% |
| Immigrants from Middle Africa | 8.3 /100 | #209 | Tragic 5.5% |
| South American Indians | 7.6 /100 | #210 | Tragic 5.5% |
| Israelis | 7.4 /100 | #211 | Tragic 5.5% |
Guamanian/Chamorro Male Unemployment Correlation Summary
| Measurement | Guamanian/Chamorro Data | Male Unemployment Data |
| Minimum | 0.066% | 1.2% |
| Maximum | 10.7% | 20.8% |
| Range | 10.7% | 19.6% |
| Mean | 4.0% | 6.6% |
| Median | 3.4% | 5.5% |
| Interquartile 25% (IQ1) | 1.7% | 4.9% |
| Interquartile 75% (IQ3) | 6.2% | 7.7% |
| Interquartile Range (IQR) | 4.5% | 2.8% |
| Standard Deviation (Sample) | 2.9% | 4.6% |
| Standard Deviation (Population) | 2.8% | 4.5% |
Correlation Details
| Guamanian/Chamorro Percentile | Sample Size | Male Unemployment |
[ 0.0% - 0.5% ] 0.066% | 190,707,727 | 5.4% |
[ 0.0% - 0.5% ] 0.33% | 19,966,310 | 5.4% |
[ 0.5% - 1.0% ] 0.58% | 5,507,406 | 5.5% |
[ 0.5% - 1.0% ] 0.82% | 2,520,386 | 5.7% |
[ 1.0% - 1.5% ] 1.08% | 1,217,074 | 5.6% |
[ 1.0% - 1.5% ] 1.29% | 446,889 | 5.7% |
[ 1.5% - 2.0% ] 1.55% | 404,069 | 5.3% |
[ 1.5% - 2.0% ] 1.78% | 189,844 | 5.3% |
[ 2.0% - 2.5% ] 2.04% | 127,526 | 4.9% |
[ 2.0% - 2.5% ] 2.20% | 57,986 | 4.8% |
[ 2.0% - 2.5% ] 2.49% | 49,462 | 3.0% |
[ 2.5% - 3.0% ] 2.73% | 18,633 | 3.8% |
[ 3.0% - 3.5% ] 3.01% | 24,908 | 7.7% |
[ 3.0% - 3.5% ] 3.26% | 27,204 | 5.1% |
[ 3.0% - 3.5% ] 3.45% | 45,984 | 2.5% |
[ 3.5% - 4.0% ] 3.71% | 4,876 | 7.6% |
[ 3.5% - 4.0% ] 3.87% | 2,299 | 5.1% |
[ 4.0% - 4.5% ] 4.39% | 3,873 | 6.5% |
[ 4.5% - 5.0% ] 4.73% | 24,569 | 8.8% |
[ 5.0% - 5.5% ] 5.23% | 1,606 | 1.2% |
[ 6.0% - 6.5% ] 6.07% | 4,758 | 5.6% |
[ 6.0% - 6.5% ] 6.27% | 1,642 | 19.8% |
[ 6.5% - 7.0% ] 6.77% | 1,388 | 20.8% |
[ 7.0% - 7.5% ] 7.27% | 1,128 | 1.3% |
[ 7.0% - 7.5% ] 7.50% | 920 | 11.8% |
[ 8.0% - 8.5% ] 8.29% | 5,262 | 1.6% |
[ 9.0% - 9.5% ] 9.34% | 578 | 9.4% |
[ 10.5% - 11.0% ] 10.74% | 121 | 9.5% |