Celtic Self-Care Disability
COMPARE
Celtic
Select to Compare
Self-Care Disability
Celtic Self-Care Disability
2.6%
SELF-CARE DISABILITY
4.4/ 100
METRIC RATING
217th/ 347
METRIC RANK
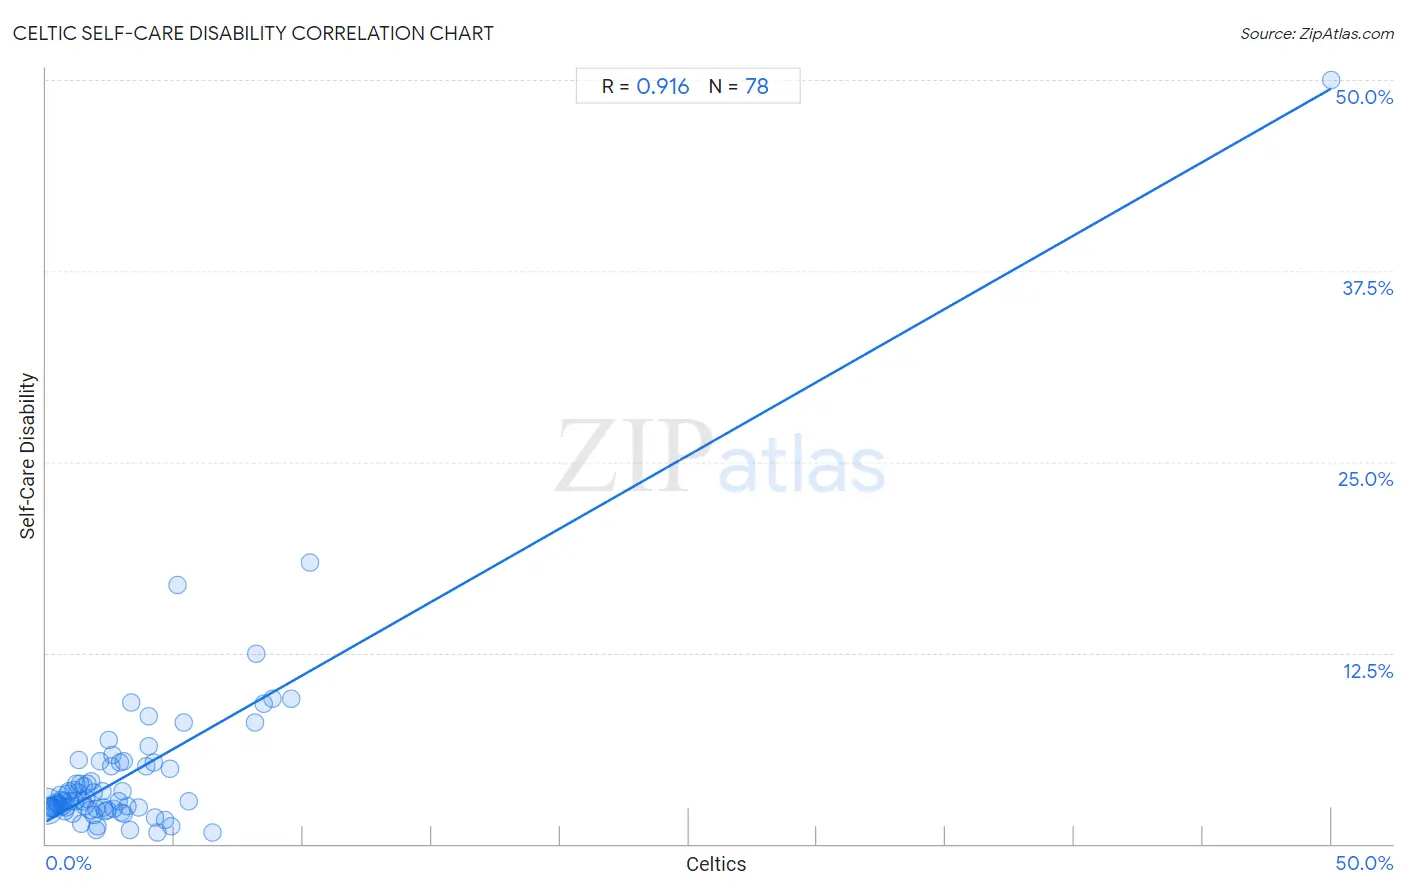
Celtic Self-Care Disability Correlation Chart
The statistical analysis conducted on geographies consisting of 168,804,948 people shows a near-perfect positive correlation between the proportion of Celtics and percentage of population with self-care disability in the United States with a correlation coefficient (R) of 0.916 and weighted average of 2.6%. On average, for every 1% (one percent) increase in Celtics within a typical geography, there is an increase of 0.96% in percentage of population with self-care disability.
It is essential to understand that the correlation between the percentage of Celtics and percentage of population with self-care disability does not imply a direct cause-and-effect relationship. It remains uncertain whether the presence of Celtics influences an upward or downward trend in the level of percentage of population with self-care disability within an area, or if Celtics simply ended up residing in those areas with higher or lower levels of percentage of population with self-care disability due to other factors.
Demographics Similar to Celtics by Self-Care Disability
In terms of self-care disability, the demographic groups most similar to Celtics are White/Caucasian (2.6%, a difference of 0.020%), Immigrants from Thailand (2.6%, a difference of 0.040%), Scotch-Irish (2.6%, a difference of 0.070%), Ecuadorian (2.6%, a difference of 0.090%), and Immigrants from Honduras (2.6%, a difference of 0.090%).
| Demographics | Rating | Rank | Self-Care Disability |
| Panamanians | 6.4 /100 | #210 | Tragic 2.5% |
| Native Hawaiians | 5.1 /100 | #211 | Tragic 2.6% |
| Samoans | 5.1 /100 | #212 | Tragic 2.6% |
| Ecuadorians | 4.7 /100 | #213 | Tragic 2.6% |
| Immigrants from Honduras | 4.7 /100 | #214 | Tragic 2.6% |
| Immigrants from Thailand | 4.5 /100 | #215 | Tragic 2.6% |
| Whites/Caucasians | 4.4 /100 | #216 | Tragic 2.6% |
| Celtics | 4.4 /100 | #217 | Tragic 2.6% |
| Scotch-Irish | 4.1 /100 | #218 | Tragic 2.6% |
| Immigrants from Moldova | 4.0 /100 | #219 | Tragic 2.6% |
| Sub-Saharan Africans | 4.0 /100 | #220 | Tragic 2.6% |
| Hondurans | 3.8 /100 | #221 | Tragic 2.6% |
| Spaniards | 3.8 /100 | #222 | Tragic 2.6% |
| French Canadians | 3.8 /100 | #223 | Tragic 2.6% |
| Osage | 3.6 /100 | #224 | Tragic 2.6% |
Celtic Self-Care Disability Correlation Summary
| Measurement | Celtic Data | Self-Care Disability Data |
| Minimum | 0.018% | 0.75% |
| Maximum | 50.0% | 50.0% |
| Range | 50.0% | 49.3% |
| Mean | 3.3% | 4.6% |
| Median | 2.1% | 2.8% |
| Interquartile 25% (IQ1) | 1.0% | 2.3% |
| Interquartile 75% (IQ3) | 3.9% | 5.1% |
| Interquartile Range (IQR) | 2.9% | 2.8% |
| Standard Deviation (Sample) | 5.8% | 6.1% |
| Standard Deviation (Population) | 5.8% | 6.1% |
Correlation Details
| Celtic Percentile | Sample Size | Self-Care Disability |
[ 0.0% - 0.5% ] 0.018% | 128,364,253 | 2.5% |
[ 0.0% - 0.5% ] 0.071% | 22,462,117 | 2.4% |
[ 0.0% - 0.5% ] 0.12% | 8,175,614 | 2.4% |
[ 0.0% - 0.5% ] 0.18% | 3,387,918 | 2.4% |
[ 0.0% - 0.5% ] 0.23% | 2,195,396 | 2.4% |
[ 0.0% - 0.5% ] 0.28% | 1,319,597 | 2.3% |
[ 0.0% - 0.5% ] 0.33% | 584,043 | 2.5% |
[ 0.0% - 0.5% ] 0.39% | 409,327 | 2.7% |
[ 0.0% - 0.5% ] 0.44% | 181,104 | 2.6% |
[ 0.0% - 0.5% ] 0.49% | 251,400 | 2.6% |
[ 0.5% - 1.0% ] 0.54% | 204,375 | 3.2% |
[ 0.5% - 1.0% ] 0.59% | 125,340 | 2.9% |
[ 0.5% - 1.0% ] 0.65% | 223,409 | 2.4% |
[ 0.5% - 1.0% ] 0.70% | 98,343 | 2.8% |
[ 0.5% - 1.0% ] 0.73% | 116,091 | 2.1% |
[ 0.5% - 1.0% ] 0.79% | 203,109 | 2.4% |
[ 0.5% - 1.0% ] 0.85% | 41,516 | 3.3% |
[ 0.5% - 1.0% ] 0.89% | 20,862 | 3.5% |
[ 0.5% - 1.0% ] 0.94% | 71,295 | 2.7% |
[ 1.0% - 1.5% ] 1.01% | 25,649 | 1.9% |
[ 1.0% - 1.5% ] 1.06% | 11,331 | 3.5% |
[ 1.0% - 1.5% ] 1.11% | 32,648 | 2.8% |
[ 1.0% - 1.5% ] 1.15% | 35,625 | 4.0% |
[ 1.0% - 1.5% ] 1.20% | 9,327 | 3.3% |
[ 1.0% - 1.5% ] 1.25% | 17,431 | 5.5% |
[ 1.0% - 1.5% ] 1.32% | 7,375 | 3.9% |
[ 1.0% - 1.5% ] 1.38% | 3,689 | 1.3% |
[ 1.0% - 1.5% ] 1.42% | 2,538 | 2.8% |
[ 1.0% - 1.5% ] 1.44% | 12,132 | 3.8% |
[ 1.5% - 2.0% ] 1.51% | 21,387 | 2.5% |
[ 1.5% - 2.0% ] 1.58% | 23,873 | 2.9% |
[ 1.5% - 2.0% ] 1.61% | 12,553 | 3.9% |
[ 1.5% - 2.0% ] 1.71% | 24,623 | 2.2% |
[ 1.5% - 2.0% ] 1.77% | 9,115 | 4.1% |
[ 1.5% - 2.0% ] 1.82% | 10,525 | 1.9% |
[ 1.5% - 2.0% ] 1.85% | 3,084 | 3.3% |
[ 1.5% - 2.0% ] 1.93% | 2,119 | 0.90% |
[ 1.5% - 2.0% ] 1.96% | 3,108 | 2.3% |
[ 2.0% - 2.5% ] 2.01% | 5,767 | 1.1% |
[ 2.0% - 2.5% ] 2.10% | 5,964 | 5.4% |
[ 2.0% - 2.5% ] 2.18% | 12,524 | 3.4% |
[ 2.0% - 2.5% ] 2.22% | 856 | 2.4% |
[ 2.0% - 2.5% ] 2.27% | 484 | 2.1% |
[ 2.0% - 2.5% ] 2.41% | 16,879 | 2.2% |
[ 2.0% - 2.5% ] 2.44% | 4,597 | 6.8% |
[ 2.5% - 3.0% ] 2.54% | 5,560 | 5.1% |
[ 2.5% - 3.0% ] 2.57% | 2,486 | 5.8% |
[ 2.5% - 3.0% ] 2.62% | 3,854 | 2.3% |
[ 2.5% - 3.0% ] 2.82% | 71 | 2.8% |
[ 2.5% - 3.0% ] 2.86% | 4,930 | 5.3% |
[ 2.5% - 3.0% ] 2.91% | 3,122 | 2.1% |
[ 2.5% - 3.0% ] 2.95% | 1,220 | 3.4% |
[ 3.0% - 3.5% ] 3.00% | 1,700 | 2.0% |
[ 3.0% - 3.5% ] 3.03% | 726 | 5.4% |
[ 3.0% - 3.5% ] 3.16% | 729 | 2.5% |
[ 3.0% - 3.5% ] 3.27% | 1,468 | 0.90% |
[ 3.0% - 3.5% ] 3.29% | 2,702 | 9.2% |
[ 3.5% - 4.0% ] 3.60% | 2,863 | 2.4% |
[ 3.5% - 4.0% ] 3.88% | 103 | 5.1% |
[ 3.5% - 4.0% ] 3.97% | 604 | 6.4% |
[ 4.0% - 4.5% ] 4.01% | 424 | 8.3% |
[ 4.0% - 4.5% ] 4.19% | 692 | 5.3% |
[ 4.0% - 4.5% ] 4.22% | 2,298 | 1.7% |
[ 4.0% - 4.5% ] 4.35% | 138 | 0.75% |
[ 4.5% - 5.0% ] 4.60% | 7,087 | 1.6% |
[ 4.5% - 5.0% ] 4.82% | 1,059 | 4.9% |
[ 4.5% - 5.0% ] 4.87% | 1,457 | 1.1% |
[ 5.0% - 5.5% ] 5.08% | 118 | 16.9% |
[ 5.0% - 5.5% ] 5.37% | 428 | 7.9% |
[ 5.5% - 6.0% ] 5.57% | 3,179 | 2.8% |
[ 6.0% - 6.5% ] 6.46% | 681 | 0.78% |
[ 8.0% - 8.5% ] 8.14% | 2,679 | 8.0% |
[ 8.0% - 8.5% ] 8.17% | 1,396 | 12.4% |
[ 8.0% - 8.5% ] 8.44% | 308 | 9.2% |
[ 8.5% - 9.0% ] 8.81% | 295 | 9.5% |
[ 9.5% - 10.0% ] 9.52% | 21 | 9.5% |
[ 10.0% - 10.5% ] 10.26% | 234 | 18.4% |
[ 50.0% - 50.5% ] 50.00% | 4 | 50.0% |