Guamanian/Chamorro Disability Age 65 to 74

COMPARE

Guamanian/Chamorro
Race
Ancestry
AfghanAfricanAlaska NativeAlaskan AthabascanAlbanianAleutAlsatianAmericanApacheArabArapahoArgentineanArmenianAssyrian/Chaldean/SyriacAustralianAustrianBahamianBangladeshiBarbadianBasqueBelgianBelizeanBermudanBhutaneseBlackfeetBolivianBrazilianBritishBritish West IndianBulgarianBurmeseCajunCambodianCanadianCape VerdeanCarpatho RusynCelticCentral AmericanCentral American IndianCherokeeCheyenneChickasawChileanChineseChippewaChoctawColombianColvilleComancheCosta RicanCreeCreekCroatianCrowCubanCypriotCzechCzechoslovakianDanishDelawareDominicanDutchDutch West IndianEastern EuropeanEcuadorianEgyptianEnglishEstonianEthiopianEuropeanFijianFilipinoFinnishFrenchFrench American IndianFrench CanadianGermanGerman RussianGhanaianGreekGuamanian/ChamorroGuatemalanGuyaneseHaitianHmongHonduranHopiHoumaHungarianIcelanderIndian (Asian)IndonesianInupiatIranianIraqiIrishIroquoisIsraeliItalianJamaicanJapaneseJordanianKenyanKiowaKoreanLaotianLatvianLebaneseLiberianLithuanianLumbeeLuxembourgerMacedonianMalaysianMalteseMarshalleseMenomineeMexicanMexican American IndianMongolianMoroccanNative HawaiianNavajoNepaleseNew ZealanderNicaraguanNigerianNorthern EuropeanNorwegianOkinawanOsageOttawaPaiutePakistaniPalestinianPanamanianParaguayanPennsylvania GermanPeruvianPimaPolishPortuguesePotawatomiPuebloPuerto RicanPuget Sound SalishRomanianRussianSalvadoranSamoanScandinavianScotch-IrishScottishSeminoleSenegaleseSerbianShoshoneSierra LeoneanSiouxSlavicSlovakSloveneSomaliSouth AfricanSouth AmericanSouth American IndianSoviet UnionSpaniardSpanishSpanish AmericanSpanish American IndianSri LankanSubsaharan AfricanSudaneseSwedishSwissSyrianTaiwaneseThaiTlingit-HaidaTohono O'OdhamTonganTrinidadian and TobagonianTsimshianTurkishU.S. Virgin IslanderUgandanUkrainianUruguayanUteVenezuelanVietnameseWelshWest IndianYakamaYaquiYugoslavianYumanYup'ikZimbabwean
Immigration
NonimmigrantsImmigrantsAfghanistanAfricaAlbaniaArgentinaArmeniaAsiaAustraliaAustriaBahamasBangladeshBarbadosBelarusBelgiumBelizeBoliviaBosnia and HerzegovinaBrazilBulgariaBurma/MyanmarCabo VerdeCambodiaCameroonCanadaCaribbeanCentral AmericaChileChinaColombiaCongoCosta RicaCroatiaCubaCzechoslovakiaDenmarkDominicaDominican RepublicEastern AfricaEastern AsiaEastern EuropeEcuadorEgyptEl SalvadorEnglandEritreaEthiopiaEuropeFijiFranceGermanyGhanaGreeceGrenadaGuatemalaGuyanaHaitiHondurasHong KongHungaryIndiaIndonesiaIranIraqIrelandIsraelItalyJamaicaJapanJordanKazakhstanKenyaKoreaKuwaitLaosLatin AmericaLatviaLebanonLiberiaLithuaniaMalaysiaMexicoMicronesiaMiddle AfricaMoldovaMoroccoNepalNetherlandsNicaraguaNigeriaNorth AmericaNorth MacedoniaNorthern AfricaNorthern EuropeNorwayOceaniaPakistanPanamaPeruPhilippinesPolandPortugalRomaniaRussiaSaudi ArabiaScotlandSenegalSerbiaSierra LeoneSingaporeSomaliaSouth AfricaSouth AmericaSouth Central AsiaSouth Eastern AsiaSouthern EuropeSpainSri LankaSt. Vincent and the GrenadinesSudanSwedenSwitzerlandSyriaTaiwanThailandTrinidad and TobagoTurkeyUgandaUkraineUruguayUzbekistanVenezuelaVietnamWest IndiesWestern AfricaWestern AsiaWestern EuropeYemenZaireZimbabweAzores
Select to Compare
Race
Ancestry
AfghanAfricanAlaska NativeAlaskan AthabascanAlbanianAleutAlsatianAmericanApacheArabArapahoArgentineanArmenianAssyrian/Chaldean/SyriacAustralianAustrianBahamianBangladeshiBarbadianBasqueBelgianBelizeanBermudanBhutaneseBlackfeetBolivianBrazilianBritishBritish West IndianBulgarianBurmeseCajunCambodianCanadianCape VerdeanCarpatho RusynCelticCentral AmericanCentral American IndianCherokeeCheyenneChickasawChileanChineseChippewaChoctawColombianColvilleComancheCosta RicanCreeCreekCroatianCrowCubanCypriotCzechCzechoslovakianDanishDelawareDominicanDutchDutch West IndianEastern EuropeanEcuadorianEgyptianEnglishEstonianEthiopianEuropeanFijianFilipinoFinnishFrenchFrench American IndianFrench CanadianGermanGerman RussianGhanaianGreekGuatemalanGuyaneseHaitianHmongHonduranHopiHoumaHungarianIcelanderIndian (Asian)IndonesianInupiatIranianIraqiIrishIroquoisIsraeliItalianJamaicanJapaneseJordanianKenyanKiowaKoreanLaotianLatvianLebaneseLiberianLithuanianLumbeeLuxembourgerMacedonianMalaysianMalteseMarshalleseMenomineeMexicanMexican American IndianMongolianMoroccanNative HawaiianNavajoNepaleseNew ZealanderNicaraguanNigerianNorthern EuropeanNorwegianOkinawanOsageOttawaPaiutePakistaniPalestinianPanamanianParaguayanPennsylvania GermanPeruvianPimaPolishPortuguesePotawatomiPuebloPuerto RicanPuget Sound SalishRomanianRussianSalvadoranSamoanScandinavianScotch-IrishScottishSeminoleSenegaleseSerbianShoshoneSierra LeoneanSiouxSlavicSlovakSloveneSomaliSouth AfricanSouth AmericanSouth American IndianSoviet UnionSpaniardSpanishSpanish AmericanSpanish American IndianSri LankanSubsaharan AfricanSudaneseSwedishSwissSyrianTaiwaneseThaiTlingit-HaidaTohono O'OdhamTonganTrinidadian and TobagonianTsimshianTurkishU.S. Virgin IslanderUgandanUkrainianUruguayanUteVenezuelanVietnameseWelshWest IndianYakamaYaquiYugoslavianYumanYup'ikZimbabwean
Immigration
NonimmigrantsImmigrantsAfghanistanAfricaAlbaniaArgentinaArmeniaAsiaAustraliaAustriaBahamasBangladeshBarbadosBelarusBelgiumBelizeBoliviaBosnia and HerzegovinaBrazilBulgariaBurma/MyanmarCabo VerdeCambodiaCameroonCanadaCaribbeanCentral AmericaChileChinaColombiaCongoCosta RicaCroatiaCubaCzechoslovakiaDenmarkDominicaDominican RepublicEastern AfricaEastern AsiaEastern EuropeEcuadorEgyptEl SalvadorEnglandEritreaEthiopiaEuropeFijiFranceGermanyGhanaGreeceGrenadaGuatemalaGuyanaHaitiHondurasHong KongHungaryIndiaIndonesiaIranIraqIrelandIsraelItalyJamaicaJapanJordanKazakhstanKenyaKoreaKuwaitLaosLatin AmericaLatviaLebanonLiberiaLithuaniaMalaysiaMexicoMicronesiaMiddle AfricaMoldovaMoroccoNepalNetherlandsNicaraguaNigeriaNorth AmericaNorth MacedoniaNorthern AfricaNorthern EuropeNorwayOceaniaPakistanPanamaPeruPhilippinesPolandPortugalRomaniaRussiaSaudi ArabiaScotlandSenegalSerbiaSierra LeoneSingaporeSomaliaSouth AfricaSouth AmericaSouth Central AsiaSouth Eastern AsiaSouthern EuropeSpainSri LankaSt. Vincent and the GrenadinesSudanSwedenSwitzerlandSyriaTaiwanThailandTrinidad and TobagoTurkeyUgandaUkraineUruguayUzbekistanVenezuelaVietnamWest IndiesWestern AfricaWestern AsiaWestern EuropeYemenZaireZimbabweAzores
Disability Age 65 to 74
Income
Poverty
Unemployment
Labor Participation
Family Structure
Vehicle Availability
Education Level
Disability

Guamanian/Chamorro Disability Age 65 to 74
Tragic

25.3%
DISABILITY | AGE 65 TO 74
0.3/ 100
METRIC RATING
257th/ 347
METRIC RANK

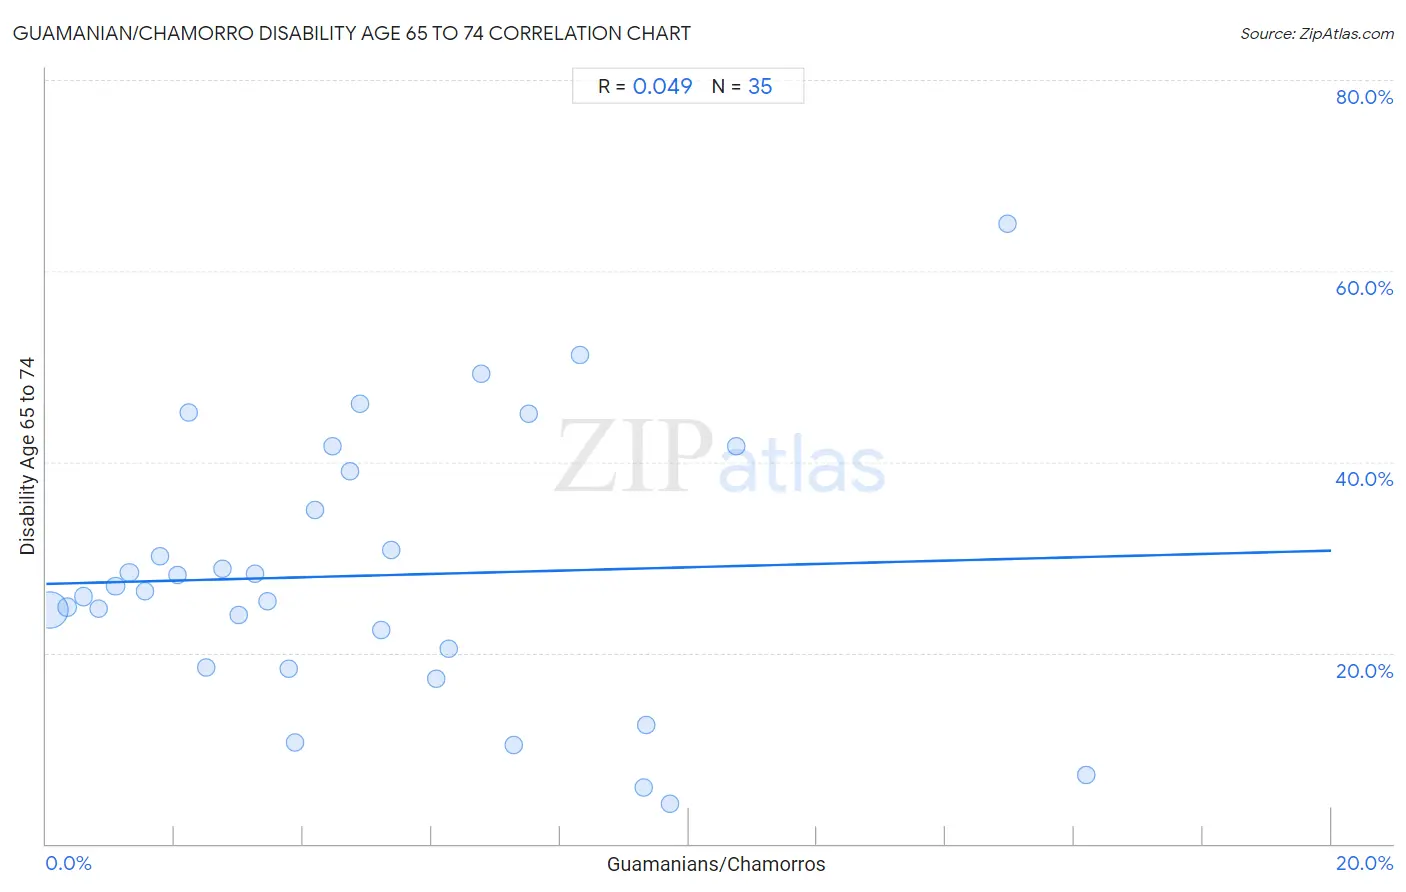
Guamanian/Chamorro Disability Age 65 to 74 Correlation Chart

The statistical analysis conducted on geographies consisting of 221,467,649 people shows no correlation between the proportion of Guamanians/Chamorros and percentage of population with a disability between the ages 65 and 75 in the United States with a correlation coefficient (R) of 0.049 and weighted average of 25.3%. On average, for every 1% (one percent) increase in Guamanians/Chamorros within a typical geography, there is an increase of 0.17% in percentage of population with a disability between the ages 65 and 75.
Guamanian/Chamorro Disability Age 65 to 74
It is essential to understand that the correlation between the percentage of Guamanians/Chamorros and percentage of population with a disability between the ages 65 and 75 does not imply a direct cause-and-effect relationship. It remains uncertain whether the presence of Guamanians/Chamorros influences an upward or downward trend in the level of percentage of population with a disability between the ages 65 and 75 within an area, or if Guamanians/Chamorros simply ended up residing in those areas with higher or lower levels of percentage of population with a disability between the ages 65 and 75 due to other factors.

Demographics Similar to Guamanians/Chamorros by Disability Age 65 to 74

In terms of disability age 65 to 74, the demographic groups most similar to Guamanians/Chamorros are Marshallese (25.3%, a difference of 0.060%), Immigrants from Cambodia (25.3%, a difference of 0.15%), Immigrants from Somalia (25.2%, a difference of 0.17%), Malaysian (25.4%, a difference of 0.47%), and Cape Verdean (25.4%, a difference of 0.55%).
DemographicsRating | RankDisability Age 65 to 74
Salvadorans
0.8
/100
|
#250
Tragic
25.0%
Nonimmigrants
0.7
/100
|
#251
Tragic
25.0%
Immigrants from El Salvador
0.6
/100
|
#252
Tragic
25.1%
Sub-Saharan Africans
0.6
/100
|
#253
Tragic
25.1%
Somalis
0.6
/100
|
#254
Tragic
25.1%
Central Americans
0.5
/100
|
#255
Tragic
25.1%
Immigrants from Somalia
0.4
/100
|
#256
Tragic
25.2%
Guamanians/Chamorros
0.3
/100
|
#257
Tragic
25.3%
Marshallese
0.3
/100
|
#258
Tragic
25.3%
Immigrants from Cambodia
0.3
/100
|
#259
Tragic
25.3%
Malaysians
0.2
/100
|
#260
Tragic
25.4%
Cape Verdeans
0.2
/100
|
#261
Tragic
25.4%
Samoans
0.2
/100
|
#262
Tragic
25.4%
Iroquois
0.2
/100
|
#263
Tragic
25.4%
Hawaiians
0.2
/100
|
#264
Tragic
25.5%

Guamanian/Chamorro Disability Age 65 to 74 Correlation Summary

MeasurementGuamanian/Chamorro DataDisability Age 65 to 74 Data
Minimum0.066%4.2%
Maximum16.2%65.0%
Range16.1%60.8%
Mean5.0%28.1%
Median4.2%26.4%
Interquartile 25% (IQ1)2.0%18.5%
Interquartile 75% (IQ3)7.3%39.0%
Interquartile Range (IQR)5.2%20.5%
Standard Deviation (Sample)3.9%14.0%
Standard Deviation (Population)3.9%13.8%

Correlation Details

Guamanian/Chamorro PercentileSample SizeDisability Age 65 to 74
[
0.0%
-
0.5%
]
0.066%
190,736,39624.5%
[
0.0%
-
0.5%
]
0.33%
19,956,27524.8%
[
0.5%
-
1.0%
]
0.58%
5,543,93025.9%
[
0.5%
-
1.0%
]
0.82%
2,520,59524.6%
[
1.0%
-
1.5%
]
1.08%
1,192,74826.9%
[
1.0%
-
1.5%
]
1.29%
459,89728.4%
[
1.5%
-
2.0%
]
1.54%
408,83626.4%
[
1.5%
-
2.0%
]
1.78%
203,23130.1%
[
2.0%
-
2.5%
]
2.04%
135,54928.2%
[
2.0%
-
2.5%
]
2.22%
66,56445.1%
[
2.0%
-
2.5%
]
2.49%
49,70318.5%
[
2.5%
-
3.0%
]
2.74%
24,71228.8%
[
2.5%
-
3.0%
]
3.00%
27,64324.0%
[
3.0%
-
3.5%
]
3.26%
27,98828.2%
[
3.0%
-
3.5%
]
3.45%
45,98425.4%
[
3.5%
-
4.0%
]
3.77%
8,46518.3%
[
3.5%
-
4.0%
]
3.87%
2,29910.6%
[
4.0%
-
4.5%
]
4.19%
7,78235.0%
[
4.0%
-
4.5%
]
4.45%
1,32641.6%
[
4.5%
-
5.0%
]
4.72%
25,53539.0%
[
4.5%
-
5.0%
]
4.88%
3,74846.2%
[
5.0%
-
5.5%
]
5.22%
1,97422.4%
[
5.0%
-
5.5%
]
5.36%
26130.7%
[
6.0%
-
6.5%
]
6.07%
4,75817.2%
[
6.0%
-
6.5%
]
6.27%
1,61120.4%
[
6.5%
-
7.0%
]
6.77%
1,38849.2%
[
7.0%
-
7.5%
]
7.27%
1,21110.3%
[
7.0%
-
7.5%
]
7.50%
92045.0%
[
8.0%
-
8.5%
]
8.30%
4,64851.2%
[
9.0%
-
9.5%
]
9.30%
1725.9%
[
9.0%
-
9.5%
]
9.34%
57812.5%
[
9.5%
-
10.0%
]
9.70%
4024.2%
[
10.5%
-
11.0%
]
10.74%
12141.7%
[
14.5%
-
15.0%
]
14.97%
29465.0%
[
16.0%
-
16.5%
]
16.19%
1057.1%