Guamanian/Chamorro Hearing Disability
COMPARE
Guamanian/Chamorro
Select to Compare
Hearing Disability
Guamanian/Chamorro Hearing Disability
3.3%
HEARING DISABILITY
2.2/ 100
METRIC RATING
235th/ 347
METRIC RANK
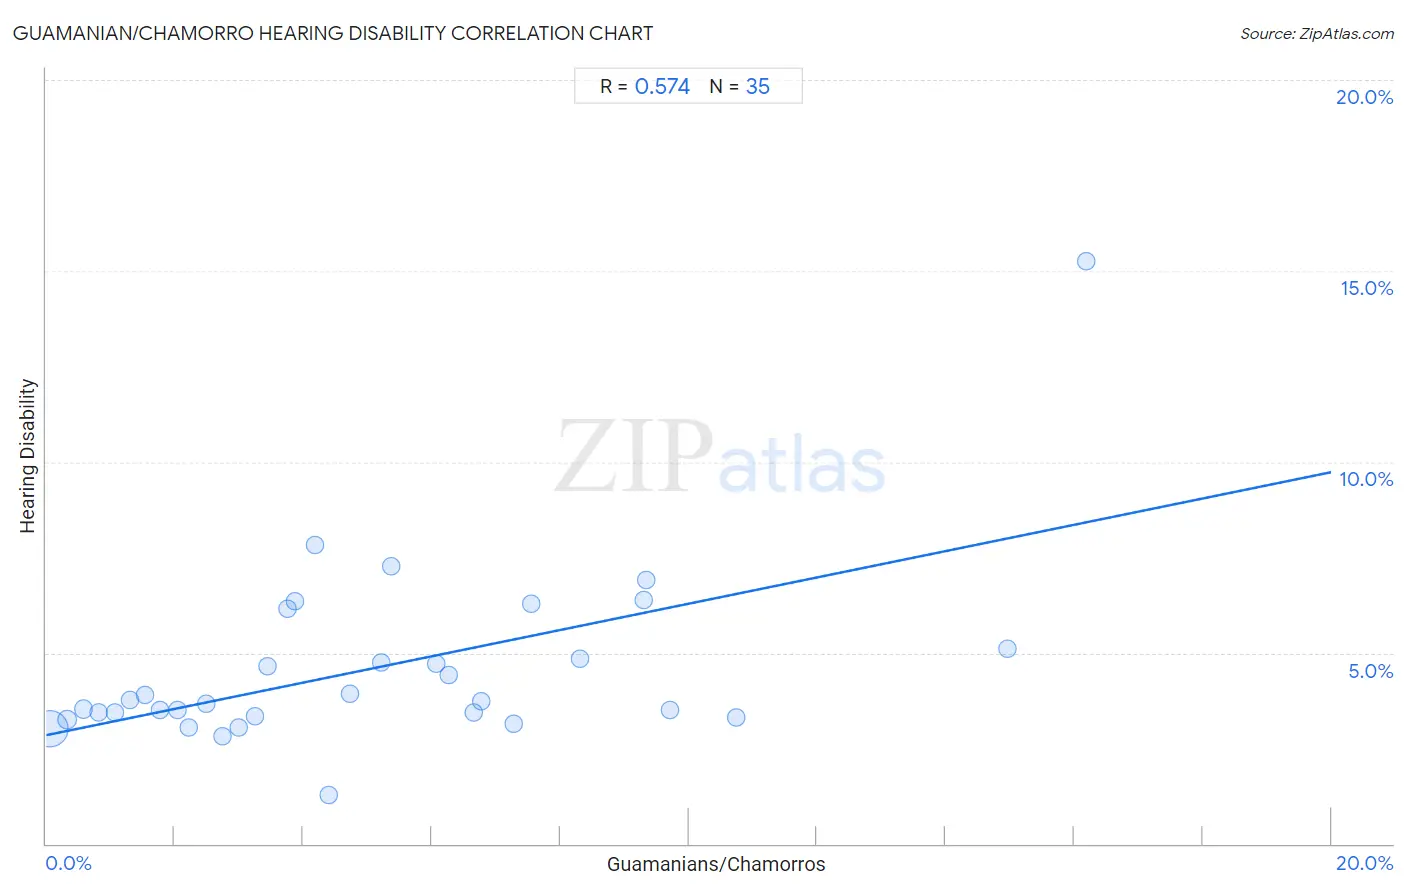
Guamanian/Chamorro Hearing Disability Correlation Chart
The statistical analysis conducted on geographies consisting of 221,861,125 people shows a substantial positive correlation between the proportion of Guamanians/Chamorros and percentage of population with hearing disability in the United States with a correlation coefficient (R) of 0.574 and weighted average of 3.3%. On average, for every 1% (one percent) increase in Guamanians/Chamorros within a typical geography, there is an increase of 0.34% in percentage of population with hearing disability.
It is essential to understand that the correlation between the percentage of Guamanians/Chamorros and percentage of population with hearing disability does not imply a direct cause-and-effect relationship. It remains uncertain whether the presence of Guamanians/Chamorros influences an upward or downward trend in the level of percentage of population with hearing disability within an area, or if Guamanians/Chamorros simply ended up residing in those areas with higher or lower levels of percentage of population with hearing disability due to other factors.
Demographics Similar to Guamanians/Chamorros by Hearing Disability
In terms of hearing disability, the demographic groups most similar to Guamanians/Chamorros are Serbian (3.3%, a difference of 0.060%), Central American Indian (3.3%, a difference of 0.10%), Estonian (3.3%, a difference of 0.17%), Immigrants from Austria (3.3%, a difference of 0.46%), and German Russian (3.3%, a difference of 0.46%).
| Demographics | Rating | Rank | Hearing Disability |
| Immigrants from Portugal | 4.3 /100 | #228 | Tragic 3.2% |
| Maltese | 4.1 /100 | #229 | Tragic 3.2% |
| Greeks | 3.2 /100 | #230 | Tragic 3.2% |
| Luxembourgers | 2.9 /100 | #231 | Tragic 3.2% |
| Ukrainians | 2.9 /100 | #232 | Tragic 3.2% |
| Estonians | 2.4 /100 | #233 | Tragic 3.3% |
| Central American Indians | 2.3 /100 | #234 | Tragic 3.3% |
| Guamanians/Chamorros | 2.2 /100 | #235 | Tragic 3.3% |
| Serbians | 2.2 /100 | #236 | Tragic 3.3% |
| Immigrants from Austria | 1.8 /100 | #237 | Tragic 3.3% |
| German Russians | 1.8 /100 | #238 | Tragic 3.3% |
| Nepalese | 1.2 /100 | #239 | Tragic 3.3% |
| Immigrants from Netherlands | 1.1 /100 | #240 | Tragic 3.3% |
| Samoans | 1.1 /100 | #241 | Tragic 3.3% |
| Yugoslavians | 1.0 /100 | #242 | Tragic 3.3% |
Guamanian/Chamorro Hearing Disability Correlation Summary
| Measurement | Guamanian/Chamorro Data | Hearing Disability Data |
| Minimum | 0.066% | 1.3% |
| Maximum | 16.2% | 15.2% |
| Range | 16.1% | 14.0% |
| Mean | 5.1% | 4.6% |
| Median | 4.2% | 3.7% |
| Interquartile 25% (IQ1) | 2.0% | 3.3% |
| Interquartile 75% (IQ3) | 7.3% | 5.1% |
| Interquartile Range (IQR) | 5.2% | 1.8% |
| Standard Deviation (Sample) | 3.9% | 2.4% |
| Standard Deviation (Population) | 3.9% | 2.3% |
Correlation Details
| Guamanian/Chamorro Percentile | Sample Size | Hearing Disability |
[ 0.0% - 0.5% ] 0.066% | 190,845,685 | 3.0% |
[ 0.0% - 0.5% ] 0.33% | 20,047,276 | 3.2% |
[ 0.5% - 1.0% ] 0.58% | 5,620,622 | 3.5% |
[ 0.5% - 1.0% ] 0.82% | 2,546,986 | 3.4% |
[ 1.0% - 1.5% ] 1.08% | 1,257,582 | 3.4% |
[ 1.0% - 1.5% ] 1.29% | 477,459 | 3.8% |
[ 1.5% - 2.0% ] 1.54% | 410,880 | 3.9% |
[ 1.5% - 2.0% ] 1.78% | 203,350 | 3.5% |
[ 2.0% - 2.5% ] 2.04% | 135,549 | 3.5% |
[ 2.0% - 2.5% ] 2.22% | 66,564 | 3.1% |
[ 2.0% - 2.5% ] 2.49% | 49,703 | 3.7% |
[ 2.5% - 3.0% ] 2.74% | 24,712 | 2.8% |
[ 2.5% - 3.0% ] 2.99% | 30,241 | 3.0% |
[ 3.0% - 3.5% ] 3.26% | 27,988 | 3.3% |
[ 3.0% - 3.5% ] 3.45% | 45,984 | 4.7% |
[ 3.5% - 4.0% ] 3.75% | 9,680 | 6.2% |
[ 3.5% - 4.0% ] 3.87% | 2,299 | 6.4% |
[ 4.0% - 4.5% ] 4.19% | 7,782 | 7.8% |
[ 4.0% - 4.5% ] 4.40% | 5,199 | 1.3% |
[ 4.5% - 5.0% ] 4.72% | 25,535 | 3.9% |
[ 5.0% - 5.5% ] 5.22% | 1,974 | 4.8% |
[ 5.0% - 5.5% ] 5.36% | 261 | 7.3% |
[ 6.0% - 6.5% ] 6.07% | 4,758 | 4.7% |
[ 6.0% - 6.5% ] 6.27% | 1,611 | 4.4% |
[ 6.5% - 7.0% ] 6.65% | 857 | 3.4% |
[ 6.5% - 7.0% ] 6.77% | 1,388 | 3.7% |
[ 7.0% - 7.5% ] 7.27% | 1,211 | 3.2% |
[ 7.5% - 8.0% ] 7.55% | 1,669 | 6.3% |
[ 8.0% - 8.5% ] 8.30% | 4,648 | 4.8% |
[ 9.0% - 9.5% ] 9.30% | 172 | 6.4% |
[ 9.0% - 9.5% ] 9.34% | 578 | 6.9% |
[ 9.5% - 10.0% ] 9.70% | 402 | 3.5% |
[ 10.5% - 11.0% ] 10.74% | 121 | 3.3% |
[ 14.5% - 15.0% ] 14.97% | 294 | 5.1% |
[ 16.0% - 16.5% ] 16.19% | 105 | 15.2% |