Guamanian/Chamorro Single Female Poverty
COMPARE
Guamanian/Chamorro
Select to Compare
Single Female Poverty
Guamanian/Chamorro Single Female Poverty
21.6%
POVERTY | SINGLE FEMALES
13.7/ 100
METRIC RATING
213th/ 347
METRIC RANK
Guamanian/Chamorro Single Female Poverty Correlation Chart
The statistical analysis conducted on geographies consisting of 220,498,532 people shows a very strong positive correlation between the proportion of Guamanians/Chamorros and poverty level among single females in the United States with a correlation coefficient (R) of 0.802 and weighted average of 21.6%. On average, for every 1% (one percent) increase in Guamanians/Chamorros within a typical geography, there is an increase of 1.7% in poverty level among single females.
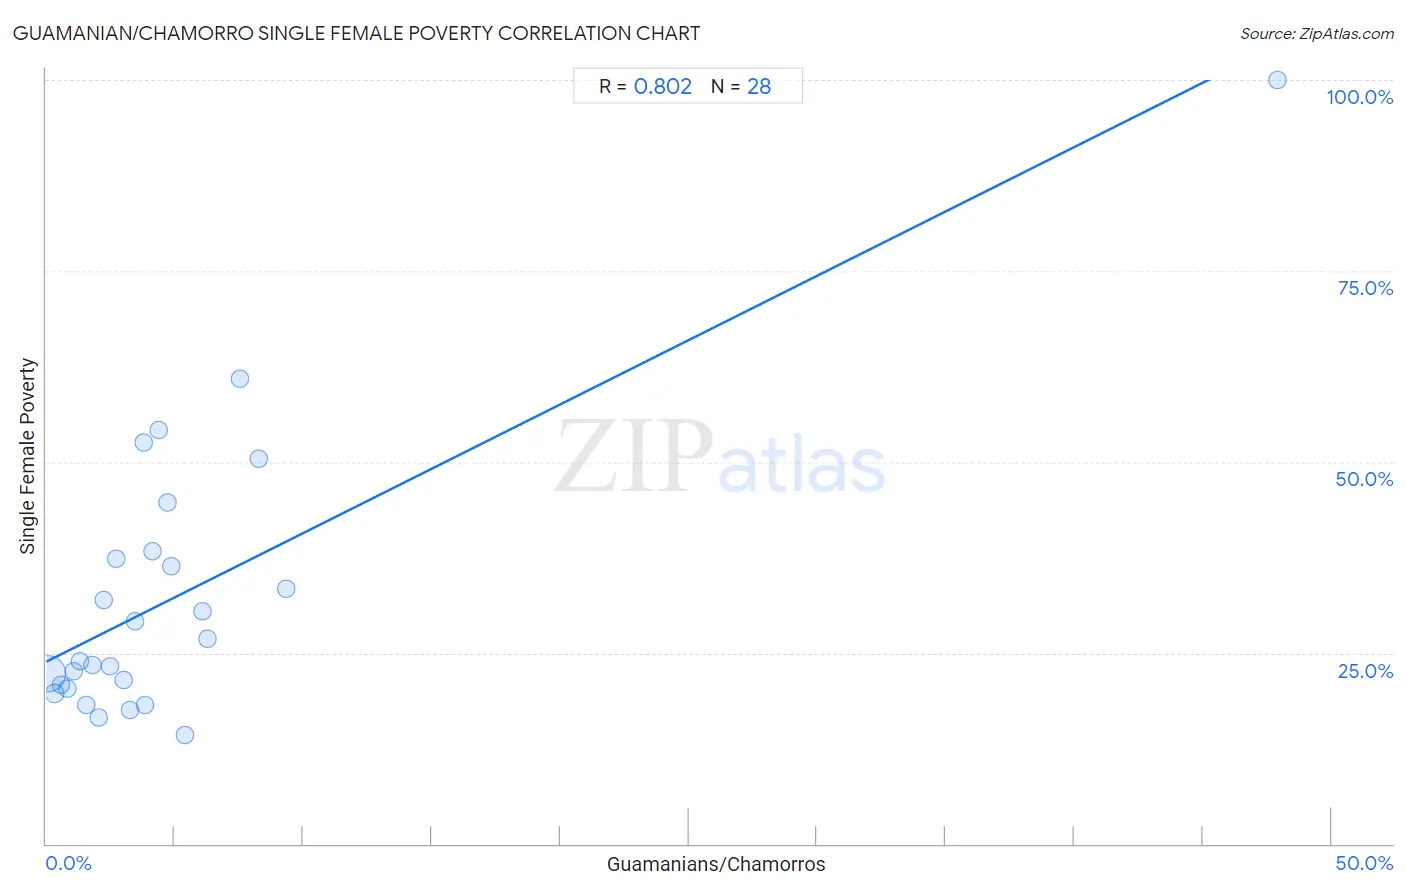
It is essential to understand that the correlation between the percentage of Guamanians/Chamorros and poverty level among single females does not imply a direct cause-and-effect relationship. It remains uncertain whether the presence of Guamanians/Chamorros influences an upward or downward trend in the level of poverty level among single females within an area, or if Guamanians/Chamorros simply ended up residing in those areas with higher or lower levels of poverty level among single females due to other factors.
Demographics Similar to Guamanians/Chamorros by Single Female Poverty
In terms of single female poverty, the demographic groups most similar to Guamanians/Chamorros are Jamaican (21.6%, a difference of 0.030%), Icelander (21.6%, a difference of 0.040%), Immigrants from Nicaragua (21.6%, a difference of 0.060%), Immigrants from Panama (21.6%, a difference of 0.080%), and Immigrants from Eastern Africa (21.6%, a difference of 0.17%).
| Demographics | Rating | Rank | Single Female Poverty |
| Belgians | 16.1 /100 | #206 | Poor 21.5% |
| Ghanaians | 15.7 /100 | #207 | Poor 21.6% |
| Haitians | 15.4 /100 | #208 | Poor 21.6% |
| Immigrants from Eastern Africa | 15.1 /100 | #209 | Poor 21.6% |
| Immigrants from Panama | 14.4 /100 | #210 | Poor 21.6% |
| Icelanders | 14.0 /100 | #211 | Poor 21.6% |
| Jamaicans | 14.0 /100 | #212 | Poor 21.6% |
| Guamanians/Chamorros | 13.7 /100 | #213 | Poor 21.6% |
| Immigrants from Nicaragua | 13.3 /100 | #214 | Poor 21.6% |
| Ecuadorians | 12.3 /100 | #215 | Poor 21.6% |
| Immigrants from Barbados | 12.2 /100 | #216 | Poor 21.7% |
| Immigrants from St. Vincent and the Grenadines | 11.7 /100 | #217 | Poor 21.7% |
| Nepalese | 9.7 /100 | #218 | Tragic 21.7% |
| Panamanians | 9.4 /100 | #219 | Tragic 21.7% |
| Germans | 8.3 /100 | #220 | Tragic 21.8% |
Guamanian/Chamorro Single Female Poverty Correlation Summary
| Measurement | Guamanian/Chamorro Data | Single Female Poverty Data |
| Minimum | 0.066% | 14.3% |
| Maximum | 47.9% | 100.0% |
| Range | 47.8% | 85.7% |
| Mean | 5.1% | 32.5% |
| Median | 3.4% | 25.4% |
| Interquartile 25% (IQ1) | 1.7% | 20.5% |
| Interquartile 75% (IQ3) | 5.1% | 37.8% |
| Interquartile Range (IQR) | 3.5% | 17.3% |
| Standard Deviation (Sample) | 8.7% | 18.3% |
| Standard Deviation (Population) | 8.6% | 18.0% |
Correlation Details
| Guamanian/Chamorro Percentile | Sample Size | Single Female Poverty |
[ 0.0% - 0.5% ] 0.066% | 190,041,323 | 22.3% |
[ 0.0% - 0.5% ] 0.33% | 19,793,280 | 19.7% |
[ 0.5% - 1.0% ] 0.58% | 5,493,024 | 20.8% |
[ 0.5% - 1.0% ] 0.82% | 2,525,658 | 20.3% |
[ 1.0% - 1.5% ] 1.08% | 1,216,484 | 22.6% |
[ 1.0% - 1.5% ] 1.30% | 449,482 | 24.0% |
[ 1.5% - 2.0% ] 1.55% | 378,347 | 18.1% |
[ 1.5% - 2.0% ] 1.78% | 189,363 | 23.4% |
[ 2.0% - 2.5% ] 2.04% | 133,030 | 16.6% |
[ 2.0% - 2.5% ] 2.22% | 63,813 | 31.9% |
[ 2.5% - 3.0% ] 2.50% | 41,688 | 23.3% |
[ 2.5% - 3.0% ] 2.73% | 18,143 | 37.4% |
[ 3.0% - 3.5% ] 3.00% | 25,813 | 21.5% |
[ 3.0% - 3.5% ] 3.26% | 27,485 | 17.5% |
[ 3.0% - 3.5% ] 3.45% | 45,609 | 29.1% |
[ 3.5% - 4.0% ] 3.78% | 6,965 | 52.6% |
[ 3.5% - 4.0% ] 3.87% | 4,243 | 18.1% |
[ 4.0% - 4.5% ] 4.14% | 4,804 | 38.3% |
[ 4.0% - 4.5% ] 4.40% | 4,230 | 54.2% |
[ 4.5% - 5.0% ] 4.73% | 17,817 | 44.6% |
[ 4.5% - 5.0% ] 4.88% | 3,748 | 36.4% |
[ 5.0% - 5.5% ] 5.38% | 186 | 14.3% |
[ 6.0% - 6.5% ] 6.07% | 4,758 | 30.5% |
[ 6.0% - 6.5% ] 6.27% | 1,611 | 26.8% |
[ 7.5% - 8.0% ] 7.55% | 1,669 | 61.0% |
[ 8.0% - 8.5% ] 8.29% | 5,262 | 50.5% |
[ 9.0% - 9.5% ] 9.34% | 578 | 33.3% |
[ 47.5% - 48.0% ] 47.90% | 119 | 100.0% |