Guamanian/Chamorro Median Female Earnings

COMPARE

Guamanian/Chamorro
Race
Ancestry
AfghanAfricanAlaska NativeAlaskan AthabascanAlbanianAleutAlsatianAmericanApacheArabArapahoArgentineanArmenianAssyrian/Chaldean/SyriacAustralianAustrianBahamianBangladeshiBarbadianBasqueBelgianBelizeanBermudanBhutaneseBlackfeetBolivianBrazilianBritishBritish West IndianBulgarianBurmeseCajunCambodianCanadianCape VerdeanCarpatho RusynCelticCentral AmericanCentral American IndianCherokeeCheyenneChickasawChileanChineseChippewaChoctawColombianColvilleComancheCosta RicanCreeCreekCroatianCrowCubanCypriotCzechCzechoslovakianDanishDelawareDominicanDutchDutch West IndianEastern EuropeanEcuadorianEgyptianEnglishEstonianEthiopianEuropeanFijianFilipinoFinnishFrenchFrench American IndianFrench CanadianGermanGerman RussianGhanaianGreekGuamanian/ChamorroGuatemalanGuyaneseHaitianHmongHonduranHopiHoumaHungarianIcelanderIndian (Asian)IndonesianInupiatIranianIraqiIrishIroquoisIsraeliItalianJamaicanJapaneseJordanianKenyanKiowaKoreanLaotianLatvianLebaneseLiberianLithuanianLumbeeLuxembourgerMacedonianMalaysianMalteseMarshalleseMenomineeMexicanMexican American IndianMongolianMoroccanNative HawaiianNavajoNepaleseNew ZealanderNicaraguanNigerianNorthern EuropeanNorwegianOkinawanOsageOttawaPaiutePakistaniPalestinianPanamanianParaguayanPennsylvania GermanPeruvianPimaPolishPortuguesePotawatomiPuebloPuerto RicanPuget Sound SalishRomanianRussianSalvadoranSamoanScandinavianScotch-IrishScottishSeminoleSenegaleseSerbianShoshoneSierra LeoneanSiouxSlavicSlovakSloveneSomaliSouth AfricanSouth AmericanSouth American IndianSoviet UnionSpaniardSpanishSpanish AmericanSpanish American IndianSri LankanSubsaharan AfricanSudaneseSwedishSwissSyrianTaiwaneseThaiTlingit-HaidaTohono O'OdhamTonganTrinidadian and TobagonianTsimshianTurkishU.S. Virgin IslanderUgandanUkrainianUruguayanUteVenezuelanVietnameseWelshWest IndianYakamaYaquiYugoslavianYumanYup'ikZimbabwean
Immigration
NonimmigrantsImmigrantsAfghanistanAfricaAlbaniaArgentinaArmeniaAsiaAustraliaAustriaBahamasBangladeshBarbadosBelarusBelgiumBelizeBoliviaBosnia and HerzegovinaBrazilBulgariaBurma/MyanmarCabo VerdeCambodiaCameroonCanadaCaribbeanCentral AmericaChileChinaColombiaCongoCosta RicaCroatiaCubaCzechoslovakiaDenmarkDominicaDominican RepublicEastern AfricaEastern AsiaEastern EuropeEcuadorEgyptEl SalvadorEnglandEritreaEthiopiaEuropeFijiFranceGermanyGhanaGreeceGrenadaGuatemalaGuyanaHaitiHondurasHong KongHungaryIndiaIndonesiaIranIraqIrelandIsraelItalyJamaicaJapanJordanKazakhstanKenyaKoreaKuwaitLaosLatin AmericaLatviaLebanonLiberiaLithuaniaMalaysiaMexicoMicronesiaMiddle AfricaMoldovaMoroccoNepalNetherlandsNicaraguaNigeriaNorth AmericaNorth MacedoniaNorthern AfricaNorthern EuropeNorwayOceaniaPakistanPanamaPeruPhilippinesPolandPortugalRomaniaRussiaSaudi ArabiaScotlandSenegalSerbiaSierra LeoneSingaporeSomaliaSouth AfricaSouth AmericaSouth Central AsiaSouth Eastern AsiaSouthern EuropeSpainSri LankaSt. Vincent and the GrenadinesSudanSwedenSwitzerlandSyriaTaiwanThailandTrinidad and TobagoTurkeyUgandaUkraineUruguayUzbekistanVenezuelaVietnamWest IndiesWestern AfricaWestern AsiaWestern EuropeYemenZaireZimbabweAzores
Select to Compare
Race
Ancestry
AfghanAfricanAlaska NativeAlaskan AthabascanAlbanianAleutAlsatianAmericanApacheArabArapahoArgentineanArmenianAssyrian/Chaldean/SyriacAustralianAustrianBahamianBangladeshiBarbadianBasqueBelgianBelizeanBermudanBhutaneseBlackfeetBolivianBrazilianBritishBritish West IndianBulgarianBurmeseCajunCambodianCanadianCape VerdeanCarpatho RusynCelticCentral AmericanCentral American IndianCherokeeCheyenneChickasawChileanChineseChippewaChoctawColombianColvilleComancheCosta RicanCreeCreekCroatianCrowCubanCypriotCzechCzechoslovakianDanishDelawareDominicanDutchDutch West IndianEastern EuropeanEcuadorianEgyptianEnglishEstonianEthiopianEuropeanFijianFilipinoFinnishFrenchFrench American IndianFrench CanadianGermanGerman RussianGhanaianGreekGuatemalanGuyaneseHaitianHmongHonduranHopiHoumaHungarianIcelanderIndian (Asian)IndonesianInupiatIranianIraqiIrishIroquoisIsraeliItalianJamaicanJapaneseJordanianKenyanKiowaKoreanLaotianLatvianLebaneseLiberianLithuanianLumbeeLuxembourgerMacedonianMalaysianMalteseMarshalleseMenomineeMexicanMexican American IndianMongolianMoroccanNative HawaiianNavajoNepaleseNew ZealanderNicaraguanNigerianNorthern EuropeanNorwegianOkinawanOsageOttawaPaiutePakistaniPalestinianPanamanianParaguayanPennsylvania GermanPeruvianPimaPolishPortuguesePotawatomiPuebloPuerto RicanPuget Sound SalishRomanianRussianSalvadoranSamoanScandinavianScotch-IrishScottishSeminoleSenegaleseSerbianShoshoneSierra LeoneanSiouxSlavicSlovakSloveneSomaliSouth AfricanSouth AmericanSouth American IndianSoviet UnionSpaniardSpanishSpanish AmericanSpanish American IndianSri LankanSubsaharan AfricanSudaneseSwedishSwissSyrianTaiwaneseThaiTlingit-HaidaTohono O'OdhamTonganTrinidadian and TobagonianTsimshianTurkishU.S. Virgin IslanderUgandanUkrainianUruguayanUteVenezuelanVietnameseWelshWest IndianYakamaYaquiYugoslavianYumanYup'ikZimbabwean
Immigration
NonimmigrantsImmigrantsAfghanistanAfricaAlbaniaArgentinaArmeniaAsiaAustraliaAustriaBahamasBangladeshBarbadosBelarusBelgiumBelizeBoliviaBosnia and HerzegovinaBrazilBulgariaBurma/MyanmarCabo VerdeCambodiaCameroonCanadaCaribbeanCentral AmericaChileChinaColombiaCongoCosta RicaCroatiaCubaCzechoslovakiaDenmarkDominicaDominican RepublicEastern AfricaEastern AsiaEastern EuropeEcuadorEgyptEl SalvadorEnglandEritreaEthiopiaEuropeFijiFranceGermanyGhanaGreeceGrenadaGuatemalaGuyanaHaitiHondurasHong KongHungaryIndiaIndonesiaIranIraqIrelandIsraelItalyJamaicaJapanJordanKazakhstanKenyaKoreaKuwaitLaosLatin AmericaLatviaLebanonLiberiaLithuaniaMalaysiaMexicoMicronesiaMiddle AfricaMoldovaMoroccoNepalNetherlandsNicaraguaNigeriaNorth AmericaNorth MacedoniaNorthern AfricaNorthern EuropeNorwayOceaniaPakistanPanamaPeruPhilippinesPolandPortugalRomaniaRussiaSaudi ArabiaScotlandSenegalSerbiaSierra LeoneSingaporeSomaliaSouth AfricaSouth AmericaSouth Central AsiaSouth Eastern AsiaSouthern EuropeSpainSri LankaSt. Vincent and the GrenadinesSudanSwedenSwitzerlandSyriaTaiwanThailandTrinidad and TobagoTurkeyUgandaUkraineUruguayUzbekistanVenezuelaVietnamWest IndiesWestern AfricaWestern AsiaWestern EuropeYemenZaireZimbabweAzores
Median Female Earnings
Income
Poverty
Unemployment
Labor Participation
Family Structure
Vehicle Availability
Education Level
Disability

Guamanian/Chamorro Median Female Earnings
Poor

$38,717
EARNINGS | FEMALES
11.5/ 100
METRIC RATING
212th/ 347
METRIC RANK

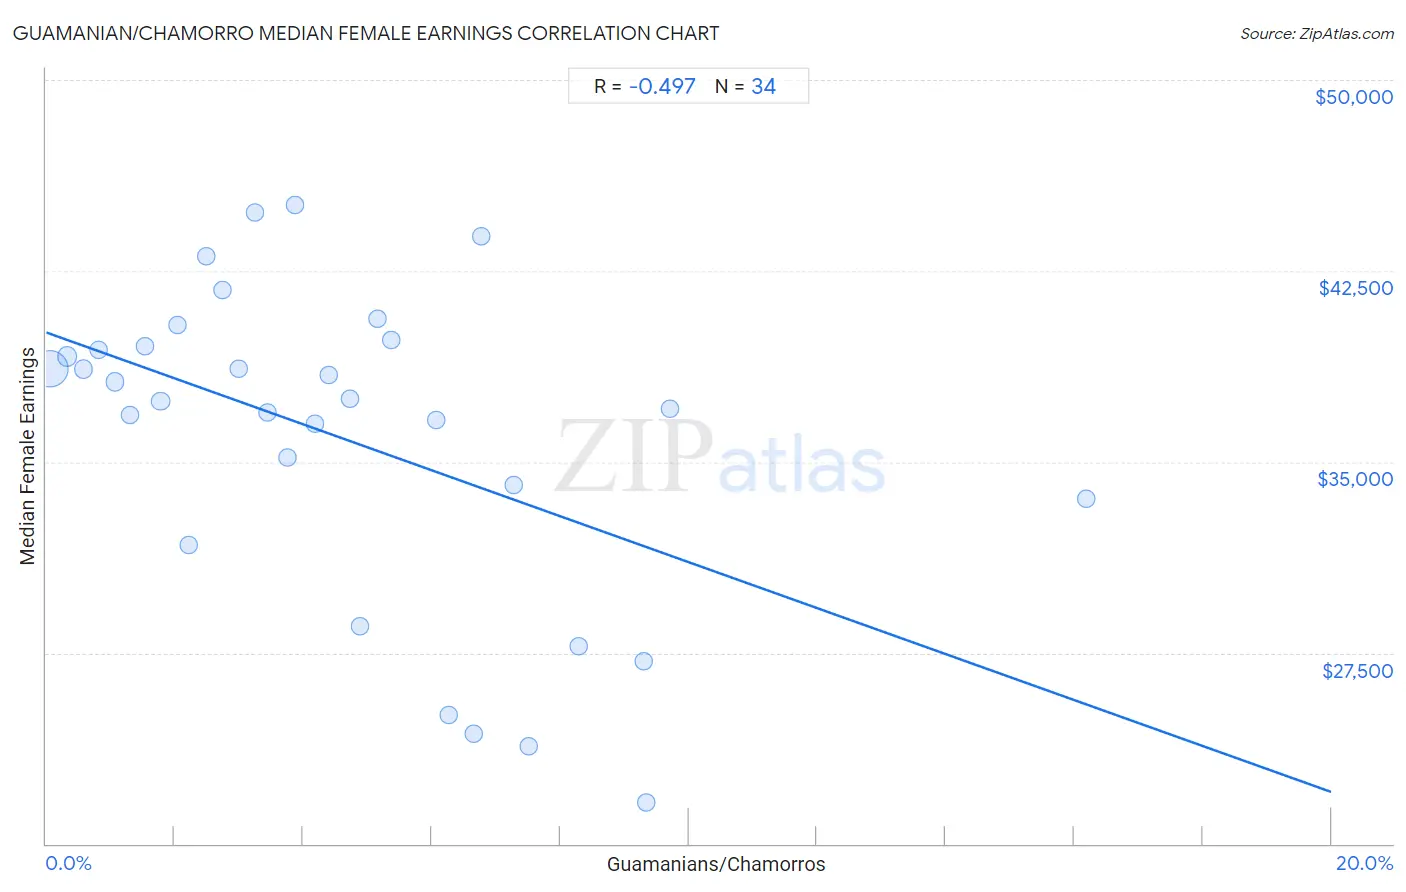
Guamanian/Chamorro Median Female Earnings Correlation Chart

The statistical analysis conducted on geographies consisting of 221,909,570 people shows a moderate negative correlation between the proportion of Guamanians/Chamorros and median female earnings in the United States with a correlation coefficient (R) of -0.497 and weighted average of $38,717. On average, for every 1% (one percent) increase in Guamanians/Chamorros within a typical geography, there is a decrease of $903 in median female earnings.
Guamanian/Chamorro Median Female Earnings
It is essential to understand that the correlation between the percentage of Guamanians/Chamorros and median female earnings does not imply a direct cause-and-effect relationship. It remains uncertain whether the presence of Guamanians/Chamorros influences an upward or downward trend in the level of median female earnings within an area, or if Guamanians/Chamorros simply ended up residing in those areas with higher or lower levels of median female earnings due to other factors.

Demographics Similar to Guamanians/Chamorros by Median Female Earnings

In terms of median female earnings, the demographic groups most similar to Guamanians/Chamorros are Aleut ($38,719, a difference of 0.010%), Czechoslovakian ($38,738, a difference of 0.050%), Jamaican ($38,670, a difference of 0.12%), Iraqi ($38,666, a difference of 0.13%), and Spaniard ($38,656, a difference of 0.16%).
DemographicsRating | RankMedian Female Earnings
Immigrants from Colombia
16.3
/100
|
#205
Poor
$38,913
Immigrants from Bosnia and Herzegovina
15.6
/100
|
#206
Poor
$38,886
Immigrants from Cambodia
14.2
/100
|
#207
Poor
$38,833
Immigrants from Thailand
13.6
/100
|
#208
Poor
$38,810
Norwegians
13.4
/100
|
#209
Poor
$38,802
Czechoslovakians
12.0
/100
|
#210
Poor
$38,738
Aleuts
11.6
/100
|
#211
Poor
$38,719
Guamanians/Chamorros
11.5
/100
|
#212
Poor
$38,717
Jamaicans
10.5
/100
|
#213
Poor
$38,670
Iraqis
10.5
/100
|
#214
Poor
$38,666
Spaniards
10.3
/100
|
#215
Poor
$38,656
Immigrants from Ecuador
10.1
/100
|
#216
Poor
$38,644
Immigrants from Jamaica
9.7
/100
|
#217
Tragic
$38,625
Cape Verdeans
9.5
/100
|
#218
Tragic
$38,614
Nepalese
9.3
/100
|
#219
Tragic
$38,603

Guamanian/Chamorro Median Female Earnings Correlation Summary

MeasurementGuamanian/Chamorro DataMedian Female Earnings Data
Minimum0.066%$21,607
Maximum16.2%$45,111
Range16.1%$23,504
Mean4.6%$35,932
Median4.0%$37,420
Interquartile 25% (IQ1)2.0%$33,542
Interquartile 75% (IQ3)6.7%$39,523
Interquartile Range (IQR)4.6%$5,981
Standard Deviation (Sample)3.4%$6,215
Standard Deviation (Population)3.4%$6,122

Correlation Details

Guamanian/Chamorro PercentileSample SizeMedian Female Earnings
[
0.0%
-
0.5%
]
0.066%
190,858,682$38,636
[
0.0%
-
0.5%
]
0.33%
20,065,121$39,135
[
0.5%
-
1.0%
]
0.58%
5,632,818$38,644
[
0.5%
-
1.0%
]
0.82%
2,548,046$39,396
[
1.0%
-
1.5%
]
1.08%
1,255,378$38,147
[
1.0%
-
1.5%
]
1.29%
482,068$36,820
[
1.5%
-
2.0%
]
1.54%
410,392$39,523
[
1.5%
-
2.0%
]
1.78%
202,432$37,375
[
2.0%
-
2.5%
]
2.04%
133,662$40,389
[
2.0%
-
2.5%
]
2.22%
66,564$31,757
[
2.0%
-
2.5%
]
2.49%
49,703$43,093
[
2.5%
-
3.0%
]
2.74%
25,136$41,775
[
2.5%
-
3.0%
]
2.99%
30,241$38,661
[
3.0%
-
3.5%
]
3.26%
27,988$44,779
[
3.0%
-
3.5%
]
3.45%
45,984$36,946
[
3.5%
-
4.0%
]
3.75%
10,775$35,166
[
3.5%
-
4.0%
]
3.87%
4,243$45,111
[
4.0%
-
4.5%
]
4.19%
7,782$36,492
[
4.0%
-
4.5%
]
4.41%
5,379$38,425
[
4.5%
-
5.0%
]
4.72%
25,535$37,466
[
4.5%
-
5.0%
]
4.88%
3,748$28,563
[
5.0%
-
5.5%
]
5.16%
368$40,625
[
5.0%
-
5.5%
]
5.36%
261$39,784
[
6.0%
-
6.5%
]
6.07%
4,758$36,667
[
6.0%
-
6.5%
]
6.27%
1,611$25,054
[
6.5%
-
7.0%
]
6.65%
857$24,327
[
6.5%
-
7.0%
]
6.77%
1,388$43,873
[
7.0%
-
7.5%
]
7.27%
1,211$34,077
[
7.0%
-
7.5%
]
7.50%
920$23,824
[
8.0%
-
8.5%
]
8.29%
5,262$27,736
[
9.0%
-
9.5%
]
9.30%
172$27,188
[
9.0%
-
9.5%
]
9.34%
578$21,607
[
9.5%
-
10.0%
]
9.70%
402$37,083
[
16.0%
-
16.5%
]
16.19%
105$33,542