Guamanian/Chamorro Disability Age 18 to 34

COMPARE

Guamanian/Chamorro
Race
Ancestry
AfghanAfricanAlaska NativeAlaskan AthabascanAlbanianAleutAlsatianAmericanApacheArabArapahoArgentineanArmenianAssyrian/Chaldean/SyriacAustralianAustrianBahamianBangladeshiBarbadianBasqueBelgianBelizeanBermudanBhutaneseBlackfeetBolivianBrazilianBritishBritish West IndianBulgarianBurmeseCajunCambodianCanadianCape VerdeanCarpatho RusynCelticCentral AmericanCentral American IndianCherokeeCheyenneChickasawChileanChineseChippewaChoctawColombianColvilleComancheCosta RicanCreeCreekCroatianCrowCubanCypriotCzechCzechoslovakianDanishDelawareDominicanDutchDutch West IndianEastern EuropeanEcuadorianEgyptianEnglishEstonianEthiopianEuropeanFijianFilipinoFinnishFrenchFrench American IndianFrench CanadianGermanGerman RussianGhanaianGreekGuamanian/ChamorroGuatemalanGuyaneseHaitianHmongHonduranHopiHoumaHungarianIcelanderIndian (Asian)IndonesianInupiatIranianIraqiIrishIroquoisIsraeliItalianJamaicanJapaneseJordanianKenyanKiowaKoreanLaotianLatvianLebaneseLiberianLithuanianLumbeeLuxembourgerMacedonianMalaysianMalteseMarshalleseMenomineeMexicanMexican American IndianMongolianMoroccanNative HawaiianNavajoNepaleseNew ZealanderNicaraguanNigerianNorthern EuropeanNorwegianOkinawanOsageOttawaPaiutePakistaniPalestinianPanamanianParaguayanPennsylvania GermanPeruvianPimaPolishPortuguesePotawatomiPuebloPuerto RicanPuget Sound SalishRomanianRussianSalvadoranSamoanScandinavianScotch-IrishScottishSeminoleSenegaleseSerbianShoshoneSierra LeoneanSiouxSlavicSlovakSloveneSomaliSouth AfricanSouth AmericanSouth American IndianSoviet UnionSpaniardSpanishSpanish AmericanSpanish American IndianSri LankanSubsaharan AfricanSudaneseSwedishSwissSyrianTaiwaneseThaiTlingit-HaidaTohono O'OdhamTonganTrinidadian and TobagonianTsimshianTurkishU.S. Virgin IslanderUgandanUkrainianUruguayanUteVenezuelanVietnameseWelshWest IndianYakamaYaquiYugoslavianYumanYup'ikZimbabwean
Immigration
NonimmigrantsImmigrantsAfghanistanAfricaAlbaniaArgentinaArmeniaAsiaAustraliaAustriaBahamasBangladeshBarbadosBelarusBelgiumBelizeBoliviaBosnia and HerzegovinaBrazilBulgariaBurma/MyanmarCabo VerdeCambodiaCameroonCanadaCaribbeanCentral AmericaChileChinaColombiaCongoCosta RicaCroatiaCubaCzechoslovakiaDenmarkDominicaDominican RepublicEastern AfricaEastern AsiaEastern EuropeEcuadorEgyptEl SalvadorEnglandEritreaEthiopiaEuropeFijiFranceGermanyGhanaGreeceGrenadaGuatemalaGuyanaHaitiHondurasHong KongHungaryIndiaIndonesiaIranIraqIrelandIsraelItalyJamaicaJapanJordanKazakhstanKenyaKoreaKuwaitLaosLatin AmericaLatviaLebanonLiberiaLithuaniaMalaysiaMexicoMicronesiaMiddle AfricaMoldovaMoroccoNepalNetherlandsNicaraguaNigeriaNorth AmericaNorth MacedoniaNorthern AfricaNorthern EuropeNorwayOceaniaPakistanPanamaPeruPhilippinesPolandPortugalRomaniaRussiaSaudi ArabiaScotlandSenegalSerbiaSierra LeoneSingaporeSomaliaSouth AfricaSouth AmericaSouth Central AsiaSouth Eastern AsiaSouthern EuropeSpainSri LankaSt. Vincent and the GrenadinesSudanSwedenSwitzerlandSyriaTaiwanThailandTrinidad and TobagoTurkeyUgandaUkraineUruguayUzbekistanVenezuelaVietnamWest IndiesWestern AfricaWestern AsiaWestern EuropeYemenZaireZimbabweAzores
Select to Compare
Race
Ancestry
AfghanAfricanAlaska NativeAlaskan AthabascanAlbanianAleutAlsatianAmericanApacheArabArapahoArgentineanArmenianAssyrian/Chaldean/SyriacAustralianAustrianBahamianBangladeshiBarbadianBasqueBelgianBelizeanBermudanBhutaneseBlackfeetBolivianBrazilianBritishBritish West IndianBulgarianBurmeseCajunCambodianCanadianCape VerdeanCarpatho RusynCelticCentral AmericanCentral American IndianCherokeeCheyenneChickasawChileanChineseChippewaChoctawColombianColvilleComancheCosta RicanCreeCreekCroatianCrowCubanCypriotCzechCzechoslovakianDanishDelawareDominicanDutchDutch West IndianEastern EuropeanEcuadorianEgyptianEnglishEstonianEthiopianEuropeanFijianFilipinoFinnishFrenchFrench American IndianFrench CanadianGermanGerman RussianGhanaianGreekGuatemalanGuyaneseHaitianHmongHonduranHopiHoumaHungarianIcelanderIndian (Asian)IndonesianInupiatIranianIraqiIrishIroquoisIsraeliItalianJamaicanJapaneseJordanianKenyanKiowaKoreanLaotianLatvianLebaneseLiberianLithuanianLumbeeLuxembourgerMacedonianMalaysianMalteseMarshalleseMenomineeMexicanMexican American IndianMongolianMoroccanNative HawaiianNavajoNepaleseNew ZealanderNicaraguanNigerianNorthern EuropeanNorwegianOkinawanOsageOttawaPaiutePakistaniPalestinianPanamanianParaguayanPennsylvania GermanPeruvianPimaPolishPortuguesePotawatomiPuebloPuerto RicanPuget Sound SalishRomanianRussianSalvadoranSamoanScandinavianScotch-IrishScottishSeminoleSenegaleseSerbianShoshoneSierra LeoneanSiouxSlavicSlovakSloveneSomaliSouth AfricanSouth AmericanSouth American IndianSoviet UnionSpaniardSpanishSpanish AmericanSpanish American IndianSri LankanSubsaharan AfricanSudaneseSwedishSwissSyrianTaiwaneseThaiTlingit-HaidaTohono O'OdhamTonganTrinidadian and TobagonianTsimshianTurkishU.S. Virgin IslanderUgandanUkrainianUruguayanUteVenezuelanVietnameseWelshWest IndianYakamaYaquiYugoslavianYumanYup'ikZimbabwean
Immigration
NonimmigrantsImmigrantsAfghanistanAfricaAlbaniaArgentinaArmeniaAsiaAustraliaAustriaBahamasBangladeshBarbadosBelarusBelgiumBelizeBoliviaBosnia and HerzegovinaBrazilBulgariaBurma/MyanmarCabo VerdeCambodiaCameroonCanadaCaribbeanCentral AmericaChileChinaColombiaCongoCosta RicaCroatiaCubaCzechoslovakiaDenmarkDominicaDominican RepublicEastern AfricaEastern AsiaEastern EuropeEcuadorEgyptEl SalvadorEnglandEritreaEthiopiaEuropeFijiFranceGermanyGhanaGreeceGrenadaGuatemalaGuyanaHaitiHondurasHong KongHungaryIndiaIndonesiaIranIraqIrelandIsraelItalyJamaicaJapanJordanKazakhstanKenyaKoreaKuwaitLaosLatin AmericaLatviaLebanonLiberiaLithuaniaMalaysiaMexicoMicronesiaMiddle AfricaMoldovaMoroccoNepalNetherlandsNicaraguaNigeriaNorth AmericaNorth MacedoniaNorthern AfricaNorthern EuropeNorwayOceaniaPakistanPanamaPeruPhilippinesPolandPortugalRomaniaRussiaSaudi ArabiaScotlandSenegalSerbiaSierra LeoneSingaporeSomaliaSouth AfricaSouth AmericaSouth Central AsiaSouth Eastern AsiaSouthern EuropeSpainSri LankaSt. Vincent and the GrenadinesSudanSwedenSwitzerlandSyriaTaiwanThailandTrinidad and TobagoTurkeyUgandaUkraineUruguayUzbekistanVenezuelaVietnamWest IndiesWestern AfricaWestern AsiaWestern EuropeYemenZaireZimbabweAzores
Disability Age 18 to 34
Income
Poverty
Unemployment
Labor Participation
Family Structure
Vehicle Availability
Education Level
Disability

Guamanian/Chamorro Disability Age 18 to 34
Tragic

7.2%
DISABILITY | AGE 18 TO 34
0.8/ 100
METRIC RATING
248th/ 347
METRIC RANK

Guamanian/Chamorro Disability Age 18 to 34 Correlation Chart

The statistical analysis conducted on geographies consisting of 221,642,972 people shows a moderate positive correlation between the proportion of Guamanians/Chamorros and percentage of population with a disability between the ages 18 and 35 in the United States with a correlation coefficient (R) of 0.459 and weighted average of 7.2%. On average, for every 1% (one percent) increase in Guamanians/Chamorros within a typical geography, there is an increase of 1.1% in percentage of population with a disability between the ages 18 and 35.
Guamanian/Chamorro Disability Age 18 to 34
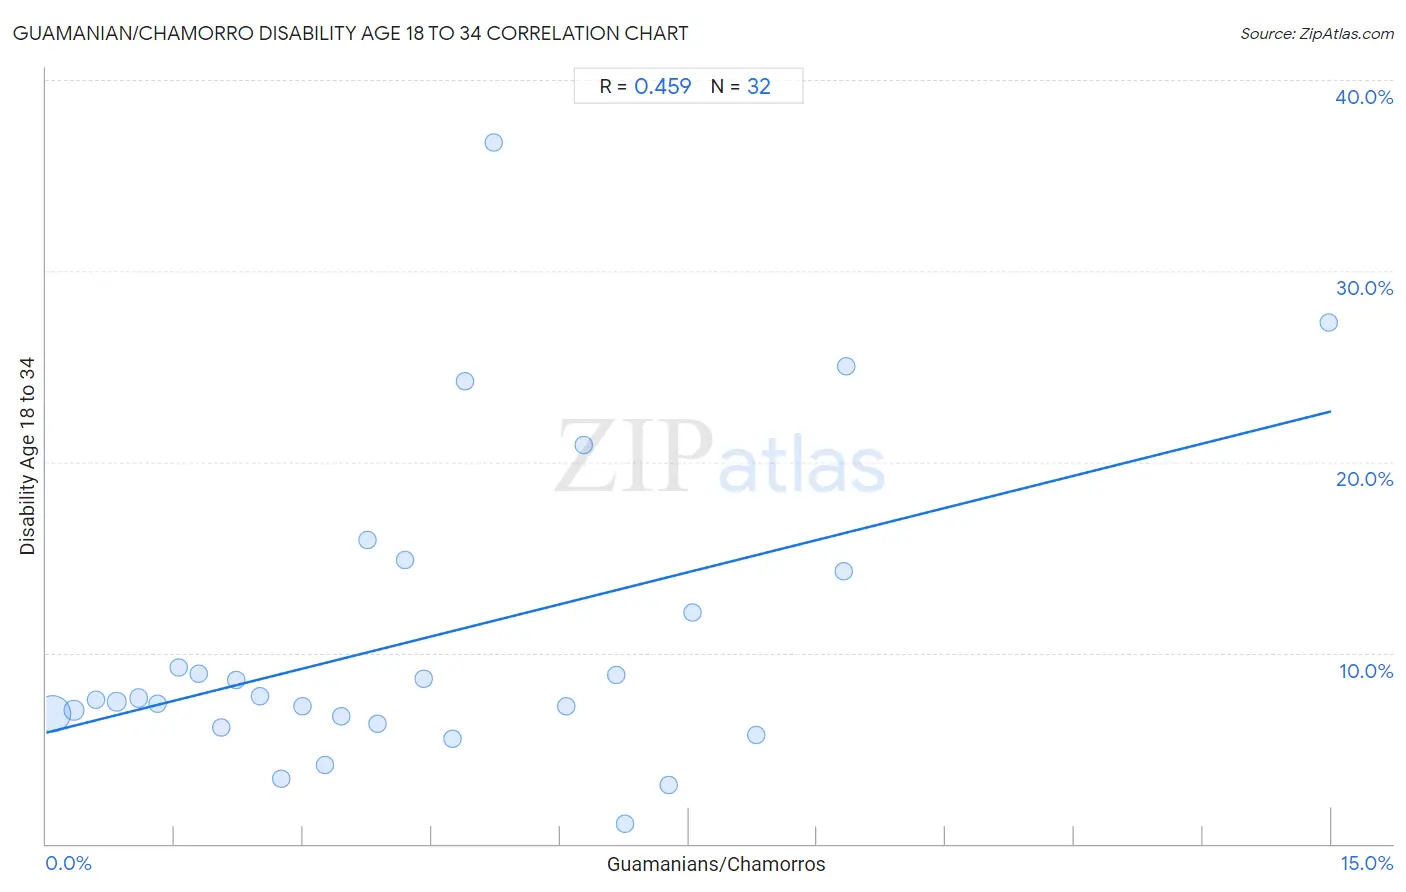
It is essential to understand that the correlation between the percentage of Guamanians/Chamorros and percentage of population with a disability between the ages 18 and 35 does not imply a direct cause-and-effect relationship. It remains uncertain whether the presence of Guamanians/Chamorros influences an upward or downward trend in the level of percentage of population with a disability between the ages 18 and 35 within an area, or if Guamanians/Chamorros simply ended up residing in those areas with higher or lower levels of percentage of population with a disability between the ages 18 and 35 due to other factors.

Demographics Similar to Guamanians/Chamorros by Disability Age 18 to 34

In terms of disability age 18 to 34, the demographic groups most similar to Guamanians/Chamorros are Yugoslavian (7.2%, a difference of 0.040%), Malaysian (7.2%, a difference of 0.10%), Immigrants from Liberia (7.1%, a difference of 0.18%), Hungarian (7.1%, a difference of 0.20%), and Immigrants from Zaire (7.1%, a difference of 0.31%).
DemographicsRating | RankDisability Age 18 to 34
Nepalese
1.1
/100
|
#241
Tragic
7.1%
Immigrants from Congo
1.1
/100
|
#242
Tragic
7.1%
Icelanders
1.0
/100
|
#243
Tragic
7.1%
Immigrants from Zaire
0.9
/100
|
#244
Tragic
7.1%
Hungarians
0.9
/100
|
#245
Tragic
7.1%
Immigrants from Liberia
0.8
/100
|
#246
Tragic
7.1%
Yugoslavians
0.8
/100
|
#247
Tragic
7.2%
Guamanians/Chamorros
0.8
/100
|
#248
Tragic
7.2%
Malaysians
0.7
/100
|
#249
Tragic
7.2%
Fijians
0.6
/100
|
#250
Tragic
7.2%
Spaniards
0.6
/100
|
#251
Tragic
7.2%
Poles
0.6
/100
|
#252
Tragic
7.2%
Croatians
0.5
/100
|
#253
Tragic
7.2%
Indonesians
0.4
/100
|
#254
Tragic
7.2%
Immigrants from Germany
0.4
/100
|
#255
Tragic
7.2%

Guamanian/Chamorro Disability Age 18 to 34 Correlation Summary

MeasurementGuamanian/Chamorro DataDisability Age 18 to 34 Data
Minimum0.066%1.0%
Maximum15.0%36.7%
Range14.9%35.7%
Mean4.4%10.7%
Median3.8%7.6%
Interquartile 25% (IQ1)1.9%6.5%
Interquartile 75% (IQ3)6.5%13.2%
Interquartile Range (IQR)4.5%6.7%
Standard Deviation (Sample)3.3%8.0%
Standard Deviation (Population)3.2%7.9%

Correlation Details

Guamanian/Chamorro PercentileSample SizeDisability Age 18 to 34
[
0.0%
-
0.5%
]
0.066%
190,794,5466.8%
[
0.0%
-
0.5%
]
0.33%
19,994,3357.0%
[
0.5%
-
1.0%
]
0.58%
5,548,5817.6%
[
0.5%
-
1.0%
]
0.82%
2,540,4907.4%
[
1.0%
-
1.5%
]
1.08%
1,245,6217.6%
[
1.0%
-
1.5%
]
1.29%
471,5247.3%
[
1.5%
-
2.0%
]
1.54%
407,8159.3%
[
1.5%
-
2.0%
]
1.78%
203,3508.9%
[
2.0%
-
2.5%
]
2.05%
131,7936.1%
[
2.0%
-
2.5%
]
2.22%
64,1428.6%
[
2.0%
-
2.5%
]
2.49%
48,3057.7%
[
2.5%
-
3.0%
]
2.74%
23,9523.4%
[
2.5%
-
3.0%
]
2.99%
25,3937.2%
[
3.0%
-
3.5%
]
3.26%
27,9884.1%
[
3.0%
-
3.5%
]
3.45%
45,9846.7%
[
3.5%
-
4.0%
]
3.75%
9,68015.9%
[
3.5%
-
4.0%
]
3.87%
4,2436.3%
[
4.0%
-
4.5%
]
4.19%
7,57214.9%
[
4.0%
-
4.5%
]
4.40%
5,1998.7%
[
4.5%
-
5.0%
]
4.74%
19,5495.5%
[
4.5%
-
5.0%
]
4.88%
3,74824.2%
[
5.0%
-
5.5%
]
5.22%
1,97436.7%
[
6.0%
-
6.5%
]
6.07%
4,7587.2%
[
6.0%
-
6.5%
]
6.27%
1,61120.9%
[
6.5%
-
7.0%
]
6.65%
8578.8%
[
6.5%
-
7.0%
]
6.75%
8591.0%
[
7.0%
-
7.5%
]
7.27%
1,1283.1%
[
7.5%
-
8.0%
]
7.55%
1,66912.1%
[
8.0%
-
8.5%
]
8.29%
5,2625.7%
[
9.0%
-
9.5%
]
9.30%
17214.3%
[
9.0%
-
9.5%
]
9.34%
57825.0%
[
14.5%
-
15.0%
]
14.97%
29427.3%