Star Valley, AZ Map & Demographics
Star Valley Map
Star Valley Overview
$47,886
PER CAPITA INCOME
$83,352
AVG FAMILY INCOME
$62,603
AVG HOUSEHOLD INCOME
0.51
INEQUALITY / GINI INDEX
2,490
TOTAL POPULATION
1,442
MALE POPULATION
1,048
FEMALE POPULATION
137.60
MALES / 100 FEMALES
72.68
FEMALES / 100 MALES
65.1
MEDIAN AGE
2.4
AVG FAMILY SIZE
1.6
AVG HOUSEHOLD SIZE
1,199
LABOR FORCE [ PEOPLE ]
48.5%
PERCENT IN LABOR FORCE
2.2%
UNEMPLOYMENT RATE
Star Valley Area Codes
Income in Star Valley
Income Overview in Star Valley
Per Capita Income in Star Valley is $47,886, while median incomes of families and households are $83,352 and $62,603 respectively.
| Characteristic | Number | Measure |
| Per Capita Income | 2,490 | $47,886 |
| Median Family Income | 642 | $83,352 |
| Mean Family Income | 642 | $95,134 |
| Median Household Income | 1,524 | $62,603 |
| Mean Household Income | 1,524 | $73,421 |
| Income Deficit | 642 | $0 |
| Wage / Income Gap (%) | 2,490 | 0.00% |
| Wage / Income Gap ($) | 2,490 | 100.00¢ per $1 |
| Gini / Inequality Index | 2,490 | 0.51 |
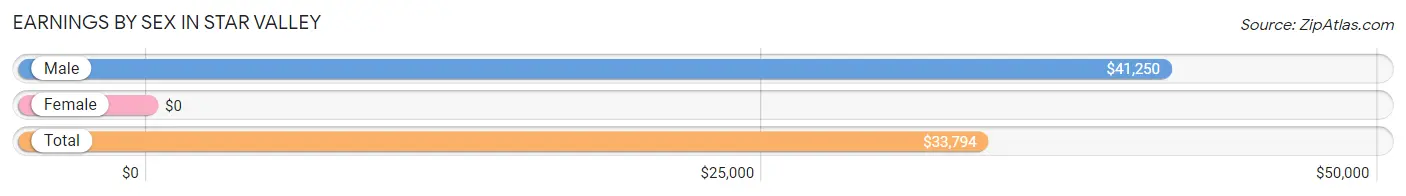
Earnings by Sex in Star Valley
| Sex | Number | Average Earnings |
| Male | 780 (61.7%) | $41,250 |
| Female | 485 (38.3%) | $0 |
| Total | 1,265 (100.0%) | $33,794 |
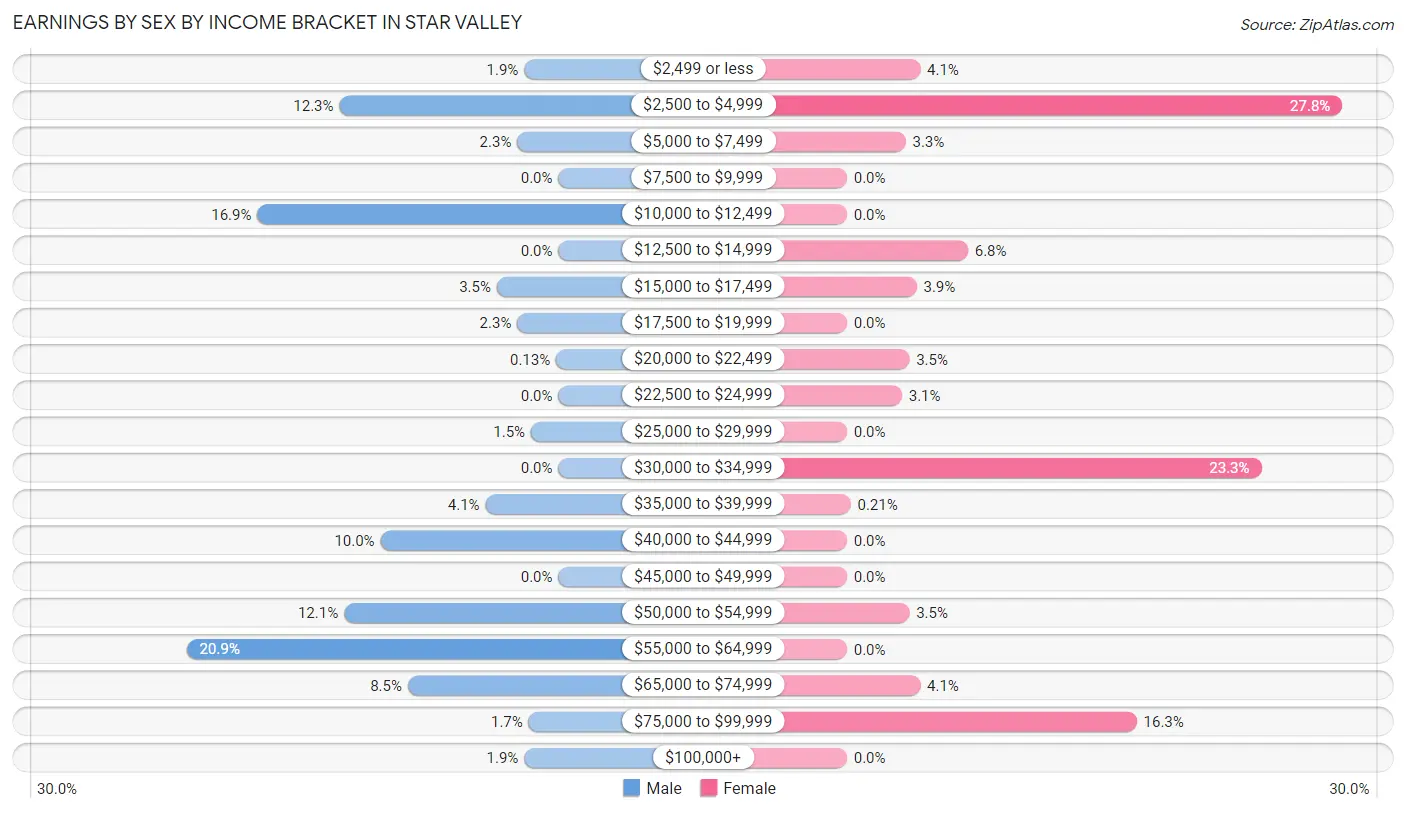
Earnings by Sex by Income Bracket in Star Valley
The most common earnings brackets in Star Valley are $55,000 to $64,999 for men (163 | 20.9%) and $2,500 to $4,999 for women (135 | 27.8%).
| Income | Male | Female |
| $2,499 or less | 15 (1.9%) | 20 (4.1%) |
| $2,500 to $4,999 | 96 (12.3%) | 135 (27.8%) |
| $5,000 to $7,499 | 18 (2.3%) | 16 (3.3%) |
| $7,500 to $9,999 | 0 (0.0%) | 0 (0.0%) |
| $10,000 to $12,499 | 132 (16.9%) | 0 (0.0%) |
| $12,500 to $14,999 | 0 (0.0%) | 33 (6.8%) |
| $15,000 to $17,499 | 27 (3.5%) | 19 (3.9%) |
| $17,500 to $19,999 | 18 (2.3%) | 0 (0.0%) |
| $20,000 to $22,499 | 1 (0.1%) | 17 (3.5%) |
| $22,500 to $24,999 | 0 (0.0%) | 15 (3.1%) |
| $25,000 to $29,999 | 12 (1.5%) | 0 (0.0%) |
| $30,000 to $34,999 | 0 (0.0%) | 113 (23.3%) |
| $35,000 to $39,999 | 32 (4.1%) | 1 (0.2%) |
| $40,000 to $44,999 | 78 (10.0%) | 0 (0.0%) |
| $45,000 to $49,999 | 0 (0.0%) | 0 (0.0%) |
| $50,000 to $54,999 | 94 (12.0%) | 17 (3.5%) |
| $55,000 to $64,999 | 163 (20.9%) | 0 (0.0%) |
| $65,000 to $74,999 | 66 (8.5%) | 20 (4.1%) |
| $75,000 to $99,999 | 13 (1.7%) | 79 (16.3%) |
| $100,000+ | 15 (1.9%) | 0 (0.0%) |
| Total | 780 (100.0%) | 485 (100.0%) |
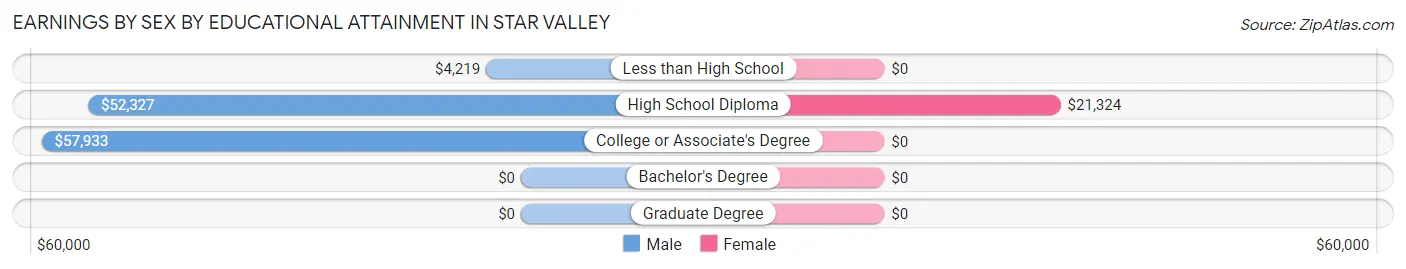
Earnings by Sex by Educational Attainment in Star Valley
| Educational Attainment | Male Income | Female Income |
| Less than High School | $4,219 | $0 |
| High School Diploma | $52,327 | $21,324 |
| College or Associate's Degree | $57,933 | $0 |
| Bachelor's Degree | - | - |
| Graduate Degree | - | - |
| Total | $50,625 | $0 |
Family Income in Star Valley
Family Income Brackets in Star Valley
According to the Star Valley family income data, there are 185 families falling into the $100,000 to $149,999 income range, which is the most common income bracket and makes up 28.8% of all families.
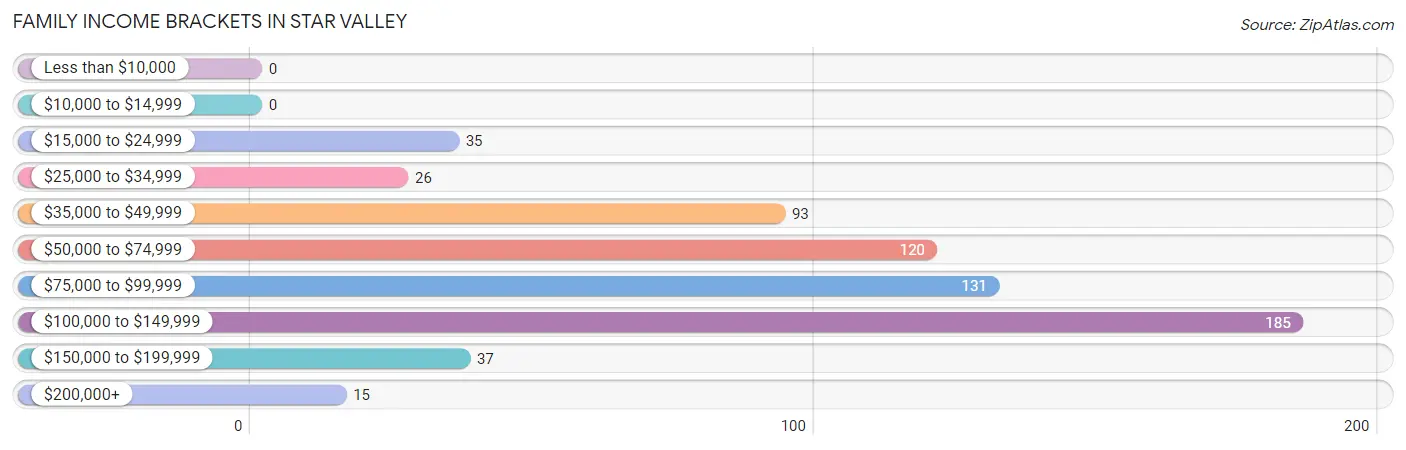
| Income Bracket | # Families | % Families |
| Less than $10,000 | 0 | 0.0% |
| $10,000 to $14,999 | 0 | 0.0% |
| $15,000 to $24,999 | 35 | 5.5% |
| $25,000 to $34,999 | 26 | 4.0% |
| $35,000 to $49,999 | 93 | 14.5% |
| $50,000 to $74,999 | 120 | 18.7% |
| $75,000 to $99,999 | 131 | 20.4% |
| $100,000 to $149,999 | 185 | 28.8% |
| $150,000 to $199,999 | 37 | 5.8% |
| $200,000+ | 15 | 2.3% |
Family Income by Famaliy Size in Star Valley
3-person families (72 | 11.2%) account for the highest median family income in Star Valley with $94,583 per family, while 2-person families (555 | 86.5%) have the highest median income of $41,298 per family member.
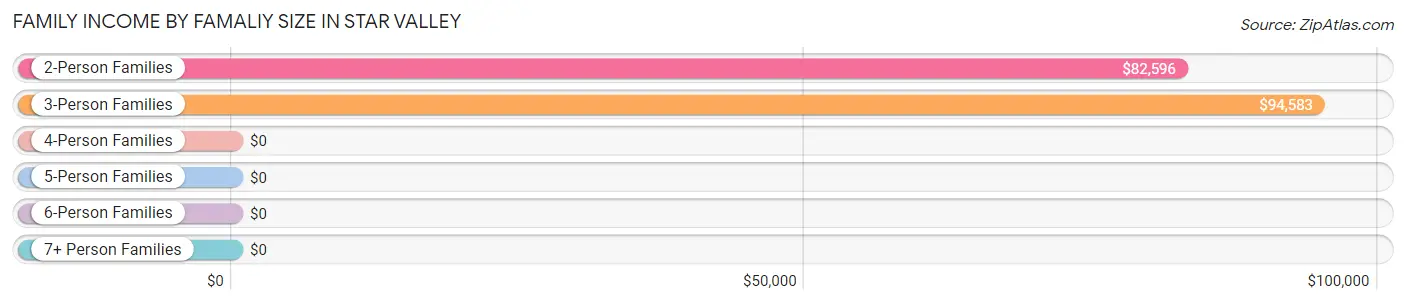
| Income Bracket | # Families | Median Income |
| 2-Person Families | 555 (86.5%) | $82,596 |
| 3-Person Families | 72 (11.2%) | $94,583 |
| 4-Person Families | 15 (2.3%) | $0 |
| 5-Person Families | 0 (0.0%) | $0 |
| 6-Person Families | 0 (0.0%) | $0 |
| 7+ Person Families | 0 (0.0%) | $0 |
| Total | 642 (100.0%) | $83,352 |
Family Income by Number of Earners in Star Valley
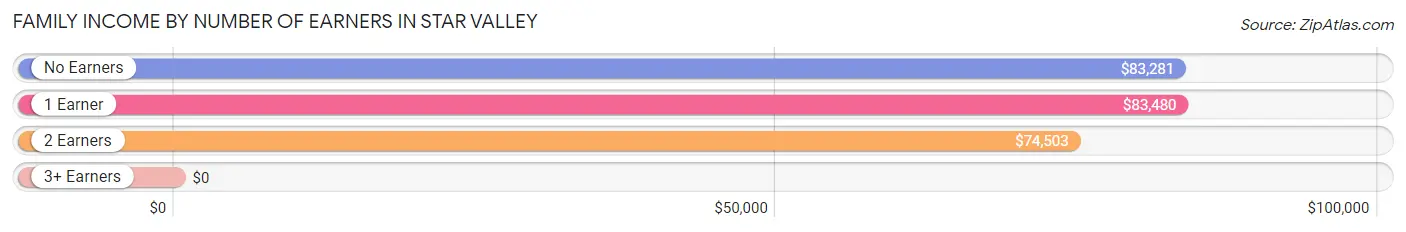
| Number of Earners | # Families | Median Income |
| No Earners | 211 (32.9%) | $83,281 |
| 1 Earner | 142 (22.1%) | $83,480 |
| 2 Earners | 259 (40.3%) | $74,503 |
| 3+ Earners | 30 (4.7%) | $0 |
| Total | 642 (100.0%) | $83,352 |
Household Income in Star Valley
Household Income Brackets in Star Valley
With 357 households falling in the category, the $50,000 to $74,999 income range is the most frequent in Star Valley, accounting for 23.4% of all households. In contrast, only 37 households (2.4%) fall into the $150,000 to $199,999 income bracket, making it the least populous group.
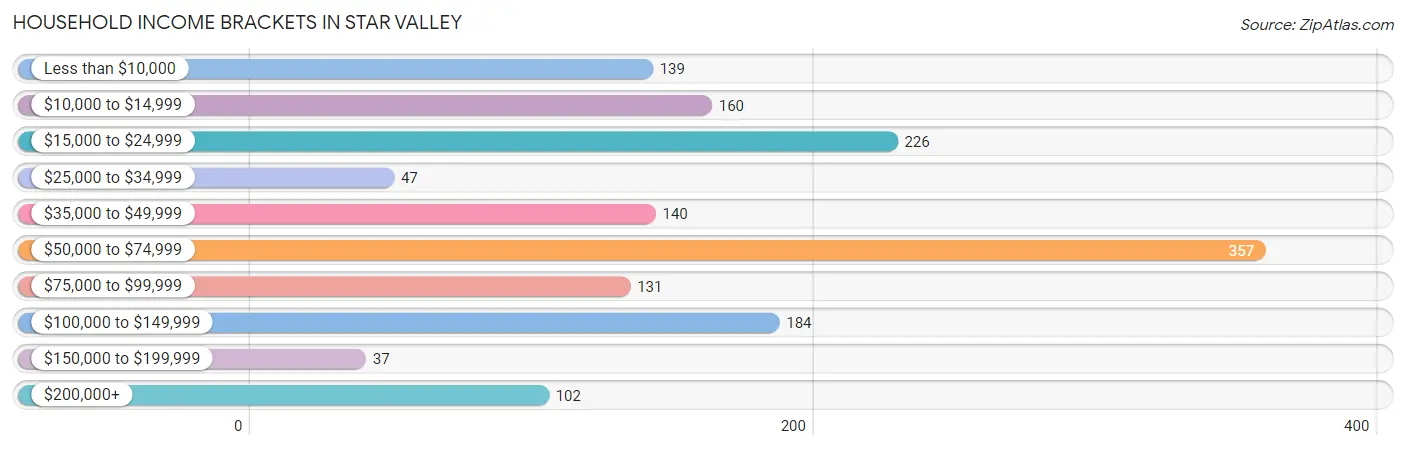
| Income Bracket | # Households | % Households |
| Less than $10,000 | 139 | 9.1% |
| $10,000 to $14,999 | 160 | 10.5% |
| $15,000 to $24,999 | 226 | 14.8% |
| $25,000 to $34,999 | 47 | 3.1% |
| $35,000 to $49,999 | 140 | 9.2% |
| $50,000 to $74,999 | 357 | 23.4% |
| $75,000 to $99,999 | 131 | 8.6% |
| $100,000 to $149,999 | 184 | 12.1% |
| $150,000 to $199,999 | 37 | 2.4% |
| $200,000+ | 102 | 6.7% |
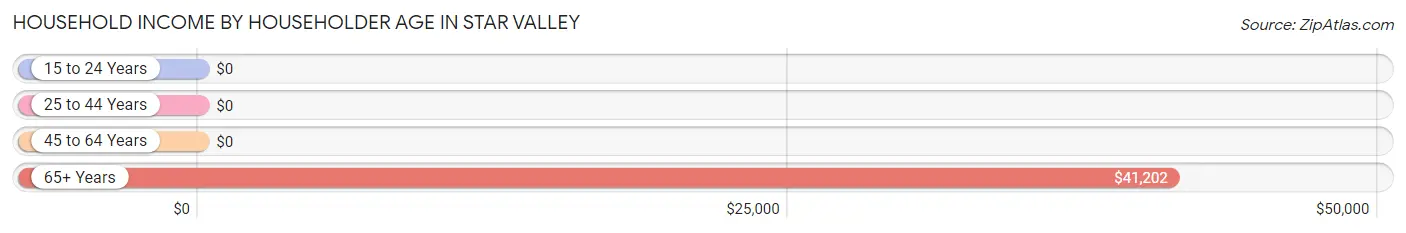
Household Income by Householder Age in Star Valley
The median household income in Star Valley is $62,603, with the highest median household income of $41,202 found in the 65+ years age bracket for the primary householder. A total of 914 households (60.0%) fall into this category.
| Income Bracket | # Households | Median Income |
| 15 to 24 Years | 0 (0.0%) | $0 |
| 25 to 44 Years | 163 (10.7%) | $0 |
| 45 to 64 Years | 447 (29.3%) | $0 |
| 65+ Years | 914 (60.0%) | $41,202 |
| Total | 1,524 (100.0%) | $62,603 |
Poverty in Star Valley
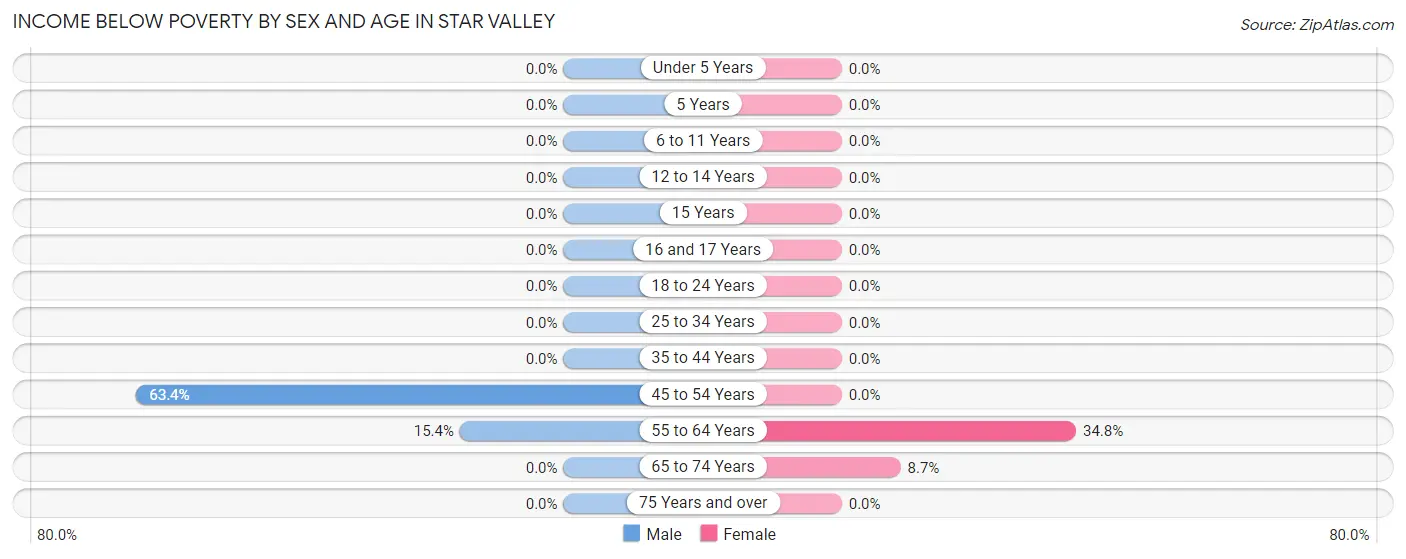
Income Below Poverty by Sex and Age in Star Valley
With 9.8% poverty level for males and 15.4% for females among the residents of Star Valley, 45 to 54 year old males and 55 to 64 year old females are the most vulnerable to poverty, with 97 males (63.4%) and 128 females (34.8%) in their respective age groups living below the poverty level.
| Age Bracket | Male | Female |
| Under 5 Years | 0 (0.0%) | 0 (0.0%) |
| 5 Years | 0 (0.0%) | 0 (0.0%) |
| 6 to 11 Years | 0 (0.0%) | 0 (0.0%) |
| 12 to 14 Years | 0 (0.0%) | 0 (0.0%) |
| 15 Years | 0 (0.0%) | 0 (0.0%) |
| 16 and 17 Years | 0 (0.0%) | 0 (0.0%) |
| 18 to 24 Years | 0 (0.0%) | 0 (0.0%) |
| 25 to 34 Years | 0 (0.0%) | 0 (0.0%) |
| 35 to 44 Years | 0 (0.0%) | 0 (0.0%) |
| 45 to 54 Years | 97 (63.4%) | 0 (0.0%) |
| 55 to 64 Years | 44 (15.4%) | 128 (34.8%) |
| 65 to 74 Years | 0 (0.0%) | 33 (8.7%) |
| 75 Years and over | 0 (0.0%) | 0 (0.0%) |
| Total | 141 (9.8%) | 161 (15.4%) |
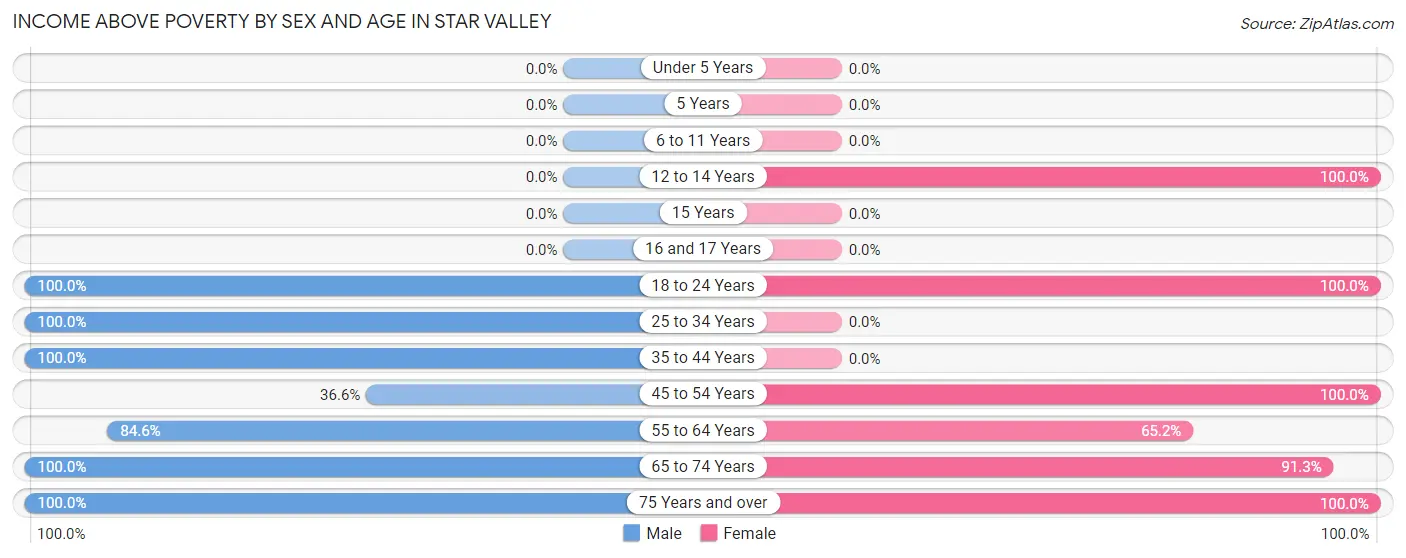
Income Above Poverty by Sex and Age in Star Valley
According to the poverty statistics in Star Valley, males aged 18 to 24 years and females aged 12 to 14 years are the age groups that are most secure financially, with 100.0% of males and 100.0% of females in these age groups living above the poverty line.
| Age Bracket | Male | Female |
| Under 5 Years | 0 (0.0%) | 0 (0.0%) |
| 5 Years | 0 (0.0%) | 0 (0.0%) |
| 6 to 11 Years | 0 (0.0%) | 0 (0.0%) |
| 12 to 14 Years | 0 (0.0%) | 17 (100.0%) |
| 15 Years | 0 (0.0%) | 0 (0.0%) |
| 16 and 17 Years | 0 (0.0%) | 0 (0.0%) |
| 18 to 24 Years | 125 (100.0%) | 39 (100.0%) |
| 25 to 34 Years | 195 (100.0%) | 0 (0.0%) |
| 35 to 44 Years | 15 (100.0%) | 0 (0.0%) |
| 45 to 54 Years | 56 (36.6%) | 33 (100.0%) |
| 55 to 64 Years | 242 (84.6%) | 240 (65.2%) |
| 65 to 74 Years | 398 (100.0%) | 345 (91.3%) |
| 75 Years and over | 270 (100.0%) | 213 (100.0%) |
| Total | 1,301 (90.2%) | 887 (84.6%) |
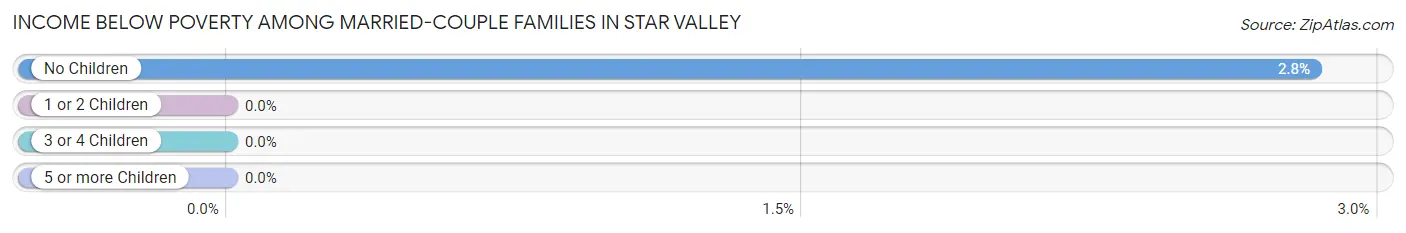
Income Below Poverty Among Married-Couple Families in Star Valley
The poverty statistics for married-couple families in Star Valley show that 2.8% or 17 of the total 618 families live below the poverty line. Families with no children have the highest poverty rate of 2.8%, comprising of 17 families. On the other hand, families with 1 or 2 children have the lowest poverty rate of 0.0%, which includes 0 families.
| Children | Above Poverty | Below Poverty |
| No Children | 584 (97.2%) | 17 (2.8%) |
| 1 or 2 Children | 17 (100.0%) | 0 (0.0%) |
| 3 or 4 Children | 0 (0.0%) | 0 (0.0%) |
| 5 or more Children | 0 (0.0%) | 0 (0.0%) |
| Total | 601 (97.3%) | 17 (2.8%) |
Income Below Poverty Among Single-Parent Households in Star Valley
| Children | Single Father | Single Mother |
| No Children | 0 (0.0%) | 0 (0.0%) |
| 1 or 2 Children | 0 (0.0%) | 0 (0.0%) |
| 3 or 4 Children | 0 (0.0%) | 0 (0.0%) |
| 5 or more Children | 0 (0.0%) | 0 (0.0%) |
| Total | 0 (0.0%) | 0 (0.0%) |
Income Below Poverty Among Married-Couple vs Single-Parent Households in Star Valley
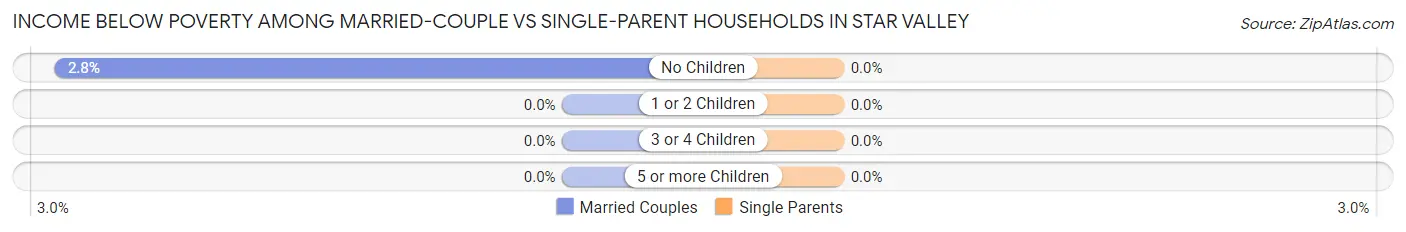
| Children | Married-Couple Families | Single-Parent Households |
| No Children | 17 (2.8%) | 0 (0.0%) |
| 1 or 2 Children | 0 (0.0%) | 0 (0.0%) |
| 3 or 4 Children | 0 (0.0%) | 0 (0.0%) |
| 5 or more Children | 0 (0.0%) | 0 (0.0%) |
| Total | 17 (2.8%) | 0 (0.0%) |
Race in Star Valley
The most populous races in Star Valley are White / Caucasian (2,290 | 92.0%), Two or more Races (186 | 7.5%), and Hispanic or Latino (146 | 5.9%).
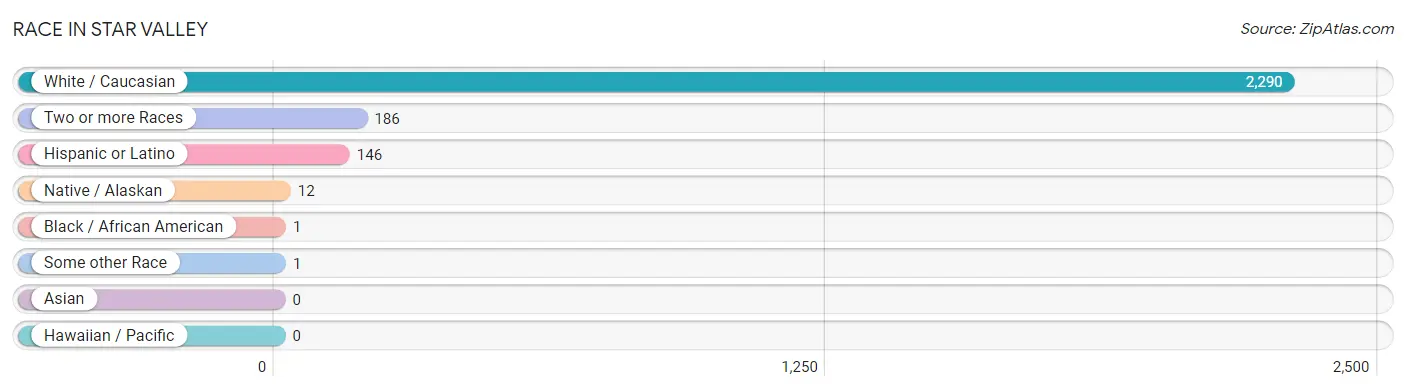
| Race | # Population | % Population |
| Asian | 0 | 0.0% |
| Black / African American | 1 | 0.0% |
| Hawaiian / Pacific | 0 | 0.0% |
| Hispanic or Latino | 146 | 5.9% |
| Native / Alaskan | 12 | 0.5% |
| White / Caucasian | 2,290 | 92.0% |
| Two or more Races | 186 | 7.5% |
| Some other Race | 1 | 0.0% |
| Total | 2,490 | 100.0% |
Ancestry in Star Valley
The most populous ancestries reported in Star Valley are English (568 | 22.8%), German (338 | 13.6%), Irish (332 | 13.3%), Italian (159 | 6.4%), and Mexican (146 | 5.9%), together accounting for 62.0% of all Star Valley residents.
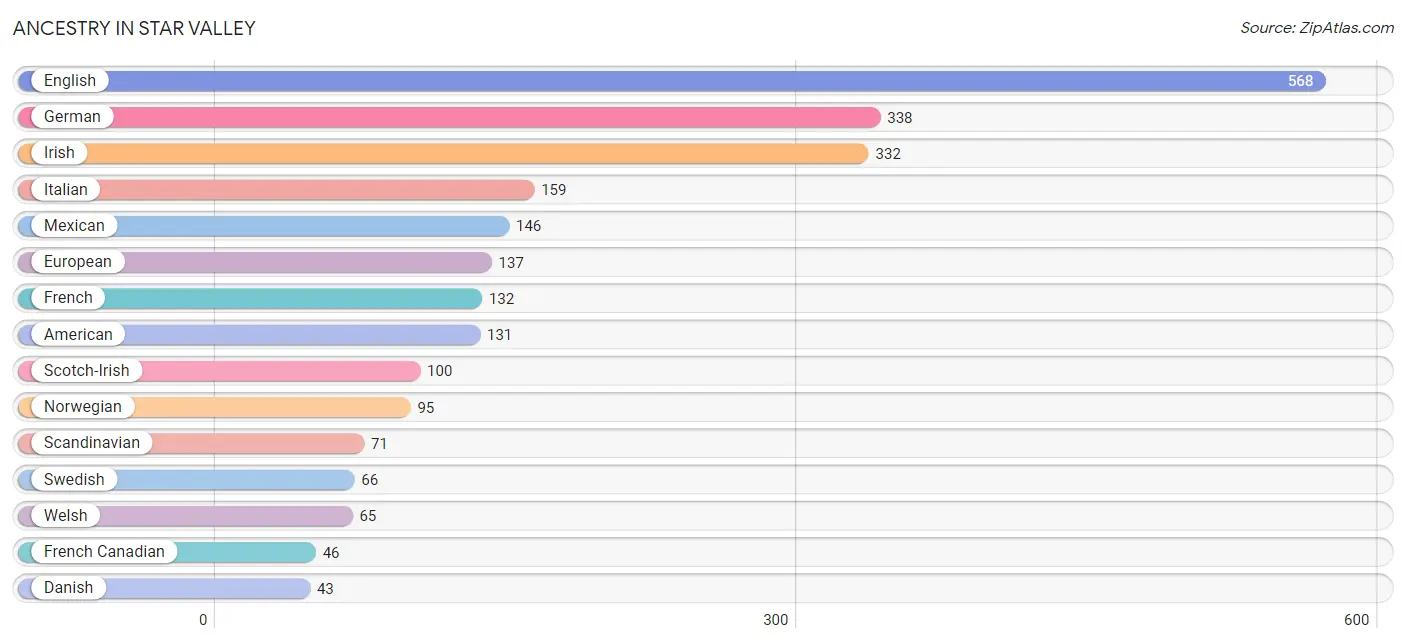
| Ancestry | # Population | % Population |
| American | 131 | 5.3% |
| Austrian | 18 | 0.7% |
| Cherokee | 41 | 1.7% |
| Danish | 43 | 1.7% |
| Dutch | 18 | 0.7% |
| English | 568 | 22.8% |
| European | 137 | 5.5% |
| French | 132 | 5.3% |
| French Canadian | 46 | 1.8% |
| German | 338 | 13.6% |
| Hungarian | 23 | 0.9% |
| Irish | 332 | 13.3% |
| Italian | 159 | 6.4% |
| Mexican | 146 | 5.9% |
| Norwegian | 95 | 3.8% |
| Pima | 32 | 1.3% |
| Polish | 19 | 0.8% |
| Scandinavian | 71 | 2.9% |
| Scotch-Irish | 100 | 4.0% |
| Scottish | 17 | 0.7% |
| Sioux | 12 | 0.5% |
| Swedish | 66 | 2.6% |
| Welsh | 65 | 2.6% | View All 23 Rows |
Immigrants in Star Valley

| Immigration Origin | # Population | % Population | View All 0 Rows |
Sex and Age in Star Valley
Sex and Age in Star Valley
The most populous age groups in Star Valley are 60 to 64 Years (230 | 16.0%) for men and 65 to 69 Years (315 | 30.1%) for women.
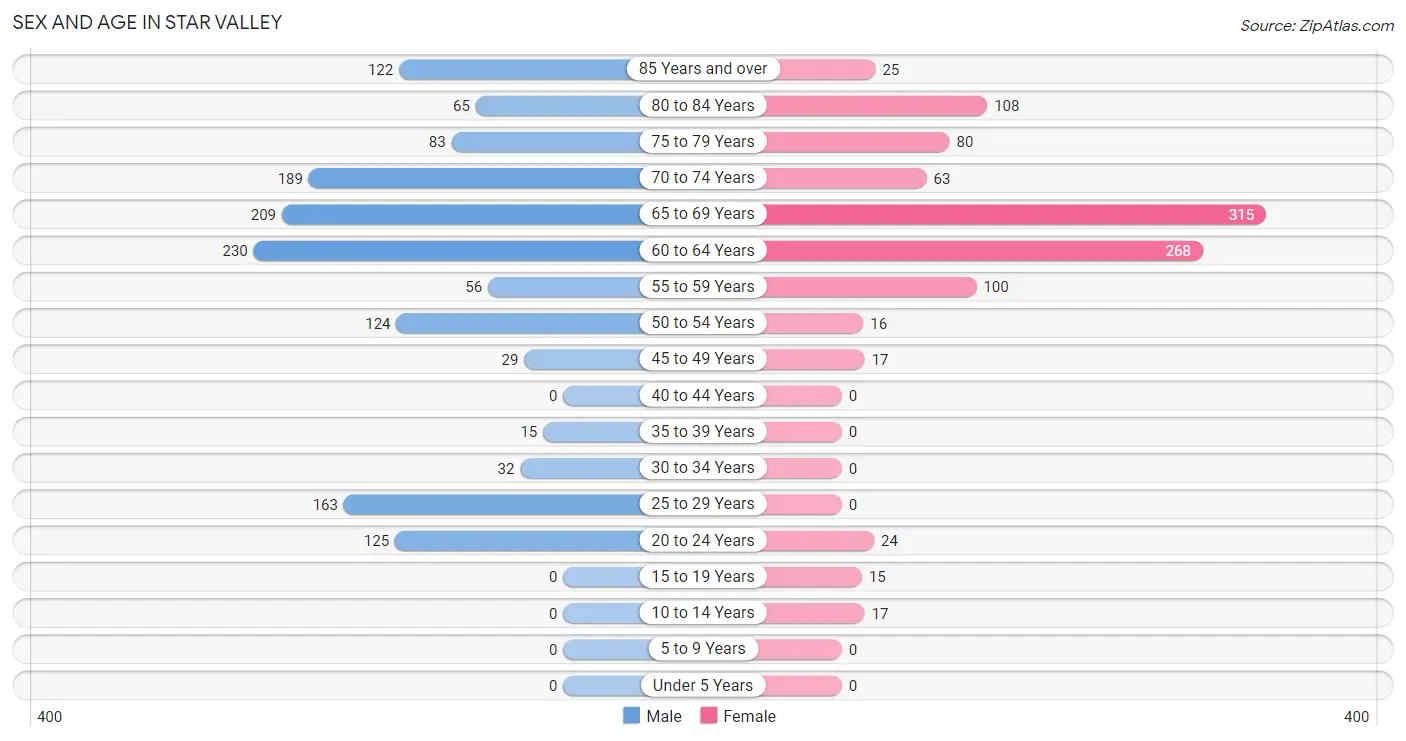
| Age Bracket | Male | Female |
| Under 5 Years | 0 (0.0%) | 0 (0.0%) |
| 5 to 9 Years | 0 (0.0%) | 0 (0.0%) |
| 10 to 14 Years | 0 (0.0%) | 17 (1.6%) |
| 15 to 19 Years | 0 (0.0%) | 15 (1.4%) |
| 20 to 24 Years | 125 (8.7%) | 24 (2.3%) |
| 25 to 29 Years | 163 (11.3%) | 0 (0.0%) |
| 30 to 34 Years | 32 (2.2%) | 0 (0.0%) |
| 35 to 39 Years | 15 (1.0%) | 0 (0.0%) |
| 40 to 44 Years | 0 (0.0%) | 0 (0.0%) |
| 45 to 49 Years | 29 (2.0%) | 17 (1.6%) |
| 50 to 54 Years | 124 (8.6%) | 16 (1.5%) |
| 55 to 59 Years | 56 (3.9%) | 100 (9.5%) |
| 60 to 64 Years | 230 (16.0%) | 268 (25.6%) |
| 65 to 69 Years | 209 (14.5%) | 315 (30.1%) |
| 70 to 74 Years | 189 (13.1%) | 63 (6.0%) |
| 75 to 79 Years | 83 (5.8%) | 80 (7.6%) |
| 80 to 84 Years | 65 (4.5%) | 108 (10.3%) |
| 85 Years and over | 122 (8.5%) | 25 (2.4%) |
| Total | 1,442 (100.0%) | 1,048 (100.0%) |
Families and Households in Star Valley
Median Family Size in Star Valley
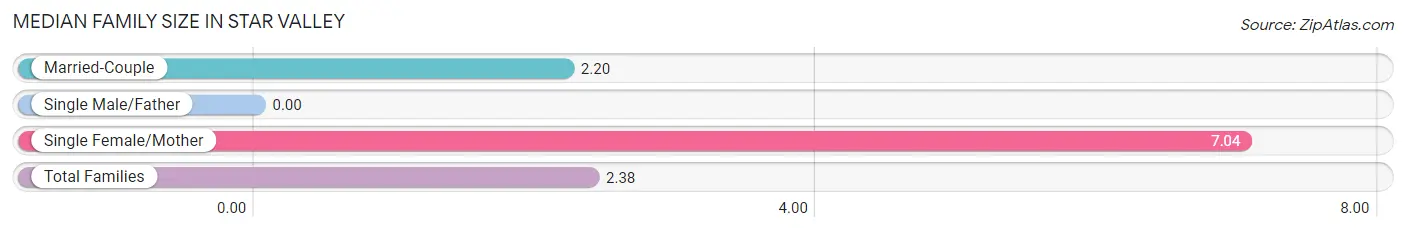
| Family Type | # Families | Family Size |
| Married-Couple | 618 (96.3%) | 2.20 |
| Single Male/Father | 0 (0.0%) | - |
| Single Female/Mother | 24 (3.7%) | 7.04 |
| Total Families | 642 (100.0%) | 2.38 |
Median Household Size in Star Valley
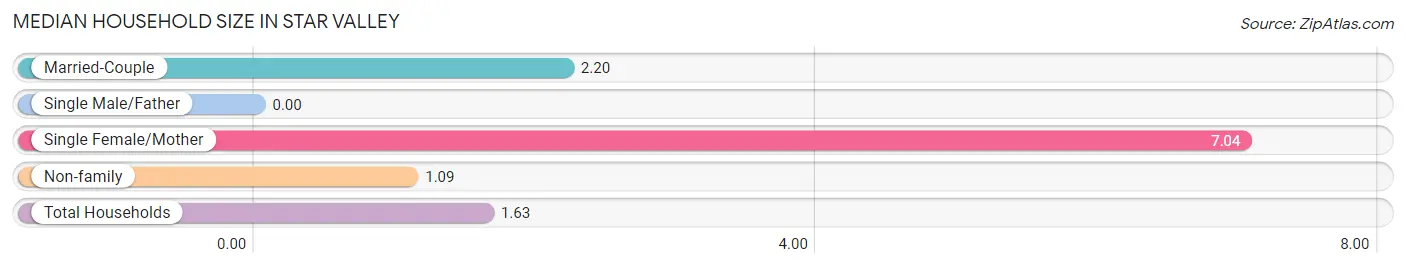
| Household Type | # Households | Household Size |
| Married-Couple | 618 (40.6%) | 2.20 |
| Single Male/Father | 0 (0.0%) | - |
| Single Female/Mother | 24 (1.6%) | 7.04 |
| Non-family | 882 (57.9%) | 1.09 |
| Total Households | 1,524 (100.0%) | 1.63 |
Household Size by Marriage Status in Star Valley
Out of a total of 1,524 households in Star Valley, 642 (42.1%) are family households, while 882 (57.9%) are nonfamily households. The most numerous type of family households are 2-person households, comprising 555, and the most common type of nonfamily households are 1-person households, comprising 859.
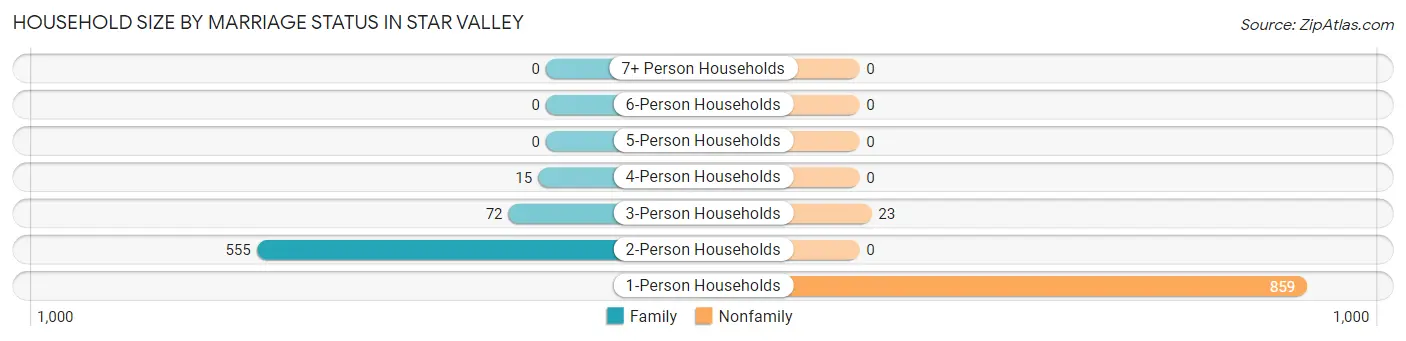
| Household Size | Family Households | Nonfamily Households |
| 1-Person Households | - | 859 (56.4%) |
| 2-Person Households | 555 (36.4%) | 0 (0.0%) |
| 3-Person Households | 72 (4.7%) | 23 (1.5%) |
| 4-Person Households | 15 (1.0%) | 0 (0.0%) |
| 5-Person Households | 0 (0.0%) | 0 (0.0%) |
| 6-Person Households | 0 (0.0%) | 0 (0.0%) |
| 7+ Person Households | 0 (0.0%) | 0 (0.0%) |
| Total | 642 (42.1%) | 882 (57.9%) |
Female Fertility in Star Valley
Fertility by Age in Star Valley
| Age Bracket | Women with Births | Births / 1,000 Women |
| 15 to 19 years | 0 (0.0%) | 0.0 |
| 20 to 34 years | 0 (0.0%) | 0.0 |
| 35 to 50 years | 0 (0.0%) | 0.0 |
| Total | 0 (0.0%) | 0.0 |
Fertility by Age by Marriage Status in Star Valley
| Age Bracket | Married | Unmarried |
| 15 to 19 years | 0 (0.0%) | 0 (0.0%) |
| 20 to 34 years | 0 (0.0%) | 0 (0.0%) |
| 35 to 50 years | 0 (0.0%) | 0 (0.0%) |
| Total | 0 (0.0%) | 0 (0.0%) |
Fertility by Education in Star Valley
| Educational Attainment | Women with Births | Births / 1,000 Women |
| Less than High School | 0 (0.0%) | 0.0 |
| High School Diploma | 0 (0.0%) | 0.0 |
| College or Associate's Degree | 0 (0.0%) | 0.0 |
| Bachelor's Degree | 0 (0.0%) | 0.0 |
| Graduate Degree | 0 (0.0%) | 0.0 |
| Total | 0 (0.0%) | 0.0 |
Fertility by Education by Marriage Status in Star Valley
| Educational Attainment | Married | Unmarried |
| Less than High School | 0 (0.0%) | 0 (0.0%) |
| High School Diploma | 0 (0.0%) | 0 (0.0%) |
| College or Associate's Degree | 0 (0.0%) | 0 (0.0%) |
| Bachelor's Degree | 0 (0.0%) | 0 (0.0%) |
| Graduate Degree | 0 (0.0%) | 0 (0.0%) |
| Total | 0 (0.0%) | 0 (0.0%) |
Employment Characteristics in Star Valley
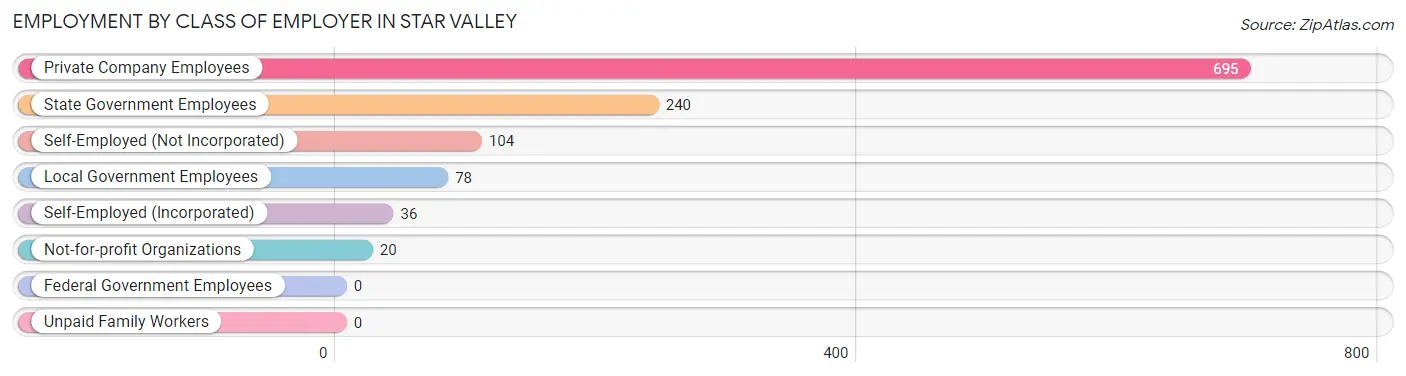
Employment by Class of Employer in Star Valley
Among the 1,173 employed individuals in Star Valley, private company employees (695 | 59.3%), state government employees (240 | 20.5%), and self-employed (not incorporated) (104 | 8.9%) make up the most common classes of employment.
| Employer Class | # Employees | % Employees |
| Private Company Employees | 695 | 59.3% |
| Self-Employed (Incorporated) | 36 | 3.1% |
| Self-Employed (Not Incorporated) | 104 | 8.9% |
| Not-for-profit Organizations | 20 | 1.7% |
| Local Government Employees | 78 | 6.7% |
| State Government Employees | 240 | 20.5% |
| Federal Government Employees | 0 | 0.0% |
| Unpaid Family Workers | 0 | 0.0% |
| Total | 1,173 | 100.0% |
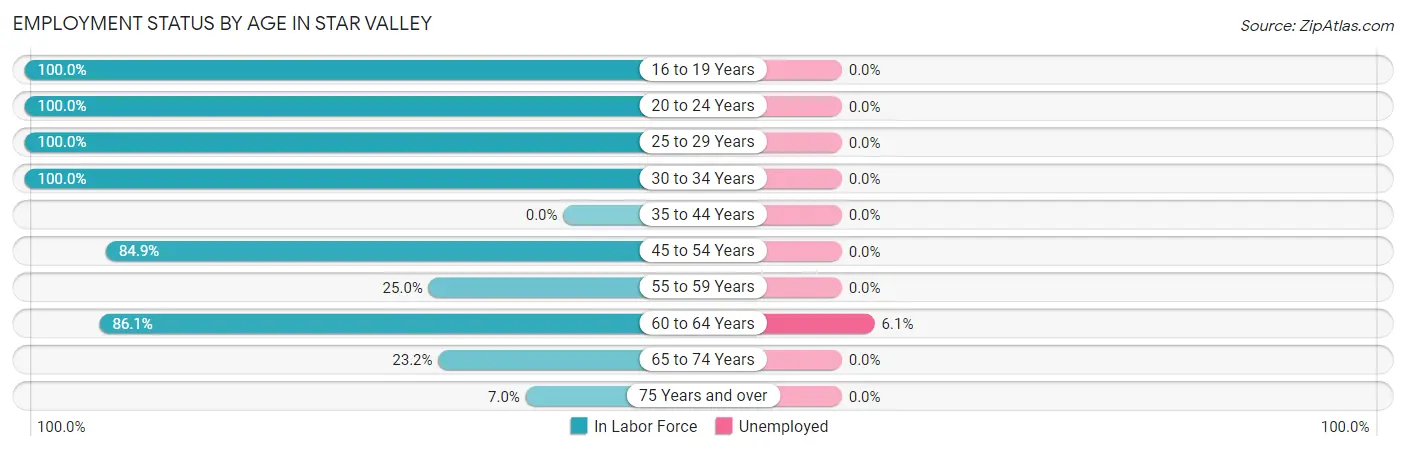
Employment Status by Age in Star Valley
According to the labor force statistics for Star Valley, out of the total population over 16 years of age (2,473), 48.5% or 1,199 individuals are in the labor force, with 2.2% or 26 of them unemployed. The age group with the highest labor force participation rate is 16 to 19 years, with 100.0% or 15 individuals in the labor force. Within the labor force, the 60 to 64 years age range has the highest percentage of unemployed individuals, with 6.1% or 26 of them being unemployed.
| Age Bracket | In Labor Force | Unemployed |
| 16 to 19 Years | 15 (100.0%) | 0 (0.0%) |
| 20 to 24 Years | 149 (100.0%) | 0 (0.0%) |
| 25 to 29 Years | 163 (100.0%) | 0 (0.0%) |
| 30 to 34 Years | 32 (100.0%) | 0 (0.0%) |
| 35 to 44 Years | 0 (0.0%) | 0 (0.0%) |
| 45 to 54 Years | 158 (84.9%) | 0 (0.0%) |
| 55 to 59 Years | 39 (25.0%) | 0 (0.0%) |
| 60 to 64 Years | 429 (86.1%) | 26 (6.1%) |
| 65 to 74 Years | 180 (23.2%) | 0 (0.0%) |
| 75 Years and over | 34 (7.0%) | 0 (0.0%) |
| Total | 1,199 (48.5%) | 26 (2.2%) |
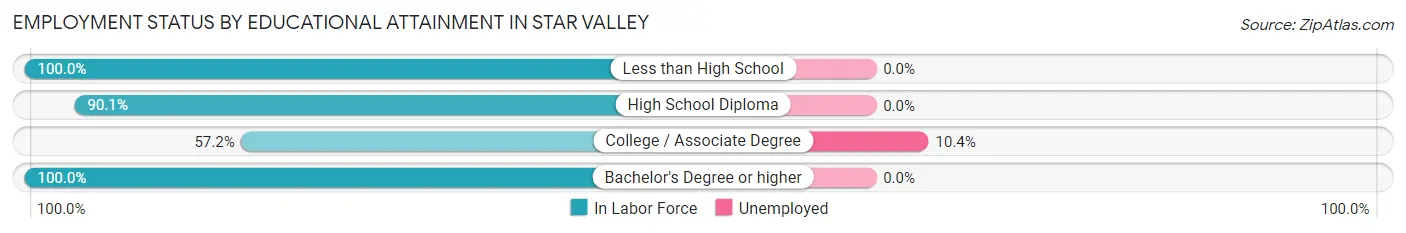
Employment Status by Educational Attainment in Star Valley
According to labor force statistics for Star Valley, 78.2% of individuals (821) out of the total population between 25 and 64 years of age (1,050) are in the labor force, with 3.2% or 26 of them being unemployed. The group with the highest labor force participation rate are those with the educational attainment of less than high school, with 100.0% or 133 individuals in the labor force. Within the labor force, individuals with college / associate degree education have the highest percentage of unemployment, with 10.4% or 26 of them being unemployed.
| Educational Attainment | In Labor Force | Unemployed |
| Less than High School | 133 (100.0%) | 0 (0.0%) |
| High School Diploma | 382 (90.1%) | 0 (0.0%) |
| College / Associate Degree | 250 (57.2%) | 45 (10.4%) |
| Bachelor's Degree or higher | 56 (100.0%) | 0 (0.0%) |
| Total | 821 (78.2%) | 34 (3.2%) |
Employment Occupations by Sex in Star Valley
Management, Business, Science and Arts Occupations
The most common Management, Business, Science and Arts occupations in Star Valley are Management (123 | 10.5%), Community & Social Service (35 | 3.0%), Health Diagnosing & Treating (20 | 1.7%), Education, Arts & Media (19 | 1.6%), and Business & Financial (16 | 1.4%).
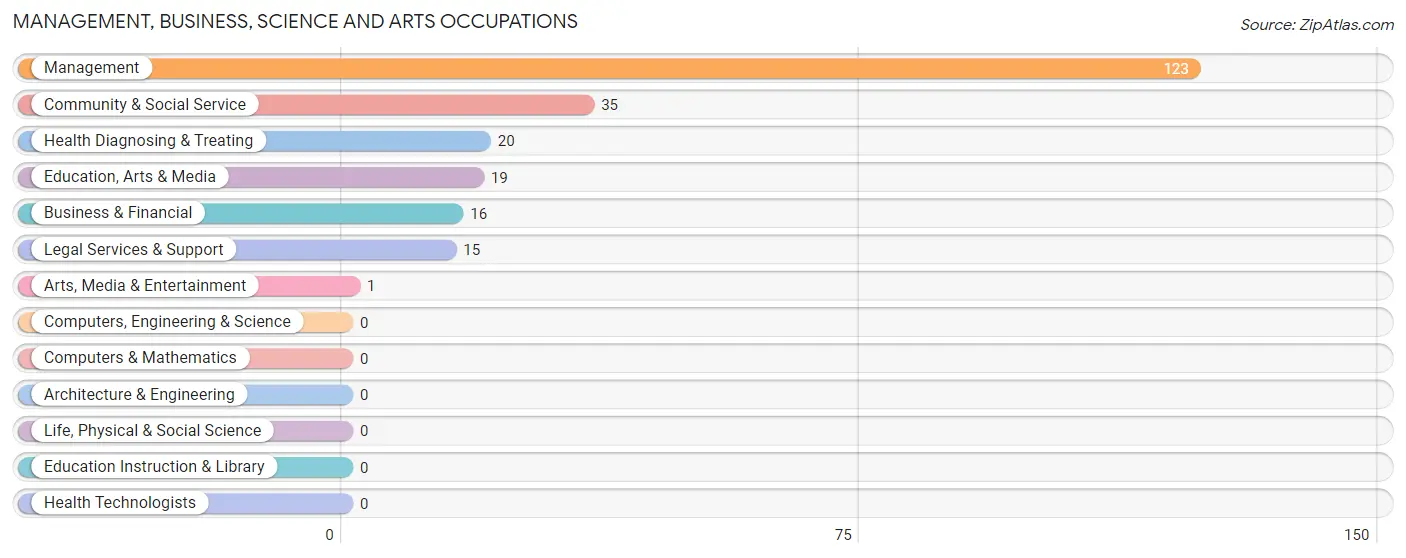
Management, Business, Science and Arts Occupations by Sex
Within the Management, Business, Science and Arts occupations in Star Valley, the most male-oriented occupations are Community & Social Service (100.0%), Education, Arts & Media (100.0%), and Legal Services & Support (100.0%), while the most female-oriented occupations are Business & Financial (100.0%), Health Diagnosing & Treating (100.0%), and Management (67.5%).
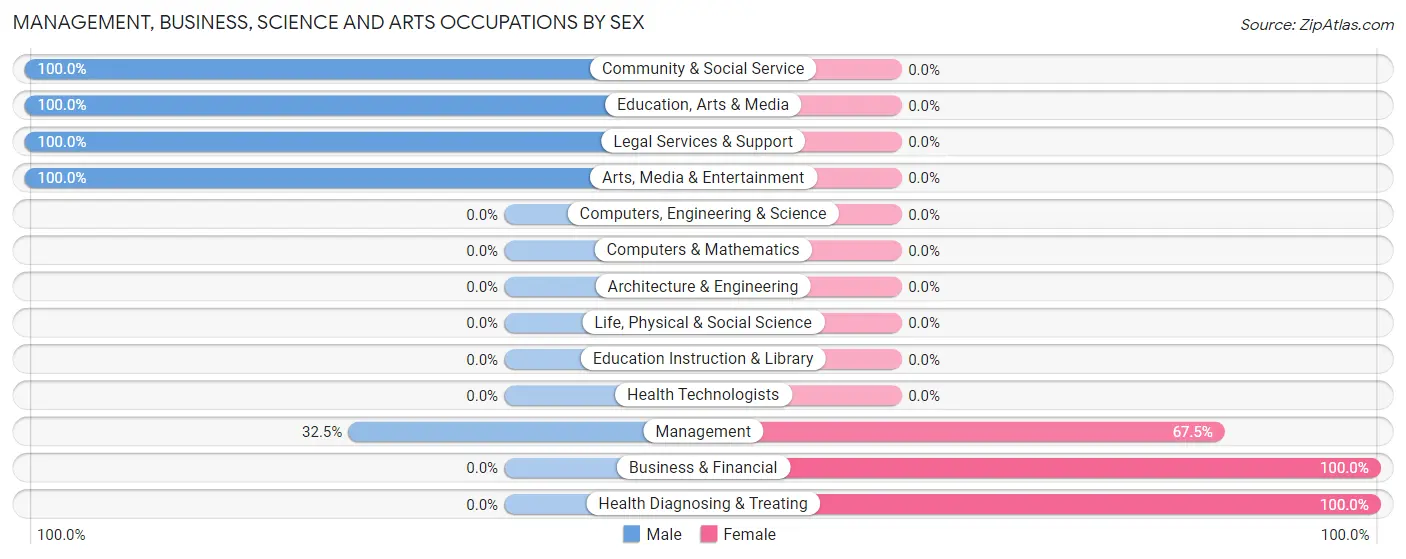
| Occupation | Male | Female |
| Management | 40 (32.5%) | 83 (67.5%) |
| Business & Financial | 0 (0.0%) | 16 (100.0%) |
| Computers, Engineering & Science | 0 (0.0%) | 0 (0.0%) |
| Computers & Mathematics | 0 (0.0%) | 0 (0.0%) |
| Architecture & Engineering | 0 (0.0%) | 0 (0.0%) |
| Life, Physical & Social Science | 0 (0.0%) | 0 (0.0%) |
| Community & Social Service | 35 (100.0%) | 0 (0.0%) |
| Education, Arts & Media | 19 (100.0%) | 0 (0.0%) |
| Legal Services & Support | 15 (100.0%) | 0 (0.0%) |
| Education Instruction & Library | 0 (0.0%) | 0 (0.0%) |
| Arts, Media & Entertainment | 1 (100.0%) | 0 (0.0%) |
| Health Diagnosing & Treating | 0 (0.0%) | 20 (100.0%) |
| Health Technologists | 0 (0.0%) | 0 (0.0%) |
| Total (Category) | 75 (38.7%) | 119 (61.3%) |
| Total (Overall) | 738 (62.9%) | 435 (37.1%) |
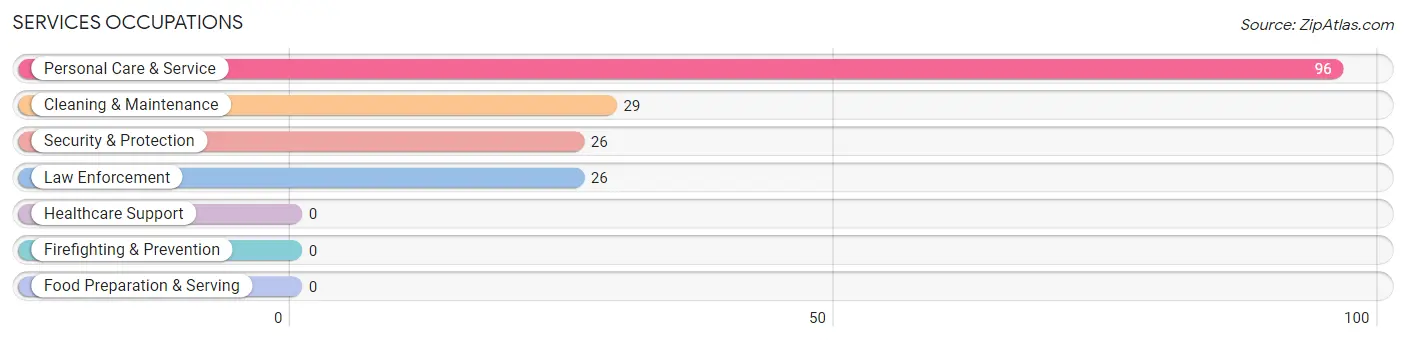
Services Occupations
The most common Services occupations in Star Valley are Personal Care & Service (96 | 8.2%), Cleaning & Maintenance (29 | 2.5%), Security & Protection (26 | 2.2%), and Law Enforcement (26 | 2.2%).
Services Occupations by Sex
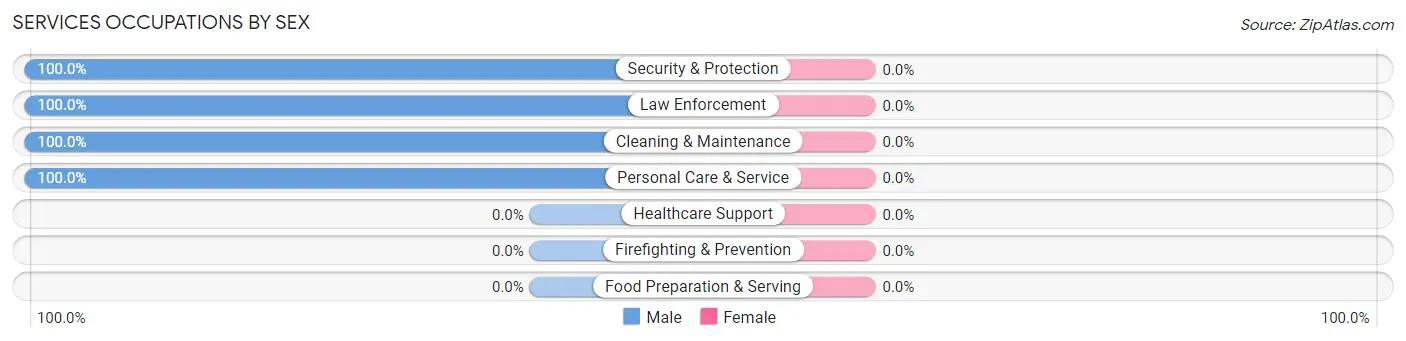
| Occupation | Male | Female |
| Healthcare Support | 0 (0.0%) | 0 (0.0%) |
| Security & Protection | 26 (100.0%) | 0 (0.0%) |
| Firefighting & Prevention | 0 (0.0%) | 0 (0.0%) |
| Law Enforcement | 26 (100.0%) | 0 (0.0%) |
| Food Preparation & Serving | 0 (0.0%) | 0 (0.0%) |
| Cleaning & Maintenance | 29 (100.0%) | 0 (0.0%) |
| Personal Care & Service | 96 (100.0%) | 0 (0.0%) |
| Total (Category) | 151 (100.0%) | 0 (0.0%) |
| Total (Overall) | 738 (62.9%) | 435 (37.1%) |
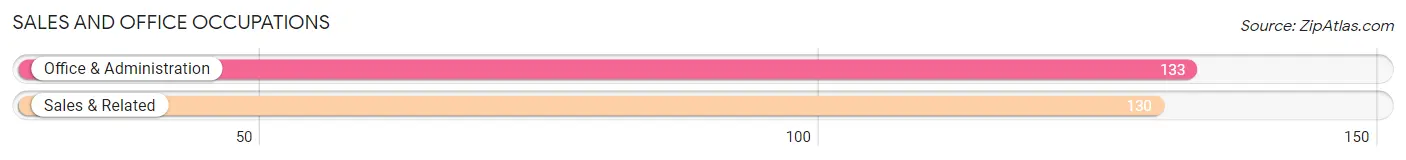
Sales and Office Occupations
The most common Sales and Office occupations in Star Valley are Office & Administration (133 | 11.3%), and Sales & Related (130 | 11.1%).
Sales and Office Occupations by Sex

| Occupation | Male | Female |
| Sales & Related | 60 (46.2%) | 70 (53.8%) |
| Office & Administration | 0 (0.0%) | 133 (100.0%) |
| Total (Category) | 60 (22.8%) | 203 (77.2%) |
| Total (Overall) | 738 (62.9%) | 435 (37.1%) |
Natural Resources, Construction and Maintenance Occupations
The most common Natural Resources, Construction and Maintenance occupations in Star Valley are Installation, Maintenance & Repair (155 | 13.2%), and Construction & Extraction (78 | 6.7%).
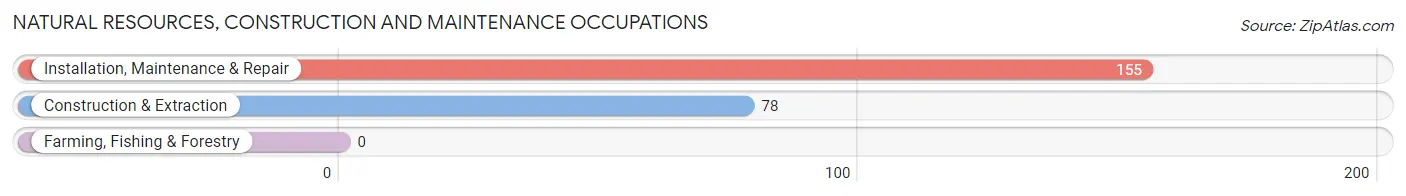
Natural Resources, Construction and Maintenance Occupations by Sex
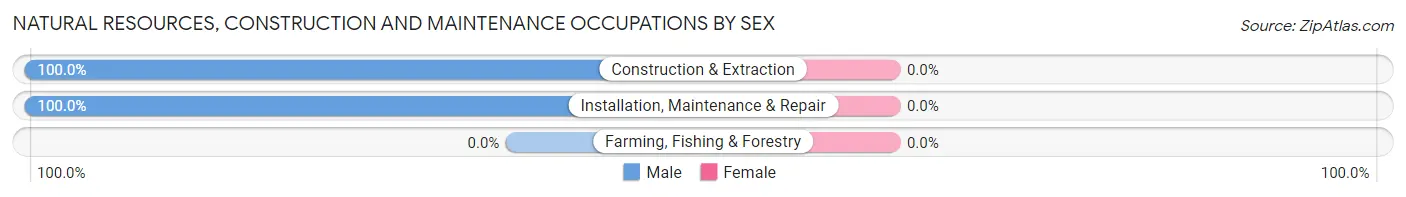
| Occupation | Male | Female |
| Farming, Fishing & Forestry | 0 (0.0%) | 0 (0.0%) |
| Construction & Extraction | 78 (100.0%) | 0 (0.0%) |
| Installation, Maintenance & Repair | 155 (100.0%) | 0 (0.0%) |
| Total (Category) | 233 (100.0%) | 0 (0.0%) |
| Total (Overall) | 738 (62.9%) | 435 (37.1%) |
Production, Transportation and Moving Occupations
The most common Production, Transportation and Moving occupations in Star Valley are Production (202 | 17.2%), Transportation (118 | 10.1%), and Material Moving (12 | 1.0%).
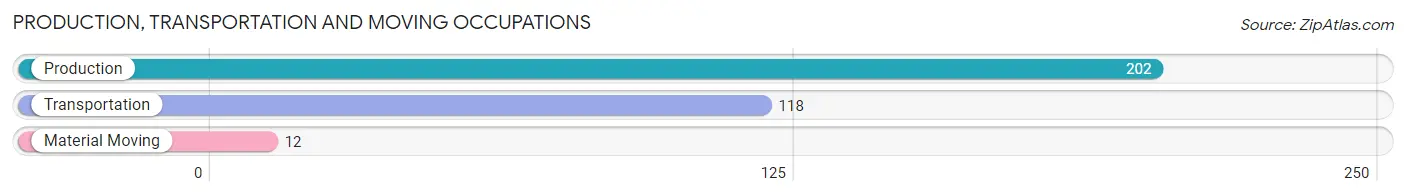
Production, Transportation and Moving Occupations by Sex
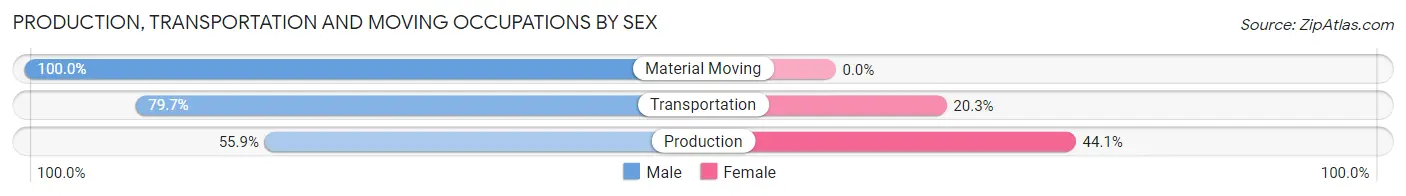
| Occupation | Male | Female |
| Production | 113 (55.9%) | 89 (44.1%) |
| Transportation | 94 (79.7%) | 24 (20.3%) |
| Material Moving | 12 (100.0%) | 0 (0.0%) |
| Total (Category) | 219 (66.0%) | 113 (34.0%) |
| Total (Overall) | 738 (62.9%) | 435 (37.1%) |
Employment Industries by Sex in Star Valley
Employment Industries in Star Valley
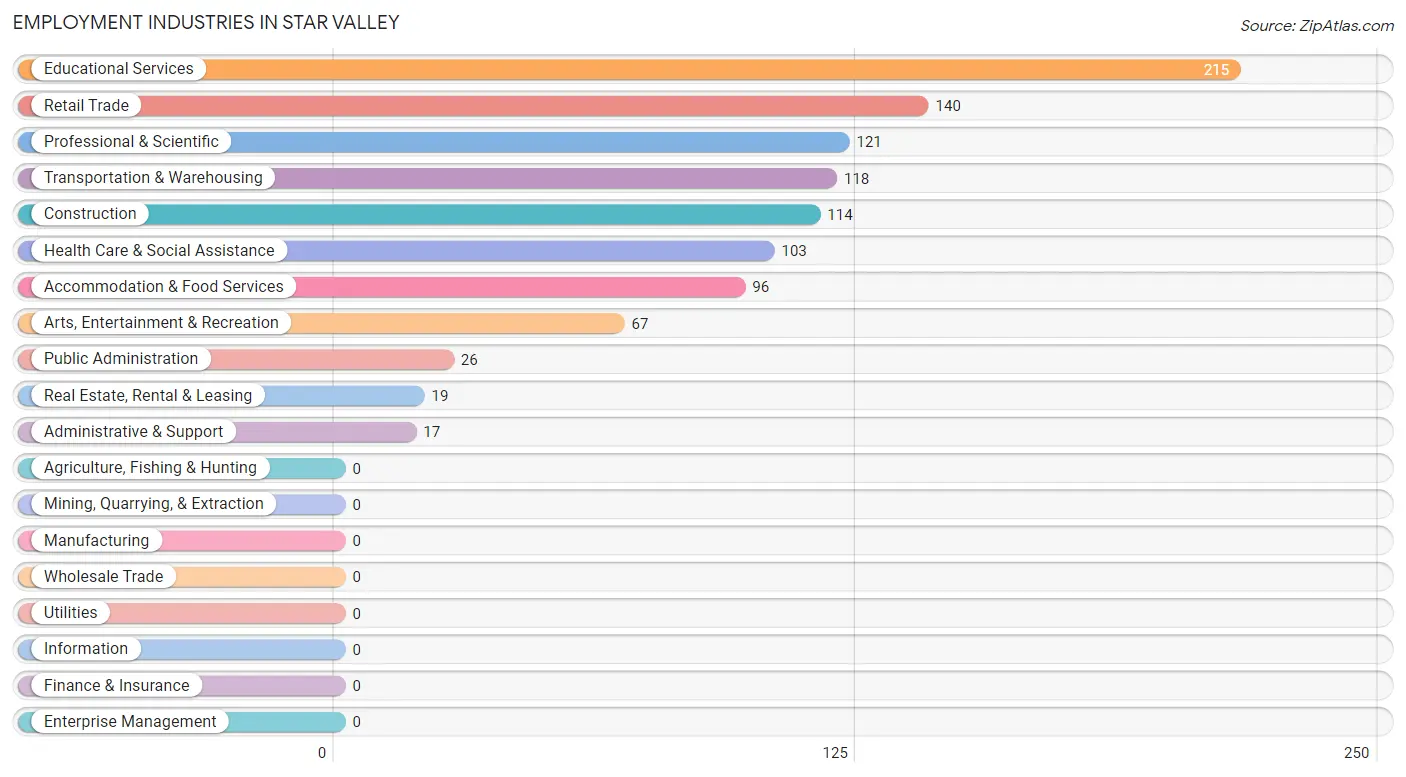
The major employment industries in Star Valley include Educational Services (215 | 18.3%), Retail Trade (140 | 11.9%), Professional & Scientific (121 | 10.3%), Transportation & Warehousing (118 | 10.1%), and Construction (114 | 9.7%).
Employment Industries by Sex in Star Valley
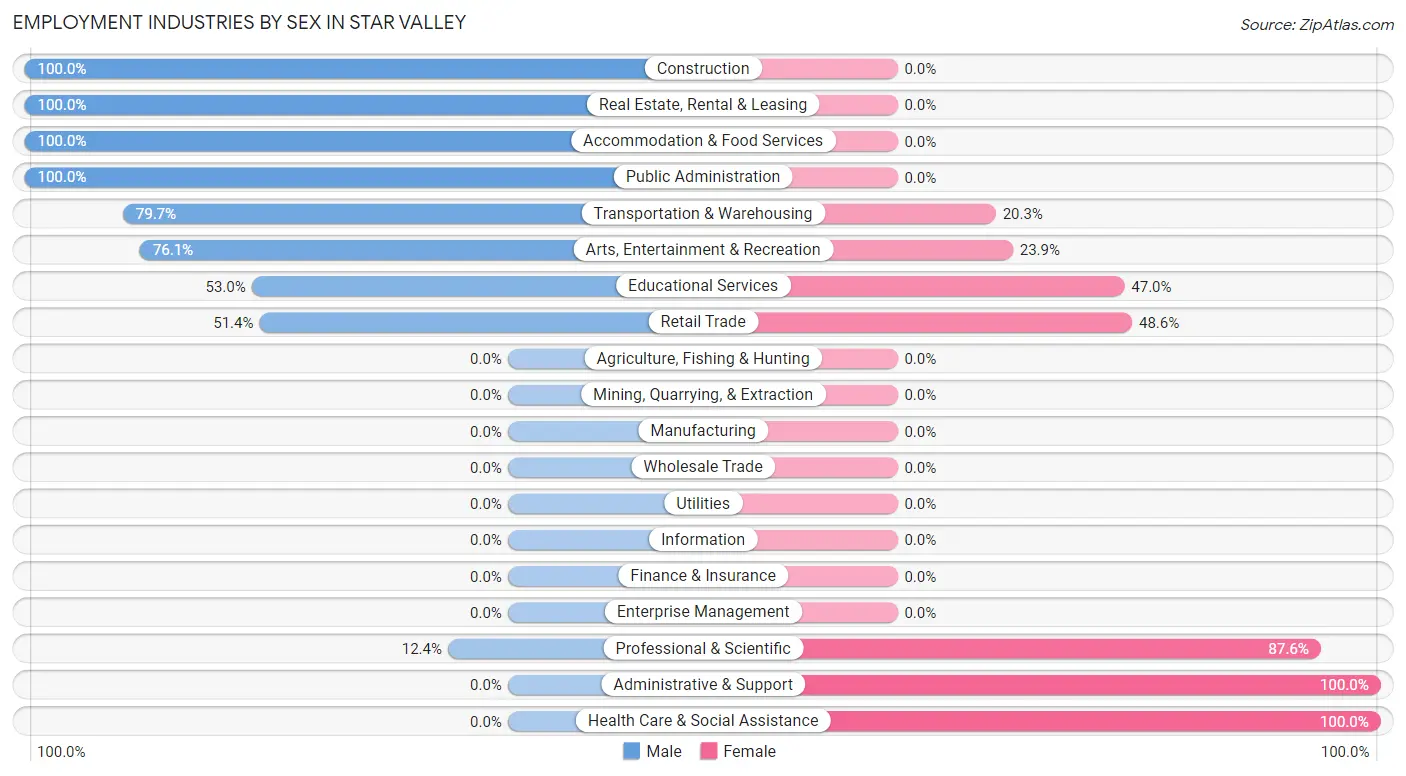
The Star Valley industries that see more men than women are Construction (100.0%), Real Estate, Rental & Leasing (100.0%), and Accommodation & Food Services (100.0%), whereas the industries that tend to have a higher number of women are Administrative & Support (100.0%), Health Care & Social Assistance (100.0%), and Professional & Scientific (87.6%).
| Industry | Male | Female |
| Agriculture, Fishing & Hunting | 0 (0.0%) | 0 (0.0%) |
| Mining, Quarrying, & Extraction | 0 (0.0%) | 0 (0.0%) |
| Construction | 114 (100.0%) | 0 (0.0%) |
| Manufacturing | 0 (0.0%) | 0 (0.0%) |
| Wholesale Trade | 0 (0.0%) | 0 (0.0%) |
| Retail Trade | 72 (51.4%) | 68 (48.6%) |
| Transportation & Warehousing | 94 (79.7%) | 24 (20.3%) |
| Utilities | 0 (0.0%) | 0 (0.0%) |
| Information | 0 (0.0%) | 0 (0.0%) |
| Finance & Insurance | 0 (0.0%) | 0 (0.0%) |
| Real Estate, Rental & Leasing | 19 (100.0%) | 0 (0.0%) |
| Professional & Scientific | 15 (12.4%) | 106 (87.6%) |
| Enterprise Management | 0 (0.0%) | 0 (0.0%) |
| Administrative & Support | 0 (0.0%) | 17 (100.0%) |
| Educational Services | 114 (53.0%) | 101 (47.0%) |
| Health Care & Social Assistance | 0 (0.0%) | 103 (100.0%) |
| Arts, Entertainment & Recreation | 51 (76.1%) | 16 (23.9%) |
| Accommodation & Food Services | 96 (100.0%) | 0 (0.0%) |
| Public Administration | 26 (100.0%) | 0 (0.0%) |
| Total | 738 (62.9%) | 435 (37.1%) |
Education in Star Valley
School Enrollment in Star Valley
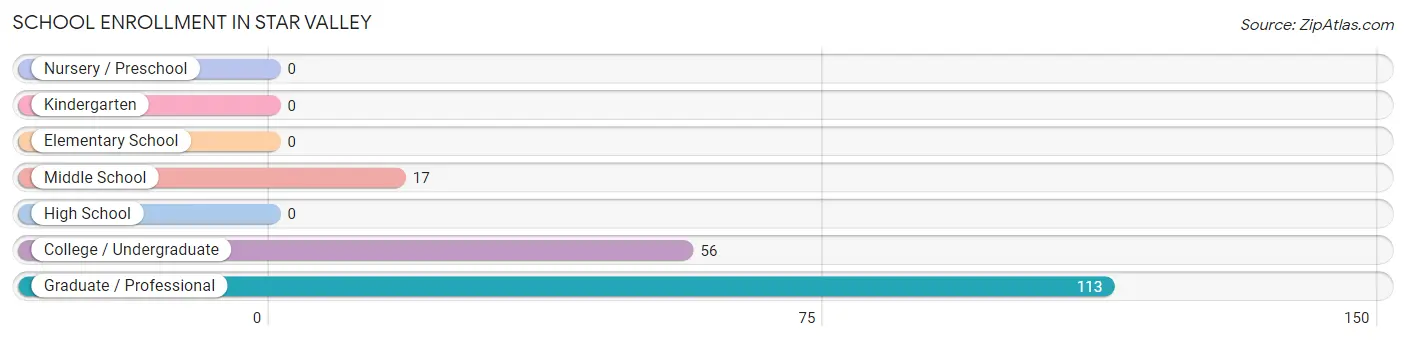
The most common levels of schooling among the 186 students in Star Valley are graduate / professional (113 | 60.8%), college / undergraduate (56 | 30.1%), and middle school (17 | 9.1%).
| School Level | # Students | % Students |
| Nursery / Preschool | 0 | 0.0% |
| Kindergarten | 0 | 0.0% |
| Elementary School | 0 | 0.0% |
| Middle School | 17 | 9.1% |
| High School | 0 | 0.0% |
| College / Undergraduate | 56 | 30.1% |
| Graduate / Professional | 113 | 60.8% |
| Total | 186 | 100.0% |
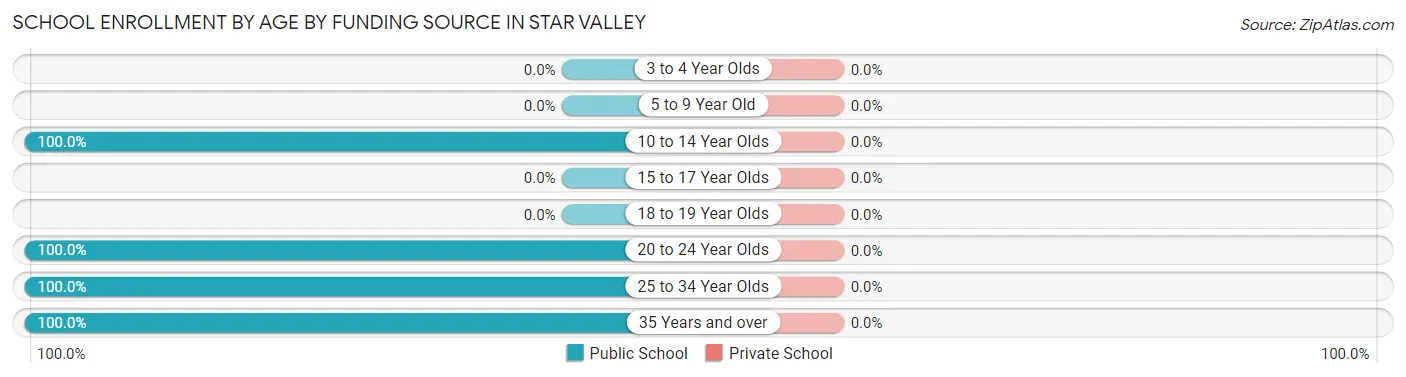
School Enrollment by Age by Funding Source in Star Valley
| Age Bracket | Public School | Private School |
| 3 to 4 Year Olds | 0 (0.0%) | 0 (0.0%) |
| 5 to 9 Year Old | 0 (0.0%) | 0 (0.0%) |
| 10 to 14 Year Olds | 17 (100.0%) | 0 (0.0%) |
| 15 to 17 Year Olds | 0 (0.0%) | 0 (0.0%) |
| 18 to 19 Year Olds | 0 (0.0%) | 0 (0.0%) |
| 20 to 24 Year Olds | 113 (100.0%) | 0 (0.0%) |
| 25 to 34 Year Olds | 32 (100.0%) | 0 (0.0%) |
| 35 Years and over | 24 (100.0%) | 0 (0.0%) |
| Total | 186 (100.0%) | 0 (0.0%) |
Educational Attainment by Field of Study in Star Valley
Business (181 | 47.0%), education (94 | 24.4%), engineering (87 | 22.6%), bio, nature & agricultural (22 | 5.7%), and visual & performing arts (1 | 0.3%) are the most common fields of study among 385 individuals in Star Valley who have obtained a bachelor's degree or higher.
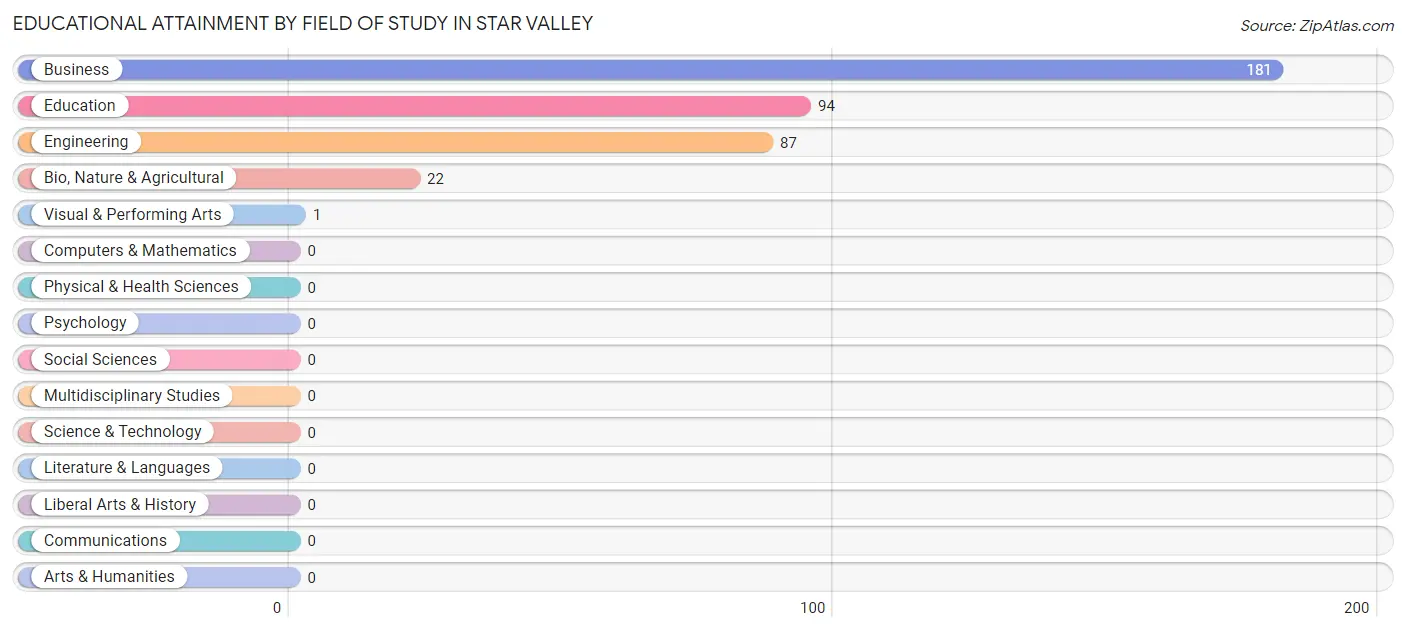
| Field of Study | # Graduates | % Graduates |
| Computers & Mathematics | 0 | 0.0% |
| Bio, Nature & Agricultural | 22 | 5.7% |
| Physical & Health Sciences | 0 | 0.0% |
| Psychology | 0 | 0.0% |
| Social Sciences | 0 | 0.0% |
| Engineering | 87 | 22.6% |
| Multidisciplinary Studies | 0 | 0.0% |
| Science & Technology | 0 | 0.0% |
| Business | 181 | 47.0% |
| Education | 94 | 24.4% |
| Literature & Languages | 0 | 0.0% |
| Liberal Arts & History | 0 | 0.0% |
| Visual & Performing Arts | 1 | 0.3% |
| Communications | 0 | 0.0% |
| Arts & Humanities | 0 | 0.0% |
| Total | 385 | 100.0% |
Transportation & Commute in Star Valley
Vehicle Availability by Sex in Star Valley
The most prevalent vehicle ownership categories in Star Valley are males with 2 vehicles (259, accounting for 35.1%) and females with 2 vehicles (197, making up 59.7%).
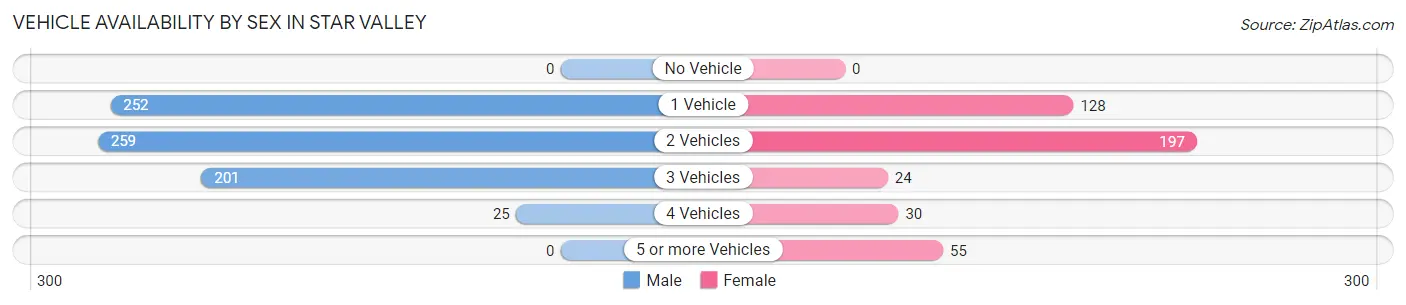
| Vehicles Available | Male | Female |
| No Vehicle | 0 (0.0%) | 0 (0.0%) |
| 1 Vehicle | 252 (34.2%) | 128 (29.5%) |
| 2 Vehicles | 259 (35.1%) | 197 (45.4%) |
| 3 Vehicles | 201 (27.3%) | 24 (5.5%) |
| 4 Vehicles | 25 (3.4%) | 30 (6.9%) |
| 5 or more Vehicles | 0 (0.0%) | 55 (12.7%) |
| Total | 737 (100.0%) | 434 (100.0%) |
Commute Time in Star Valley
The most frequently occuring commute durations in Star Valley are 5 to 9 minutes (454 commuters, 47.0%), 15 to 19 minutes (284 commuters, 29.4%), and 10 to 14 minutes (179 commuters, 18.5%).
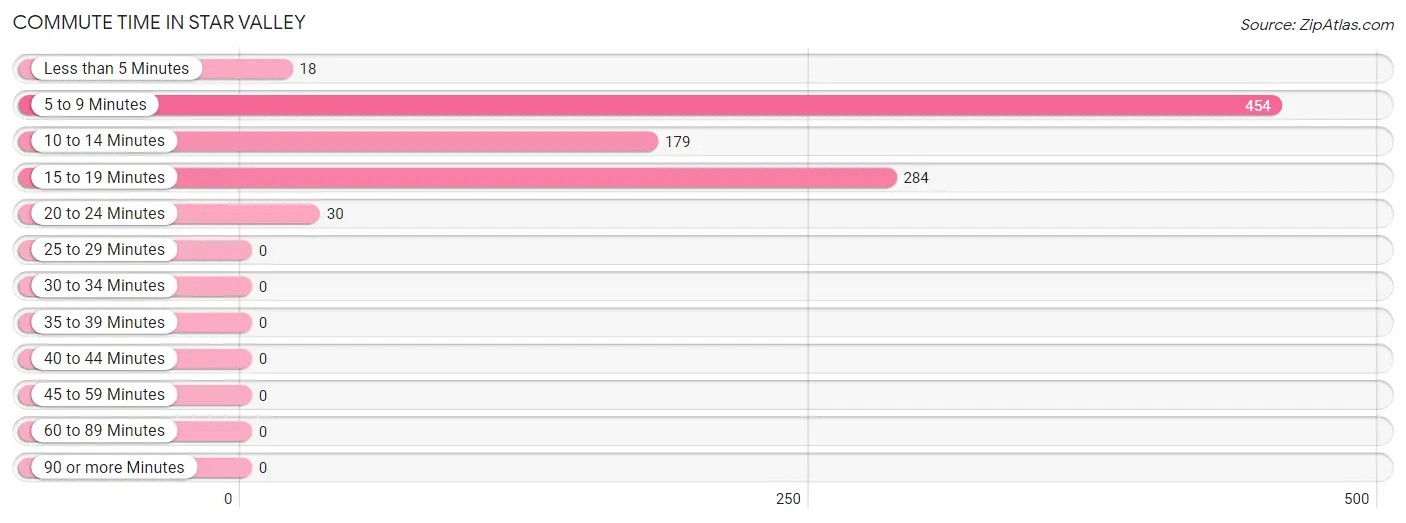
| Commute Time | # Commuters | % Commuters |
| Less than 5 Minutes | 18 | 1.9% |
| 5 to 9 Minutes | 454 | 47.0% |
| 10 to 14 Minutes | 179 | 18.5% |
| 15 to 19 Minutes | 284 | 29.4% |
| 20 to 24 Minutes | 30 | 3.1% |
| 25 to 29 Minutes | 0 | 0.0% |
| 30 to 34 Minutes | 0 | 0.0% |
| 35 to 39 Minutes | 0 | 0.0% |
| 40 to 44 Minutes | 0 | 0.0% |
| 45 to 59 Minutes | 0 | 0.0% |
| 60 to 89 Minutes | 0 | 0.0% |
| 90 or more Minutes | 0 | 0.0% |
Commute Time by Sex in Star Valley
The most common commute times in Star Valley are 5 to 9 minutes (406 commuters, 58.8%) for males and 15 to 19 minutes (206 commuters, 75.2%) for females.
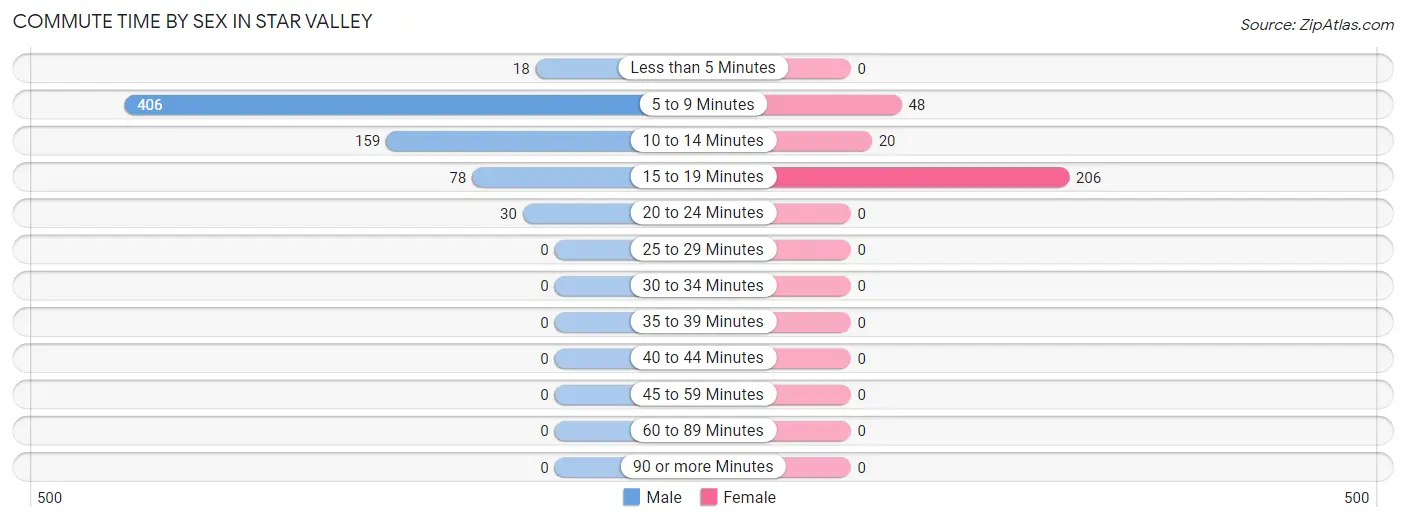
| Commute Time | Male | Female |
| Less than 5 Minutes | 18 (2.6%) | 0 (0.0%) |
| 5 to 9 Minutes | 406 (58.8%) | 48 (17.5%) |
| 10 to 14 Minutes | 159 (23.0%) | 20 (7.3%) |
| 15 to 19 Minutes | 78 (11.3%) | 206 (75.2%) |
| 20 to 24 Minutes | 30 (4.3%) | 0 (0.0%) |
| 25 to 29 Minutes | 0 (0.0%) | 0 (0.0%) |
| 30 to 34 Minutes | 0 (0.0%) | 0 (0.0%) |
| 35 to 39 Minutes | 0 (0.0%) | 0 (0.0%) |
| 40 to 44 Minutes | 0 (0.0%) | 0 (0.0%) |
| 45 to 59 Minutes | 0 (0.0%) | 0 (0.0%) |
| 60 to 89 Minutes | 0 (0.0%) | 0 (0.0%) |
| 90 or more Minutes | 0 (0.0%) | 0 (0.0%) |
Time of Departure to Work by Sex in Star Valley
The most frequent times of departure to work in Star Valley are 7:30 AM to 7:59 AM (138, 20.0%) for males and 6:30 AM to 6:59 AM (108, 39.4%) for females.
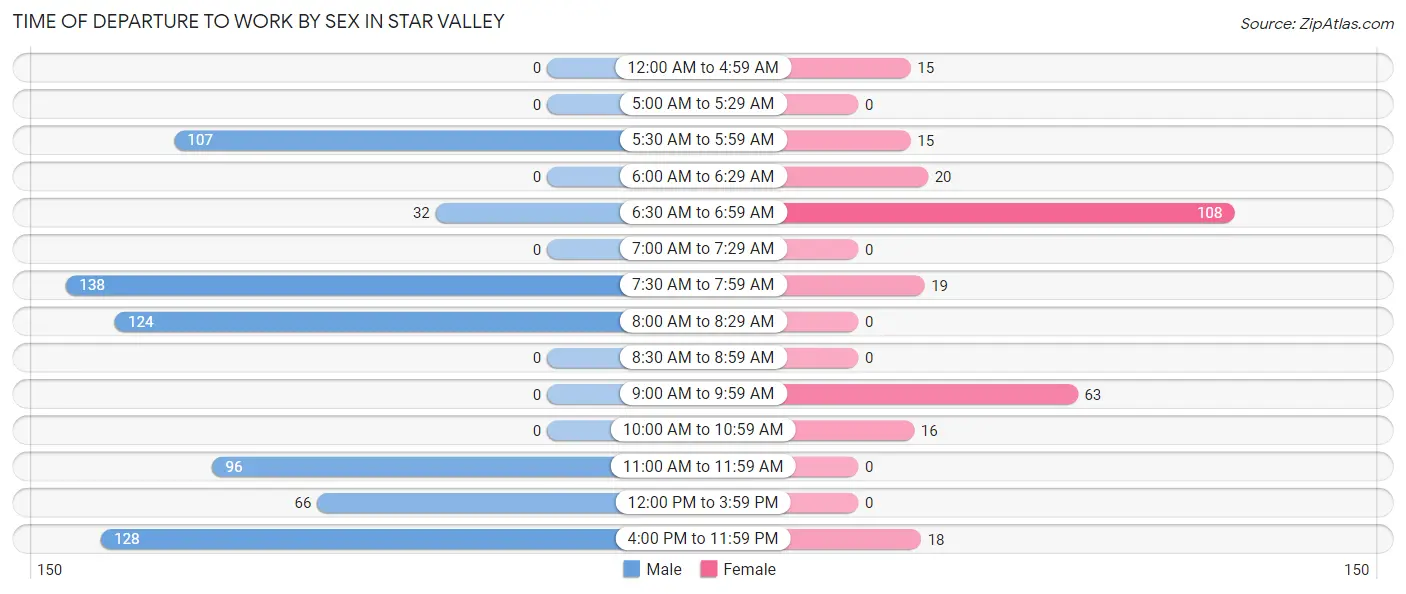
| Time of Departure | Male | Female |
| 12:00 AM to 4:59 AM | 0 (0.0%) | 15 (5.5%) |
| 5:00 AM to 5:29 AM | 0 (0.0%) | 0 (0.0%) |
| 5:30 AM to 5:59 AM | 107 (15.5%) | 15 (5.5%) |
| 6:00 AM to 6:29 AM | 0 (0.0%) | 20 (7.3%) |
| 6:30 AM to 6:59 AM | 32 (4.6%) | 108 (39.4%) |
| 7:00 AM to 7:29 AM | 0 (0.0%) | 0 (0.0%) |
| 7:30 AM to 7:59 AM | 138 (20.0%) | 19 (6.9%) |
| 8:00 AM to 8:29 AM | 124 (17.9%) | 0 (0.0%) |
| 8:30 AM to 8:59 AM | 0 (0.0%) | 0 (0.0%) |
| 9:00 AM to 9:59 AM | 0 (0.0%) | 63 (23.0%) |
| 10:00 AM to 10:59 AM | 0 (0.0%) | 16 (5.8%) |
| 11:00 AM to 11:59 AM | 96 (13.9%) | 0 (0.0%) |
| 12:00 PM to 3:59 PM | 66 (9.6%) | 0 (0.0%) |
| 4:00 PM to 11:59 PM | 128 (18.5%) | 18 (6.6%) |
| Total | 691 (100.0%) | 274 (100.0%) |
Housing Occupancy in Star Valley
Occupancy by Ownership in Star Valley
Of the total 1,524 dwellings in Star Valley, owner-occupied units account for 1,268 (83.2%), while renter-occupied units make up 256 (16.8%).
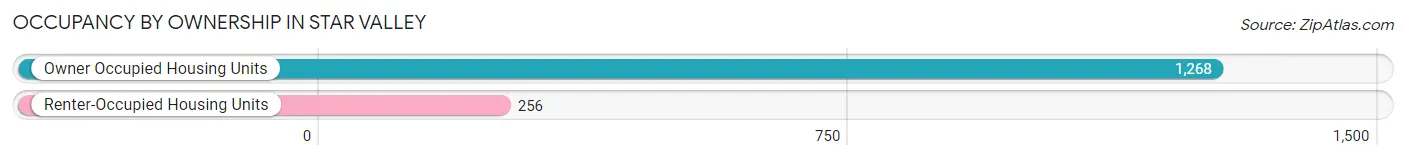
| Occupancy | # Housing Units | % Housing Units |
| Owner Occupied Housing Units | 1,268 | 83.2% |
| Renter-Occupied Housing Units | 256 | 16.8% |
| Total Occupied Housing Units | 1,524 | 100.0% |
Occupancy by Household Size in Star Valley
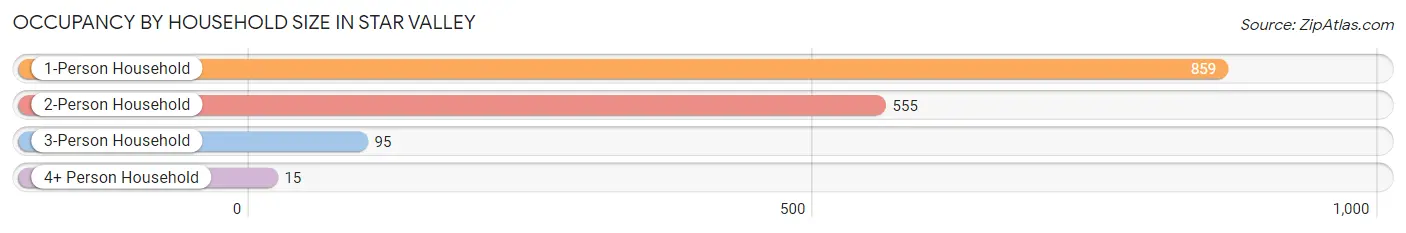
| Household Size | # Housing Units | % Housing Units |
| 1-Person Household | 859 | 56.4% |
| 2-Person Household | 555 | 36.4% |
| 3-Person Household | 95 | 6.2% |
| 4+ Person Household | 15 | 1.0% |
| Total Housing Units | 1,524 | 100.0% |
Occupancy by Ownership by Household Size in Star Valley
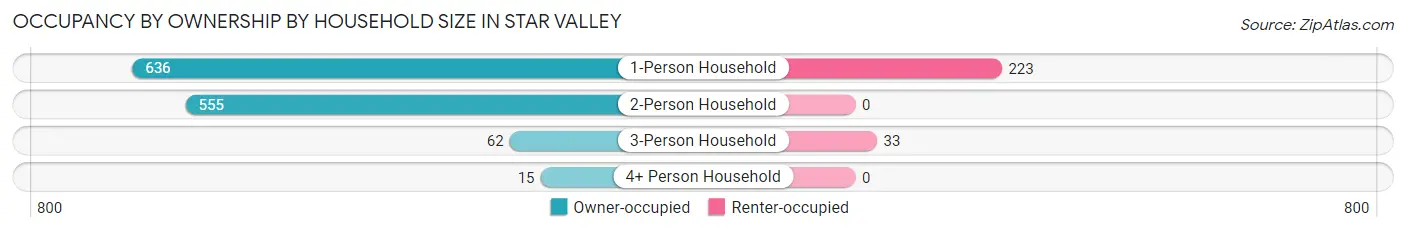
| Household Size | Owner-occupied | Renter-occupied |
| 1-Person Household | 636 (74.0%) | 223 (26.0%) |
| 2-Person Household | 555 (100.0%) | 0 (0.0%) |
| 3-Person Household | 62 (65.3%) | 33 (34.7%) |
| 4+ Person Household | 15 (100.0%) | 0 (0.0%) |
| Total Housing Units | 1,268 (83.2%) | 256 (16.8%) |
Occupancy by Educational Attainment in Star Valley
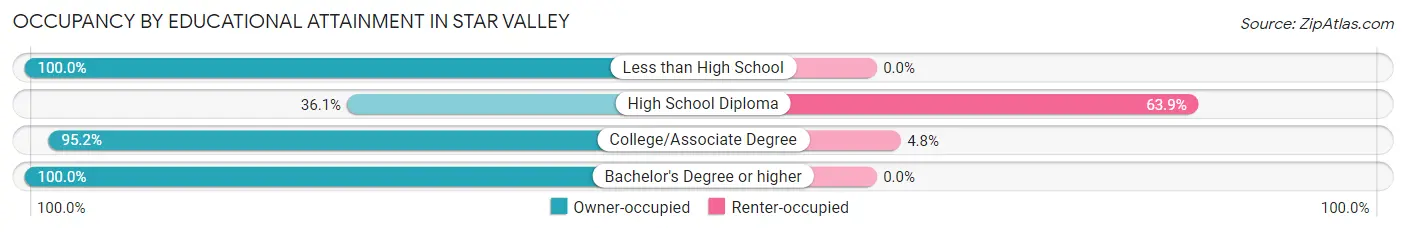
| Household Size | Owner-occupied | Renter-occupied |
| Less than High School | 153 (100.0%) | 0 (0.0%) |
| High School Diploma | 126 (36.1%) | 223 (63.9%) |
| College/Associate Degree | 660 (95.2%) | 33 (4.8%) |
| Bachelor's Degree or higher | 329 (100.0%) | 0 (0.0%) |
Occupancy by Age of Householder in Star Valley
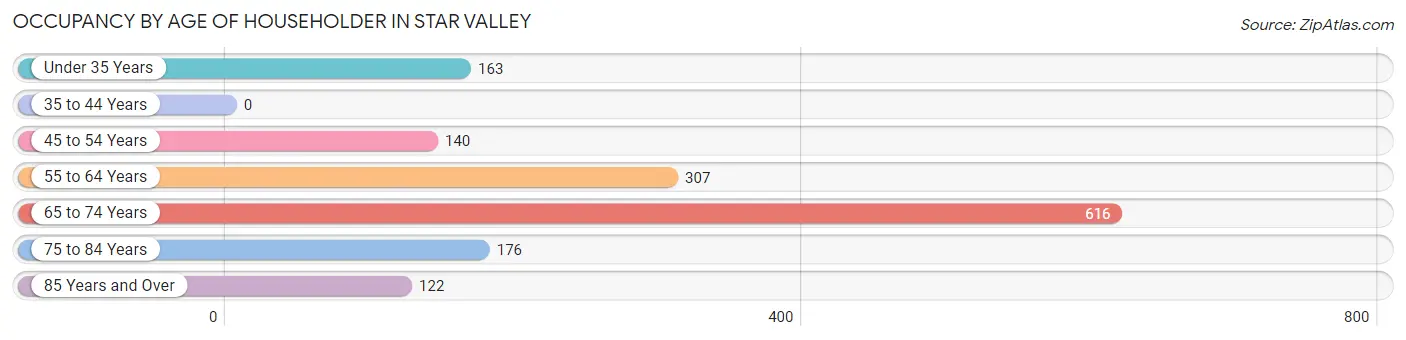
| Age Bracket | # Households | % Households |
| Under 35 Years | 163 | 10.7% |
| 35 to 44 Years | 0 | 0.0% |
| 45 to 54 Years | 140 | 9.2% |
| 55 to 64 Years | 307 | 20.1% |
| 65 to 74 Years | 616 | 40.4% |
| 75 to 84 Years | 176 | 11.6% |
| 85 Years and Over | 122 | 8.0% |
| Total | 1,524 | 100.0% |
Housing Finances in Star Valley
Median Income by Occupancy in Star Valley
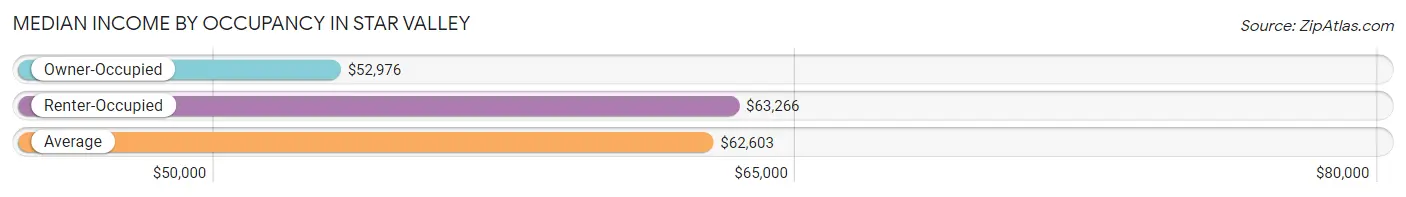
| Occupancy Type | # Households | Median Income |
| Owner-Occupied | 1,268 (83.2%) | $52,976 |
| Renter-Occupied | 256 (16.8%) | $63,266 |
| Average | 1,524 (100.0%) | $62,603 |
Occupancy by Householder Income Bracket in Star Valley
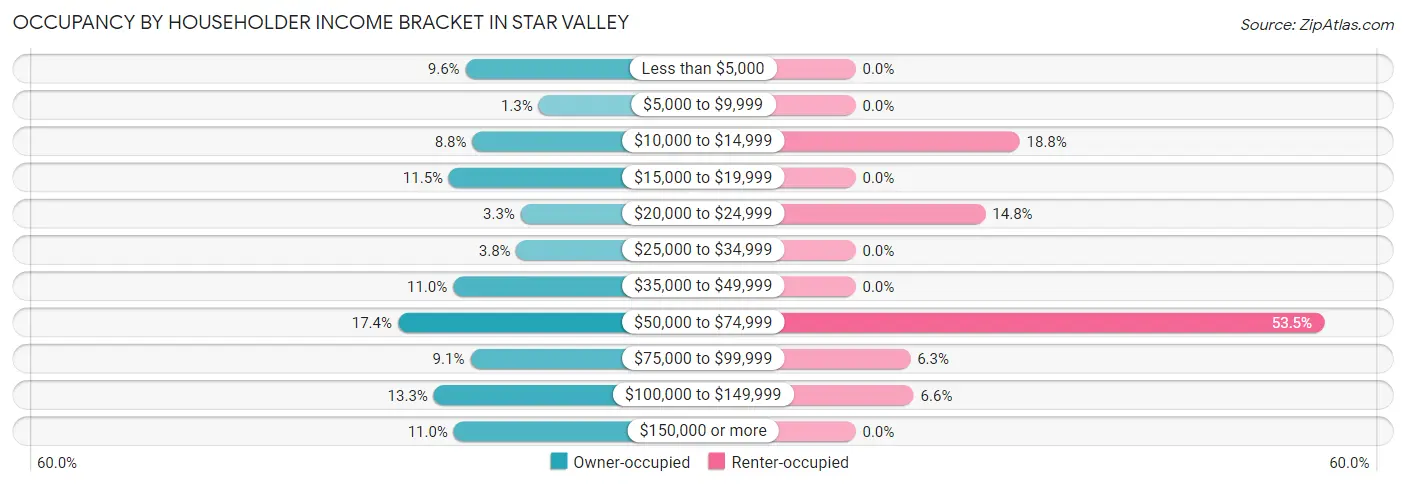
| Income Bracket | Owner-occupied | Renter-occupied |
| Less than $5,000 | 122 (9.6%) | 0 (0.0%) |
| $5,000 to $9,999 | 16 (1.3%) | 0 (0.0%) |
| $10,000 to $14,999 | 112 (8.8%) | 48 (18.8%) |
| $15,000 to $19,999 | 146 (11.5%) | 0 (0.0%) |
| $20,000 to $24,999 | 42 (3.3%) | 38 (14.8%) |
| $25,000 to $34,999 | 48 (3.8%) | 0 (0.0%) |
| $35,000 to $49,999 | 140 (11.0%) | 0 (0.0%) |
| $50,000 to $74,999 | 220 (17.3%) | 137 (53.5%) |
| $75,000 to $99,999 | 115 (9.1%) | 16 (6.2%) |
| $100,000 to $149,999 | 168 (13.3%) | 17 (6.6%) |
| $150,000 or more | 139 (11.0%) | 0 (0.0%) |
| Total | 1,268 (100.0%) | 256 (100.0%) |
Monthly Housing Cost Tiers in Star Valley
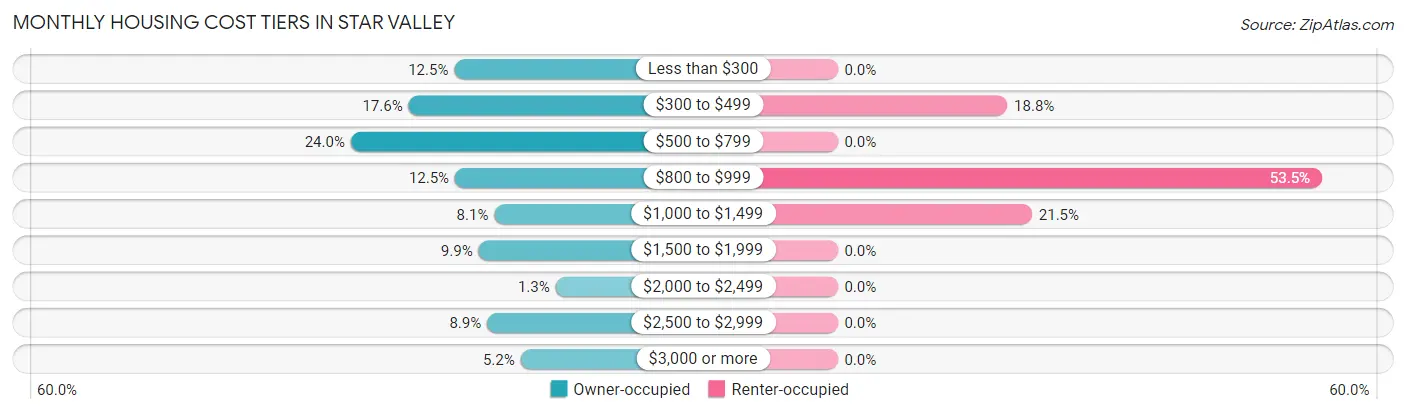
| Monthly Cost | Owner-occupied | Renter-occupied |
| Less than $300 | 159 (12.5%) | 0 (0.0%) |
| $300 to $499 | 223 (17.6%) | 48 (18.8%) |
| $500 to $799 | 304 (24.0%) | 0 (0.0%) |
| $800 to $999 | 158 (12.5%) | 137 (53.5%) |
| $1,000 to $1,499 | 103 (8.1%) | 55 (21.5%) |
| $1,500 to $1,999 | 125 (9.9%) | 0 (0.0%) |
| $2,000 to $2,499 | 17 (1.3%) | 0 (0.0%) |
| $2,500 to $2,999 | 113 (8.9%) | 0 (0.0%) |
| $3,000 or more | 66 (5.2%) | 0 (0.0%) |
| Total | 1,268 (100.0%) | 256 (100.0%) |
Physical Housing Characteristics in Star Valley
Housing Structures in Star Valley
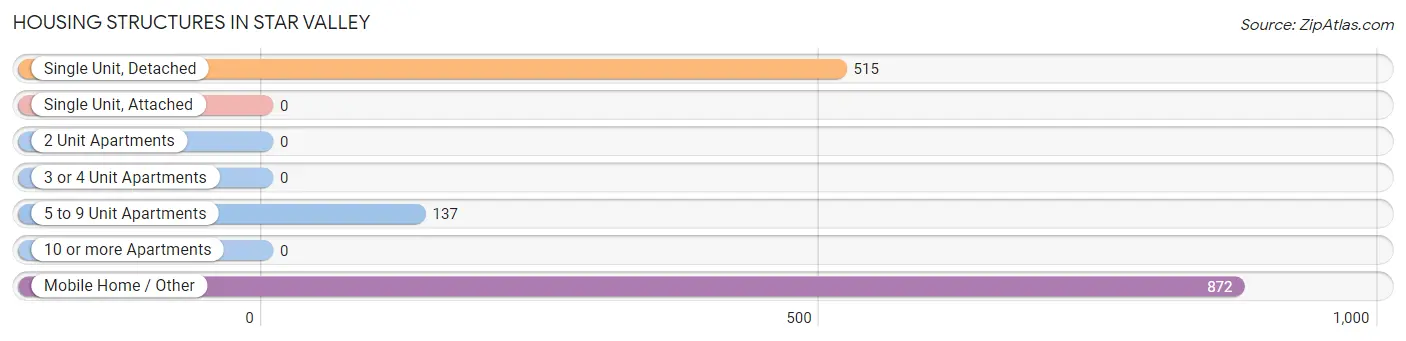
| Structure Type | # Housing Units | % Housing Units |
| Single Unit, Detached | 515 | 33.8% |
| Single Unit, Attached | 0 | 0.0% |
| 2 Unit Apartments | 0 | 0.0% |
| 3 or 4 Unit Apartments | 0 | 0.0% |
| 5 to 9 Unit Apartments | 137 | 9.0% |
| 10 or more Apartments | 0 | 0.0% |
| Mobile Home / Other | 872 | 57.2% |
| Total | 1,524 | 100.0% |
Housing Structures by Occupancy in Star Valley
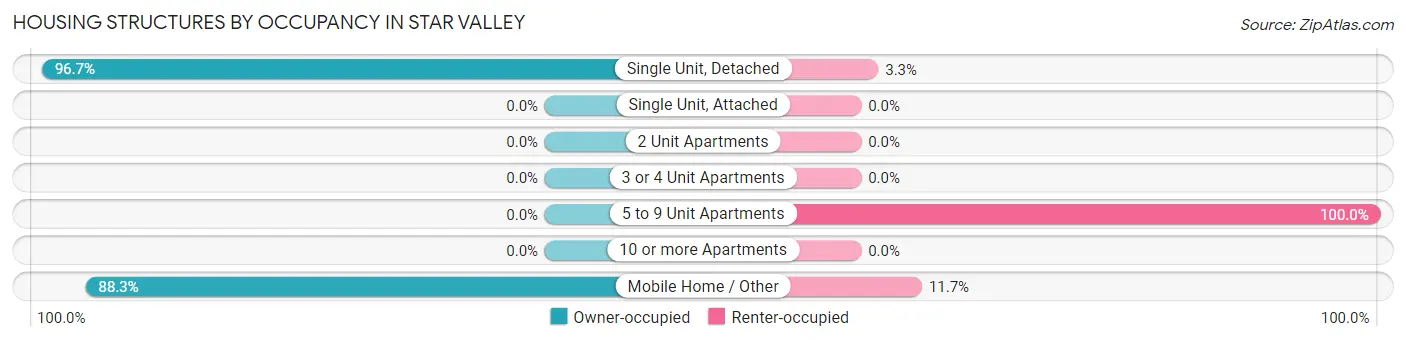
| Structure Type | Owner-occupied | Renter-occupied |
| Single Unit, Detached | 498 (96.7%) | 17 (3.3%) |
| Single Unit, Attached | 0 (0.0%) | 0 (0.0%) |
| 2 Unit Apartments | 0 (0.0%) | 0 (0.0%) |
| 3 or 4 Unit Apartments | 0 (0.0%) | 0 (0.0%) |
| 5 to 9 Unit Apartments | 0 (0.0%) | 137 (100.0%) |
| 10 or more Apartments | 0 (0.0%) | 0 (0.0%) |
| Mobile Home / Other | 770 (88.3%) | 102 (11.7%) |
| Total | 1,268 (83.2%) | 256 (16.8%) |
Housing Structures by Number of Rooms in Star Valley
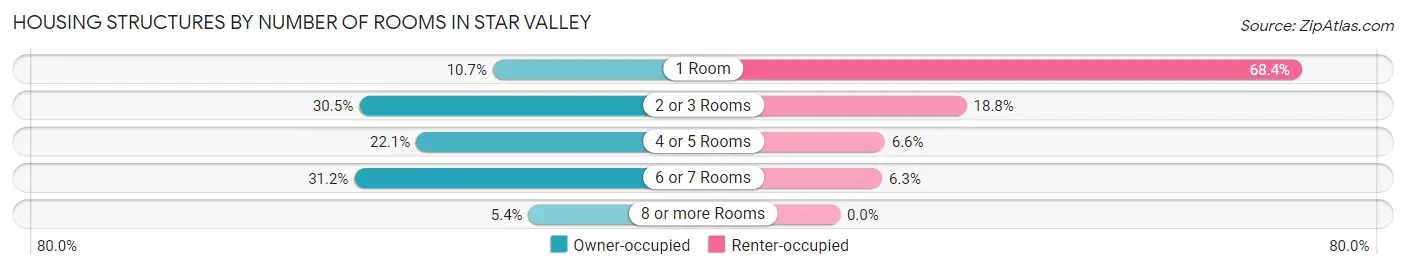
| Number of Rooms | Owner-occupied | Renter-occupied |
| 1 Room | 136 (10.7%) | 175 (68.4%) |
| 2 or 3 Rooms | 387 (30.5%) | 48 (18.8%) |
| 4 or 5 Rooms | 280 (22.1%) | 17 (6.6%) |
| 6 or 7 Rooms | 396 (31.2%) | 16 (6.2%) |
| 8 or more Rooms | 69 (5.4%) | 0 (0.0%) |
| Total | 1,268 (100.0%) | 256 (100.0%) |
Housing Structure by Heating Type in Star Valley
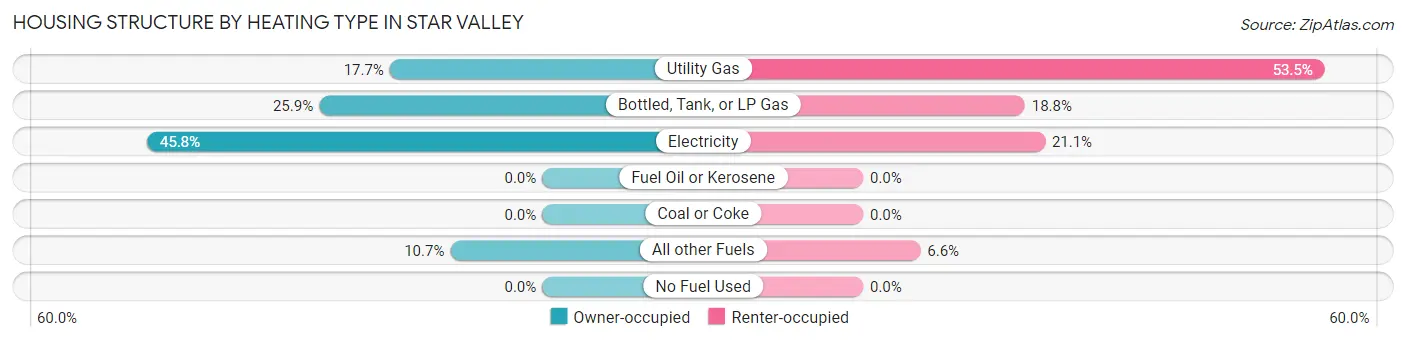
| Heating Type | Owner-occupied | Renter-occupied |
| Utility Gas | 224 (17.7%) | 137 (53.5%) |
| Bottled, Tank, or LP Gas | 328 (25.9%) | 48 (18.8%) |
| Electricity | 581 (45.8%) | 54 (21.1%) |
| Fuel Oil or Kerosene | 0 (0.0%) | 0 (0.0%) |
| Coal or Coke | 0 (0.0%) | 0 (0.0%) |
| All other Fuels | 135 (10.6%) | 17 (6.6%) |
| No Fuel Used | 0 (0.0%) | 0 (0.0%) |
| Total | 1,268 (100.0%) | 256 (100.0%) |
Household Vehicle Usage in Star Valley
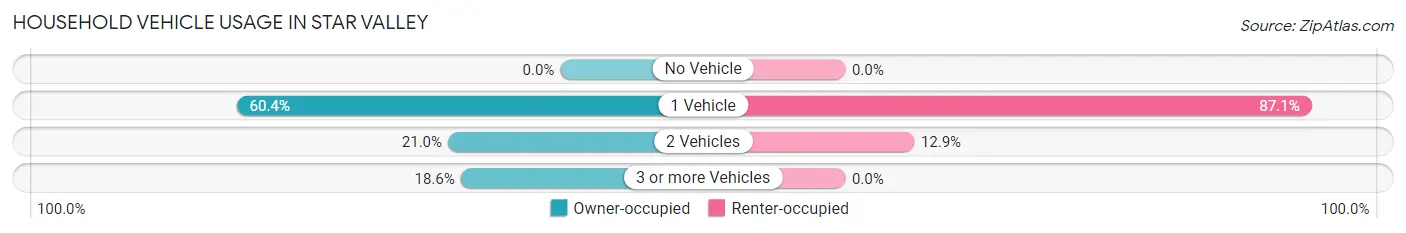
| Vehicles per Household | Owner-occupied | Renter-occupied |
| No Vehicle | 0 (0.0%) | 0 (0.0%) |
| 1 Vehicle | 766 (60.4%) | 223 (87.1%) |
| 2 Vehicles | 266 (21.0%) | 33 (12.9%) |
| 3 or more Vehicles | 236 (18.6%) | 0 (0.0%) |
| Total | 1,268 (100.0%) | 256 (100.0%) |
Real Estate & Mortgages in Star Valley
Real Estate and Mortgage Overview in Star Valley
| Characteristic | Without Mortgage | With Mortgage |
| Housing Units | 812 | 456 |
| Median Property Value | $46,200 | $409,600 |
| Median Household Income | $43,796 | $52 |
| Monthly Housing Costs | $515 | $66 |
| Real Estate Taxes | - | - |
Property Value by Mortgage Status in Star Valley
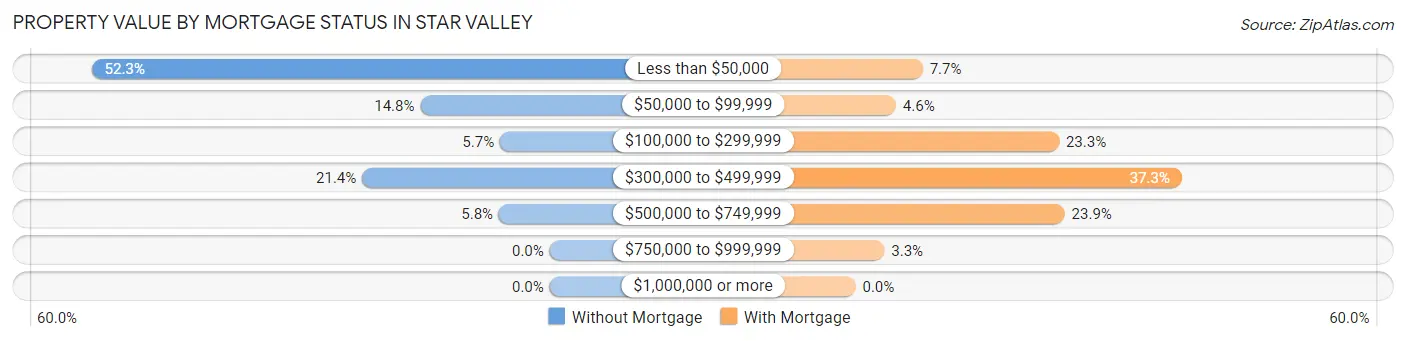
| Property Value | Without Mortgage | With Mortgage |
| Less than $50,000 | 425 (52.3%) | 35 (7.7%) |
| $50,000 to $99,999 | 120 (14.8%) | 21 (4.6%) |
| $100,000 to $299,999 | 46 (5.7%) | 106 (23.3%) |
| $300,000 to $499,999 | 174 (21.4%) | 170 (37.3%) |
| $500,000 to $749,999 | 47 (5.8%) | 109 (23.9%) |
| $750,000 to $999,999 | 0 (0.0%) | 15 (3.3%) |
| $1,000,000 or more | 0 (0.0%) | 0 (0.0%) |
| Total | 812 (100.0%) | 456 (100.0%) |
Household Income by Mortgage Status in Star Valley
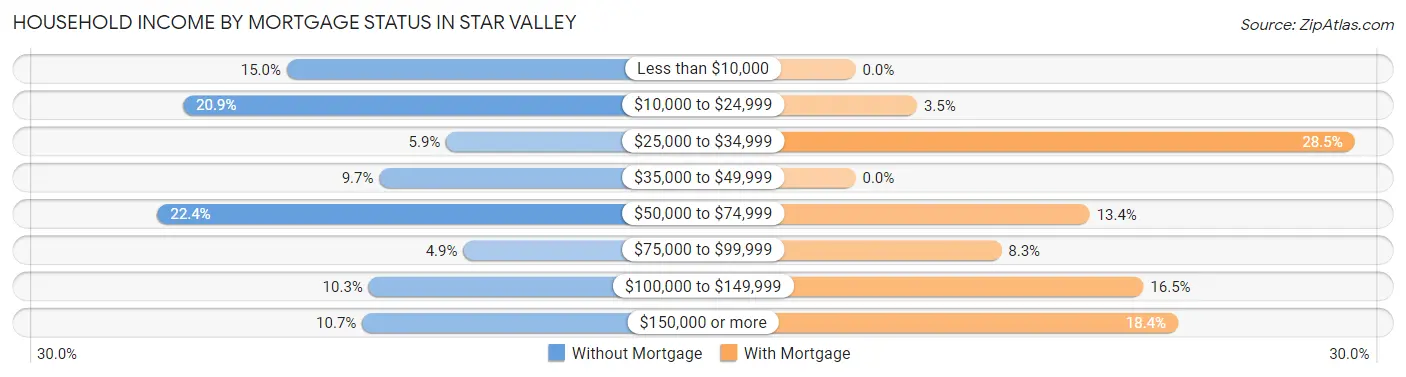
| Household Income | Without Mortgage | With Mortgage |
| Less than $10,000 | 122 (15.0%) | 0 (0.0%) |
| $10,000 to $24,999 | 170 (20.9%) | 16 (3.5%) |
| $25,000 to $34,999 | 48 (5.9%) | 130 (28.5%) |
| $35,000 to $49,999 | 79 (9.7%) | 0 (0.0%) |
| $50,000 to $74,999 | 182 (22.4%) | 61 (13.4%) |
| $75,000 to $99,999 | 40 (4.9%) | 38 (8.3%) |
| $100,000 to $149,999 | 84 (10.3%) | 75 (16.5%) |
| $150,000 or more | 87 (10.7%) | 84 (18.4%) |
| Total | 812 (100.0%) | 456 (100.0%) |
Property Value to Household Income Ratio in Star Valley
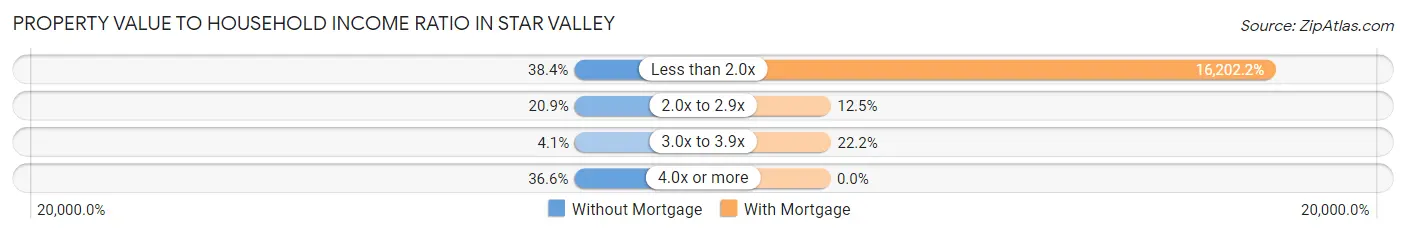
| Value-to-Income Ratio | Without Mortgage | With Mortgage |
| Less than 2.0x | 312 (38.4%) | 73,882 (16,202.2%) |
| 2.0x to 2.9x | 170 (20.9%) | 57 (12.5%) |
| 3.0x to 3.9x | 33 (4.1%) | 101 (22.2%) |
| 4.0x or more | 297 (36.6%) | 0 (0.0%) |
| Total | 812 (100.0%) | 456 (100.0%) |
Real Estate Taxes by Mortgage Status in Star Valley
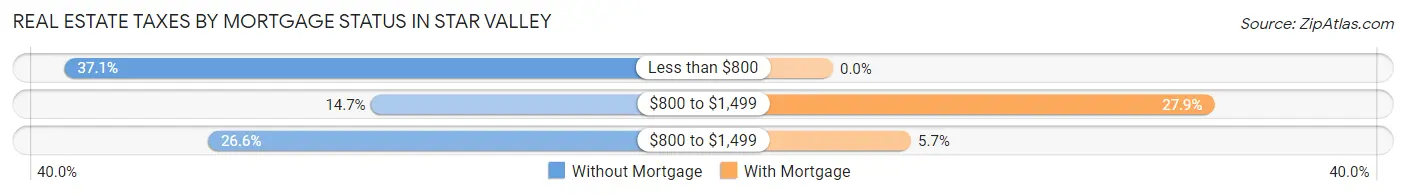
| Property Taxes | Without Mortgage | With Mortgage |
| Less than $800 | 301 (37.1%) | 0 (0.0%) |
| $800 to $1,499 | 119 (14.7%) | 127 (27.9%) |
| $800 to $1,499 | 216 (26.6%) | 26 (5.7%) |
| Total | 812 (100.0%) | 456 (100.0%) |
Health & Disability in Star Valley
Health Insurance Coverage by Age in Star Valley
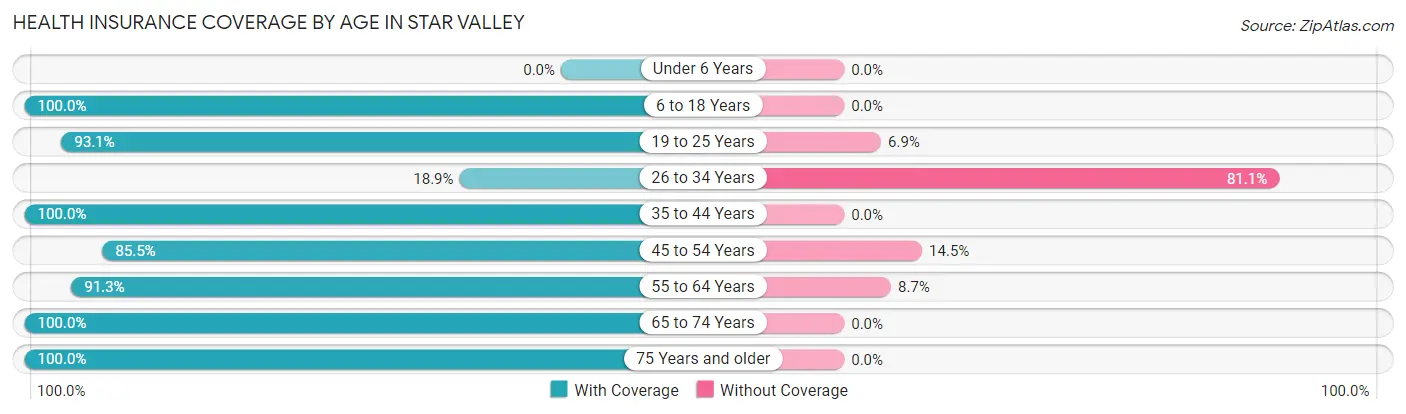
| Age Bracket | With Coverage | Without Coverage |
| Under 6 Years | 0 (0.0%) | 0 (0.0%) |
| 6 to 18 Years | 32 (100.0%) | 0 (0.0%) |
| 19 to 25 Years | 163 (93.1%) | 12 (6.9%) |
| 26 to 34 Years | 32 (18.9%) | 137 (81.1%) |
| 35 to 44 Years | 15 (100.0%) | 0 (0.0%) |
| 45 to 54 Years | 159 (85.5%) | 27 (14.5%) |
| 55 to 64 Years | 597 (91.3%) | 57 (8.7%) |
| 65 to 74 Years | 776 (100.0%) | 0 (0.0%) |
| 75 Years and older | 483 (100.0%) | 0 (0.0%) |
| Total | 2,257 (90.6%) | 233 (9.4%) |
Health Insurance Coverage by Citizenship Status in Star Valley
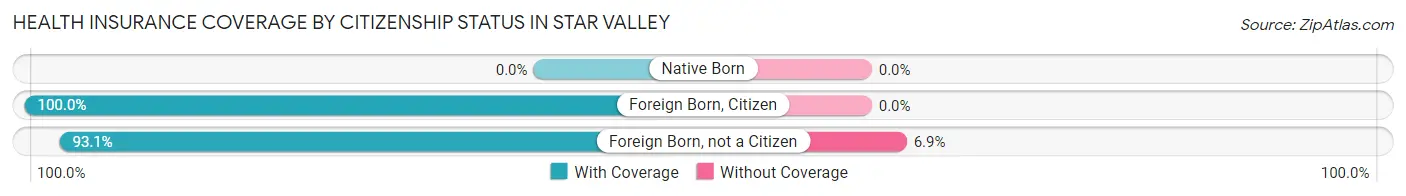
| Citizenship Status | With Coverage | Without Coverage |
| Native Born | 0 (0.0%) | 0 (0.0%) |
| Foreign Born, Citizen | 32 (100.0%) | 0 (0.0%) |
| Foreign Born, not a Citizen | 163 (93.1%) | 12 (6.9%) |
Health Insurance Coverage by Household Income in Star Valley
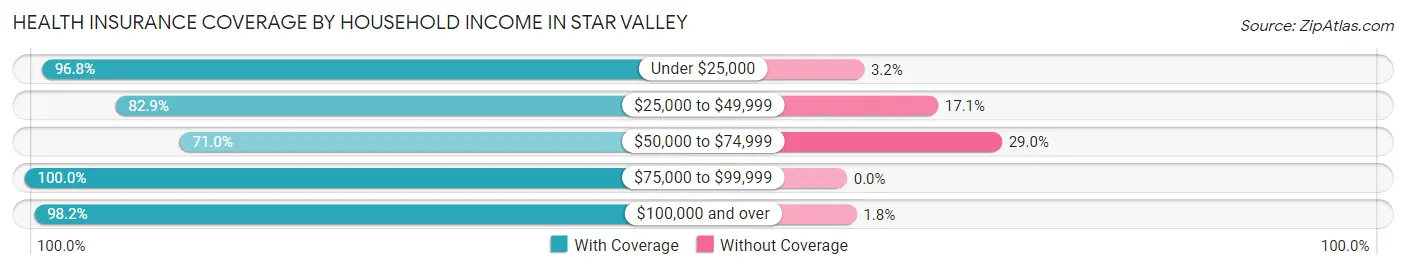
| Household Income | With Coverage | Without Coverage |
| Under $25,000 | 541 (96.8%) | 18 (3.2%) |
| $25,000 to $49,999 | 316 (82.9%) | 65 (17.1%) |
| $50,000 to $74,999 | 335 (71.0%) | 137 (29.0%) |
| $75,000 to $99,999 | 413 (100.0%) | 0 (0.0%) |
| $100,000 and over | 650 (98.2%) | 12 (1.8%) |
Public vs Private Health Insurance Coverage by Age in Star Valley
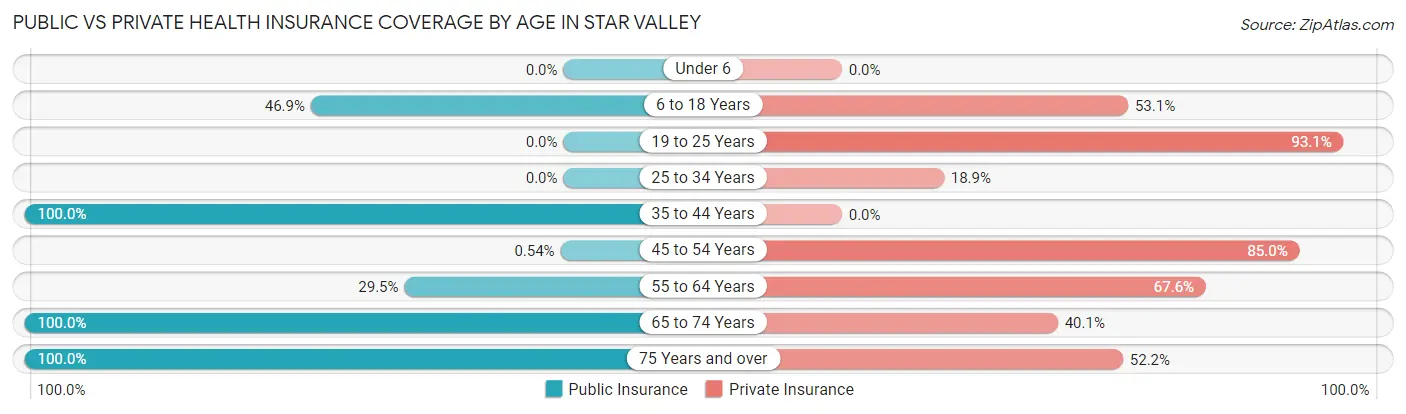
| Age Bracket | Public Insurance | Private Insurance |
| Under 6 | 0 (0.0%) | 0 (0.0%) |
| 6 to 18 Years | 15 (46.9%) | 17 (53.1%) |
| 19 to 25 Years | 0 (0.0%) | 163 (93.1%) |
| 25 to 34 Years | 0 (0.0%) | 32 (18.9%) |
| 35 to 44 Years | 15 (100.0%) | 0 (0.0%) |
| 45 to 54 Years | 1 (0.5%) | 158 (85.0%) |
| 55 to 64 Years | 193 (29.5%) | 442 (67.6%) |
| 65 to 74 Years | 776 (100.0%) | 311 (40.1%) |
| 75 Years and over | 483 (100.0%) | 252 (52.2%) |
| Total | 1,483 (59.6%) | 1,375 (55.2%) |
Disability Status by Sex by Age in Star Valley
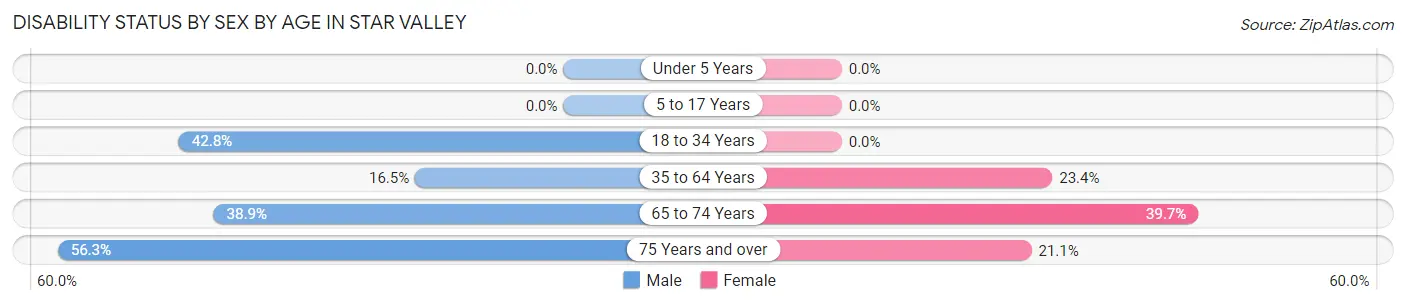
| Age Bracket | Male | Female |
| Under 5 Years | 0 (0.0%) | 0 (0.0%) |
| 5 to 17 Years | 0 (0.0%) | 0 (0.0%) |
| 18 to 34 Years | 137 (42.8%) | 0 (0.0%) |
| 35 to 64 Years | 75 (16.5%) | 94 (23.4%) |
| 65 to 74 Years | 155 (38.9%) | 150 (39.7%) |
| 75 Years and over | 152 (56.3%) | 45 (21.1%) |
Disability Class by Sex by Age in Star Valley
Disability Class: Hearing Difficulty
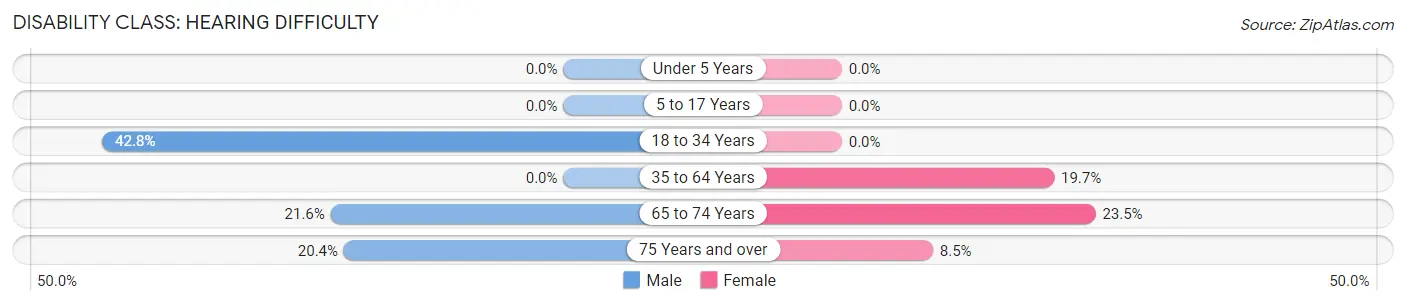
| Age Bracket | Male | Female |
| Under 5 Years | 0 (0.0%) | 0 (0.0%) |
| 5 to 17 Years | 0 (0.0%) | 0 (0.0%) |
| 18 to 34 Years | 137 (42.8%) | 0 (0.0%) |
| 35 to 64 Years | 0 (0.0%) | 79 (19.7%) |
| 65 to 74 Years | 86 (21.6%) | 89 (23.5%) |
| 75 Years and over | 55 (20.4%) | 18 (8.5%) |
Disability Class: Vision Difficulty
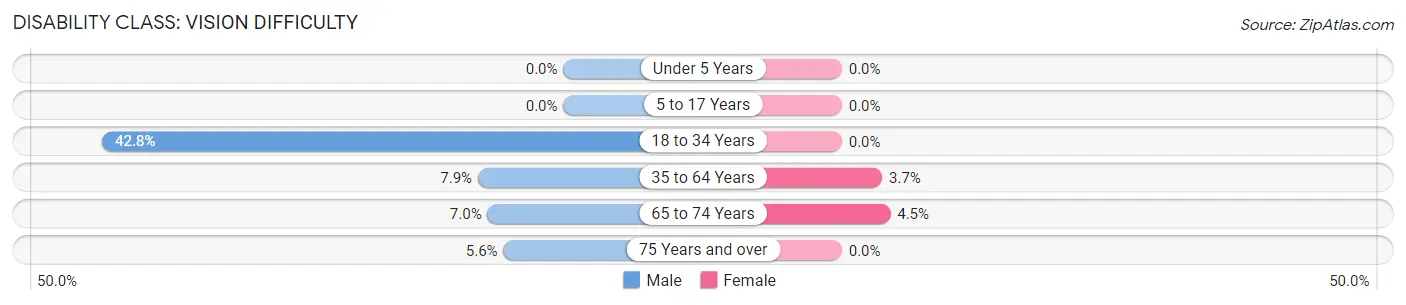
| Age Bracket | Male | Female |
| Under 5 Years | 0 (0.0%) | 0 (0.0%) |
| 5 to 17 Years | 0 (0.0%) | 0 (0.0%) |
| 18 to 34 Years | 137 (42.8%) | 0 (0.0%) |
| 35 to 64 Years | 36 (7.9%) | 15 (3.7%) |
| 65 to 74 Years | 28 (7.0%) | 17 (4.5%) |
| 75 Years and over | 15 (5.6%) | 0 (0.0%) |
Disability Class: Cognitive Difficulty
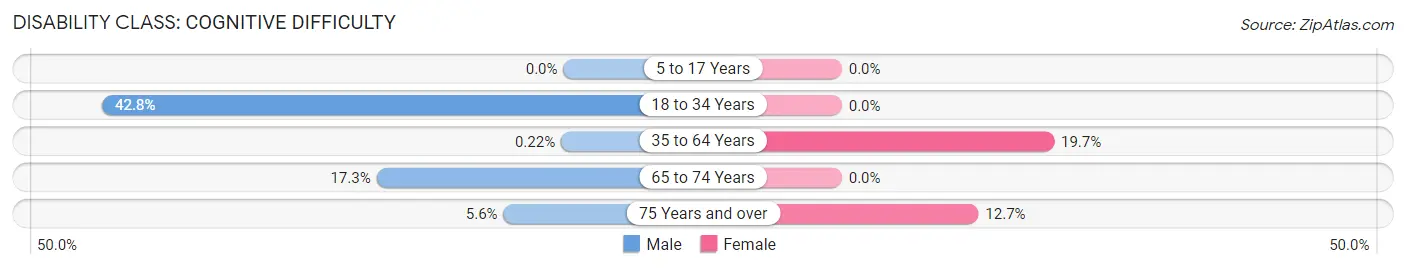
| Age Bracket | Male | Female |
| 5 to 17 Years | 0 (0.0%) | 0 (0.0%) |
| 18 to 34 Years | 137 (42.8%) | 0 (0.0%) |
| 35 to 64 Years | 1 (0.2%) | 79 (19.7%) |
| 65 to 74 Years | 69 (17.3%) | 0 (0.0%) |
| 75 Years and over | 15 (5.6%) | 27 (12.7%) |
Disability Class: Ambulatory Difficulty
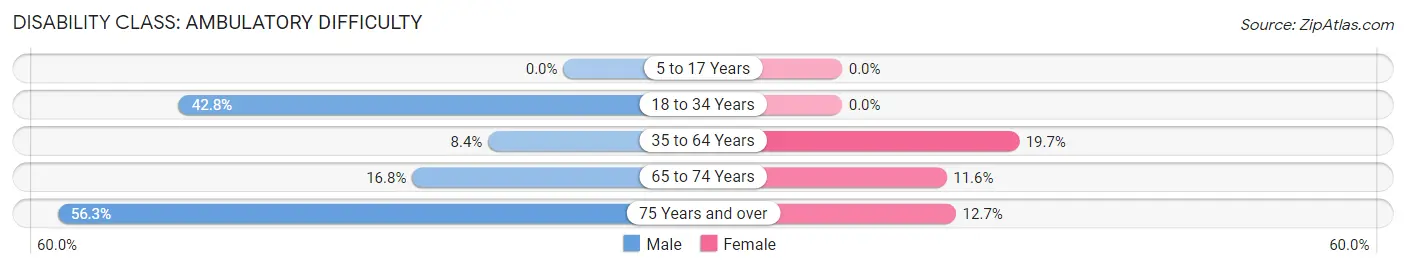
| Age Bracket | Male | Female |
| 5 to 17 Years | 0 (0.0%) | 0 (0.0%) |
| 18 to 34 Years | 137 (42.8%) | 0 (0.0%) |
| 35 to 64 Years | 38 (8.4%) | 79 (19.7%) |
| 65 to 74 Years | 67 (16.8%) | 44 (11.6%) |
| 75 Years and over | 152 (56.3%) | 27 (12.7%) |
Disability Class: Self-Care Difficulty
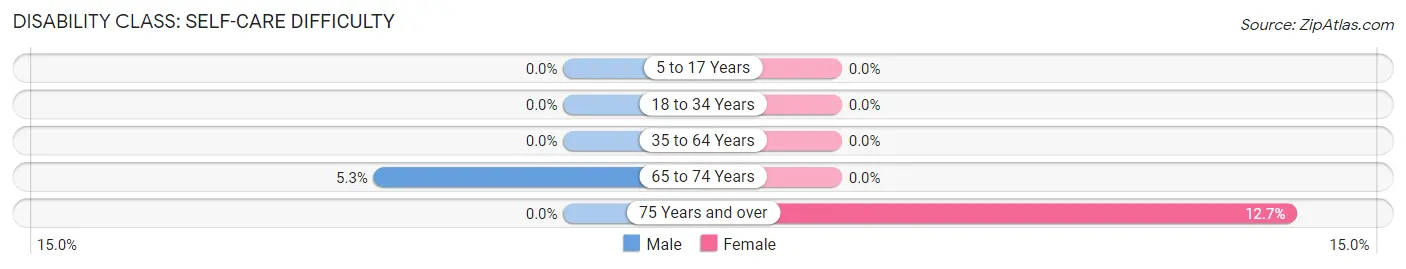
| Age Bracket | Male | Female |
| 5 to 17 Years | 0 (0.0%) | 0 (0.0%) |
| 18 to 34 Years | 0 (0.0%) | 0 (0.0%) |
| 35 to 64 Years | 0 (0.0%) | 0 (0.0%) |
| 65 to 74 Years | 21 (5.3%) | 0 (0.0%) |
| 75 Years and over | 0 (0.0%) | 27 (12.7%) |
Technology Access in Star Valley
Computing Device Access in Star Valley
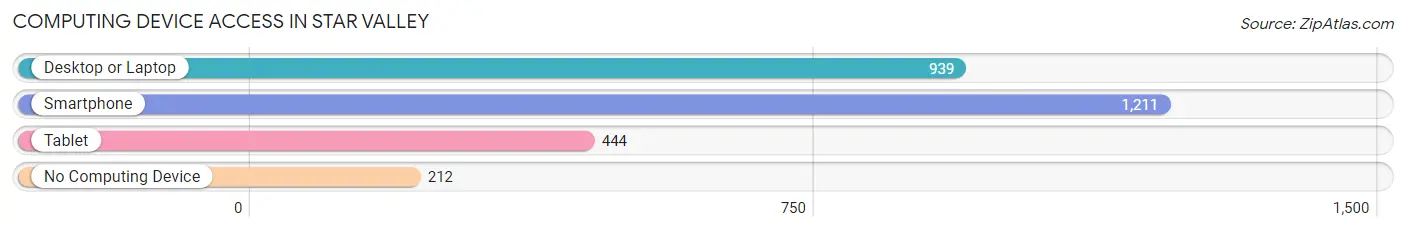
| Device Type | # Households | % Households |
| Desktop or Laptop | 939 | 61.6% |
| Smartphone | 1,211 | 79.5% |
| Tablet | 444 | 29.1% |
| No Computing Device | 212 | 13.9% |
| Total | 1,524 | 100.0% |
Internet Access in Star Valley
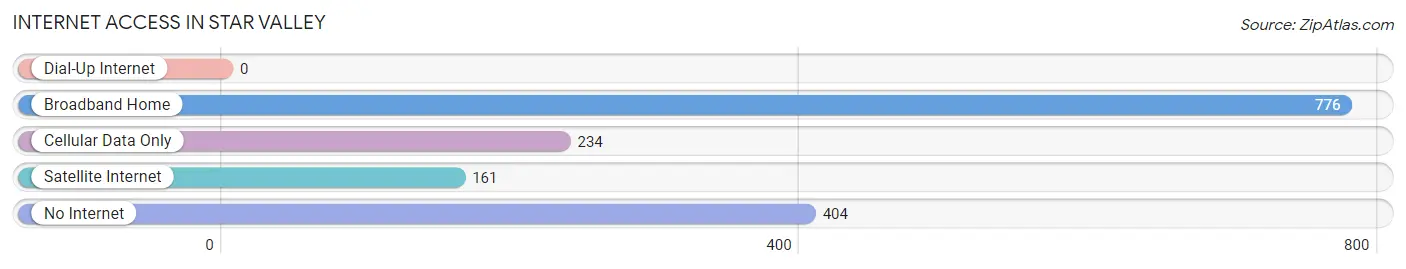
| Internet Type | # Households | % Households |
| Dial-Up Internet | 0 | 0.0% |
| Broadband Home | 776 | 50.9% |
| Cellular Data Only | 234 | 15.3% |
| Satellite Internet | 161 | 10.6% |
| No Internet | 404 | 26.5% |
| Total | 1,524 | 100.0% |
Star Valley Summary
History
Star Valley is a small town located in Gila County, Arizona. It is situated in the White Mountains of Arizona, near the Mogollon Rim. The town was founded in 1878 by Mormon settlers who were sent to the area by Brigham Young. The settlers were sent to the area to establish a Mormon settlement and to help the local Native American tribes. The town was originally called Star Valley Ranch, but the name was changed to Star Valley in 1882.
The town was originally a farming and ranching community, but in the early 1900s, the town began to grow and develop. The first school was built in 1902, and the first post office was established in 1904. The town also had a hotel, a general store, and a blacksmith shop.
In the 1920s, the town began to experience a boom in population and development. The first bank was established in 1921, and the first newspaper was published in 1923. The town also had a movie theater, a library, and a hospital.
In the 1950s, the town began to experience a decline in population and development. The bank closed in 1954, and the newspaper ceased publication in 1956. The hospital closed in 1959, and the movie theater closed in 1960.
In the 1970s, the town began to experience a resurgence in population and development. The first grocery store was established in 1971, and the first gas station was built in 1972. The town also had a library, a post office, and a fire station.
In the 1980s, the town experienced a period of growth and development. The first bank was re-established in 1983, and the first newspaper was re-published in 1984. The town also had a library, a post office, and a fire station.
In the 1990s, the town experienced a period of growth and development. The first grocery store was re-established in 1991, and the first gas station was re-built in 1992. The town also had a library, a post office, and a fire station.
Geography
Star Valley is located in Gila County, Arizona. It is situated in the White Mountains of Arizona, near the Mogollon Rim. The town is located at an elevation of 5,400 feet above sea level. The town is surrounded by the Apache-Sitgreaves National Forest, and the area is known for its scenic beauty.
The town is located in a semi-arid climate, with hot summers and cold winters. The average annual temperature is 57 degrees Fahrenheit, and the average annual precipitation is 12.5 inches.
Economy
The economy of Star Valley is largely based on tourism and agriculture. The town is home to several tourist attractions, including the Star Valley Historical Museum, the Star Valley Ranch, and the Star Valley Observatory. The town also has several restaurants, shops, and lodging facilities.
Agriculture is also an important part of the economy. The town is home to several farms, and the area is known for its production of hay, alfalfa, and other crops.
Demographics
As of the 2010 census, the population of Star Valley was 1,845. The town has a total area of 4.2 square miles, and the population density is 441.7 people per square mile. The median age of the population is 44.7 years, and the median household income is $37,917.
The racial makeup of the town is 95.3% White, 0.7% Native American, 0.3% Asian, 0.2% African American, 0.1% Pacific Islander, and 3.4% from other races. The town also has a large Hispanic population, with 37.3% of the population being of Hispanic or Latino origin.
Conclusion
Star Valley is a small town located in Gila County, Arizona. It is situated in the White Mountains of Arizona, near the Mogollon Rim. The town was founded in 1878 by Mormon settlers, and it has a long history of farming and ranching. Today, the town is known for its scenic beauty and its tourist attractions. The economy of the town is largely based on tourism and agriculture, and the population is largely White and Hispanic.
Common Questions
What is Per Capita Income in Star Valley?
Per Capita income in Star Valley is $47,886.
What is the Median Family Income in Star Valley?
Median Family Income in Star Valley is $83,352.
What is the Median Household income in Star Valley?
Median Household Income in Star Valley is $62,603.
What is Inequality or Gini Index in Star Valley?
Inequality or Gini Index in Star Valley is 0.51.
What is the Total Population of Star Valley?
Total Population of Star Valley is 2,490.
What is the Total Male Population of Star Valley?
Total Male Population of Star Valley is 1,442.
What is the Total Female Population of Star Valley?
Total Female Population of Star Valley is 1,048.
What is the Ratio of Males per 100 Females in Star Valley?
There are 137.60 Males per 100 Females in Star Valley.
What is the Ratio of Females per 100 Males in Star Valley?
There are 72.68 Females per 100 Males in Star Valley.
What is the Median Population Age in Star Valley?
Median Population Age in Star Valley is 65.1 Years.
What is the Average Family Size in Star Valley
Average Family Size in Star Valley is 2.4 People.
What is the Average Household Size in Star Valley
Average Household Size in Star Valley is 1.6 People.
How Large is the Labor Force in Star Valley?
There are 1,199 People in the Labor Forcein in Star Valley.
What is the Percentage of People in the Labor Force in Star Valley?
48.5% of People are in the Labor Force in Star Valley.
What is the Unemployment Rate in Star Valley?
Unemployment Rate in Star Valley is 2.2%.