Sun City West, AZ Map & Demographics
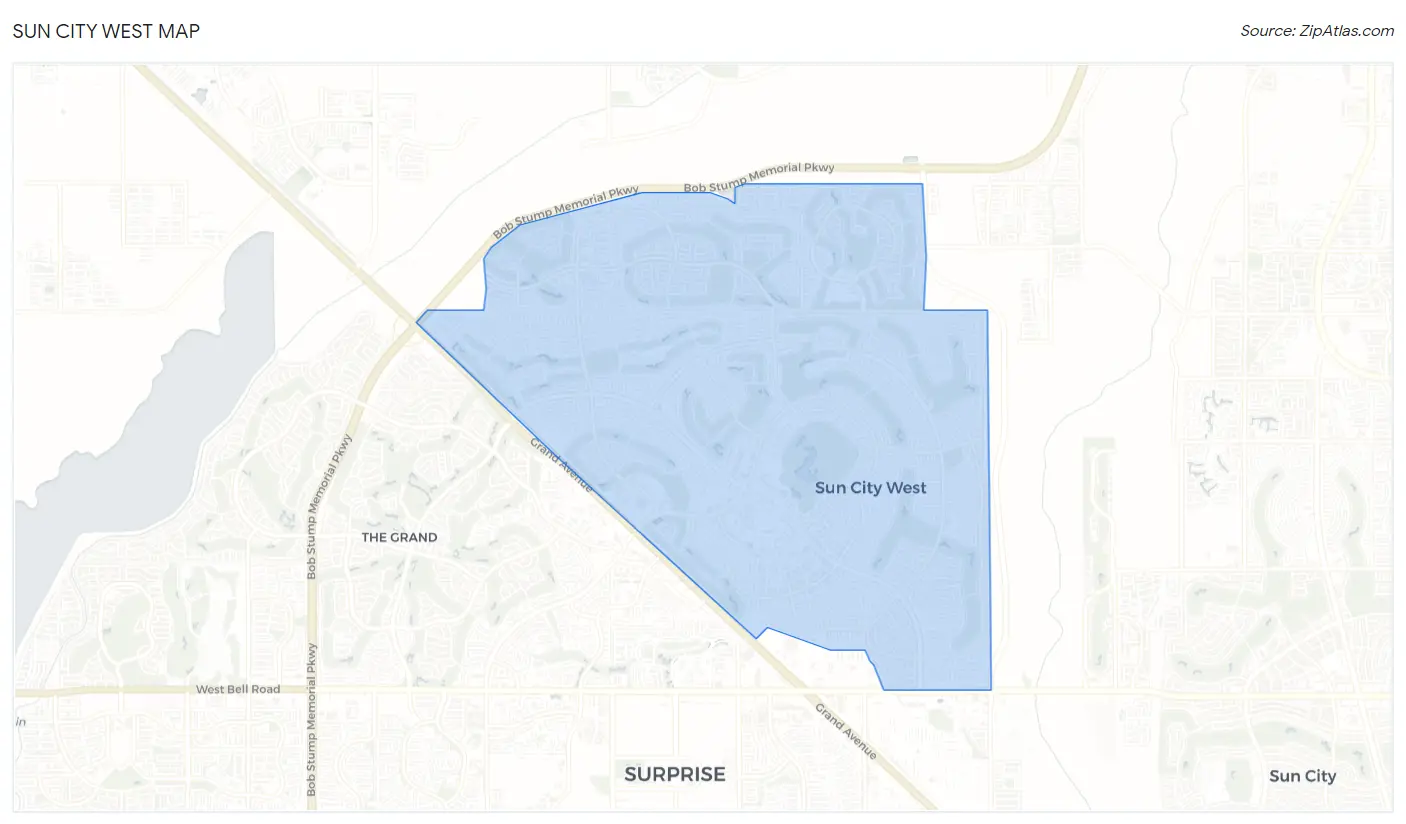
Sun City West Map
Sun City West Overview
$47,913
PER CAPITA INCOME
$81,035
AVG FAMILY INCOME
$61,941
AVG HOUSEHOLD INCOME
1.4%
WAGE / INCOME GAP [ % ]
98.6¢/ $1
WAGE / INCOME GAP [ $ ]
0.41
INEQUALITY / GINI INDEX
26,639
TOTAL POPULATION
12,019
MALE POPULATION
14,620
FEMALE POPULATION
82.21
MALES / 100 FEMALES
121.64
FEMALES / 100 MALES
74.8
MEDIAN AGE
2.0
AVG FAMILY SIZE
1.6
AVG HOUSEHOLD SIZE
3,402
LABOR FORCE [ PEOPLE ]
12.8%
PERCENT IN LABOR FORCE
3.0%
UNEMPLOYMENT RATE
Sun City West Zip Codes
Sun City West Area Codes
Income in Sun City West
Income Overview in Sun City West
Per Capita Income in Sun City West is $47,913, while median incomes of families and households are $81,035 and $61,941 respectively.
| Characteristic | Number | Measure |
| Per Capita Income | 26,639 | $47,913 |
| Median Family Income | 9,364 | $81,035 |
| Mean Family Income | 9,364 | $95,262 |
| Median Household Income | 15,827 | $61,941 |
| Mean Household Income | 15,827 | $79,580 |
| Income Deficit | 9,364 | $0 |
| Wage / Income Gap (%) | 26,639 | 1.36% |
| Wage / Income Gap ($) | 26,639 | 98.64¢ per $1 |
| Gini / Inequality Index | 26,639 | 0.41 |
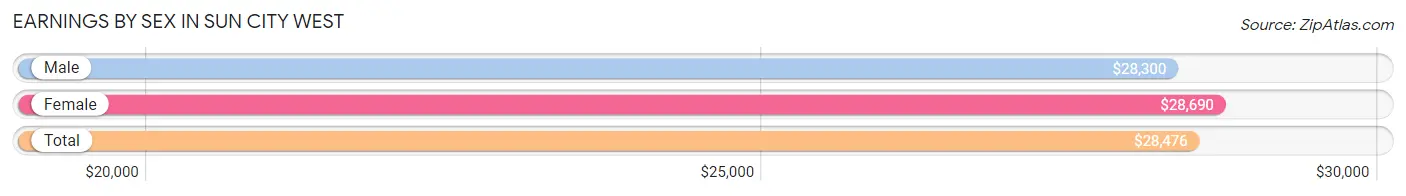
Earnings by Sex in Sun City West
Average Earnings in Sun City West are $28,476, $28,300 for men and $28,690 for women, a difference of 1.4%.
| Sex | Number | Average Earnings |
| Male | 2,176 (50.0%) | $28,300 |
| Female | 2,177 (50.0%) | $28,690 |
| Total | 4,353 (100.0%) | $28,476 |
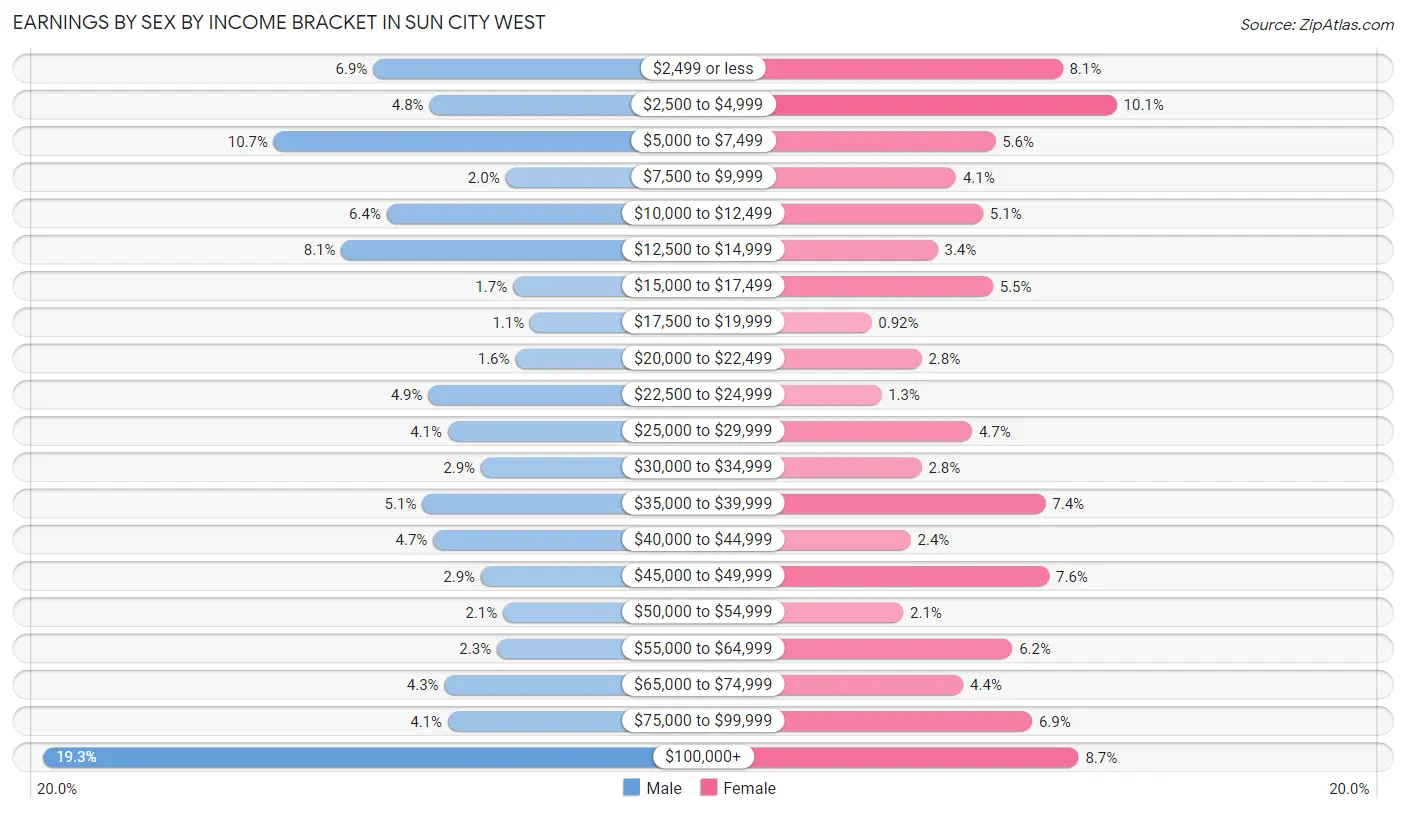
Earnings by Sex by Income Bracket in Sun City West
The most common earnings brackets in Sun City West are $100,000+ for men (420 | 19.3%) and $2,500 to $4,999 for women (220 | 10.1%).
| Income | Male | Female |
| $2,499 or less | 151 (6.9%) | 176 (8.1%) |
| $2,500 to $4,999 | 105 (4.8%) | 220 (10.1%) |
| $5,000 to $7,499 | 232 (10.7%) | 121 (5.6%) |
| $7,500 to $9,999 | 43 (2.0%) | 89 (4.1%) |
| $10,000 to $12,499 | 140 (6.4%) | 111 (5.1%) |
| $12,500 to $14,999 | 177 (8.1%) | 74 (3.4%) |
| $15,000 to $17,499 | 37 (1.7%) | 119 (5.5%) |
| $17,500 to $19,999 | 23 (1.1%) | 20 (0.9%) |
| $20,000 to $22,499 | 35 (1.6%) | 61 (2.8%) |
| $22,500 to $24,999 | 106 (4.9%) | 28 (1.3%) |
| $25,000 to $29,999 | 90 (4.1%) | 102 (4.7%) |
| $30,000 to $34,999 | 63 (2.9%) | 61 (2.8%) |
| $35,000 to $39,999 | 111 (5.1%) | 162 (7.4%) |
| $40,000 to $44,999 | 102 (4.7%) | 52 (2.4%) |
| $45,000 to $49,999 | 63 (2.9%) | 165 (7.6%) |
| $50,000 to $54,999 | 45 (2.1%) | 46 (2.1%) |
| $55,000 to $64,999 | 50 (2.3%) | 135 (6.2%) |
| $65,000 to $74,999 | 93 (4.3%) | 95 (4.4%) |
| $75,000 to $99,999 | 90 (4.1%) | 151 (6.9%) |
| $100,000+ | 420 (19.3%) | 189 (8.7%) |
| Total | 2,176 (100.0%) | 2,177 (100.0%) |
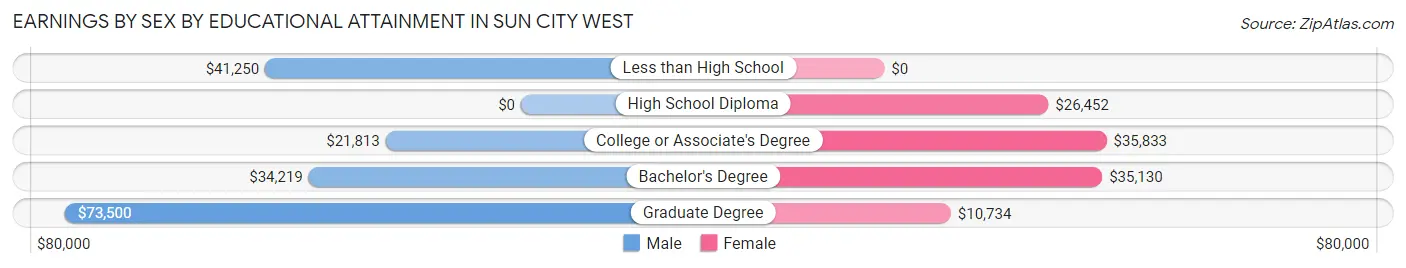
Earnings by Sex by Educational Attainment in Sun City West
Average earnings in Sun City West are $28,467 for men and $29,133 for women, a difference of 2.3%. Men with an educational attainment of graduate degree enjoy the highest average annual earnings of $73,500, while those with college or associate's degree education earn the least with $21,813. Women with an educational attainment of college or associate's degree earn the most with the average annual earnings of $35,833, while those with graduate degree education have the smallest earnings of $10,734.
| Educational Attainment | Male Income | Female Income |
| Less than High School | $41,250 | $0 |
| High School Diploma | - | - |
| College or Associate's Degree | $21,813 | $35,833 |
| Bachelor's Degree | $34,219 | $35,130 |
| Graduate Degree | $73,500 | $10,734 |
| Total | $28,467 | $29,133 |
Family Income in Sun City West
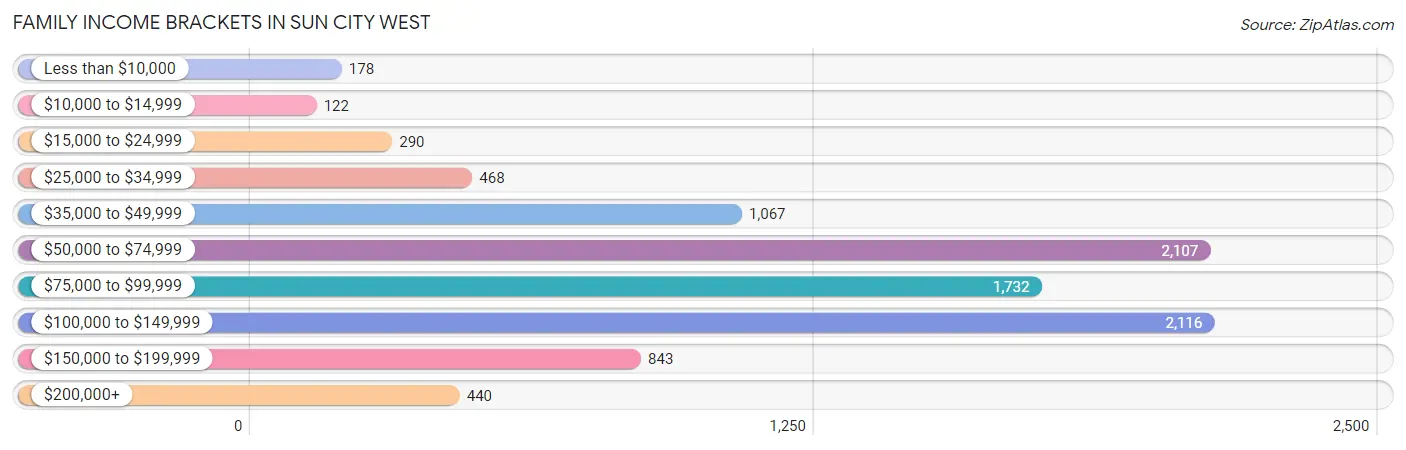
Family Income Brackets in Sun City West
According to the Sun City West family income data, there are 2,116 families falling into the $100,000 to $149,999 income range, which is the most common income bracket and makes up 22.6% of all families. Conversely, the $10,000 to $14,999 income bracket is the least frequent group with only 122 families (1.3%) belonging to this category.
| Income Bracket | # Families | % Families |
| Less than $10,000 | 178 | 1.9% |
| $10,000 to $14,999 | 122 | 1.3% |
| $15,000 to $24,999 | 290 | 3.1% |
| $25,000 to $34,999 | 468 | 5.0% |
| $35,000 to $49,999 | 1,067 | 11.4% |
| $50,000 to $74,999 | 2,107 | 22.5% |
| $75,000 to $99,999 | 1,732 | 18.5% |
| $100,000 to $149,999 | 2,116 | 22.6% |
| $150,000 to $199,999 | 843 | 9.0% |
| $200,000+ | 440 | 4.7% |
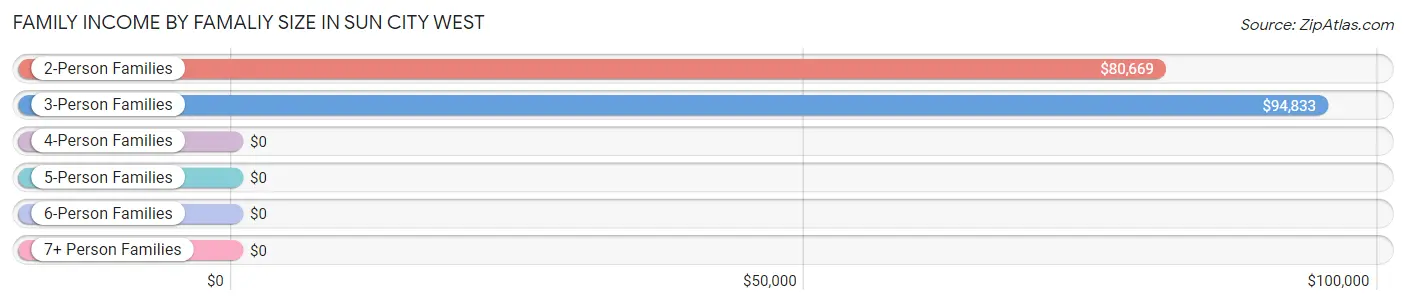
Family Income by Famaliy Size in Sun City West
3-person families (208 | 2.2%) account for the highest median family income in Sun City West with $94,833 per family, while 2-person families (9,156 | 97.8%) have the highest median income of $40,334 per family member.
| Income Bracket | # Families | Median Income |
| 2-Person Families | 9,156 (97.8%) | $80,669 |
| 3-Person Families | 208 (2.2%) | $94,833 |
| 4-Person Families | 0 (0.0%) | $0 |
| 5-Person Families | 0 (0.0%) | $0 |
| 6-Person Families | 0 (0.0%) | $0 |
| 7+ Person Families | 0 (0.0%) | $0 |
| Total | 9,364 (100.0%) | $81,035 |
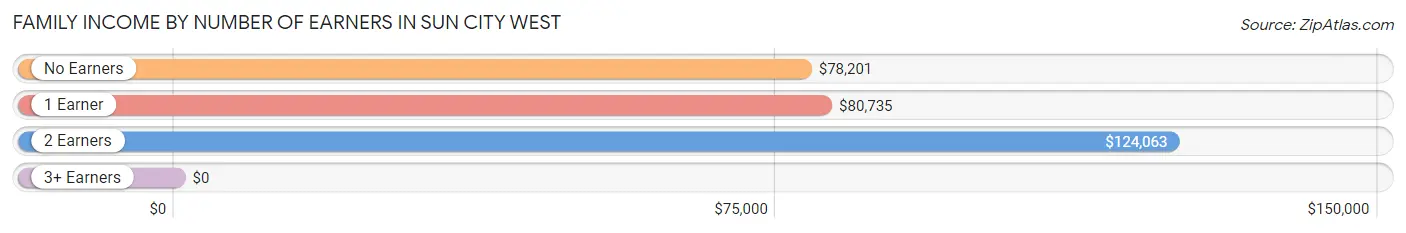
Family Income by Number of Earners in Sun City West
| Number of Earners | # Families | Median Income |
| No Earners | 6,878 (73.5%) | $78,201 |
| 1 Earner | 1,710 (18.3%) | $80,735 |
| 2 Earners | 757 (8.1%) | $124,063 |
| 3+ Earners | 19 (0.2%) | $0 |
| Total | 9,364 (100.0%) | $81,035 |
Household Income in Sun City West
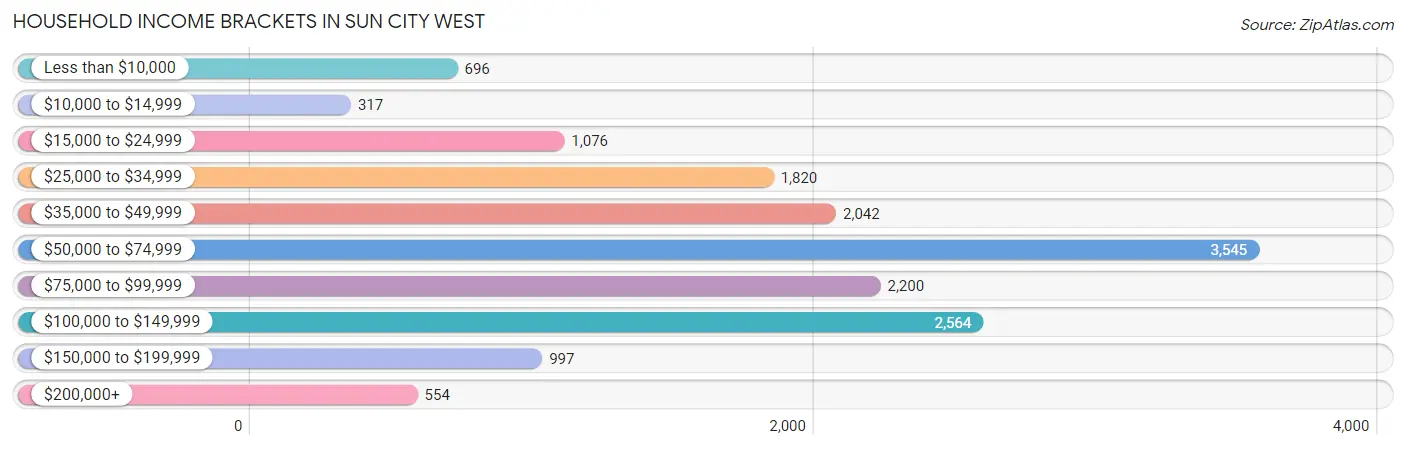
Household Income Brackets in Sun City West
With 3,545 households falling in the category, the $50,000 to $74,999 income range is the most frequent in Sun City West, accounting for 22.4% of all households. In contrast, only 317 households (2.0%) fall into the $10,000 to $14,999 income bracket, making it the least populous group.
| Income Bracket | # Households | % Households |
| Less than $10,000 | 696 | 4.4% |
| $10,000 to $14,999 | 317 | 2.0% |
| $15,000 to $24,999 | 1,076 | 6.8% |
| $25,000 to $34,999 | 1,820 | 11.5% |
| $35,000 to $49,999 | 2,042 | 12.9% |
| $50,000 to $74,999 | 3,545 | 22.4% |
| $75,000 to $99,999 | 2,200 | 13.9% |
| $100,000 to $149,999 | 2,564 | 16.2% |
| $150,000 to $199,999 | 997 | 6.3% |
| $200,000+ | 554 | 3.5% |
Household Income by Householder Age in Sun City West
The median household income in Sun City West is $61,941, with the highest median household income of $69,038 found in the 45 to 64 years age bracket for the primary householder. A total of 1,588 households (10.0%) fall into this category.
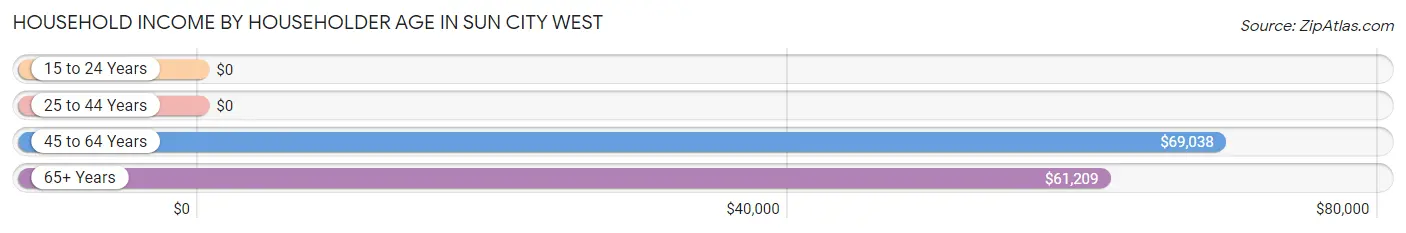
| Income Bracket | # Households | Median Income |
| 15 to 24 Years | 0 (0.0%) | $0 |
| 25 to 44 Years | 81 (0.5%) | $0 |
| 45 to 64 Years | 1,588 (10.0%) | $69,038 |
| 65+ Years | 14,158 (89.4%) | $61,209 |
| Total | 15,827 (100.0%) | $61,941 |
Poverty in Sun City West
Income Below Poverty by Sex and Age in Sun City West
With 6.8% poverty level for males and 8.0% for females among the residents of Sun City West, 18 to 24 year old males and 35 to 44 year old females are the most vulnerable to poverty, with 10 males (50.0%) and 12 females (17.6%) in their respective age groups living below the poverty level.
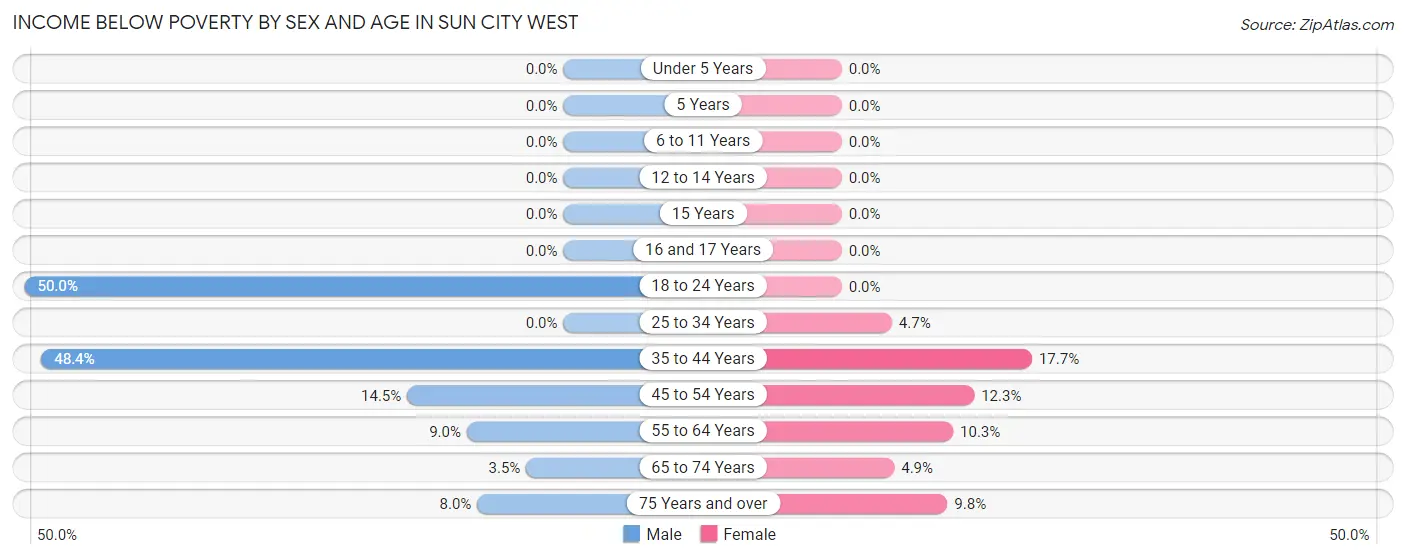
| Age Bracket | Male | Female |
| Under 5 Years | 0 (0.0%) | 0 (0.0%) |
| 5 Years | 0 (0.0%) | 0 (0.0%) |
| 6 to 11 Years | 0 (0.0%) | 0 (0.0%) |
| 12 to 14 Years | 0 (0.0%) | 0 (0.0%) |
| 15 Years | 0 (0.0%) | 0 (0.0%) |
| 16 and 17 Years | 0 (0.0%) | 0 (0.0%) |
| 18 to 24 Years | 10 (50.0%) | 0 (0.0%) |
| 25 to 34 Years | 0 (0.0%) | 2 (4.6%) |
| 35 to 44 Years | 31 (48.4%) | 12 (17.6%) |
| 45 to 54 Years | 39 (14.5%) | 22 (12.3%) |
| 55 to 64 Years | 90 (9.0%) | 179 (10.3%) |
| 65 to 74 Years | 148 (3.5%) | 270 (4.9%) |
| 75 Years and over | 489 (8.0%) | 660 (9.8%) |
| Total | 807 (6.8%) | 1,145 (8.0%) |
Income Above Poverty by Sex and Age in Sun City West
According to the poverty statistics in Sun City West, males aged 6 to 11 years and females aged 6 to 11 years are the age groups that are most secure financially, with 100.0% of males and 100.0% of females in these age groups living above the poverty line.
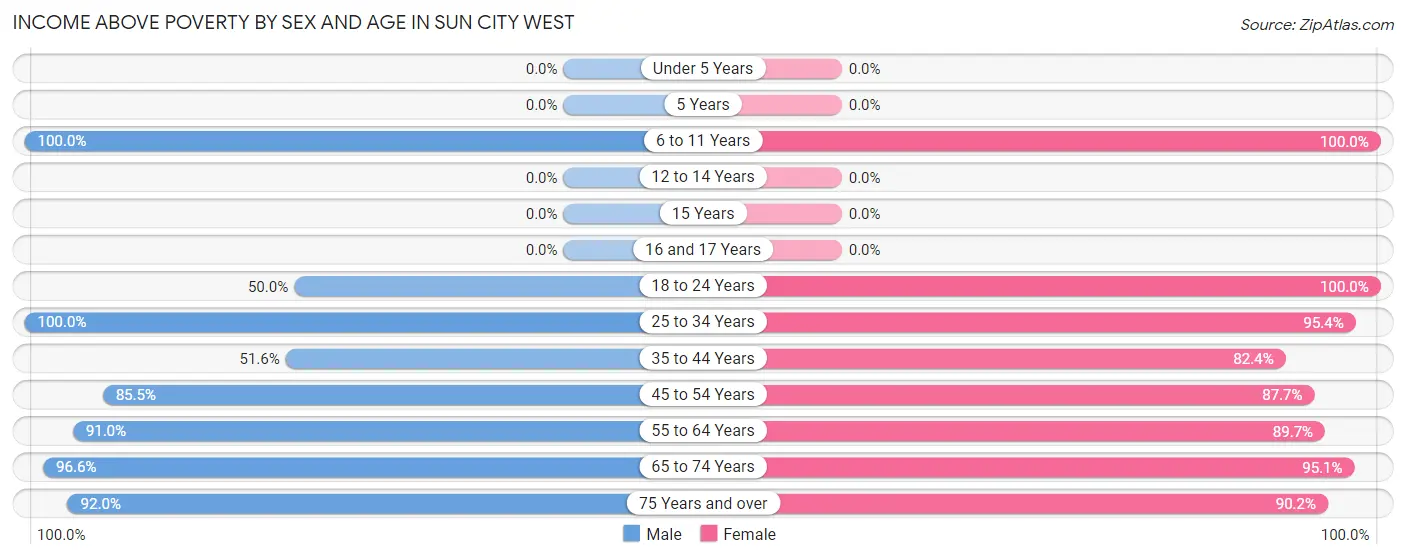
| Age Bracket | Male | Female |
| Under 5 Years | 0 (0.0%) | 0 (0.0%) |
| 5 Years | 0 (0.0%) | 0 (0.0%) |
| 6 to 11 Years | 43 (100.0%) | 19 (100.0%) |
| 12 to 14 Years | 0 (0.0%) | 0 (0.0%) |
| 15 Years | 0 (0.0%) | 0 (0.0%) |
| 16 and 17 Years | 0 (0.0%) | 0 (0.0%) |
| 18 to 24 Years | 10 (50.0%) | 22 (100.0%) |
| 25 to 34 Years | 41 (100.0%) | 41 (95.4%) |
| 35 to 44 Years | 33 (51.6%) | 56 (82.4%) |
| 45 to 54 Years | 230 (85.5%) | 157 (87.7%) |
| 55 to 64 Years | 915 (91.0%) | 1,554 (89.7%) |
| 65 to 74 Years | 4,147 (96.6%) | 5,277 (95.1%) |
| 75 Years and over | 5,623 (92.0%) | 6,072 (90.2%) |
| Total | 11,042 (93.2%) | 13,198 (92.0%) |
Income Below Poverty Among Married-Couple Families in Sun City West
The poverty statistics for married-couple families in Sun City West show that 3.5% or 307 of the total 8,744 families live below the poverty line. Families with no children have the highest poverty rate of 3.5%, comprising of 307 families. On the other hand, families with 1 or 2 children have the lowest poverty rate of 0.0%, which includes 0 families.
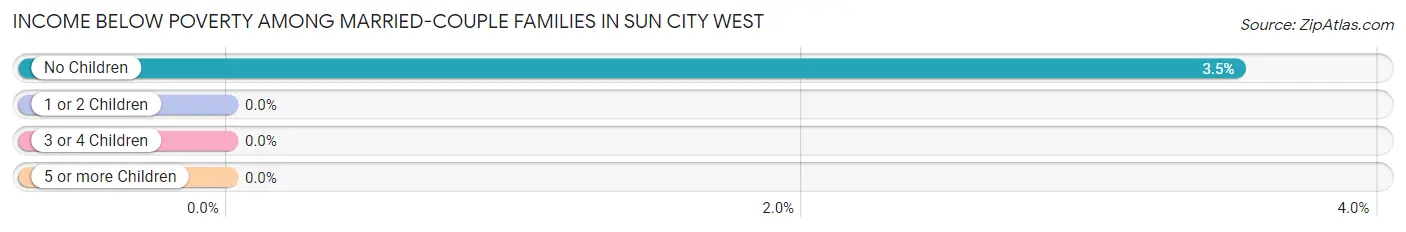
| Children | Above Poverty | Below Poverty |
| No Children | 8,428 (96.5%) | 307 (3.5%) |
| 1 or 2 Children | 9 (100.0%) | 0 (0.0%) |
| 3 or 4 Children | 0 (0.0%) | 0 (0.0%) |
| 5 or more Children | 0 (0.0%) | 0 (0.0%) |
| Total | 8,437 (96.5%) | 307 (3.5%) |
Income Below Poverty Among Single-Parent Households in Sun City West
According to the poverty data in Sun City West, 42.2% or 95 single-father households and 9.4% or 37 single-mother households are living below the poverty line. Among single-father households, those with no children have the highest poverty rate, with 95 households (44.2%) experiencing poverty. Likewise, among single-mother households, those with no children have the highest poverty rate, with 37 households (10.2%) falling below the poverty line.
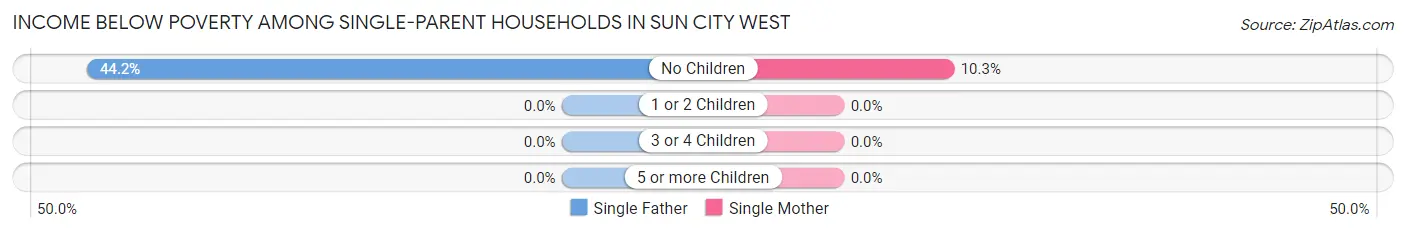
| Children | Single Father | Single Mother |
| No Children | 95 (44.2%) | 37 (10.2%) |
| 1 or 2 Children | 0 (0.0%) | 0 (0.0%) |
| 3 or 4 Children | 0 (0.0%) | 0 (0.0%) |
| 5 or more Children | 0 (0.0%) | 0 (0.0%) |
| Total | 95 (42.2%) | 37 (9.4%) |
Income Below Poverty Among Married-Couple vs Single-Parent Households in Sun City West
The poverty data for Sun City West shows that 307 of the married-couple family households (3.5%) and 132 of the single-parent households (21.3%) are living below the poverty level. Within the married-couple family households, those with no children have the highest poverty rate, with 307 households (3.5%) falling below the poverty line. Among the single-parent households, those with no children have the highest poverty rate, with 132 household (22.9%) living below poverty.
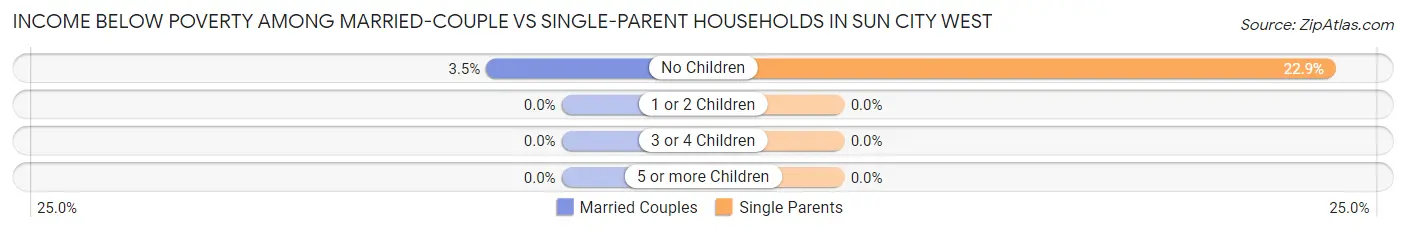
| Children | Married-Couple Families | Single-Parent Households |
| No Children | 307 (3.5%) | 132 (22.9%) |
| 1 or 2 Children | 0 (0.0%) | 0 (0.0%) |
| 3 or 4 Children | 0 (0.0%) | 0 (0.0%) |
| 5 or more Children | 0 (0.0%) | 0 (0.0%) |
| Total | 307 (3.5%) | 132 (21.3%) |
Race in Sun City West
The most populous races in Sun City West are White / Caucasian (25,551 | 95.9%), Hispanic or Latino (378 | 1.4%), and Two or more Races (367 | 1.4%).
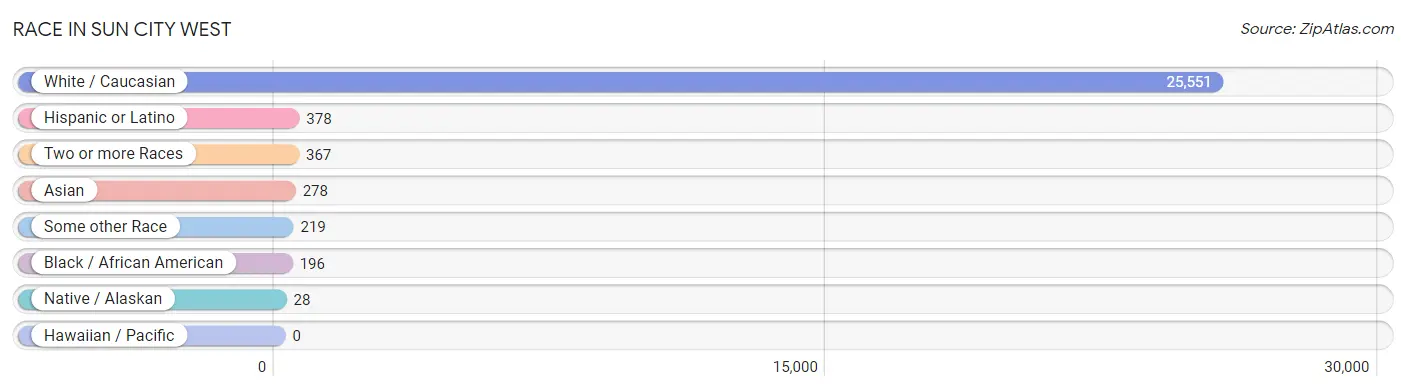
| Race | # Population | % Population |
| Asian | 278 | 1.0% |
| Black / African American | 196 | 0.7% |
| Hawaiian / Pacific | 0 | 0.0% |
| Hispanic or Latino | 378 | 1.4% |
| Native / Alaskan | 28 | 0.1% |
| White / Caucasian | 25,551 | 95.9% |
| Two or more Races | 367 | 1.4% |
| Some other Race | 219 | 0.8% |
| Total | 26,639 | 100.0% |
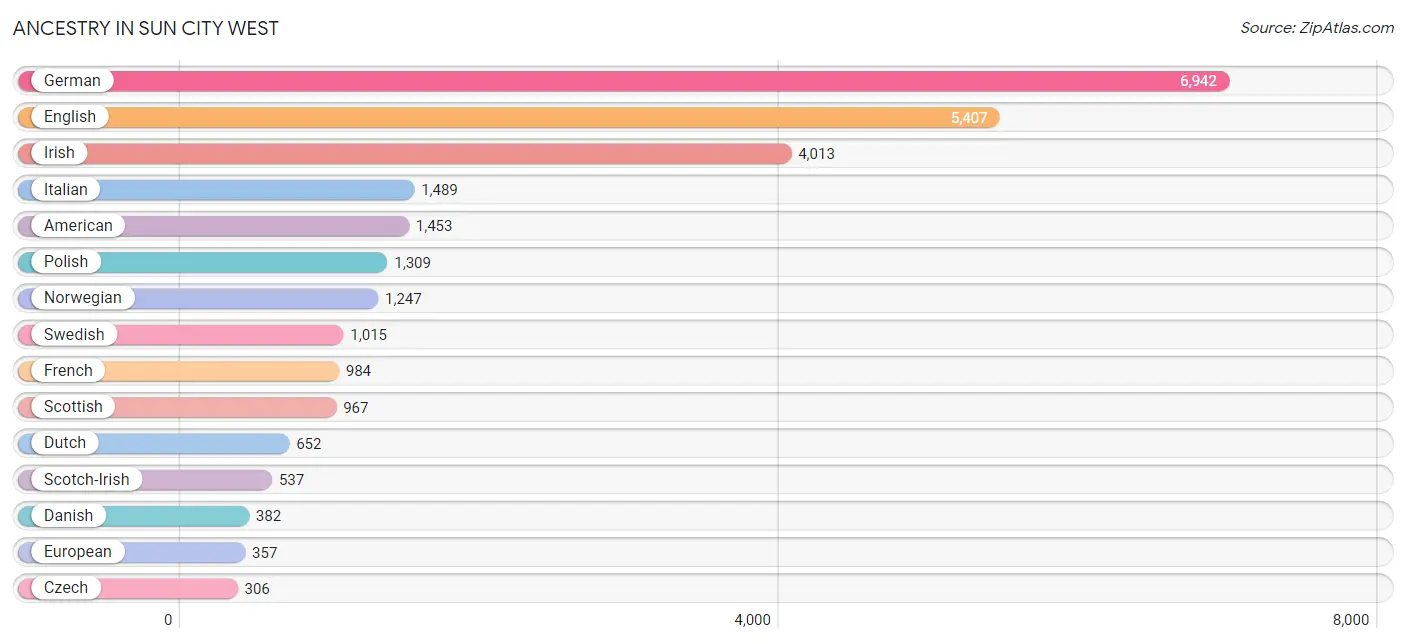
Ancestry in Sun City West
The most populous ancestries reported in Sun City West are German (6,942 | 26.1%), English (5,407 | 20.3%), Irish (4,013 | 15.1%), Italian (1,489 | 5.6%), and American (1,453 | 5.4%), together accounting for 72.5% of all Sun City West residents.
| Ancestry | # Population | % Population |
| American | 1,453 | 5.4% |
| Arab | 25 | 0.1% |
| Argentinean | 16 | 0.1% |
| Armenian | 8 | 0.0% |
| Assyrian / Chaldean / Syriac | 2 | 0.0% |
| Australian | 9 | 0.0% |
| Austrian | 127 | 0.5% |
| Belgian | 71 | 0.3% |
| Bhutanese | 91 | 0.3% |
| British | 188 | 0.7% |
| Bulgarian | 19 | 0.1% |
| Burmese | 9 | 0.0% |
| Canadian | 45 | 0.2% |
| Celtic | 8 | 0.0% |
| Central American | 6 | 0.0% |
| Cherokee | 52 | 0.2% |
| Choctaw | 16 | 0.1% |
| Costa Rican | 6 | 0.0% |
| Croatian | 45 | 0.2% |
| Cuban | 51 | 0.2% |
| Czech | 306 | 1.1% |
| Czechoslovakian | 69 | 0.3% |
| Danish | 382 | 1.4% |
| Dutch | 652 | 2.5% |
| Eastern European | 79 | 0.3% |
| English | 5,407 | 20.3% |
| Estonian | 18 | 0.1% |
| European | 357 | 1.3% |
| Filipino | 10 | 0.0% |
| Finnish | 198 | 0.7% |
| French | 984 | 3.7% |
| French Canadian | 186 | 0.7% |
| German | 6,942 | 26.1% |
| German Russian | 13 | 0.1% |
| Greek | 60 | 0.2% |
| Hungarian | 126 | 0.5% |
| Icelander | 18 | 0.1% |
| Indian (Asian) | 33 | 0.1% |
| Irish | 4,013 | 15.1% |
| Italian | 1,489 | 5.6% |
| Korean | 62 | 0.2% |
| Latvian | 20 | 0.1% |
| Lebanese | 9 | 0.0% |
| Lithuanian | 102 | 0.4% |
| Luxembourger | 15 | 0.1% |
| Maltese | 5 | 0.0% |
| Mexican | 184 | 0.7% |
| Navajo | 21 | 0.1% |
| Northern European | 72 | 0.3% |
| Norwegian | 1,247 | 4.7% |
| Ottawa | 10 | 0.0% |
| Paiute | 7 | 0.0% |
| Pakistani | 19 | 0.1% |
| Pennsylvania German | 14 | 0.1% |
| Polish | 1,309 | 4.9% |
| Portuguese | 57 | 0.2% |
| Puerto Rican | 32 | 0.1% |
| Romanian | 89 | 0.3% |
| Russian | 300 | 1.1% |
| Scandinavian | 211 | 0.8% |
| Scotch-Irish | 537 | 2.0% |
| Scottish | 967 | 3.6% |
| Slavic | 9 | 0.0% |
| Slovak | 145 | 0.5% |
| South American | 16 | 0.1% |
| Spaniard | 24 | 0.1% |
| Spanish | 46 | 0.2% |
| Sri Lankan | 40 | 0.2% |
| Swedish | 1,015 | 3.8% |
| Swiss | 149 | 0.6% |
| Syrian | 8 | 0.0% |
| Thai | 51 | 0.2% |
| Ukrainian | 45 | 0.2% |
| Welsh | 204 | 0.8% |
| Yugoslavian | 19 | 0.1% | View All 75 Rows |
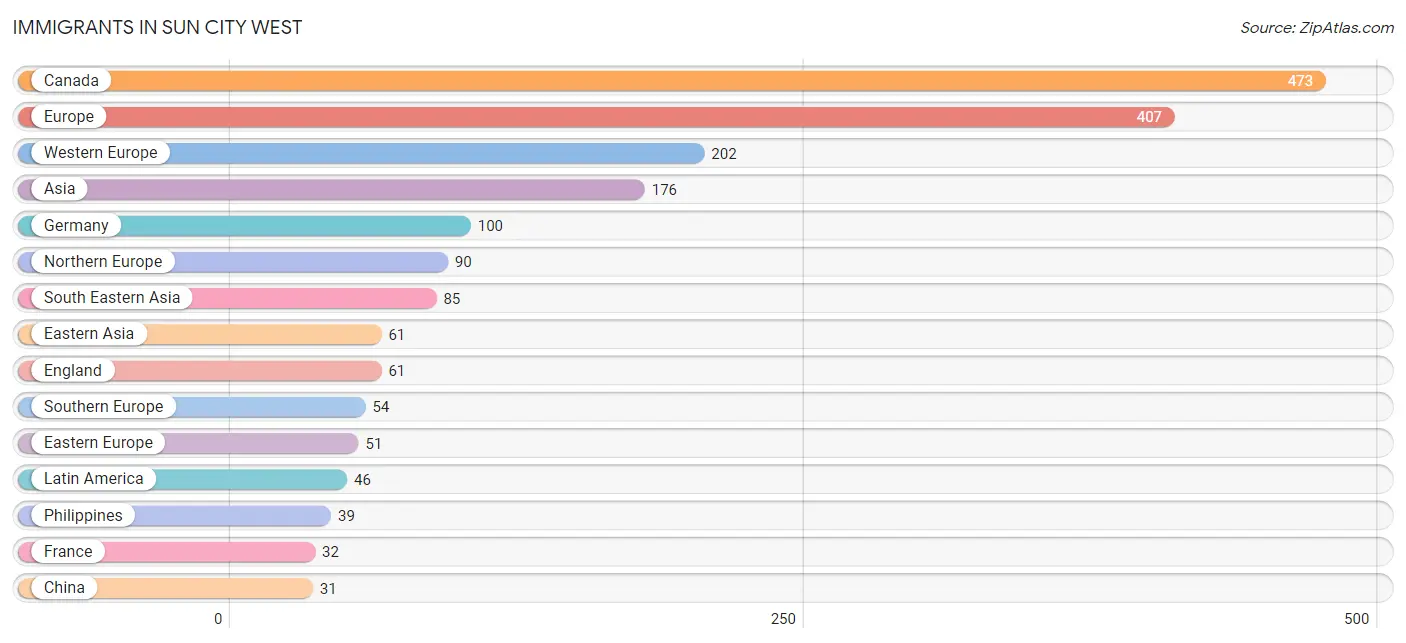
Immigrants in Sun City West
The most numerous immigrant groups reported in Sun City West came from Canada (473 | 1.8%), Europe (407 | 1.5%), Western Europe (202 | 0.8%), Asia (176 | 0.7%), and Germany (100 | 0.4%), together accounting for 5.1% of all Sun City West residents.
| Immigration Origin | # Population | % Population |
| Argentina | 16 | 0.1% |
| Asia | 176 | 0.7% |
| Austria | 25 | 0.1% |
| Bulgaria | 19 | 0.1% |
| Canada | 473 | 1.8% |
| Caribbean | 18 | 0.1% |
| Central America | 12 | 0.1% |
| China | 31 | 0.1% |
| Cuba | 18 | 0.1% |
| Eastern Asia | 61 | 0.2% |
| Eastern Europe | 51 | 0.2% |
| England | 61 | 0.2% |
| Europe | 407 | 1.5% |
| France | 32 | 0.1% |
| Germany | 100 | 0.4% |
| Greece | 4 | 0.0% |
| India | 28 | 0.1% |
| Indonesia | 8 | 0.0% |
| Iraq | 2 | 0.0% |
| Italy | 30 | 0.1% |
| Korea | 30 | 0.1% |
| Latin America | 46 | 0.2% |
| Latvia | 10 | 0.0% |
| Mexico | 12 | 0.1% |
| Netherlands | 29 | 0.1% |
| Northern Europe | 90 | 0.3% |
| Philippines | 39 | 0.2% |
| Poland | 8 | 0.0% |
| Russia | 14 | 0.1% |
| Singapore | 10 | 0.0% |
| South America | 16 | 0.1% |
| South Central Asia | 28 | 0.1% |
| South Eastern Asia | 85 | 0.3% |
| Southern Europe | 54 | 0.2% |
| Spain | 15 | 0.1% |
| Switzerland | 16 | 0.1% |
| Taiwan | 19 | 0.1% |
| Thailand | 2 | 0.0% |
| Vietnam | 26 | 0.1% |
| Western Asia | 2 | 0.0% |
| Western Europe | 202 | 0.8% | View All 41 Rows |
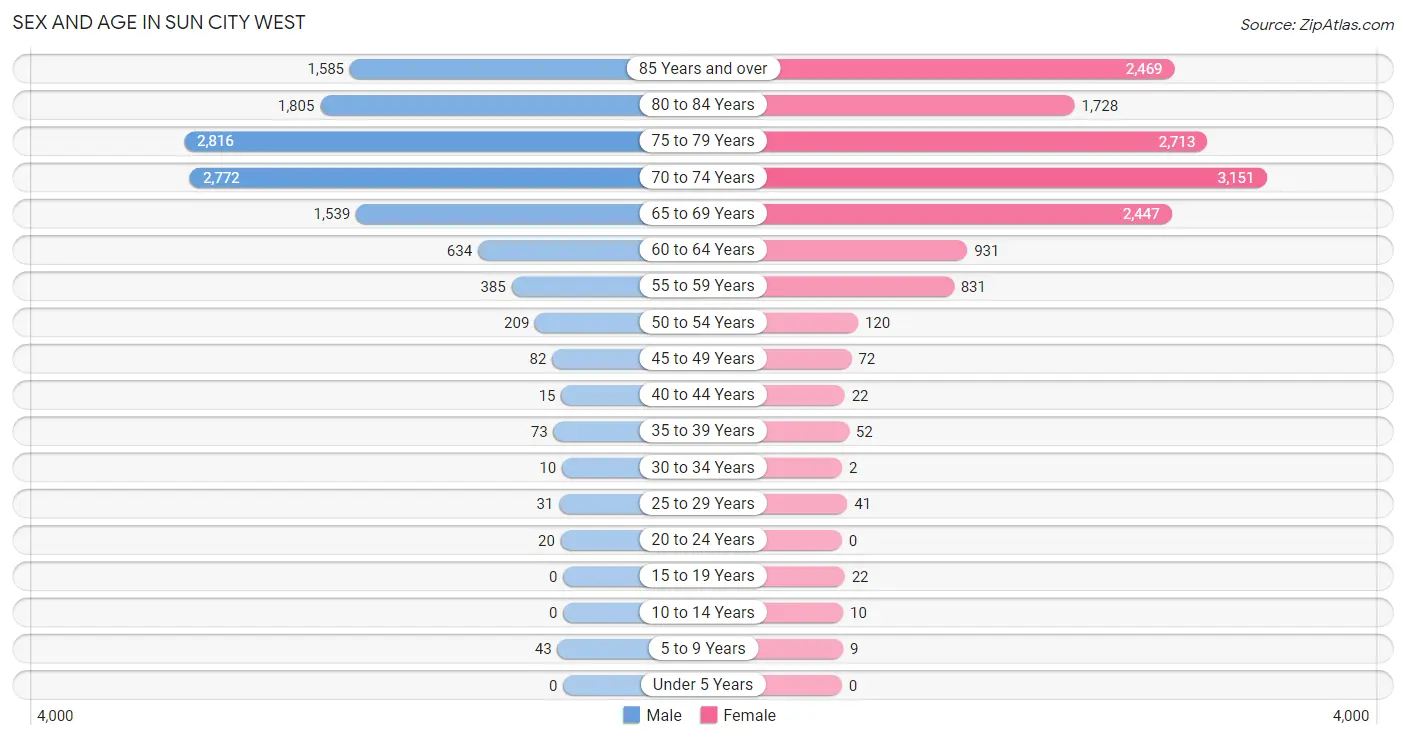
Sex and Age in Sun City West
Sex and Age in Sun City West
The most populous age groups in Sun City West are 75 to 79 Years (2,816 | 23.4%) for men and 70 to 74 Years (3,151 | 21.5%) for women.
| Age Bracket | Male | Female |
| Under 5 Years | 0 (0.0%) | 0 (0.0%) |
| 5 to 9 Years | 43 (0.4%) | 9 (0.1%) |
| 10 to 14 Years | 0 (0.0%) | 10 (0.1%) |
| 15 to 19 Years | 0 (0.0%) | 22 (0.2%) |
| 20 to 24 Years | 20 (0.2%) | 0 (0.0%) |
| 25 to 29 Years | 31 (0.3%) | 41 (0.3%) |
| 30 to 34 Years | 10 (0.1%) | 2 (0.0%) |
| 35 to 39 Years | 73 (0.6%) | 52 (0.4%) |
| 40 to 44 Years | 15 (0.1%) | 22 (0.2%) |
| 45 to 49 Years | 82 (0.7%) | 72 (0.5%) |
| 50 to 54 Years | 209 (1.7%) | 120 (0.8%) |
| 55 to 59 Years | 385 (3.2%) | 831 (5.7%) |
| 60 to 64 Years | 634 (5.3%) | 931 (6.4%) |
| 65 to 69 Years | 1,539 (12.8%) | 2,447 (16.7%) |
| 70 to 74 Years | 2,772 (23.1%) | 3,151 (21.5%) |
| 75 to 79 Years | 2,816 (23.4%) | 2,713 (18.6%) |
| 80 to 84 Years | 1,805 (15.0%) | 1,728 (11.8%) |
| 85 Years and over | 1,585 (13.2%) | 2,469 (16.9%) |
| Total | 12,019 (100.0%) | 14,620 (100.0%) |
Families and Households in Sun City West
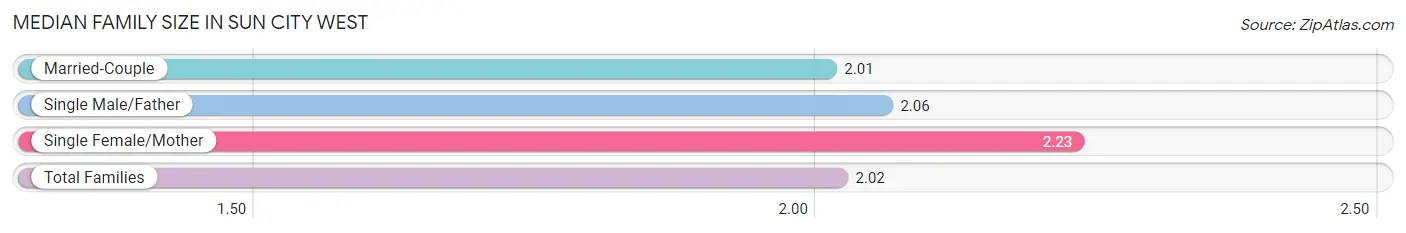
Median Family Size in Sun City West
The median family size in Sun City West is 2.02 persons per family, with single female/mother families (395 | 4.2%) accounting for the largest median family size of 2.23 persons per family. On the other hand, married-couple families (8,744 | 93.4%) represent the smallest median family size with 2.01 persons per family.
| Family Type | # Families | Family Size |
| Married-Couple | 8,744 (93.4%) | 2.01 |
| Single Male/Father | 225 (2.4%) | 2.06 |
| Single Female/Mother | 395 (4.2%) | 2.23 |
| Total Families | 9,364 (100.0%) | 2.02 |
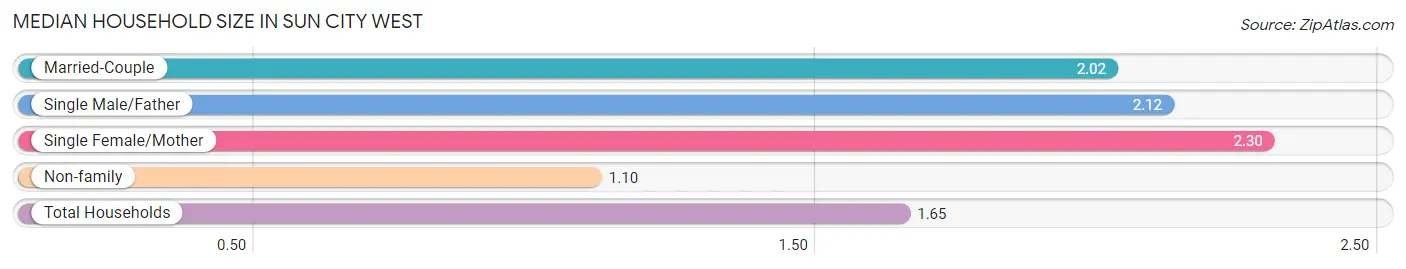
Median Household Size in Sun City West
The median household size in Sun City West is 1.65 persons per household, with single female/mother households (395 | 2.5%) accounting for the largest median household size of 2.3 persons per household. non-family households (6,463 | 40.8%) represent the smallest median household size with 1.10 persons per household.
| Household Type | # Households | Household Size |
| Married-Couple | 8,744 (55.2%) | 2.02 |
| Single Male/Father | 225 (1.4%) | 2.12 |
| Single Female/Mother | 395 (2.5%) | 2.30 |
| Non-family | 6,463 (40.8%) | 1.10 |
| Total Households | 15,827 (100.0%) | 1.65 |
Household Size by Marriage Status in Sun City West
Out of a total of 15,827 households in Sun City West, 9,364 (59.2%) are family households, while 6,463 (40.8%) are nonfamily households. The most numerous type of family households are 2-person households, comprising 9,103, and the most common type of nonfamily households are 1-person households, comprising 5,845.
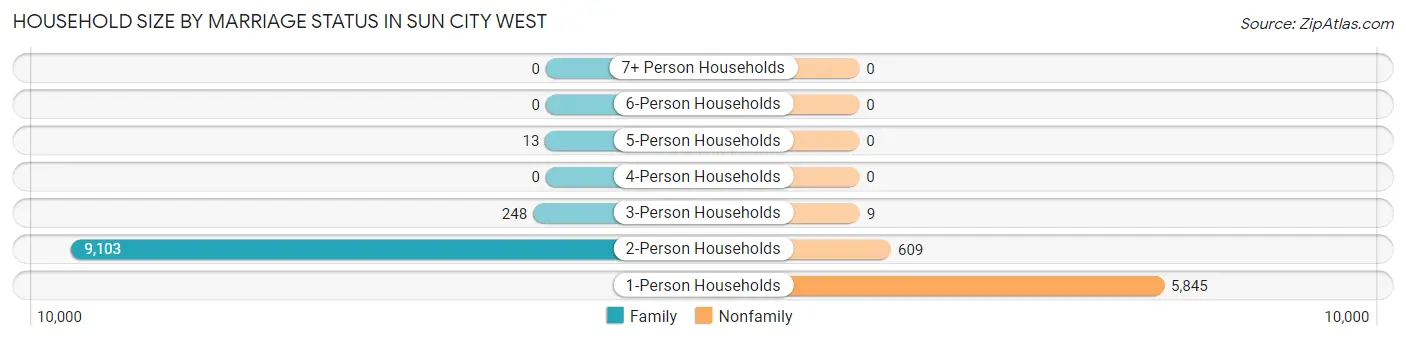
| Household Size | Family Households | Nonfamily Households |
| 1-Person Households | - | 5,845 (36.9%) |
| 2-Person Households | 9,103 (57.5%) | 609 (3.8%) |
| 3-Person Households | 248 (1.6%) | 9 (0.1%) |
| 4-Person Households | 0 (0.0%) | 0 (0.0%) |
| 5-Person Households | 13 (0.1%) | 0 (0.0%) |
| 6-Person Households | 0 (0.0%) | 0 (0.0%) |
| 7+ Person Households | 0 (0.0%) | 0 (0.0%) |
| Total | 9,364 (59.2%) | 6,463 (40.8%) |
Female Fertility in Sun City West
Fertility by Age in Sun City West
| Age Bracket | Women with Births | Births / 1,000 Women |
| 15 to 19 years | 0 (0.0%) | 0.0 |
| 20 to 34 years | 0 (0.0%) | 0.0 |
| 35 to 50 years | 0 (0.0%) | 0.0 |
| Total | 0 (0.0%) | 0.0 |
Fertility by Age by Marriage Status in Sun City West
| Age Bracket | Married | Unmarried |
| 15 to 19 years | 0 (0.0%) | 0 (0.0%) |
| 20 to 34 years | 0 (0.0%) | 0 (0.0%) |
| 35 to 50 years | 0 (0.0%) | 0 (0.0%) |
| Total | 0 (0.0%) | 0 (0.0%) |
Fertility by Education in Sun City West
| Educational Attainment | Women with Births | Births / 1,000 Women |
| Less than High School | 0 (0.0%) | 0.0 |
| High School Diploma | 0 (0.0%) | 0.0 |
| College or Associate's Degree | 0 (0.0%) | 0.0 |
| Bachelor's Degree | 0 (0.0%) | 0.0 |
| Graduate Degree | 0 (0.0%) | 0.0 |
| Total | 0 (0.0%) | 0.0 |
Fertility by Education by Marriage Status in Sun City West
| Educational Attainment | Married | Unmarried |
| Less than High School | 0 (0.0%) | 0 (0.0%) |
| High School Diploma | 0 (0.0%) | 0 (0.0%) |
| College or Associate's Degree | 0 (0.0%) | 0 (0.0%) |
| Bachelor's Degree | 0 (0.0%) | 0 (0.0%) |
| Graduate Degree | 0 (0.0%) | 0 (0.0%) |
| Total | 0 (0.0%) | 0 (0.0%) |
Employment Characteristics in Sun City West
Employment by Class of Employer in Sun City West
Among the 3,200 employed individuals in Sun City West, private company employees (2,038 | 63.7%), not-for-profit organizations (407 | 12.7%), and self-employed (not incorporated) (292 | 9.1%) make up the most common classes of employment.
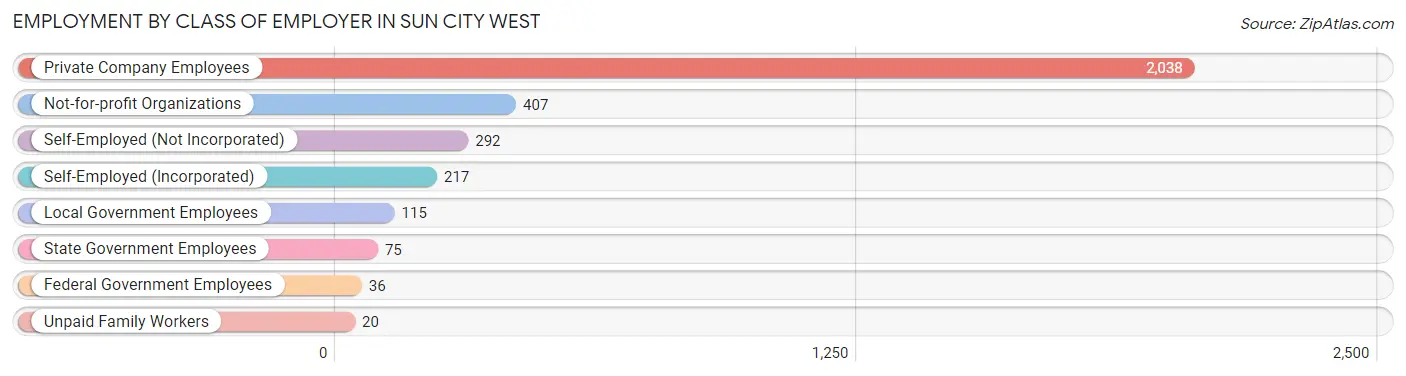
| Employer Class | # Employees | % Employees |
| Private Company Employees | 2,038 | 63.7% |
| Self-Employed (Incorporated) | 217 | 6.8% |
| Self-Employed (Not Incorporated) | 292 | 9.1% |
| Not-for-profit Organizations | 407 | 12.7% |
| Local Government Employees | 115 | 3.6% |
| State Government Employees | 75 | 2.3% |
| Federal Government Employees | 36 | 1.1% |
| Unpaid Family Workers | 20 | 0.6% |
| Total | 3,200 | 100.0% |
Employment Status by Age in Sun City West
According to the labor force statistics for Sun City West, out of the total population over 16 years of age (26,577), 12.8% or 3,402 individuals are in the labor force, with 3.0% or 102 of them unemployed. The age group with the highest labor force participation rate is 16 to 19 years, with 100.0% or 22 individuals in the labor force. Within the labor force, the 35 to 44 years age range has the highest percentage of unemployed individuals, with 12.5% or 10 of them being unemployed.
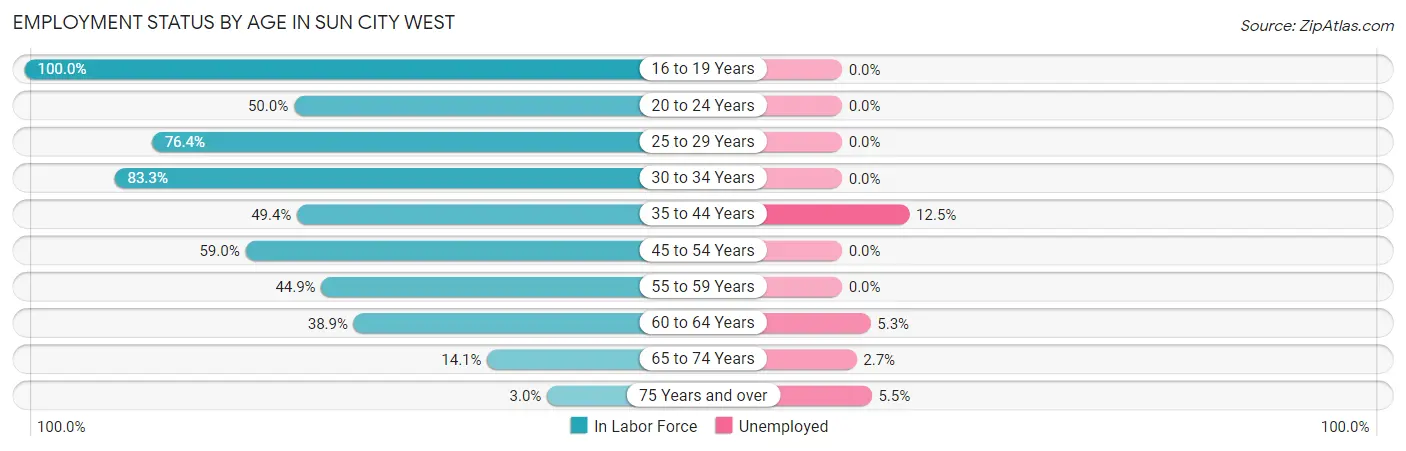
| Age Bracket | In Labor Force | Unemployed |
| 16 to 19 Years | 22 (100.0%) | 0 (0.0%) |
| 20 to 24 Years | 10 (50.0%) | 0 (0.0%) |
| 25 to 29 Years | 55 (76.4%) | 0 (0.0%) |
| 30 to 34 Years | 10 (83.3%) | 0 (0.0%) |
| 35 to 44 Years | 80 (49.4%) | 10 (12.5%) |
| 45 to 54 Years | 285 (59.0%) | 0 (0.0%) |
| 55 to 59 Years | 546 (44.9%) | 0 (0.0%) |
| 60 to 64 Years | 609 (38.9%) | 32 (5.3%) |
| 65 to 74 Years | 1,397 (14.1%) | 38 (2.7%) |
| 75 Years and over | 393 (3.0%) | 22 (5.5%) |
| Total | 3,402 (12.8%) | 102 (3.0%) |
Employment Status by Educational Attainment in Sun City West
According to labor force statistics for Sun City West, 45.2% of individuals (1,587) out of the total population between 25 and 64 years of age (3,510) are in the labor force, with 2.6% or 41 of them being unemployed. The group with the highest labor force participation rate are those with the educational attainment of college / associate degree, with 49.7% or 653 individuals in the labor force. Within the labor force, individuals with bachelor's degree or higher education have the highest percentage of unemployment, with 3.9% or 19 of them being unemployed.
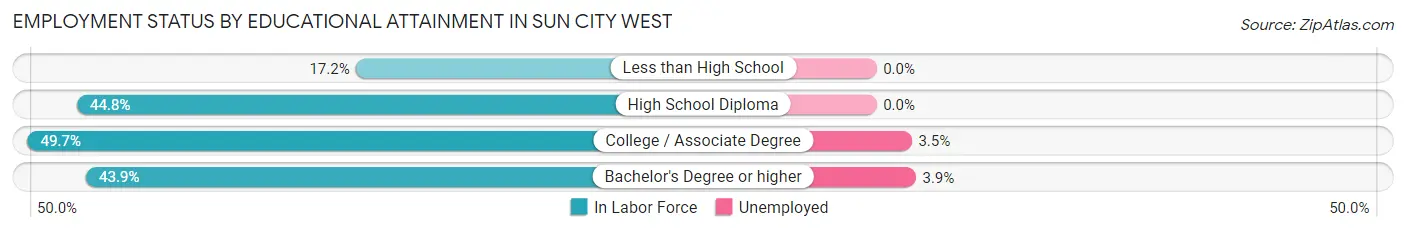
| Educational Attainment | In Labor Force | Unemployed |
| Less than High School | 26 (17.2%) | 0 (0.0%) |
| High School Diploma | 415 (44.8%) | 0 (0.0%) |
| College / Associate Degree | 653 (49.7%) | 46 (3.5%) |
| Bachelor's Degree or higher | 491 (43.9%) | 44 (3.9%) |
| Total | 1,587 (45.2%) | 91 (2.6%) |
Employment Occupations by Sex in Sun City West
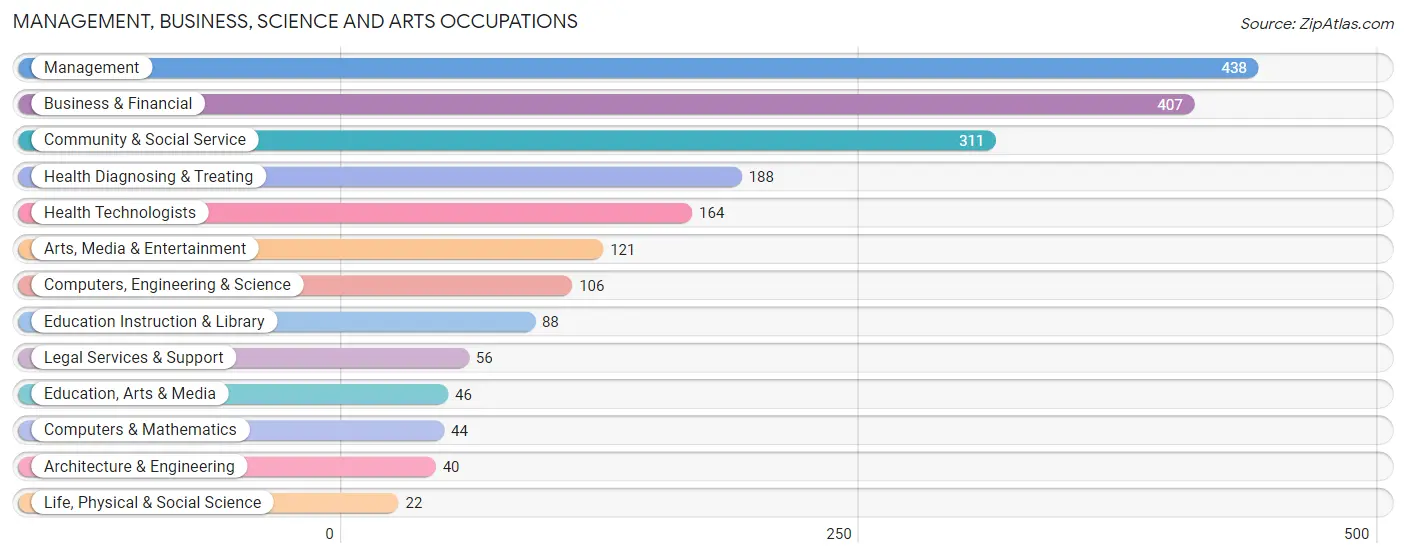
Management, Business, Science and Arts Occupations
The most common Management, Business, Science and Arts occupations in Sun City West are Management (438 | 13.2%), Business & Financial (407 | 12.3%), Community & Social Service (311 | 9.4%), Health Diagnosing & Treating (188 | 5.7%), and Health Technologists (164 | 5.0%).
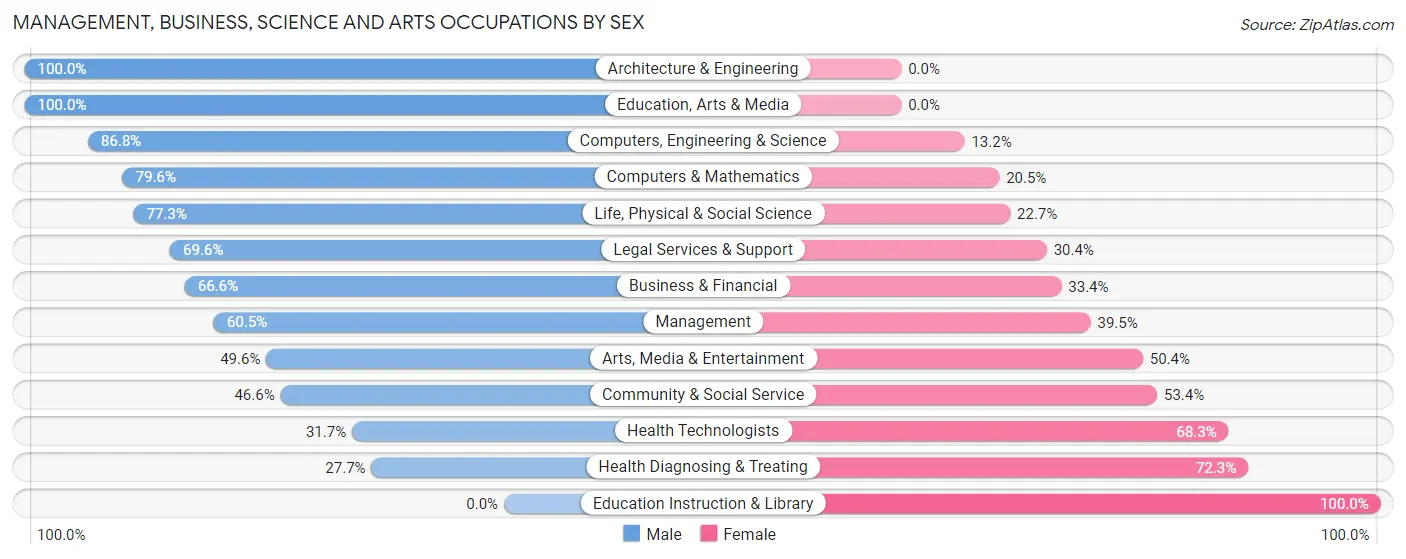
Management, Business, Science and Arts Occupations by Sex
Within the Management, Business, Science and Arts occupations in Sun City West, the most male-oriented occupations are Architecture & Engineering (100.0%), Education, Arts & Media (100.0%), and Computers, Engineering & Science (86.8%), while the most female-oriented occupations are Education Instruction & Library (100.0%), Health Diagnosing & Treating (72.3%), and Health Technologists (68.3%).
| Occupation | Male | Female |
| Management | 265 (60.5%) | 173 (39.5%) |
| Business & Financial | 271 (66.6%) | 136 (33.4%) |
| Computers, Engineering & Science | 92 (86.8%) | 14 (13.2%) |
| Computers & Mathematics | 35 (79.5%) | 9 (20.4%) |
| Architecture & Engineering | 40 (100.0%) | 0 (0.0%) |
| Life, Physical & Social Science | 17 (77.3%) | 5 (22.7%) |
| Community & Social Service | 145 (46.6%) | 166 (53.4%) |
| Education, Arts & Media | 46 (100.0%) | 0 (0.0%) |
| Legal Services & Support | 39 (69.6%) | 17 (30.4%) |
| Education Instruction & Library | 0 (0.0%) | 88 (100.0%) |
| Arts, Media & Entertainment | 60 (49.6%) | 61 (50.4%) |
| Health Diagnosing & Treating | 52 (27.7%) | 136 (72.3%) |
| Health Technologists | 52 (31.7%) | 112 (68.3%) |
| Total (Category) | 825 (56.9%) | 625 (43.1%) |
| Total (Overall) | 1,729 (52.2%) | 1,583 (47.8%) |
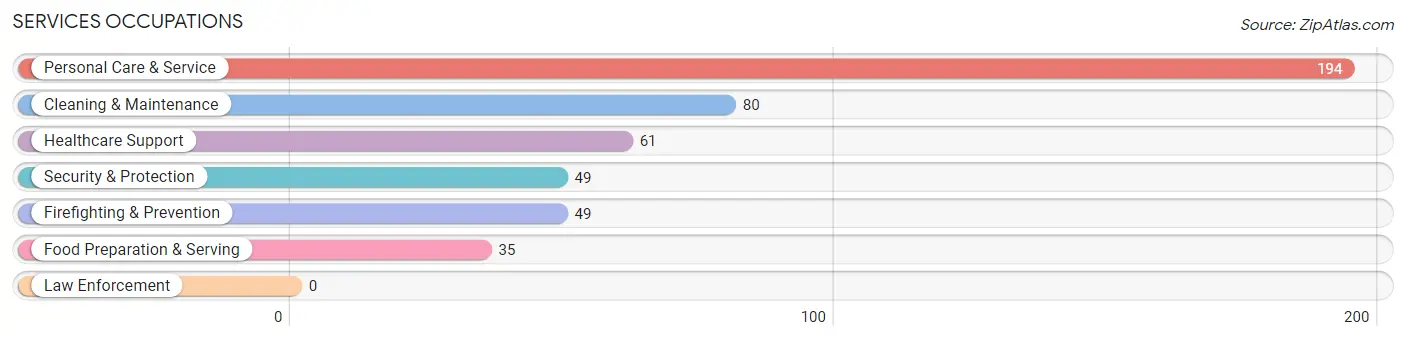
Services Occupations
The most common Services occupations in Sun City West are Personal Care & Service (194 | 5.9%), Cleaning & Maintenance (80 | 2.4%), Healthcare Support (61 | 1.8%), Security & Protection (49 | 1.5%), and Firefighting & Prevention (49 | 1.5%).
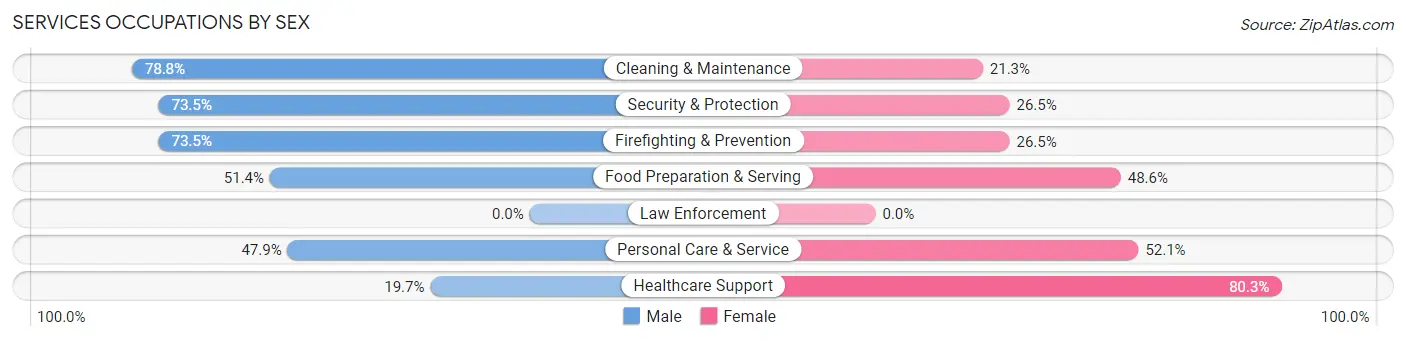
Services Occupations by Sex
Within the Services occupations in Sun City West, the most male-oriented occupations are Cleaning & Maintenance (78.7%), Security & Protection (73.5%), and Firefighting & Prevention (73.5%), while the most female-oriented occupations are Healthcare Support (80.3%), Personal Care & Service (52.1%), and Food Preparation & Serving (48.6%).
| Occupation | Male | Female |
| Healthcare Support | 12 (19.7%) | 49 (80.3%) |
| Security & Protection | 36 (73.5%) | 13 (26.5%) |
| Firefighting & Prevention | 36 (73.5%) | 13 (26.5%) |
| Law Enforcement | 0 (0.0%) | 0 (0.0%) |
| Food Preparation & Serving | 18 (51.4%) | 17 (48.6%) |
| Cleaning & Maintenance | 63 (78.7%) | 17 (21.2%) |
| Personal Care & Service | 93 (47.9%) | 101 (52.1%) |
| Total (Category) | 222 (53.0%) | 197 (47.0%) |
| Total (Overall) | 1,729 (52.2%) | 1,583 (47.8%) |
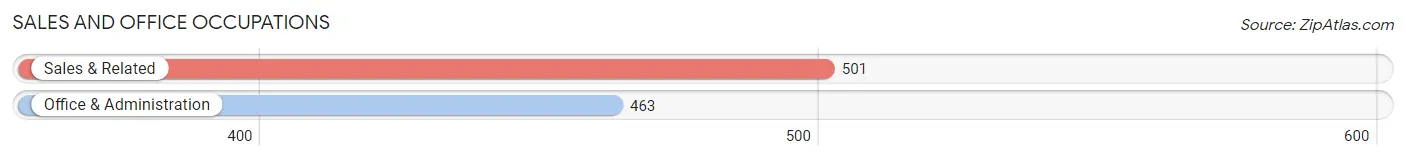
Sales and Office Occupations
The most common Sales and Office occupations in Sun City West are Sales & Related (501 | 15.1%), and Office & Administration (463 | 14.0%).
Sales and Office Occupations by Sex
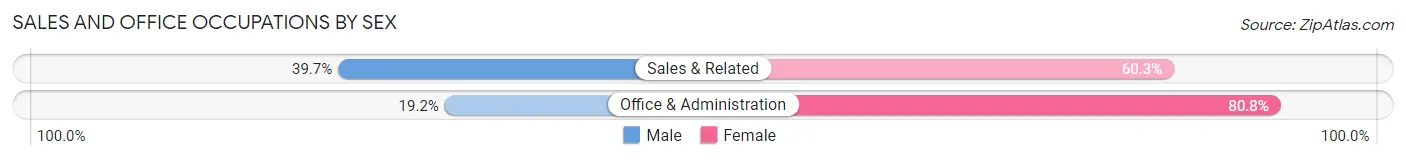
| Occupation | Male | Female |
| Sales & Related | 199 (39.7%) | 302 (60.3%) |
| Office & Administration | 89 (19.2%) | 374 (80.8%) |
| Total (Category) | 288 (29.9%) | 676 (70.1%) |
| Total (Overall) | 1,729 (52.2%) | 1,583 (47.8%) |
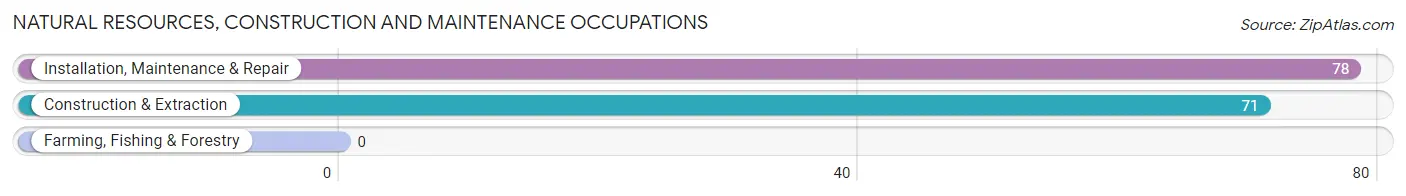
Natural Resources, Construction and Maintenance Occupations
The most common Natural Resources, Construction and Maintenance occupations in Sun City West are Installation, Maintenance & Repair (78 | 2.4%), and Construction & Extraction (71 | 2.1%).
Natural Resources, Construction and Maintenance Occupations by Sex
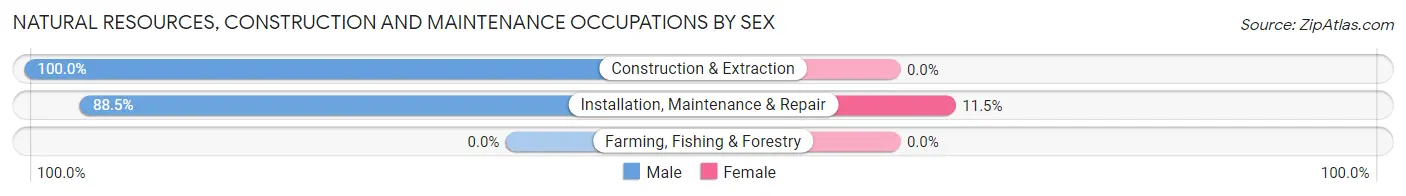
| Occupation | Male | Female |
| Farming, Fishing & Forestry | 0 (0.0%) | 0 (0.0%) |
| Construction & Extraction | 71 (100.0%) | 0 (0.0%) |
| Installation, Maintenance & Repair | 69 (88.5%) | 9 (11.5%) |
| Total (Category) | 140 (94.0%) | 9 (6.0%) |
| Total (Overall) | 1,729 (52.2%) | 1,583 (47.8%) |
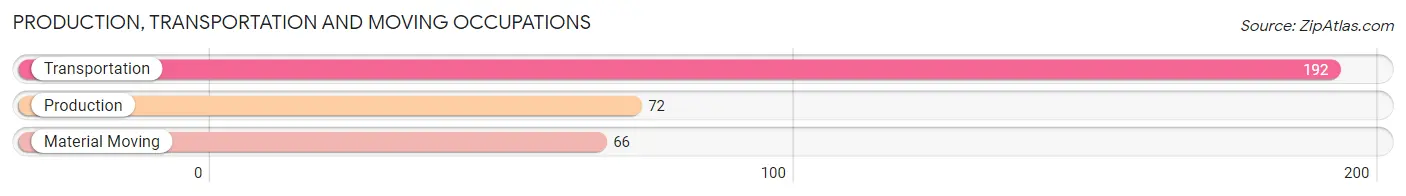
Production, Transportation and Moving Occupations
The most common Production, Transportation and Moving occupations in Sun City West are Transportation (192 | 5.8%), Production (72 | 2.2%), and Material Moving (66 | 2.0%).
Production, Transportation and Moving Occupations by Sex
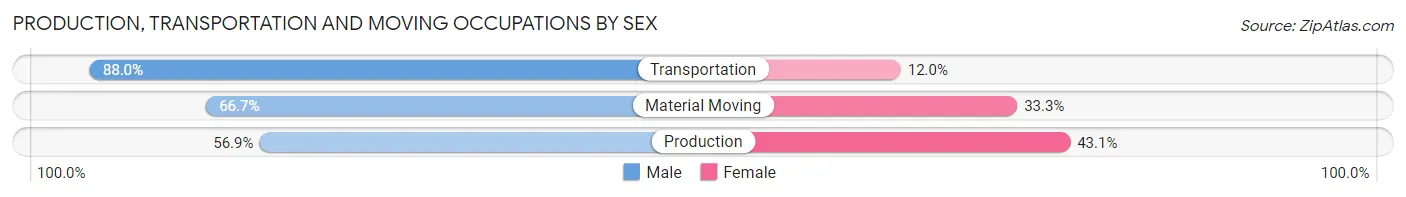
| Occupation | Male | Female |
| Production | 41 (56.9%) | 31 (43.1%) |
| Transportation | 169 (88.0%) | 23 (12.0%) |
| Material Moving | 44 (66.7%) | 22 (33.3%) |
| Total (Category) | 254 (77.0%) | 76 (23.0%) |
| Total (Overall) | 1,729 (52.2%) | 1,583 (47.8%) |
Employment Industries by Sex in Sun City West
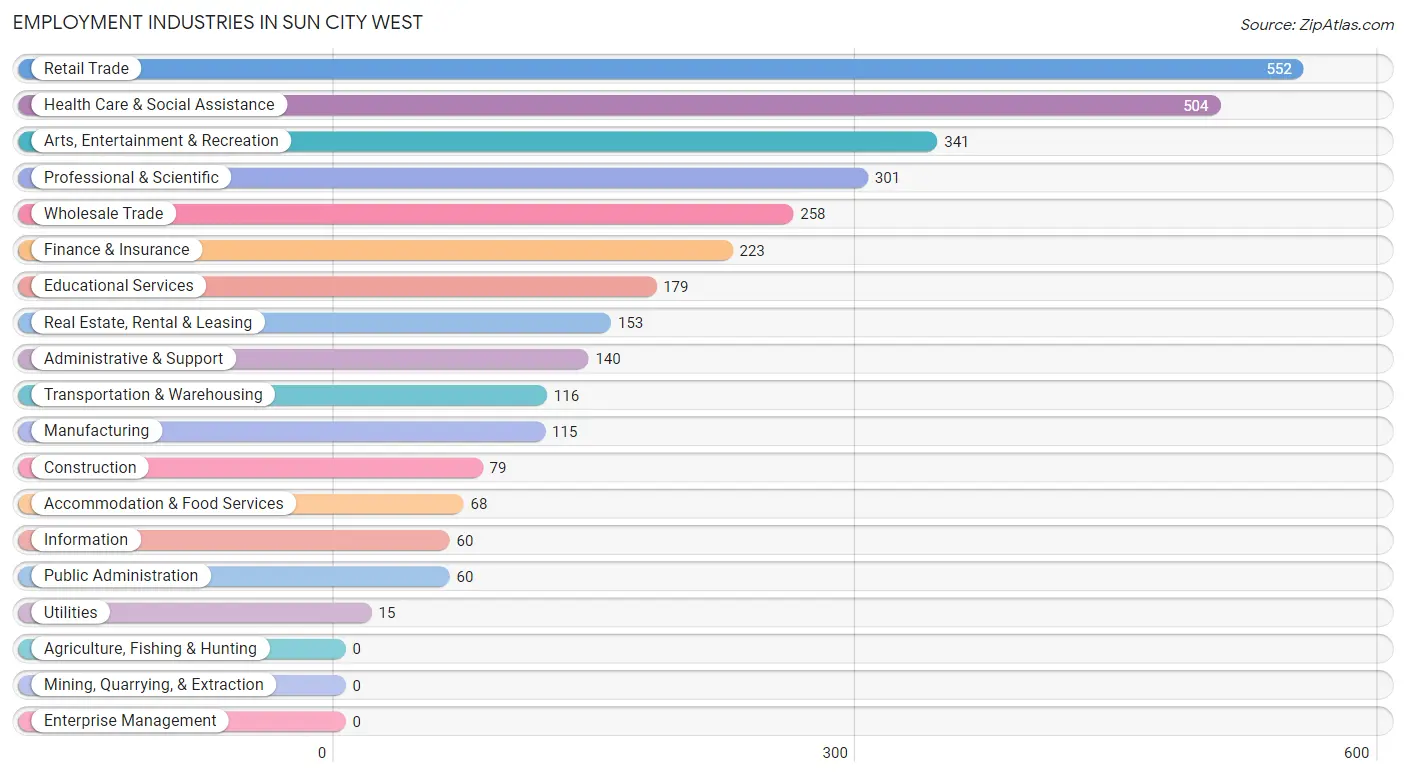
Employment Industries in Sun City West
The major employment industries in Sun City West include Retail Trade (552 | 16.7%), Health Care & Social Assistance (504 | 15.2%), Arts, Entertainment & Recreation (341 | 10.3%), Professional & Scientific (301 | 9.1%), and Wholesale Trade (258 | 7.8%).
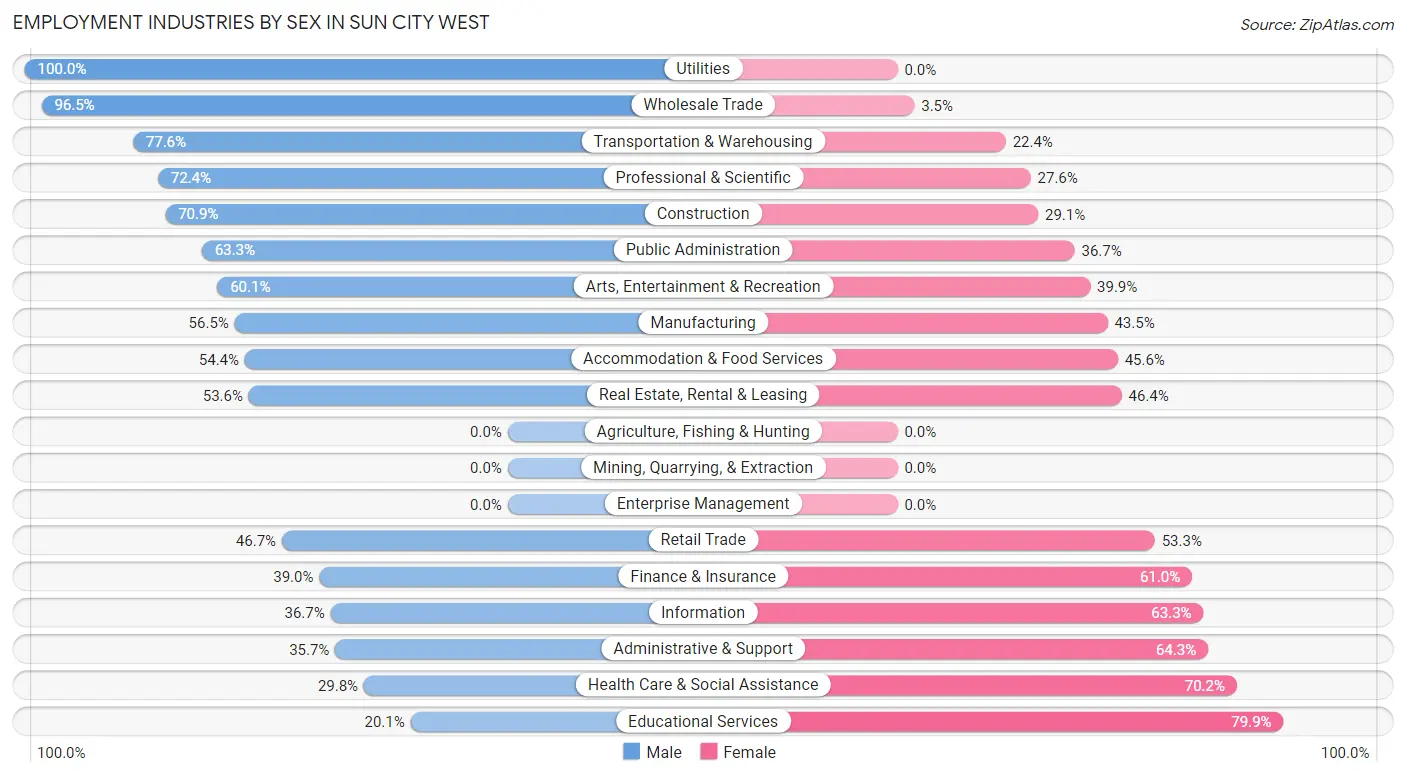
Employment Industries by Sex in Sun City West
The Sun City West industries that see more men than women are Utilities (100.0%), Wholesale Trade (96.5%), and Transportation & Warehousing (77.6%), whereas the industries that tend to have a higher number of women are Educational Services (79.9%), Health Care & Social Assistance (70.2%), and Administrative & Support (64.3%).
| Industry | Male | Female |
| Agriculture, Fishing & Hunting | 0 (0.0%) | 0 (0.0%) |
| Mining, Quarrying, & Extraction | 0 (0.0%) | 0 (0.0%) |
| Construction | 56 (70.9%) | 23 (29.1%) |
| Manufacturing | 65 (56.5%) | 50 (43.5%) |
| Wholesale Trade | 249 (96.5%) | 9 (3.5%) |
| Retail Trade | 258 (46.7%) | 294 (53.3%) |
| Transportation & Warehousing | 90 (77.6%) | 26 (22.4%) |
| Utilities | 15 (100.0%) | 0 (0.0%) |
| Information | 22 (36.7%) | 38 (63.3%) |
| Finance & Insurance | 87 (39.0%) | 136 (61.0%) |
| Real Estate, Rental & Leasing | 82 (53.6%) | 71 (46.4%) |
| Professional & Scientific | 218 (72.4%) | 83 (27.6%) |
| Enterprise Management | 0 (0.0%) | 0 (0.0%) |
| Administrative & Support | 50 (35.7%) | 90 (64.3%) |
| Educational Services | 36 (20.1%) | 143 (79.9%) |
| Health Care & Social Assistance | 150 (29.8%) | 354 (70.2%) |
| Arts, Entertainment & Recreation | 205 (60.1%) | 136 (39.9%) |
| Accommodation & Food Services | 37 (54.4%) | 31 (45.6%) |
| Public Administration | 38 (63.3%) | 22 (36.7%) |
| Total | 1,729 (52.2%) | 1,583 (47.8%) |
Education in Sun City West
School Enrollment in Sun City West
The most common levels of schooling among the 234 students in Sun City West are college / undergraduate (118 | 50.4%), elementary school (62 | 26.5%), and graduate / professional (45 | 19.2%).
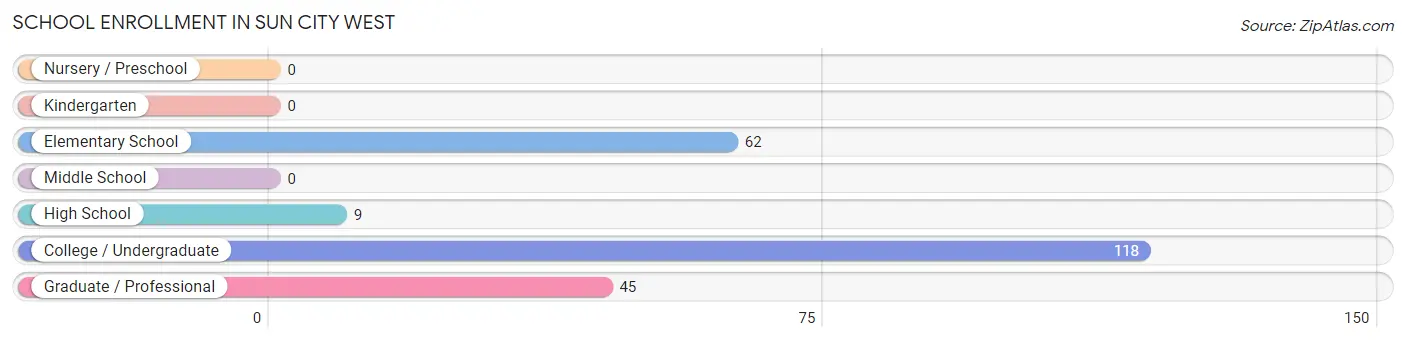
| School Level | # Students | % Students |
| Nursery / Preschool | 0 | 0.0% |
| Kindergarten | 0 | 0.0% |
| Elementary School | 62 | 26.5% |
| Middle School | 0 | 0.0% |
| High School | 9 | 3.8% |
| College / Undergraduate | 118 | 50.4% |
| Graduate / Professional | 45 | 19.2% |
| Total | 234 | 100.0% |
School Enrollment by Age by Funding Source in Sun City West
Out of a total of 234 students who are enrolled in schools in Sun City West, 24 (10.3%) attend a private institution, while the remaining 210 (89.7%) are enrolled in public schools. The age group of 35 years and over has the highest likelihood of being enrolled in private schools, with 24 (19.8% in the age bracket) enrolled. Conversely, the age group of 5 to 9 year old has the lowest likelihood of being enrolled in a private school, with 52 (100.0% in the age bracket) attending a public institution.
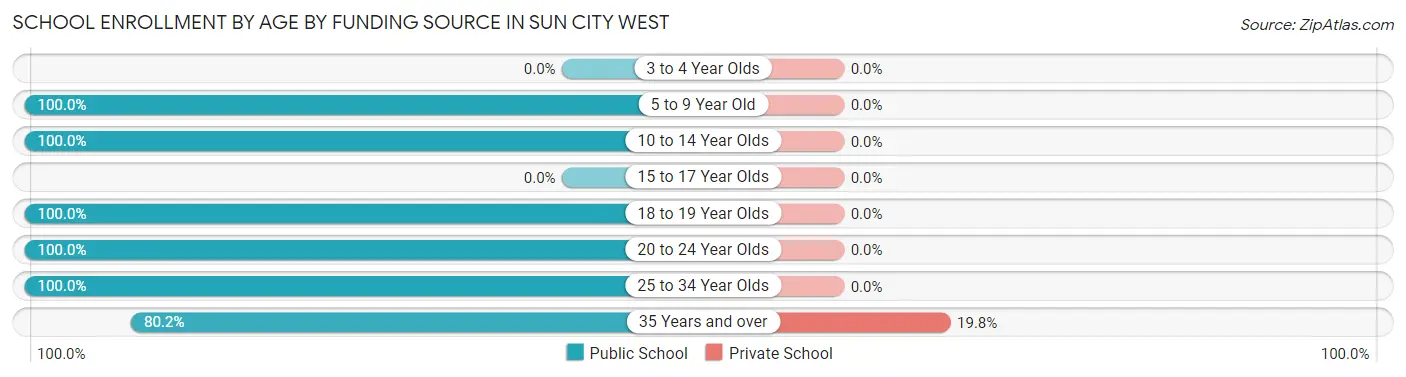
| Age Bracket | Public School | Private School |
| 3 to 4 Year Olds | 0 (0.0%) | 0 (0.0%) |
| 5 to 9 Year Old | 52 (100.0%) | 0 (0.0%) |
| 10 to 14 Year Olds | 10 (100.0%) | 0 (0.0%) |
| 15 to 17 Year Olds | 0 (0.0%) | 0 (0.0%) |
| 18 to 19 Year Olds | 22 (100.0%) | 0 (0.0%) |
| 20 to 24 Year Olds | 10 (100.0%) | 0 (0.0%) |
| 25 to 34 Year Olds | 19 (100.0%) | 0 (0.0%) |
| 35 Years and over | 97 (80.2%) | 24 (19.8%) |
| Total | 210 (89.7%) | 24 (10.3%) |
Educational Attainment by Field of Study in Sun City West
Education (2,278 | 23.1%), business (2,186 | 22.1%), science & technology (1,013 | 10.3%), engineering (801 | 8.1%), and social sciences (616 | 6.2%) are the most common fields of study among 9,876 individuals in Sun City West who have obtained a bachelor's degree or higher.
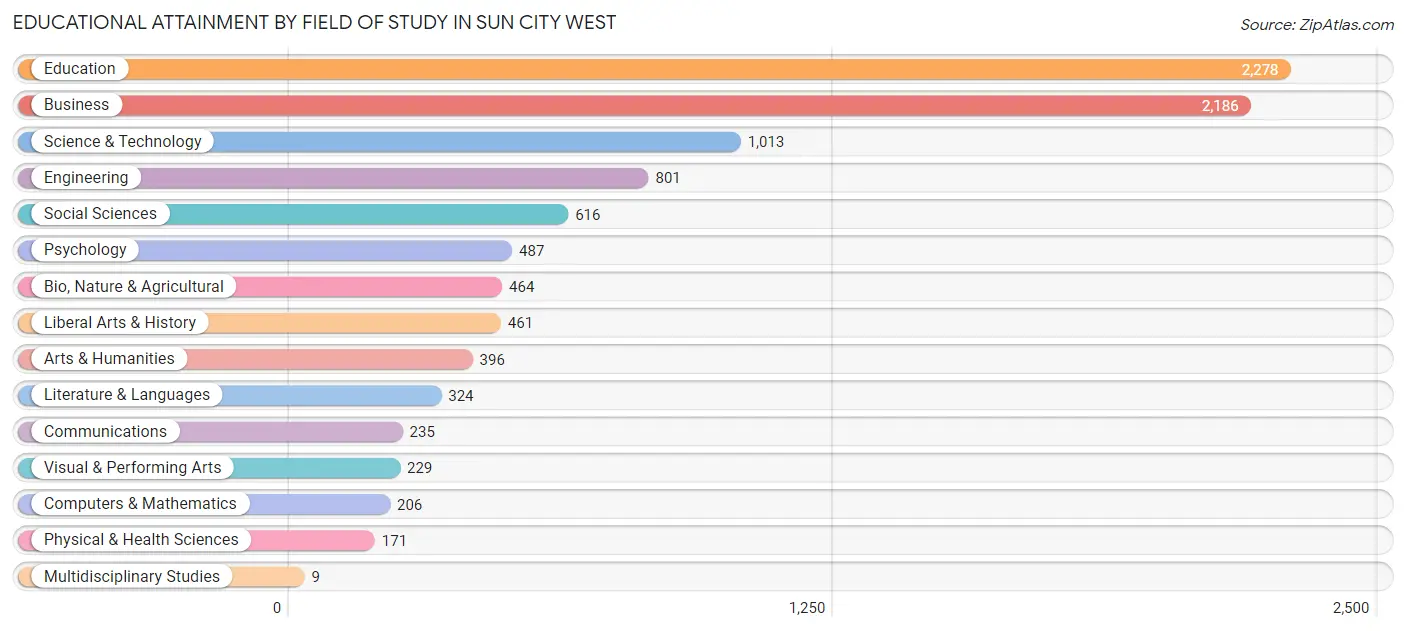
| Field of Study | # Graduates | % Graduates |
| Computers & Mathematics | 206 | 2.1% |
| Bio, Nature & Agricultural | 464 | 4.7% |
| Physical & Health Sciences | 171 | 1.7% |
| Psychology | 487 | 4.9% |
| Social Sciences | 616 | 6.2% |
| Engineering | 801 | 8.1% |
| Multidisciplinary Studies | 9 | 0.1% |
| Science & Technology | 1,013 | 10.3% |
| Business | 2,186 | 22.1% |
| Education | 2,278 | 23.1% |
| Literature & Languages | 324 | 3.3% |
| Liberal Arts & History | 461 | 4.7% |
| Visual & Performing Arts | 229 | 2.3% |
| Communications | 235 | 2.4% |
| Arts & Humanities | 396 | 4.0% |
| Total | 9,876 | 100.0% |
Transportation & Commute in Sun City West
Vehicle Availability by Sex in Sun City West
The most prevalent vehicle ownership categories in Sun City West are males with 2 vehicles (970, accounting for 58.3%) and females with 2 vehicles (685, making up 63.2%).
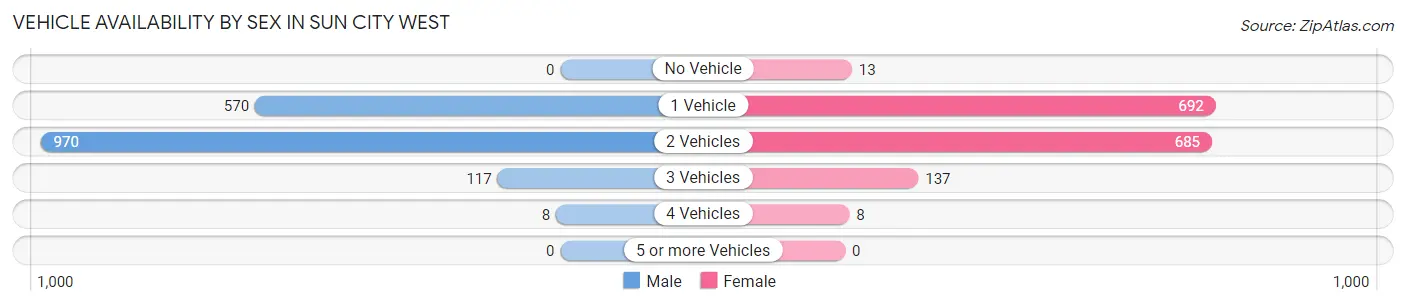
| Vehicles Available | Male | Female |
| No Vehicle | 0 (0.0%) | 13 (0.9%) |
| 1 Vehicle | 570 (34.2%) | 692 (45.1%) |
| 2 Vehicles | 970 (58.3%) | 685 (44.6%) |
| 3 Vehicles | 117 (7.0%) | 137 (8.9%) |
| 4 Vehicles | 8 (0.5%) | 8 (0.5%) |
| 5 or more Vehicles | 0 (0.0%) | 0 (0.0%) |
| Total | 1,665 (100.0%) | 1,535 (100.0%) |
Commute Time in Sun City West
The most frequently occuring commute durations in Sun City West are 5 to 9 minutes (610 commuters, 23.5%), 10 to 14 minutes (425 commuters, 16.4%), and 20 to 24 minutes (275 commuters, 10.6%).
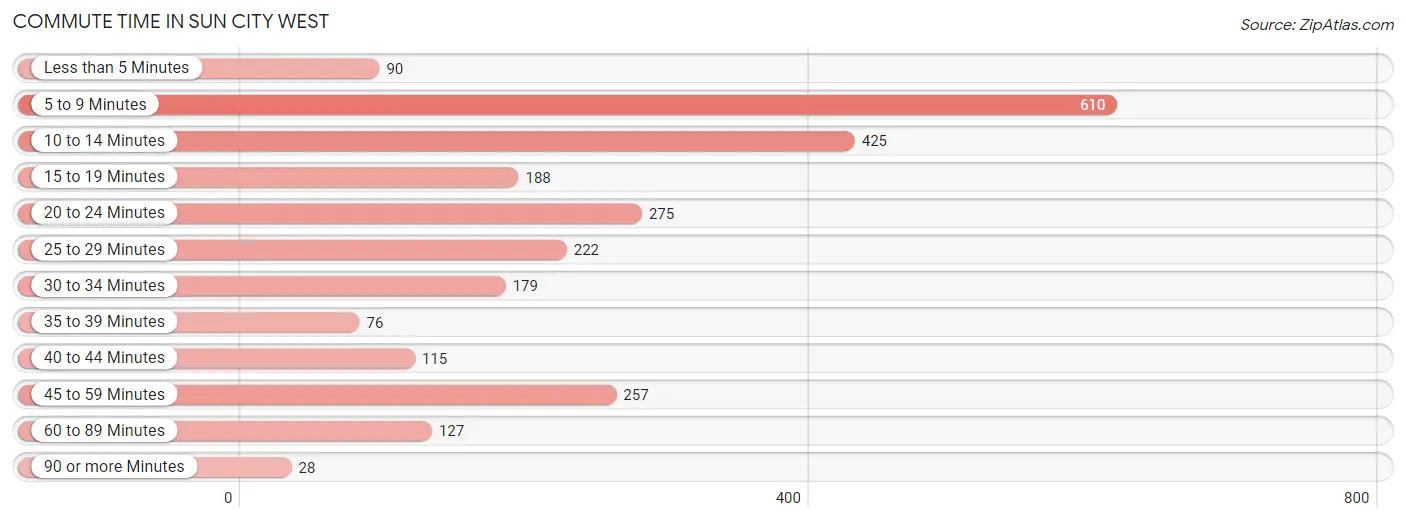
| Commute Time | # Commuters | % Commuters |
| Less than 5 Minutes | 90 | 3.5% |
| 5 to 9 Minutes | 610 | 23.5% |
| 10 to 14 Minutes | 425 | 16.4% |
| 15 to 19 Minutes | 188 | 7.2% |
| 20 to 24 Minutes | 275 | 10.6% |
| 25 to 29 Minutes | 222 | 8.6% |
| 30 to 34 Minutes | 179 | 6.9% |
| 35 to 39 Minutes | 76 | 2.9% |
| 40 to 44 Minutes | 115 | 4.4% |
| 45 to 59 Minutes | 257 | 9.9% |
| 60 to 89 Minutes | 127 | 4.9% |
| 90 or more Minutes | 28 | 1.1% |
Commute Time by Sex in Sun City West
The most common commute times in Sun City West are 5 to 9 minutes (285 commuters, 20.7%) for males and 5 to 9 minutes (325 commuters, 26.8%) for females.
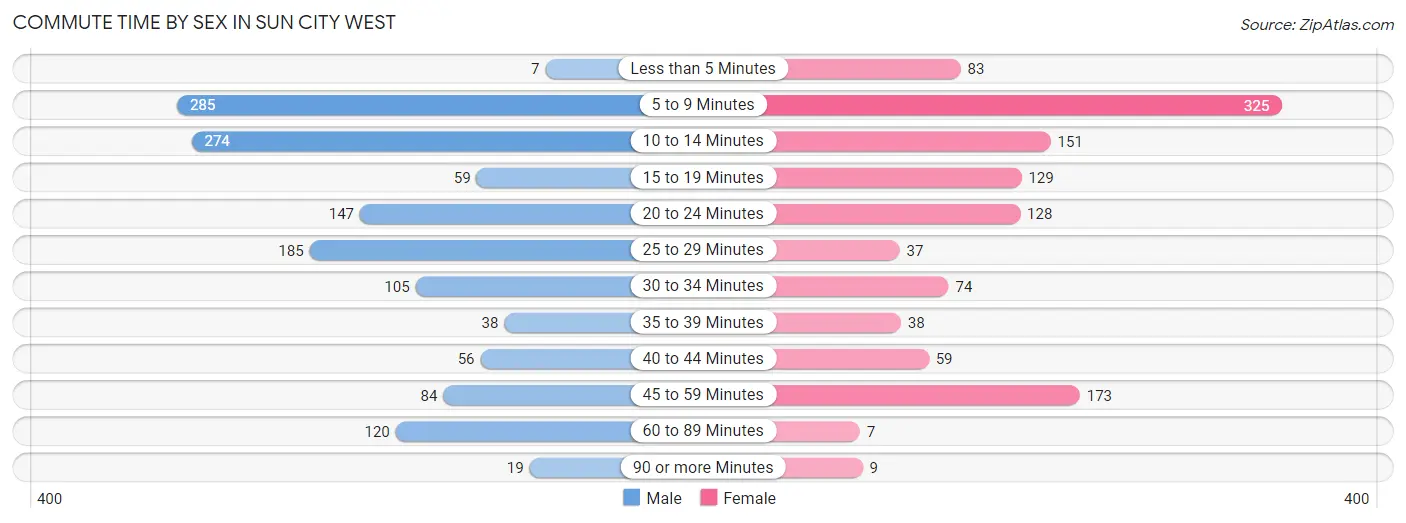
| Commute Time | Male | Female |
| Less than 5 Minutes | 7 (0.5%) | 83 (6.8%) |
| 5 to 9 Minutes | 285 (20.7%) | 325 (26.8%) |
| 10 to 14 Minutes | 274 (19.9%) | 151 (12.4%) |
| 15 to 19 Minutes | 59 (4.3%) | 129 (10.6%) |
| 20 to 24 Minutes | 147 (10.7%) | 128 (10.5%) |
| 25 to 29 Minutes | 185 (13.4%) | 37 (3.0%) |
| 30 to 34 Minutes | 105 (7.6%) | 74 (6.1%) |
| 35 to 39 Minutes | 38 (2.8%) | 38 (3.1%) |
| 40 to 44 Minutes | 56 (4.1%) | 59 (4.9%) |
| 45 to 59 Minutes | 84 (6.1%) | 173 (14.3%) |
| 60 to 89 Minutes | 120 (8.7%) | 7 (0.6%) |
| 90 or more Minutes | 19 (1.4%) | 9 (0.7%) |
Time of Departure to Work by Sex in Sun City West
The most frequent times of departure to work in Sun City West are 6:00 AM to 6:29 AM (247, 17.9%) for males and 7:30 AM to 7:59 AM (253, 20.9%) for females.
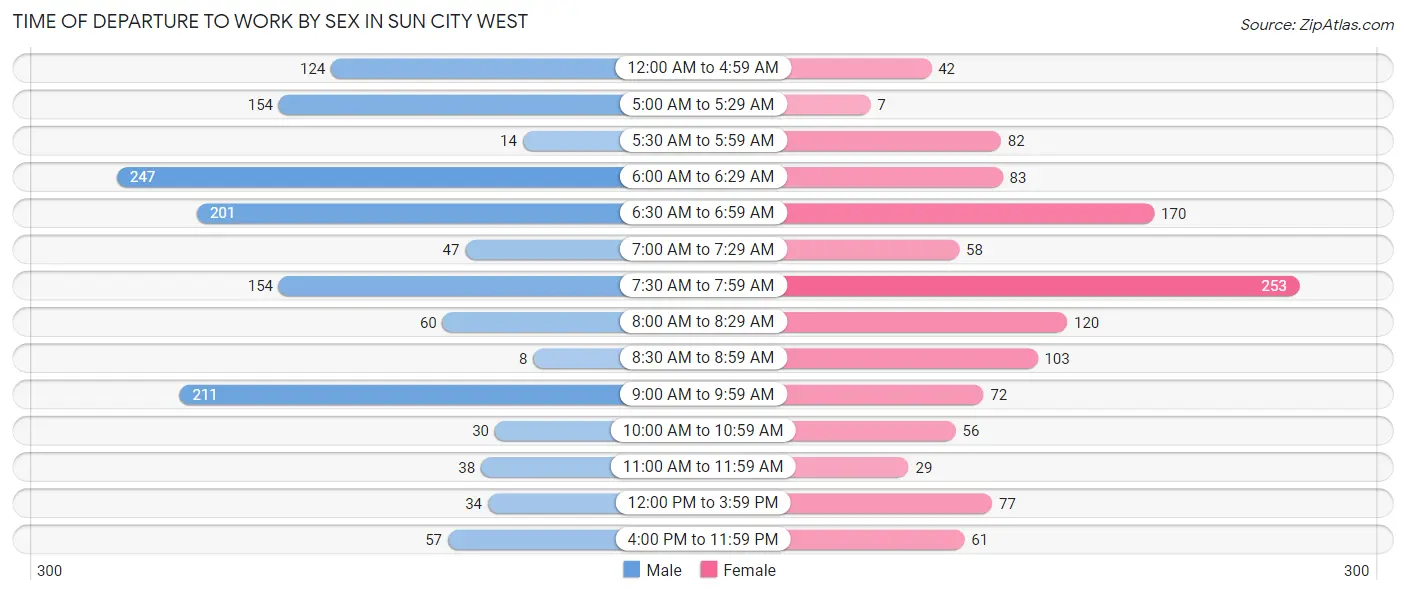
| Time of Departure | Male | Female |
| 12:00 AM to 4:59 AM | 124 (9.0%) | 42 (3.5%) |
| 5:00 AM to 5:29 AM | 154 (11.2%) | 7 (0.6%) |
| 5:30 AM to 5:59 AM | 14 (1.0%) | 82 (6.8%) |
| 6:00 AM to 6:29 AM | 247 (17.9%) | 83 (6.8%) |
| 6:30 AM to 6:59 AM | 201 (14.6%) | 170 (14.0%) |
| 7:00 AM to 7:29 AM | 47 (3.4%) | 58 (4.8%) |
| 7:30 AM to 7:59 AM | 154 (11.2%) | 253 (20.9%) |
| 8:00 AM to 8:29 AM | 60 (4.3%) | 120 (9.9%) |
| 8:30 AM to 8:59 AM | 8 (0.6%) | 103 (8.5%) |
| 9:00 AM to 9:59 AM | 211 (15.3%) | 72 (5.9%) |
| 10:00 AM to 10:59 AM | 30 (2.2%) | 56 (4.6%) |
| 11:00 AM to 11:59 AM | 38 (2.8%) | 29 (2.4%) |
| 12:00 PM to 3:59 PM | 34 (2.5%) | 77 (6.4%) |
| 4:00 PM to 11:59 PM | 57 (4.1%) | 61 (5.0%) |
| Total | 1,379 (100.0%) | 1,213 (100.0%) |
Housing Occupancy in Sun City West
Occupancy by Ownership in Sun City West
Of the total 15,827 dwellings in Sun City West, owner-occupied units account for 13,912 (87.9%), while renter-occupied units make up 1,915 (12.1%).
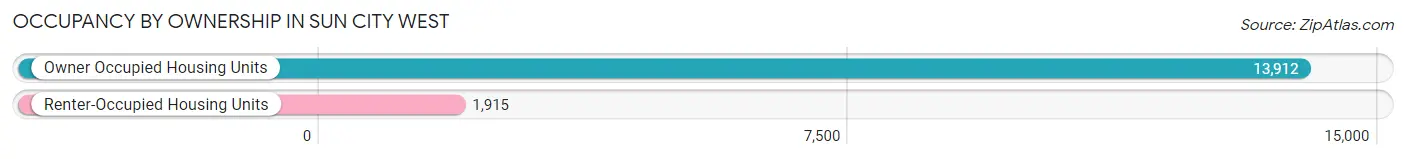
| Occupancy | # Housing Units | % Housing Units |
| Owner Occupied Housing Units | 13,912 | 87.9% |
| Renter-Occupied Housing Units | 1,915 | 12.1% |
| Total Occupied Housing Units | 15,827 | 100.0% |
Occupancy by Household Size in Sun City West
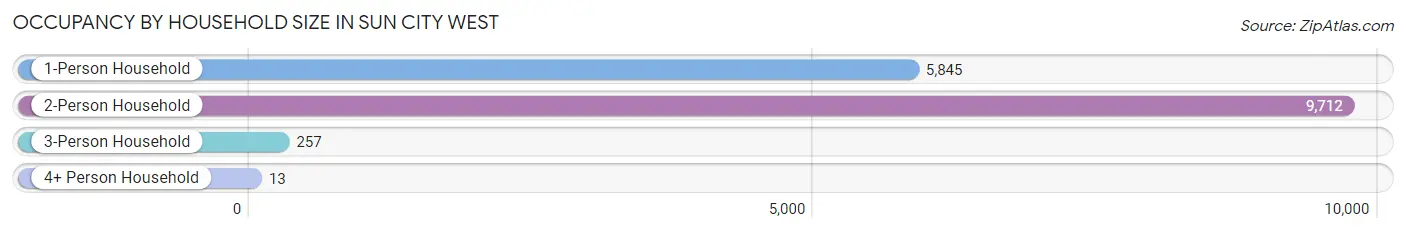
| Household Size | # Housing Units | % Housing Units |
| 1-Person Household | 5,845 | 36.9% |
| 2-Person Household | 9,712 | 61.4% |
| 3-Person Household | 257 | 1.6% |
| 4+ Person Household | 13 | 0.1% |
| Total Housing Units | 15,827 | 100.0% |
Occupancy by Ownership by Household Size in Sun City West
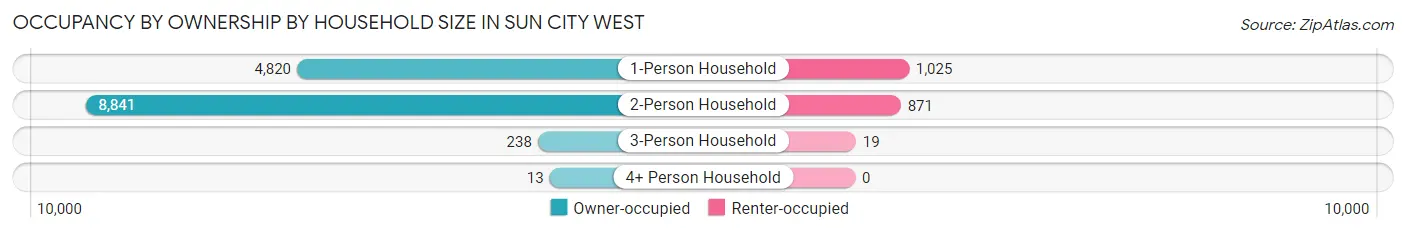
| Household Size | Owner-occupied | Renter-occupied |
| 1-Person Household | 4,820 (82.5%) | 1,025 (17.5%) |
| 2-Person Household | 8,841 (91.0%) | 871 (9.0%) |
| 3-Person Household | 238 (92.6%) | 19 (7.4%) |
| 4+ Person Household | 13 (100.0%) | 0 (0.0%) |
| Total Housing Units | 13,912 (87.9%) | 1,915 (12.1%) |
Occupancy by Educational Attainment in Sun City West
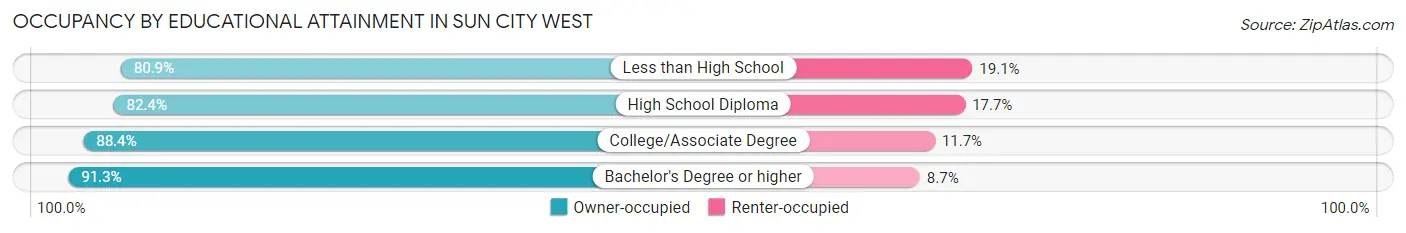
| Household Size | Owner-occupied | Renter-occupied |
| Less than High School | 280 (80.9%) | 66 (19.1%) |
| High School Diploma | 3,149 (82.4%) | 675 (17.6%) |
| College/Associate Degree | 4,848 (88.3%) | 639 (11.7%) |
| Bachelor's Degree or higher | 5,635 (91.3%) | 535 (8.7%) |
Occupancy by Age of Householder in Sun City West
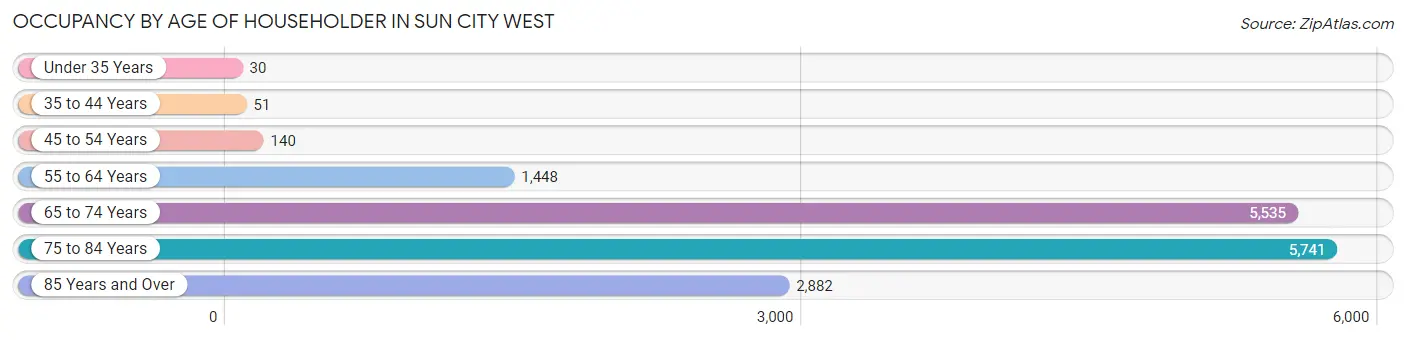
| Age Bracket | # Households | % Households |
| Under 35 Years | 30 | 0.2% |
| 35 to 44 Years | 51 | 0.3% |
| 45 to 54 Years | 140 | 0.9% |
| 55 to 64 Years | 1,448 | 9.1% |
| 65 to 74 Years | 5,535 | 35.0% |
| 75 to 84 Years | 5,741 | 36.3% |
| 85 Years and Over | 2,882 | 18.2% |
| Total | 15,827 | 100.0% |
Housing Finances in Sun City West
Median Income by Occupancy in Sun City West
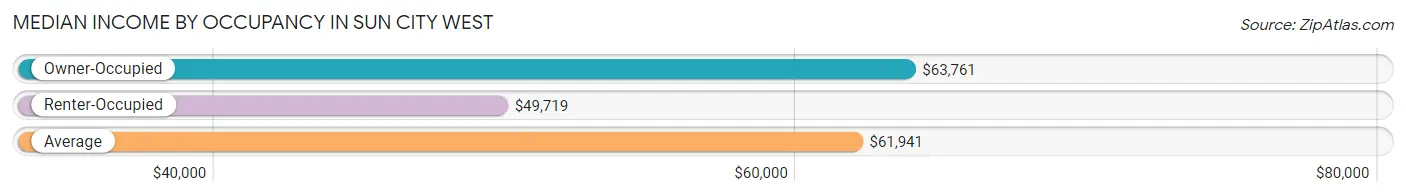
| Occupancy Type | # Households | Median Income |
| Owner-Occupied | 13,912 (87.9%) | $63,761 |
| Renter-Occupied | 1,915 (12.1%) | $49,719 |
| Average | 15,827 (100.0%) | $61,941 |
Occupancy by Householder Income Bracket in Sun City West
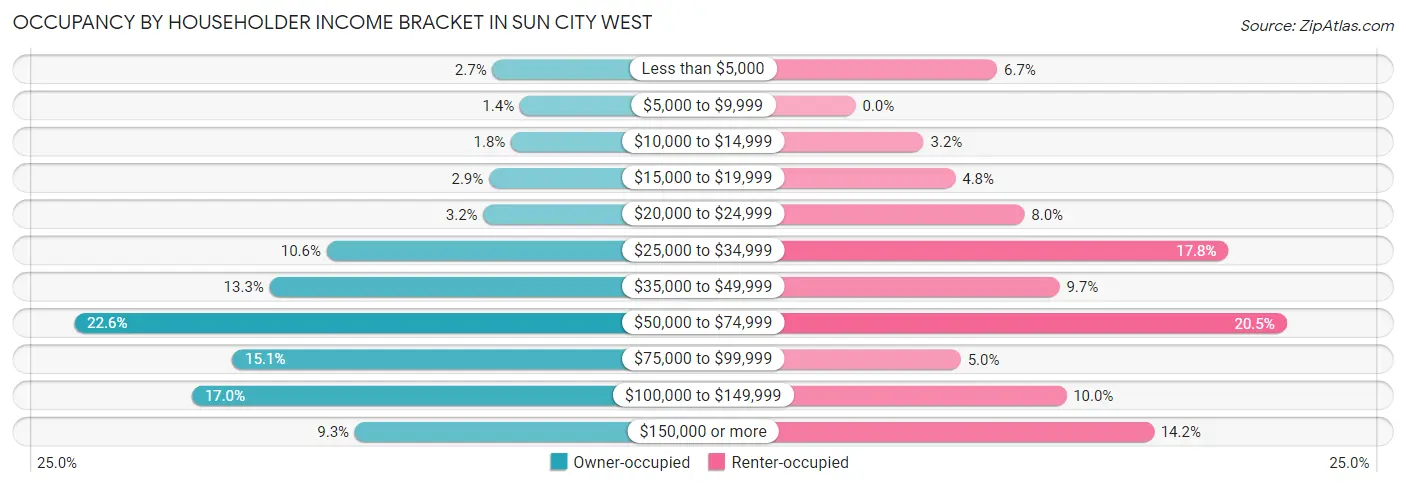
| Income Bracket | Owner-occupied | Renter-occupied |
| Less than $5,000 | 379 (2.7%) | 129 (6.7%) |
| $5,000 to $9,999 | 196 (1.4%) | 0 (0.0%) |
| $10,000 to $14,999 | 255 (1.8%) | 62 (3.2%) |
| $15,000 to $19,999 | 401 (2.9%) | 91 (4.8%) |
| $20,000 to $24,999 | 438 (3.2%) | 154 (8.0%) |
| $25,000 to $34,999 | 1,476 (10.6%) | 340 (17.7%) |
| $35,000 to $49,999 | 1,854 (13.3%) | 186 (9.7%) |
| $50,000 to $74,999 | 3,150 (22.6%) | 393 (20.5%) |
| $75,000 to $99,999 | 2,103 (15.1%) | 96 (5.0%) |
| $100,000 to $149,999 | 2,371 (17.0%) | 192 (10.0%) |
| $150,000 or more | 1,289 (9.3%) | 272 (14.2%) |
| Total | 13,912 (100.0%) | 1,915 (100.0%) |
Monthly Housing Cost Tiers in Sun City West
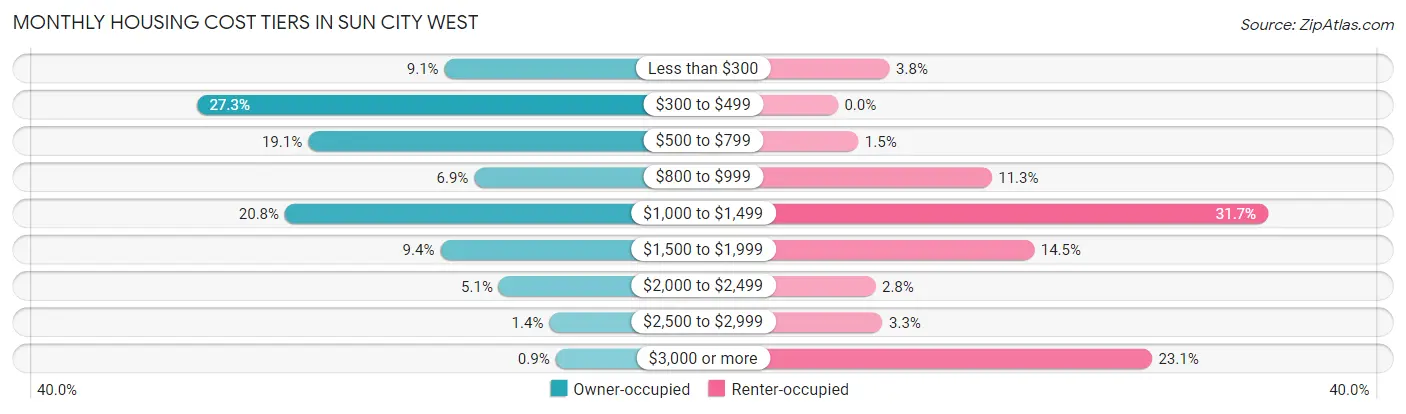
| Monthly Cost | Owner-occupied | Renter-occupied |
| Less than $300 | 1,263 (9.1%) | 73 (3.8%) |
| $300 to $499 | 3,804 (27.3%) | 0 (0.0%) |
| $500 to $799 | 2,661 (19.1%) | 29 (1.5%) |
| $800 to $999 | 959 (6.9%) | 217 (11.3%) |
| $1,000 to $1,499 | 2,898 (20.8%) | 607 (31.7%) |
| $1,500 to $1,999 | 1,306 (9.4%) | 277 (14.5%) |
| $2,000 to $2,499 | 707 (5.1%) | 53 (2.8%) |
| $2,500 to $2,999 | 189 (1.4%) | 63 (3.3%) |
| $3,000 or more | 125 (0.9%) | 443 (23.1%) |
| Total | 13,912 (100.0%) | 1,915 (100.0%) |
Physical Housing Characteristics in Sun City West
Housing Structures in Sun City West
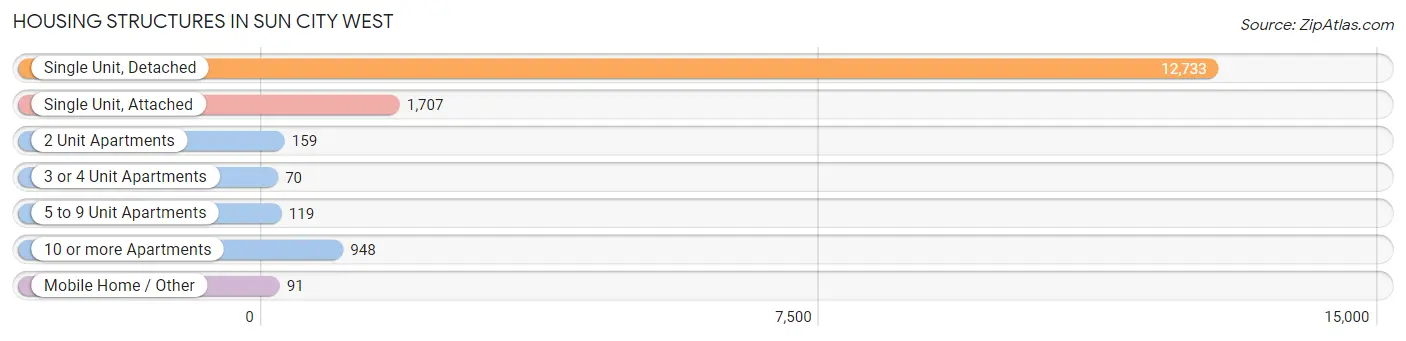
| Structure Type | # Housing Units | % Housing Units |
| Single Unit, Detached | 12,733 | 80.4% |
| Single Unit, Attached | 1,707 | 10.8% |
| 2 Unit Apartments | 159 | 1.0% |
| 3 or 4 Unit Apartments | 70 | 0.4% |
| 5 to 9 Unit Apartments | 119 | 0.7% |
| 10 or more Apartments | 948 | 6.0% |
| Mobile Home / Other | 91 | 0.6% |
| Total | 15,827 | 100.0% |
Housing Structures by Occupancy in Sun City West
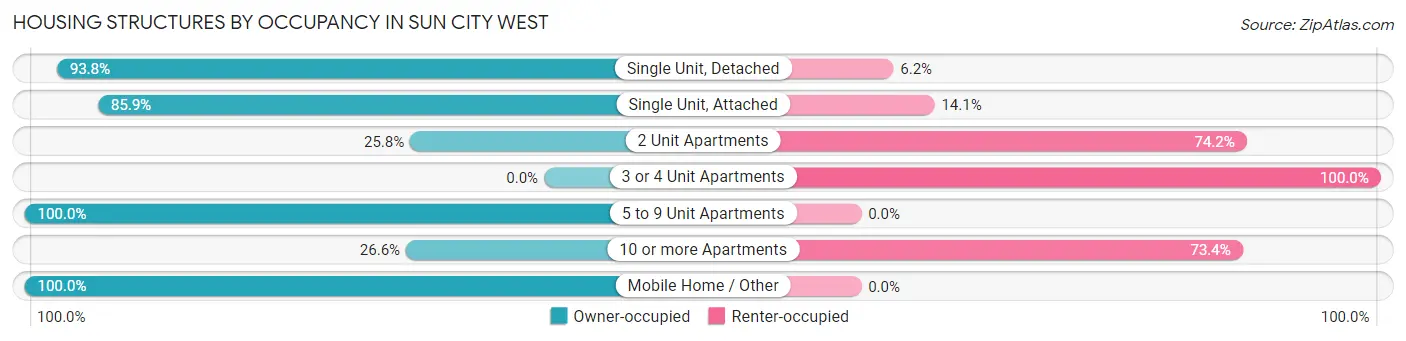
| Structure Type | Owner-occupied | Renter-occupied |
| Single Unit, Detached | 11,943 (93.8%) | 790 (6.2%) |
| Single Unit, Attached | 1,466 (85.9%) | 241 (14.1%) |
| 2 Unit Apartments | 41 (25.8%) | 118 (74.2%) |
| 3 or 4 Unit Apartments | 0 (0.0%) | 70 (100.0%) |
| 5 to 9 Unit Apartments | 119 (100.0%) | 0 (0.0%) |
| 10 or more Apartments | 252 (26.6%) | 696 (73.4%) |
| Mobile Home / Other | 91 (100.0%) | 0 (0.0%) |
| Total | 13,912 (87.9%) | 1,915 (12.1%) |
Housing Structures by Number of Rooms in Sun City West
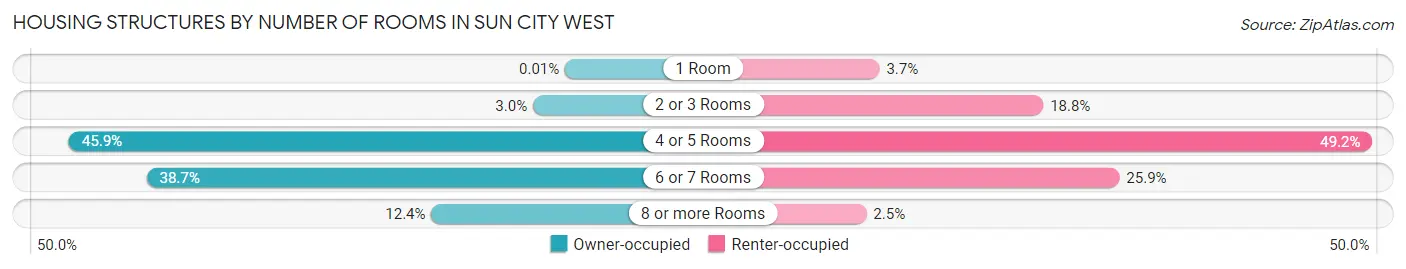
| Number of Rooms | Owner-occupied | Renter-occupied |
| 1 Room | 2 (0.0%) | 70 (3.7%) |
| 2 or 3 Rooms | 415 (3.0%) | 360 (18.8%) |
| 4 or 5 Rooms | 6,386 (45.9%) | 943 (49.2%) |
| 6 or 7 Rooms | 5,387 (38.7%) | 495 (25.9%) |
| 8 or more Rooms | 1,722 (12.4%) | 47 (2.5%) |
| Total | 13,912 (100.0%) | 1,915 (100.0%) |
Housing Structure by Heating Type in Sun City West
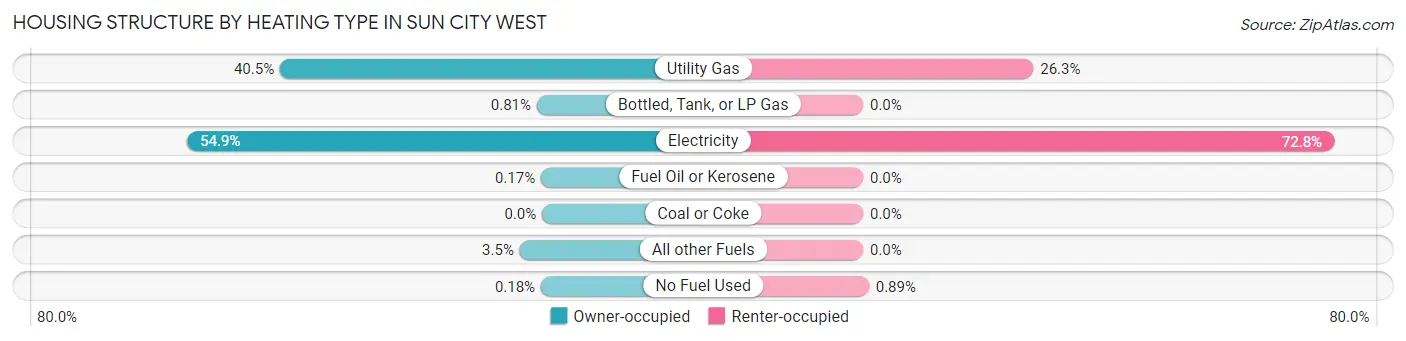
| Heating Type | Owner-occupied | Renter-occupied |
| Utility Gas | 5,637 (40.5%) | 504 (26.3%) |
| Bottled, Tank, or LP Gas | 112 (0.8%) | 0 (0.0%) |
| Electricity | 7,633 (54.9%) | 1,394 (72.8%) |
| Fuel Oil or Kerosene | 23 (0.2%) | 0 (0.0%) |
| Coal or Coke | 0 (0.0%) | 0 (0.0%) |
| All other Fuels | 482 (3.5%) | 0 (0.0%) |
| No Fuel Used | 25 (0.2%) | 17 (0.9%) |
| Total | 13,912 (100.0%) | 1,915 (100.0%) |
Household Vehicle Usage in Sun City West
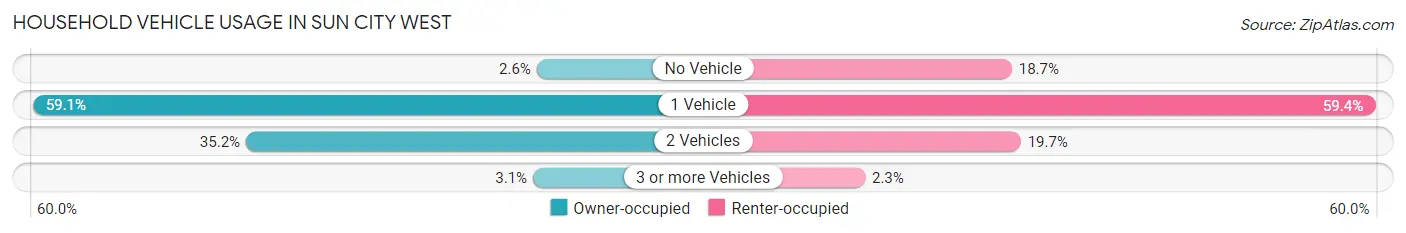
| Vehicles per Household | Owner-occupied | Renter-occupied |
| No Vehicle | 367 (2.6%) | 358 (18.7%) |
| 1 Vehicle | 8,220 (59.1%) | 1,137 (59.4%) |
| 2 Vehicles | 4,899 (35.2%) | 377 (19.7%) |
| 3 or more Vehicles | 426 (3.1%) | 43 (2.2%) |
| Total | 13,912 (100.0%) | 1,915 (100.0%) |
Real Estate & Mortgages in Sun City West
Real Estate and Mortgage Overview in Sun City West
| Characteristic | Without Mortgage | With Mortgage |
| Housing Units | 7,642 | 6,270 |
| Median Property Value | $311,500 | $323,000 |
| Median Household Income | $61,515 | $565 |
| Monthly Housing Costs | $439 | $104 |
| Real Estate Taxes | $1,553 | $68 |
Property Value by Mortgage Status in Sun City West
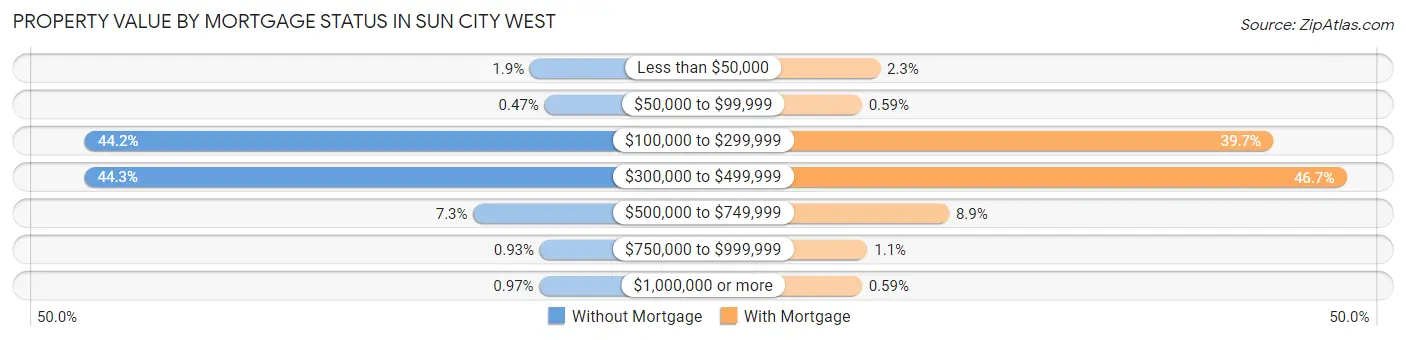
| Property Value | Without Mortgage | With Mortgage |
| Less than $50,000 | 142 (1.9%) | 146 (2.3%) |
| $50,000 to $99,999 | 36 (0.5%) | 37 (0.6%) |
| $100,000 to $299,999 | 3,380 (44.2%) | 2,492 (39.7%) |
| $300,000 to $499,999 | 3,384 (44.3%) | 2,930 (46.7%) |
| $500,000 to $749,999 | 555 (7.3%) | 558 (8.9%) |
| $750,000 to $999,999 | 71 (0.9%) | 70 (1.1%) |
| $1,000,000 or more | 74 (1.0%) | 37 (0.6%) |
| Total | 7,642 (100.0%) | 6,270 (100.0%) |
Household Income by Mortgage Status in Sun City West
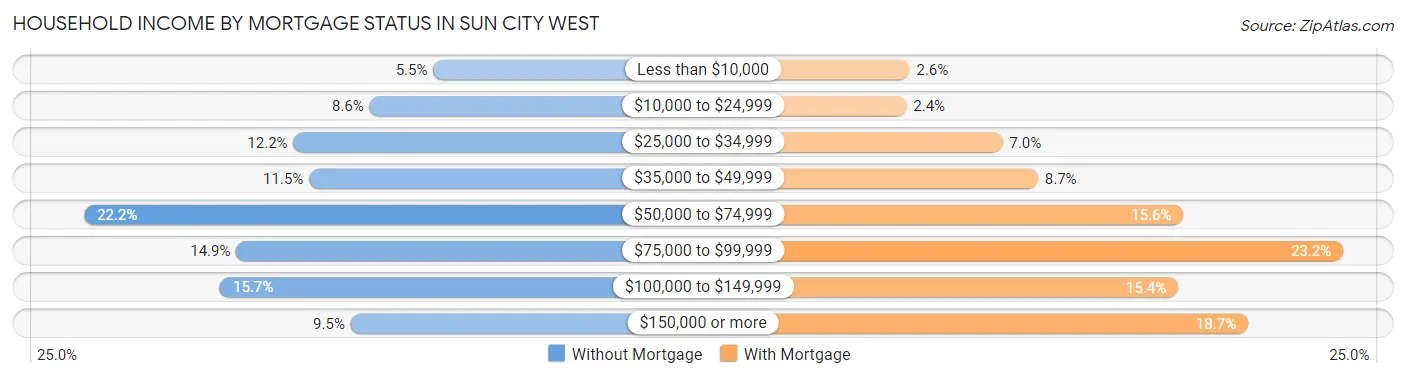
| Household Income | Without Mortgage | With Mortgage |
| Less than $10,000 | 423 (5.5%) | 161 (2.6%) |
| $10,000 to $24,999 | 655 (8.6%) | 152 (2.4%) |
| $25,000 to $34,999 | 932 (12.2%) | 439 (7.0%) |
| $35,000 to $49,999 | 875 (11.5%) | 544 (8.7%) |
| $50,000 to $74,999 | 1,694 (22.2%) | 979 (15.6%) |
| $75,000 to $99,999 | 1,140 (14.9%) | 1,456 (23.2%) |
| $100,000 to $149,999 | 1,199 (15.7%) | 963 (15.4%) |
| $150,000 or more | 724 (9.5%) | 1,172 (18.7%) |
| Total | 7,642 (100.0%) | 6,270 (100.0%) |
Property Value to Household Income Ratio in Sun City West
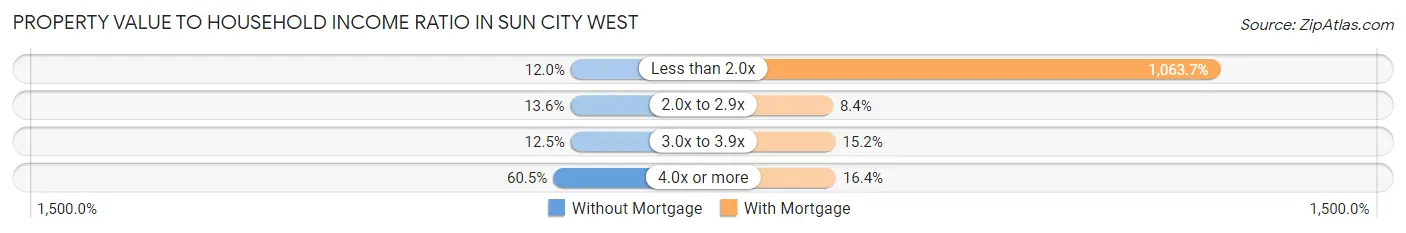
| Value-to-Income Ratio | Without Mortgage | With Mortgage |
| Less than 2.0x | 920 (12.0%) | 66,696 (1,063.7%) |
| 2.0x to 2.9x | 1,041 (13.6%) | 524 (8.4%) |
| 3.0x to 3.9x | 955 (12.5%) | 950 (15.1%) |
| 4.0x or more | 4,620 (60.5%) | 1,030 (16.4%) |
| Total | 7,642 (100.0%) | 6,270 (100.0%) |
Real Estate Taxes by Mortgage Status in Sun City West
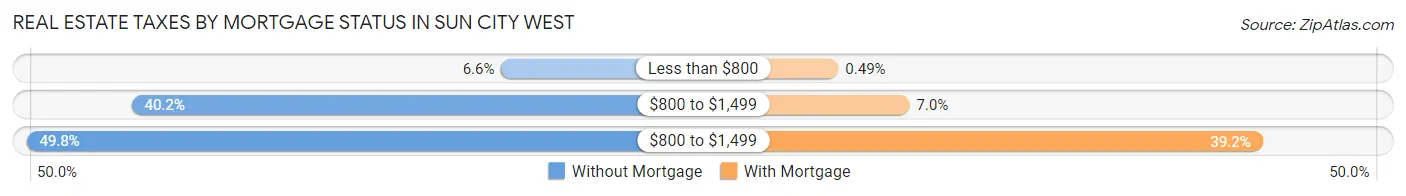
| Property Taxes | Without Mortgage | With Mortgage |
| Less than $800 | 501 (6.6%) | 31 (0.5%) |
| $800 to $1,499 | 3,074 (40.2%) | 438 (7.0%) |
| $800 to $1,499 | 3,808 (49.8%) | 2,459 (39.2%) |
| Total | 7,642 (100.0%) | 6,270 (100.0%) |
Health & Disability in Sun City West
Health Insurance Coverage by Age in Sun City West
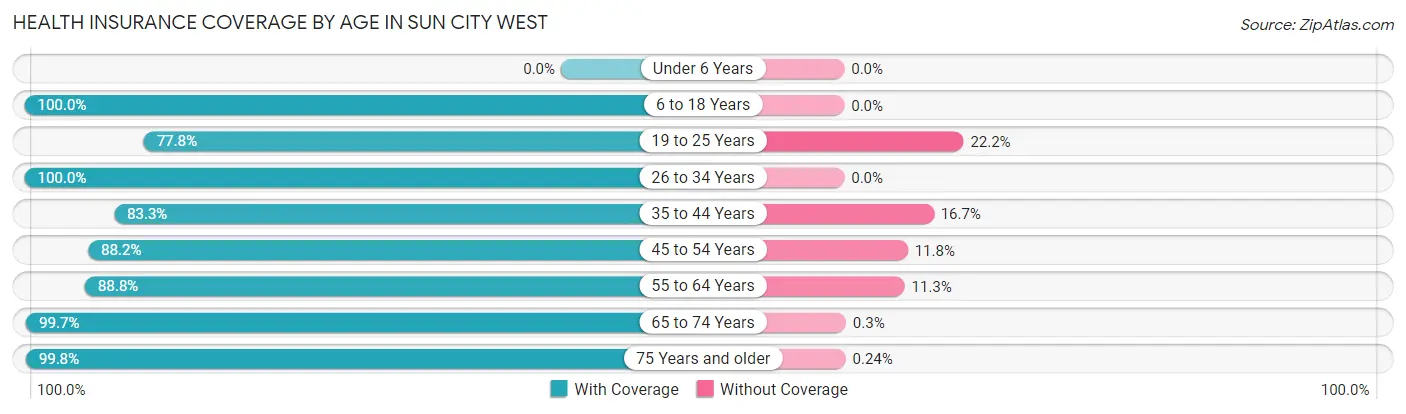
| Age Bracket | With Coverage | Without Coverage |
| Under 6 Years | 0 (0.0%) | 0 (0.0%) |
| 6 to 18 Years | 71 (100.0%) | 0 (0.0%) |
| 19 to 25 Years | 35 (77.8%) | 10 (22.2%) |
| 26 to 34 Years | 72 (100.0%) | 0 (0.0%) |
| 35 to 44 Years | 110 (83.3%) | 22 (16.7%) |
| 45 to 54 Years | 395 (88.2%) | 53 (11.8%) |
| 55 to 64 Years | 2,430 (88.7%) | 308 (11.3%) |
| 65 to 74 Years | 9,812 (99.7%) | 30 (0.3%) |
| 75 Years and older | 12,813 (99.8%) | 31 (0.2%) |
| Total | 25,738 (98.3%) | 454 (1.7%) |
Health Insurance Coverage by Citizenship Status in Sun City West
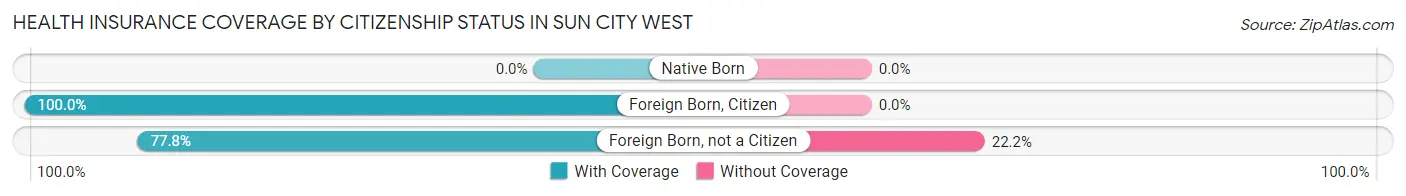
| Citizenship Status | With Coverage | Without Coverage |
| Native Born | 0 (0.0%) | 0 (0.0%) |
| Foreign Born, Citizen | 71 (100.0%) | 0 (0.0%) |
| Foreign Born, not a Citizen | 35 (77.8%) | 10 (22.2%) |
Health Insurance Coverage by Household Income in Sun City West
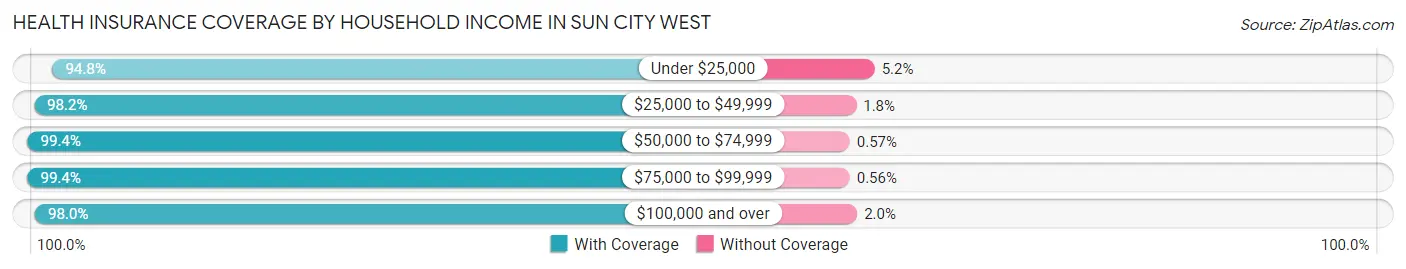
| Household Income | With Coverage | Without Coverage |
| Under $25,000 | 2,625 (94.8%) | 145 (5.2%) |
| $25,000 to $49,999 | 5,524 (98.2%) | 100 (1.8%) |
| $50,000 to $74,999 | 5,902 (99.4%) | 34 (0.6%) |
| $75,000 to $99,999 | 4,058 (99.4%) | 23 (0.6%) |
| $100,000 and over | 7,600 (98.0%) | 152 (2.0%) |
Public vs Private Health Insurance Coverage by Age in Sun City West
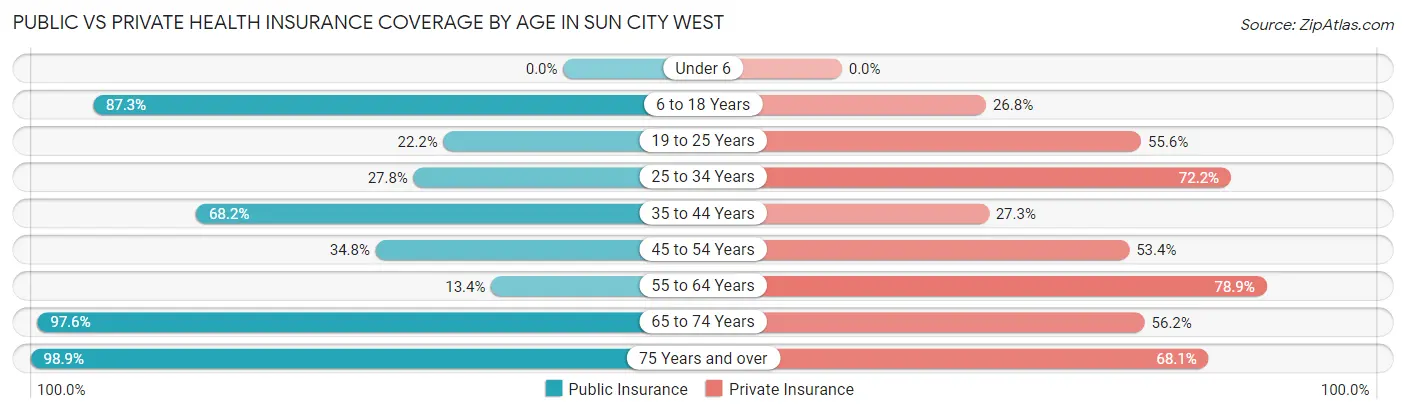
| Age Bracket | Public Insurance | Private Insurance |
| Under 6 | 0 (0.0%) | 0 (0.0%) |
| 6 to 18 Years | 62 (87.3%) | 19 (26.8%) |
| 19 to 25 Years | 10 (22.2%) | 25 (55.6%) |
| 25 to 34 Years | 20 (27.8%) | 52 (72.2%) |
| 35 to 44 Years | 90 (68.2%) | 36 (27.3%) |
| 45 to 54 Years | 156 (34.8%) | 239 (53.3%) |
| 55 to 64 Years | 366 (13.4%) | 2,159 (78.8%) |
| 65 to 74 Years | 9,609 (97.6%) | 5,532 (56.2%) |
| 75 Years and over | 12,700 (98.9%) | 8,745 (68.1%) |
| Total | 23,013 (87.9%) | 16,807 (64.2%) |
Disability Status by Sex by Age in Sun City West
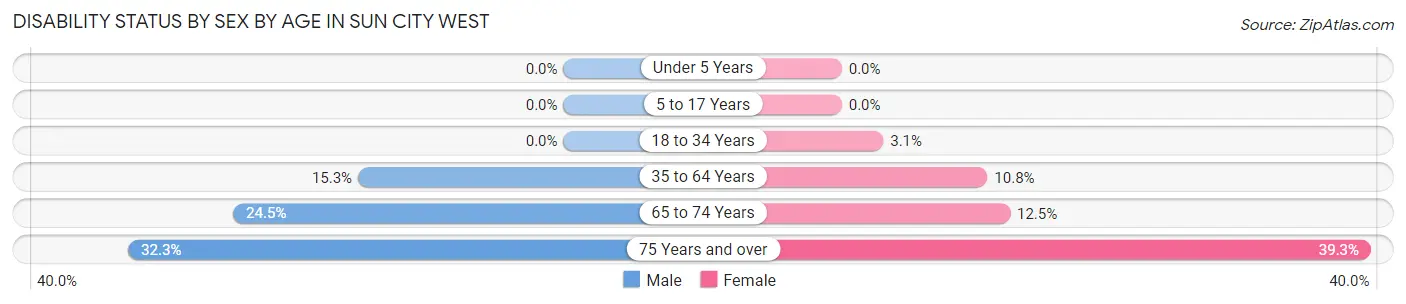
| Age Bracket | Male | Female |
| Under 5 Years | 0 (0.0%) | 0 (0.0%) |
| 5 to 17 Years | 0 (0.0%) | 0 (0.0%) |
| 18 to 34 Years | 0 (0.0%) | 2 (3.1%) |
| 35 to 64 Years | 204 (15.2%) | 214 (10.8%) |
| 65 to 74 Years | 1,053 (24.5%) | 693 (12.5%) |
| 75 Years and over | 1,975 (32.3%) | 2,644 (39.3%) |
Disability Class by Sex by Age in Sun City West
Disability Class: Hearing Difficulty
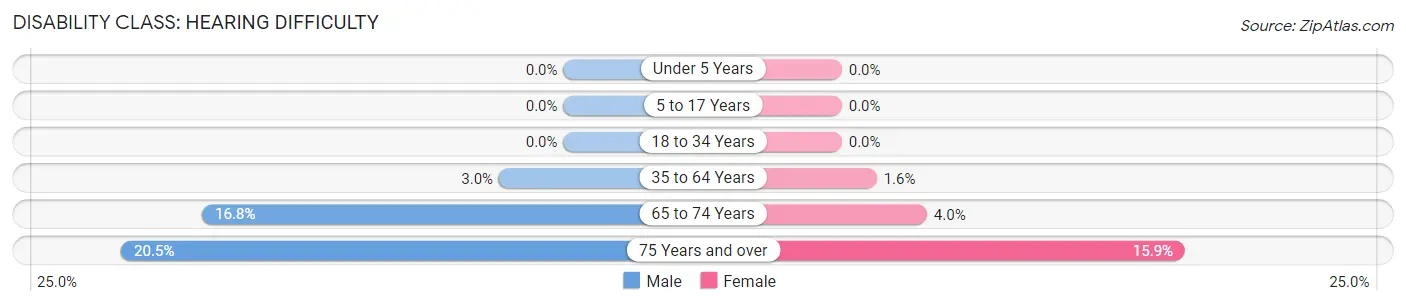
| Age Bracket | Male | Female |
| Under 5 Years | 0 (0.0%) | 0 (0.0%) |
| 5 to 17 Years | 0 (0.0%) | 0 (0.0%) |
| 18 to 34 Years | 0 (0.0%) | 0 (0.0%) |
| 35 to 64 Years | 40 (3.0%) | 32 (1.6%) |
| 65 to 74 Years | 720 (16.8%) | 219 (4.0%) |
| 75 Years and over | 1,254 (20.5%) | 1,072 (15.9%) |
Disability Class: Vision Difficulty
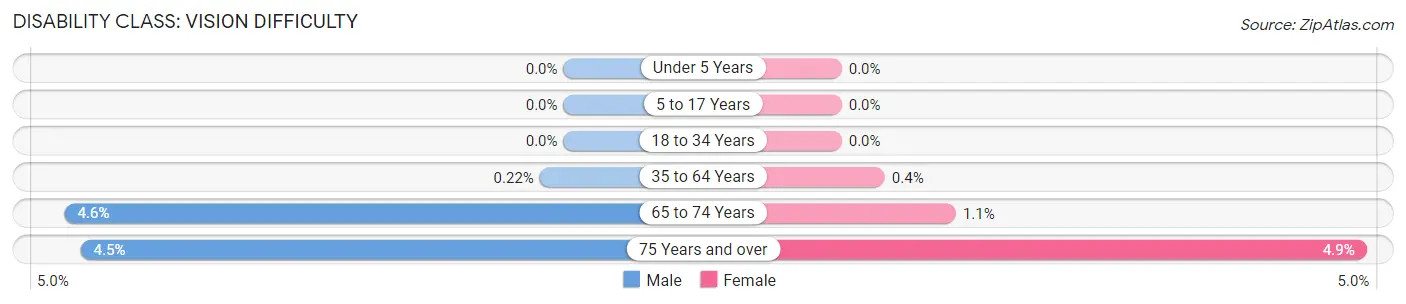
| Age Bracket | Male | Female |
| Under 5 Years | 0 (0.0%) | 0 (0.0%) |
| 5 to 17 Years | 0 (0.0%) | 0 (0.0%) |
| 18 to 34 Years | 0 (0.0%) | 0 (0.0%) |
| 35 to 64 Years | 3 (0.2%) | 8 (0.4%) |
| 65 to 74 Years | 199 (4.6%) | 59 (1.1%) |
| 75 Years and over | 274 (4.5%) | 328 (4.9%) |
Disability Class: Cognitive Difficulty
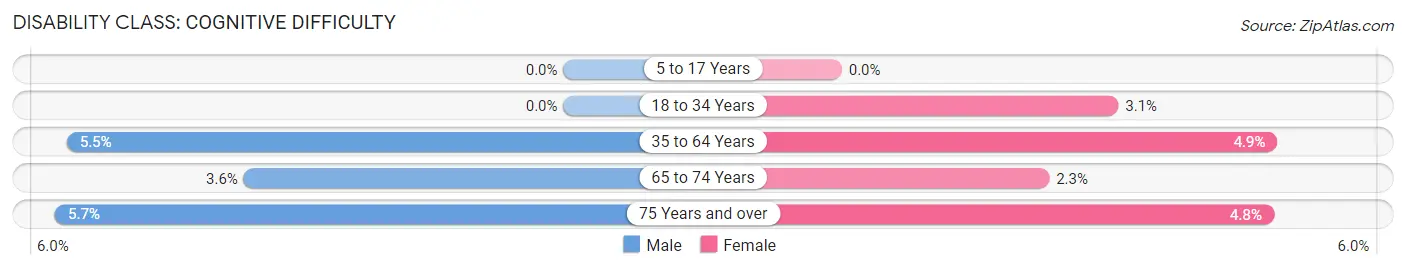
| Age Bracket | Male | Female |
| 5 to 17 Years | 0 (0.0%) | 0 (0.0%) |
| 18 to 34 Years | 0 (0.0%) | 2 (3.1%) |
| 35 to 64 Years | 74 (5.5%) | 96 (4.9%) |
| 65 to 74 Years | 153 (3.6%) | 128 (2.3%) |
| 75 Years and over | 346 (5.7%) | 324 (4.8%) |
Disability Class: Ambulatory Difficulty
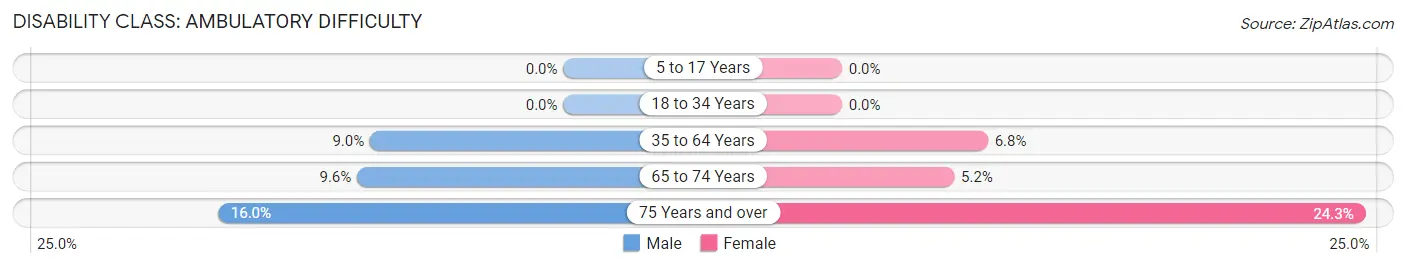
| Age Bracket | Male | Female |
| 5 to 17 Years | 0 (0.0%) | 0 (0.0%) |
| 18 to 34 Years | 0 (0.0%) | 0 (0.0%) |
| 35 to 64 Years | 120 (9.0%) | 134 (6.8%) |
| 65 to 74 Years | 411 (9.6%) | 289 (5.2%) |
| 75 Years and over | 980 (16.0%) | 1,636 (24.3%) |
Disability Class: Self-Care Difficulty
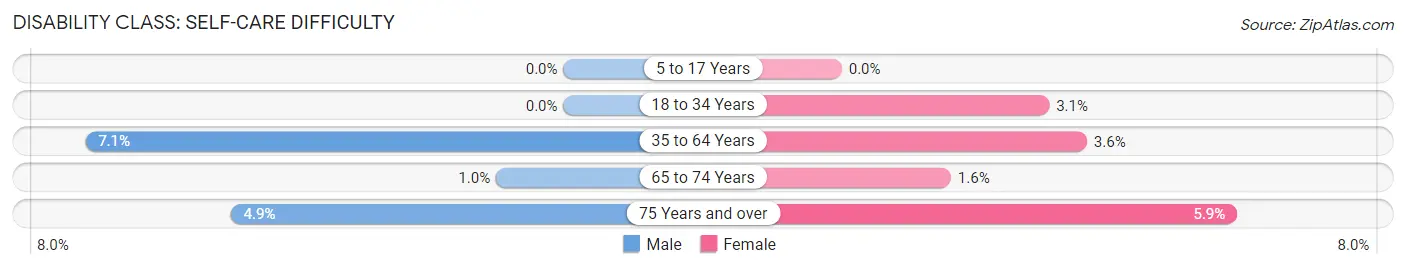
| Age Bracket | Male | Female |
| 5 to 17 Years | 0 (0.0%) | 0 (0.0%) |
| 18 to 34 Years | 0 (0.0%) | 2 (3.1%) |
| 35 to 64 Years | 95 (7.1%) | 72 (3.6%) |
| 65 to 74 Years | 43 (1.0%) | 90 (1.6%) |
| 75 Years and over | 302 (4.9%) | 395 (5.9%) |
Technology Access in Sun City West
Computing Device Access in Sun City West
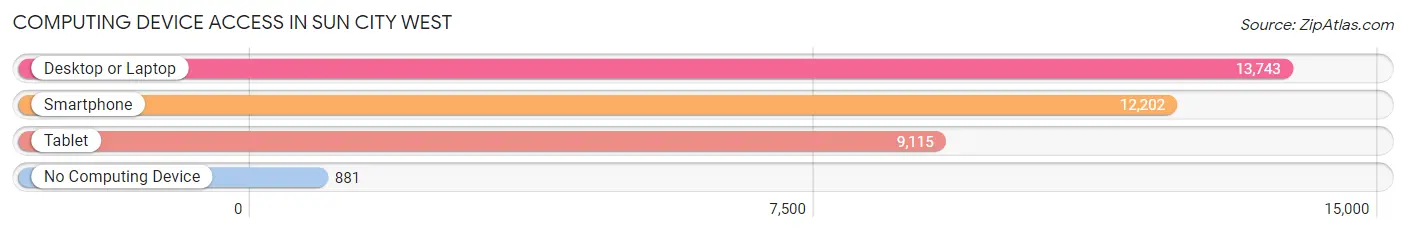
| Device Type | # Households | % Households |
| Desktop or Laptop | 13,743 | 86.8% |
| Smartphone | 12,202 | 77.1% |
| Tablet | 9,115 | 57.6% |
| No Computing Device | 881 | 5.6% |
| Total | 15,827 | 100.0% |
Internet Access in Sun City West
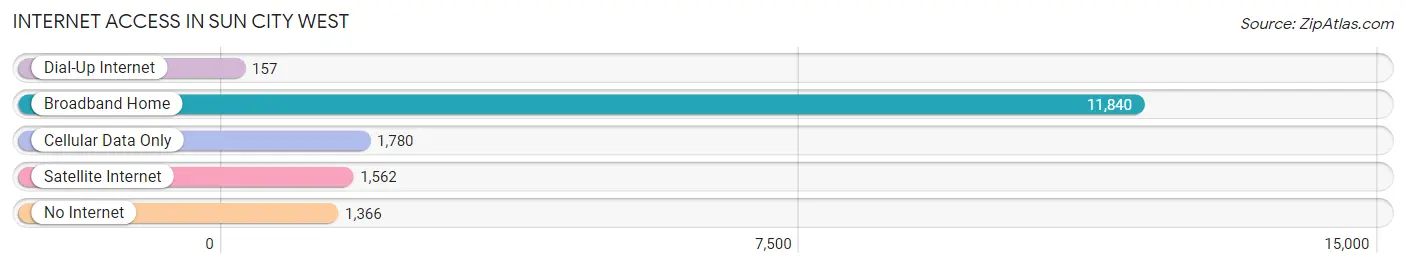
| Internet Type | # Households | % Households |
| Dial-Up Internet | 157 | 1.0% |
| Broadband Home | 11,840 | 74.8% |
| Cellular Data Only | 1,780 | 11.3% |
| Satellite Internet | 1,562 | 9.9% |
| No Internet | 1,366 | 8.6% |
| Total | 15,827 | 100.0% |
Sun City West Summary
Sun City West is a census-designated place located in Maricopa County, Arizona. It is a retirement community located about 20 miles northwest of Phoenix. As of the 2010 census, the population was 24,535.
Geography
Sun City West is located at 33°37'17"N 112°17'45"W (33.6214, -112.2958). It is situated in the Sonoran Desert, at an elevation of 1,400 feet (427 m). The area is bordered by the White Tank Mountains to the west and the Agua Fria River to the east.
Climate
Sun City West has a hot desert climate, with hot summers and mild winters. The average high temperature in July is 106°F (41°C), and the average low temperature in January is 43°F (6°C). The area receives an average of 8.5 inches (216 mm) of precipitation per year.
Demographics
As of the 2010 census, there were 24,535 people, 11,945 households, and 8,072 families residing in Sun City West. The population density was 1,845.3 people per square mile (711.9/km2). The racial makeup of the area was 94.3% White, 0.7% African American, 0.3% Native American, 1.2% Asian, 0.1% Pacific Islander, 1.7% from other races, and 1.9% from two or more races. Hispanic or Latino of any race were 5.2% of the population.
Economy
Sun City West is a retirement community, and the economy is largely based on tourism and services. The area is home to several golf courses, shopping centers, and recreational facilities. The median household income in Sun City West was $45,845 in 2010, and the median family income was $50,945.
History
Sun City West was founded in 1978 by Del Webb, a real estate developer. The area was designed as a retirement community, and it quickly became popular with retirees. The area was incorporated as a town in 1984, and it was later annexed by the city of Surprise in 1988. Sun City West is now a census-designated place, and it is one of the largest retirement communities in the United States.
Common Questions
What is Per Capita Income in Sun City West?
Per Capita income in Sun City West is $47,913.
What is the Median Family Income in Sun City West?
Median Family Income in Sun City West is $81,035.
What is the Median Household income in Sun City West?
Median Household Income in Sun City West is $61,941.
What is Income or Wage Gap in Sun City West?
Income or Wage Gap in Sun City West is 1.4%.
Women in Sun City West earn 98.6 cents for every dollar earned by a man.
What is Inequality or Gini Index in Sun City West?
Inequality or Gini Index in Sun City West is 0.41.
What is the Total Population of Sun City West?
Total Population of Sun City West is 26,639.
What is the Total Male Population of Sun City West?
Total Male Population of Sun City West is 12,019.
What is the Total Female Population of Sun City West?
Total Female Population of Sun City West is 14,620.
What is the Ratio of Males per 100 Females in Sun City West?
There are 82.21 Males per 100 Females in Sun City West.
What is the Ratio of Females per 100 Males in Sun City West?
There are 121.64 Females per 100 Males in Sun City West.
What is the Median Population Age in Sun City West?
Median Population Age in Sun City West is 74.8 Years.
What is the Average Family Size in Sun City West
Average Family Size in Sun City West is 2.0 People.
What is the Average Household Size in Sun City West
Average Household Size in Sun City West is 1.6 People.
How Large is the Labor Force in Sun City West?
There are 3,402 People in the Labor Forcein in Sun City West.
What is the Percentage of People in the Labor Force in Sun City West?
12.8% of People are in the Labor Force in Sun City West.
What is the Unemployment Rate in Sun City West?
Unemployment Rate in Sun City West is 3.0%.