Crozier, AZ Map & Demographics
Crozier Map
Crozier Overview
$18,878
PER CAPITA INCOME
$78,333
AVG HOUSEHOLD INCOME
78.0%
WAGE / INCOME GAP [ % ]
22.0¢/ $1
WAGE / INCOME GAP [ $ ]
0.23
INEQUALITY / GINI INDEX
73
TOTAL POPULATION
46
MALE POPULATION
27
FEMALE POPULATION
170.37
MALES / 100 FEMALES
58.70
FEMALES / 100 MALES
60.3
MEDIAN AGE
2.1
AVG FAMILY SIZE
4.2
AVG HOUSEHOLD SIZE
12
LABOR FORCE [ PEOPLE ]
19.4%
PERCENT IN LABOR FORCE
Income in Crozier
Income Overview in Crozier
| Characteristic | Number | Measure |
| Per Capita Income | 73 | $18,878 |
| Median Family Income | 9 | $0 |
| Mean Family Income | 9 | $0 |
| Median Household Income | 16 | $78,333 |
| Mean Household Income | 16 | $73,694 |
| Income Deficit | 9 | $0 |
| Wage / Income Gap (%) | 73 | 77.96% |
| Wage / Income Gap ($) | 73 | 22.04¢ per $1 |
| Gini / Inequality Index | 73 | 0.23 |
Earnings by Sex in Crozier
Average Earnings in Crozier are $16,607, $72,917 for men and $16,071 for women, a difference of 78.0%.
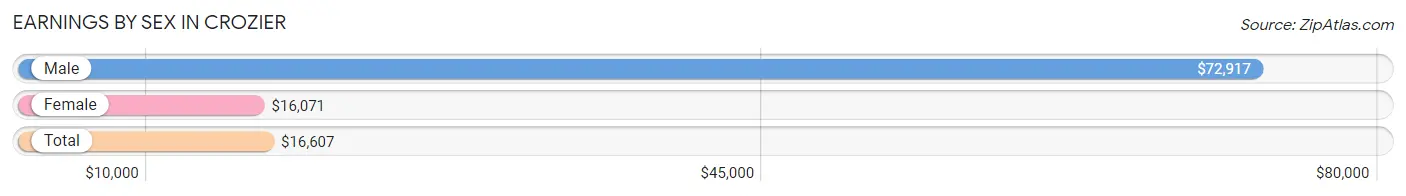
| Sex | Number | Average Earnings |
| Male | 5 (38.5%) | $72,917 |
| Female | 8 (61.5%) | $16,071 |
| Total | 13 (100.0%) | $16,607 |
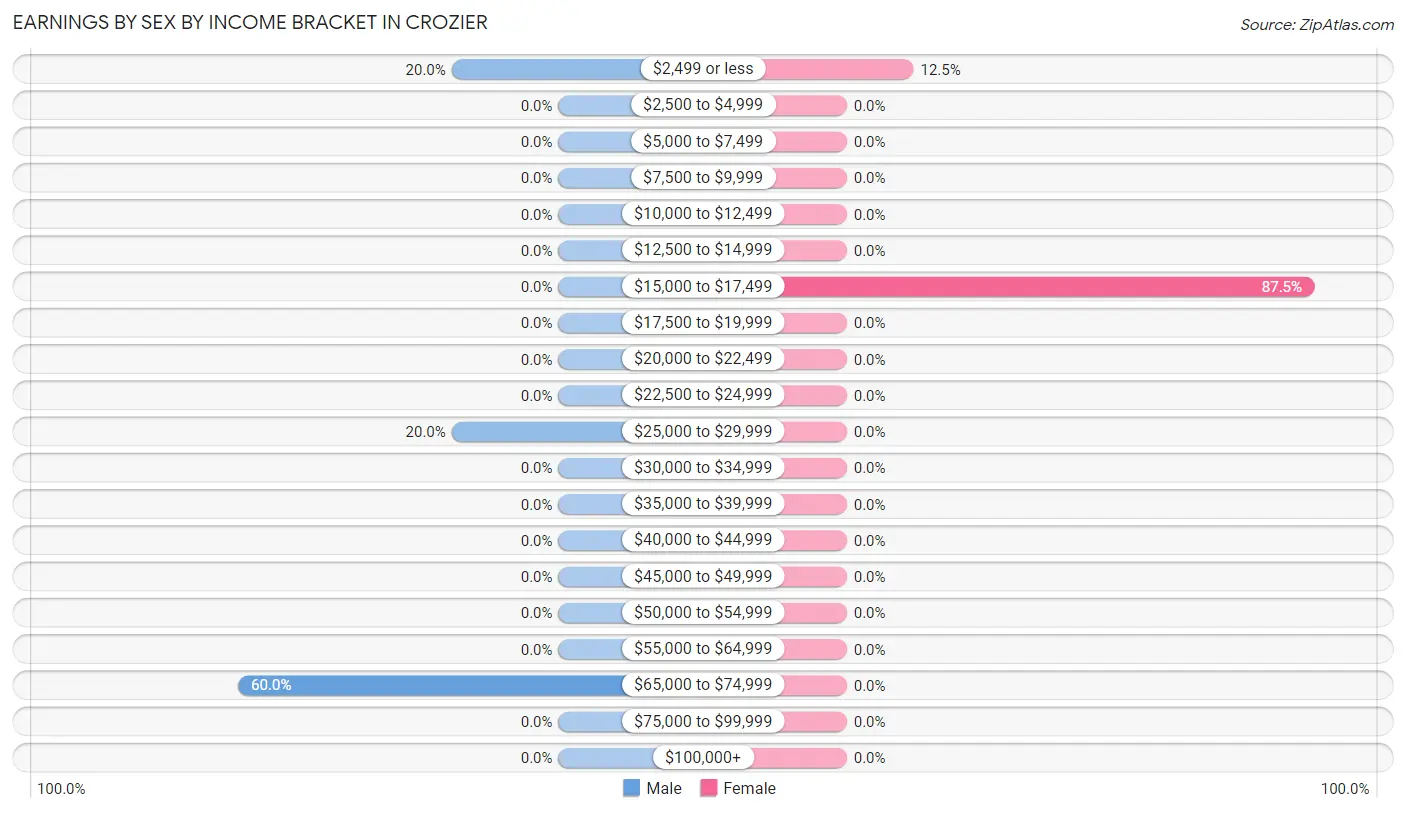
Earnings by Sex by Income Bracket in Crozier
The most common earnings brackets in Crozier are $65,000 to $74,999 for men (3 | 60.0%) and $15,000 to $17,499 for women (7 | 87.5%).
| Income | Male | Female |
| $2,499 or less | 1 (20.0%) | 1 (12.5%) |
| $2,500 to $4,999 | 0 (0.0%) | 0 (0.0%) |
| $5,000 to $7,499 | 0 (0.0%) | 0 (0.0%) |
| $7,500 to $9,999 | 0 (0.0%) | 0 (0.0%) |
| $10,000 to $12,499 | 0 (0.0%) | 0 (0.0%) |
| $12,500 to $14,999 | 0 (0.0%) | 0 (0.0%) |
| $15,000 to $17,499 | 0 (0.0%) | 7 (87.5%) |
| $17,500 to $19,999 | 0 (0.0%) | 0 (0.0%) |
| $20,000 to $22,499 | 0 (0.0%) | 0 (0.0%) |
| $22,500 to $24,999 | 0 (0.0%) | 0 (0.0%) |
| $25,000 to $29,999 | 1 (20.0%) | 0 (0.0%) |
| $30,000 to $34,999 | 0 (0.0%) | 0 (0.0%) |
| $35,000 to $39,999 | 0 (0.0%) | 0 (0.0%) |
| $40,000 to $44,999 | 0 (0.0%) | 0 (0.0%) |
| $45,000 to $49,999 | 0 (0.0%) | 0 (0.0%) |
| $50,000 to $54,999 | 0 (0.0%) | 0 (0.0%) |
| $55,000 to $64,999 | 0 (0.0%) | 0 (0.0%) |
| $65,000 to $74,999 | 3 (60.0%) | 0 (0.0%) |
| $75,000 to $99,999 | 0 (0.0%) | 0 (0.0%) |
| $100,000+ | 0 (0.0%) | 0 (0.0%) |
| Total | 5 (100.0%) | 8 (100.0%) |
Earnings by Sex by Educational Attainment in Crozier
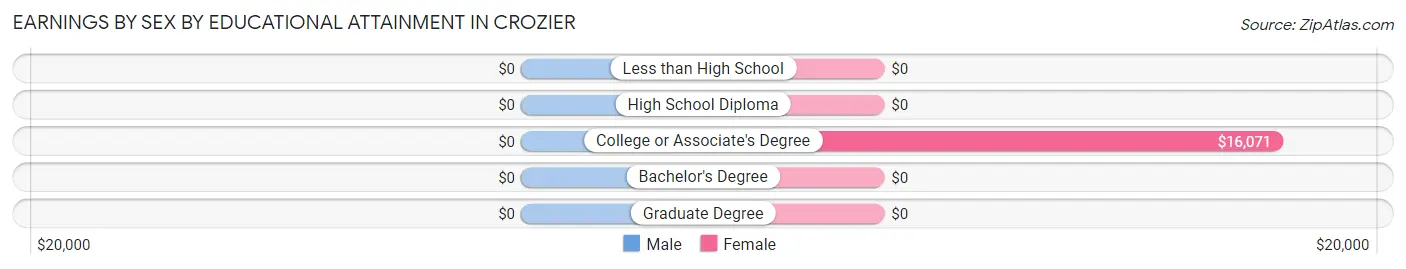
| Educational Attainment | Male Income | Female Income |
| Less than High School | - | - |
| High School Diploma | - | - |
| College or Associate's Degree | - | - |
| Bachelor's Degree | - | - |
| Graduate Degree | - | - |
| Total | $72,917 | $16,071 |
Family Income in Crozier
Family Income Brackets in Crozier
According to the Crozier family income data, there are 6 families falling into the $100,000 to $149,999 income range, which is the most common income bracket and makes up 66.7% of all families.
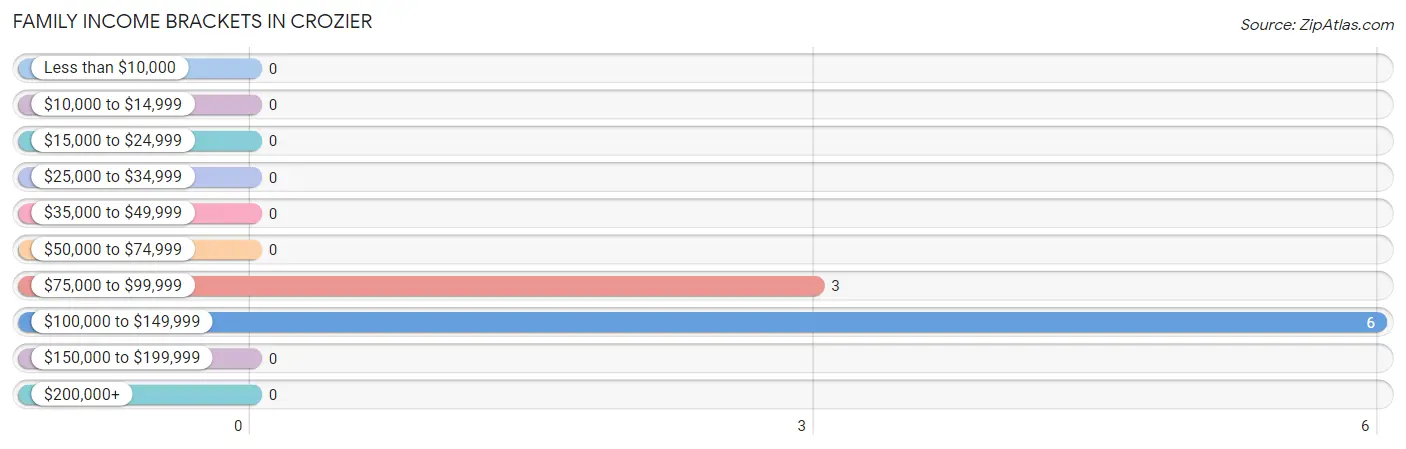
| Income Bracket | # Families | % Families |
| Less than $10,000 | 0 | 0.0% |
| $10,000 to $14,999 | 0 | 0.0% |
| $15,000 to $24,999 | 0 | 0.0% |
| $25,000 to $34,999 | 0 | 0.0% |
| $35,000 to $49,999 | 0 | 0.0% |
| $50,000 to $74,999 | 0 | 0.0% |
| $75,000 to $99,999 | 3 | 33.3% |
| $100,000 to $149,999 | 6 | 66.7% |
| $150,000 to $199,999 | 0 | 0.0% |
| $200,000+ | 0 | 0.0% |
Family Income by Famaliy Size in Crozier
| Income Bracket | # Families | Median Income |
| 2-Person Families | 9 (100.0%) | $0 |
| 3-Person Families | 0 (0.0%) | $0 |
| 4-Person Families | 0 (0.0%) | $0 |
| 5-Person Families | 0 (0.0%) | $0 |
| 6-Person Families | 0 (0.0%) | $0 |
| 7+ Person Families | 0 (0.0%) | $0 |
| Total | 9 (100.0%) | $0 |
Family Income by Number of Earners in Crozier
| Number of Earners | # Families | Median Income |
| No Earners | 6 (66.7%) | $0 |
| 1 Earner | 3 (33.3%) | $0 |
| 2 Earners | 0 (0.0%) | $0 |
| 3+ Earners | 0 (0.0%) | $0 |
| Total | 9 (100.0%) | $0 |
Household Income in Crozier
Household Income Brackets in Crozier
With 6 households falling in the category, the $100,000 to $149,999 income range is the most frequent in Crozier, accounting for 37.5% of all households.
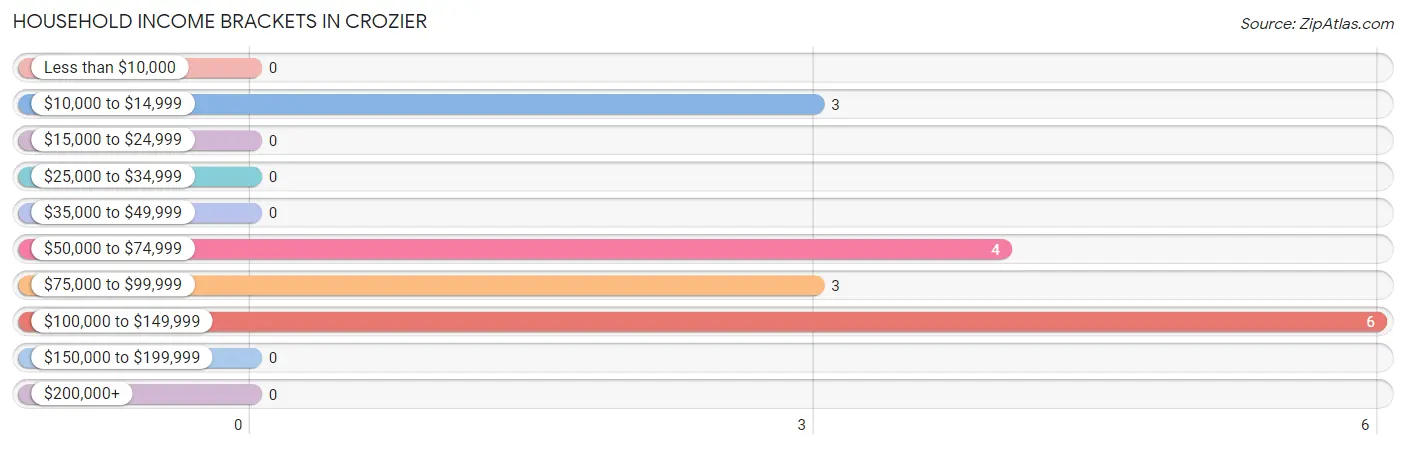
| Income Bracket | # Households | % Households |
| Less than $10,000 | 0 | 0.0% |
| $10,000 to $14,999 | 3 | 18.8% |
| $15,000 to $24,999 | 0 | 0.0% |
| $25,000 to $34,999 | 0 | 0.0% |
| $35,000 to $49,999 | 0 | 0.0% |
| $50,000 to $74,999 | 4 | 25.0% |
| $75,000 to $99,999 | 3 | 18.8% |
| $100,000 to $149,999 | 6 | 37.5% |
| $150,000 to $199,999 | 0 | 0.0% |
| $200,000+ | 0 | 0.0% |
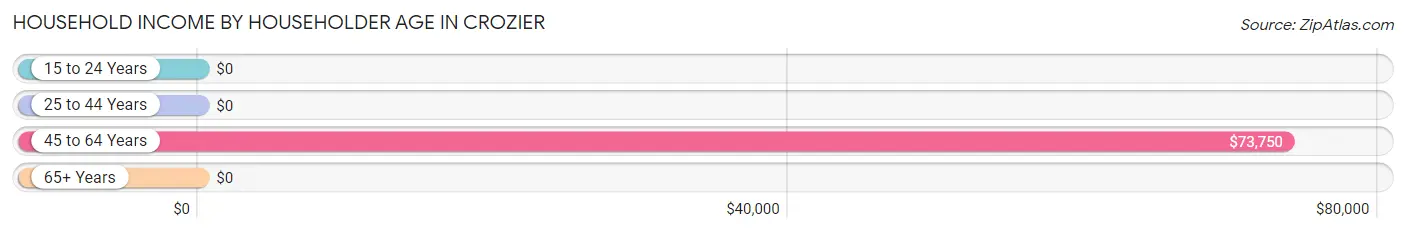
Household Income by Householder Age in Crozier
The median household income in Crozier is $78,333, with the highest median household income of $73,750 found in the 45 to 64 years age bracket for the primary householder. A total of 10 households (62.5%) fall into this category.
| Income Bracket | # Households | Median Income |
| 15 to 24 Years | 0 (0.0%) | $0 |
| 25 to 44 Years | 0 (0.0%) | $0 |
| 45 to 64 Years | 10 (62.5%) | $73,750 |
| 65+ Years | 6 (37.5%) | $0 |
| Total | 16 (100.0%) | $78,333 |
Poverty in Crozier
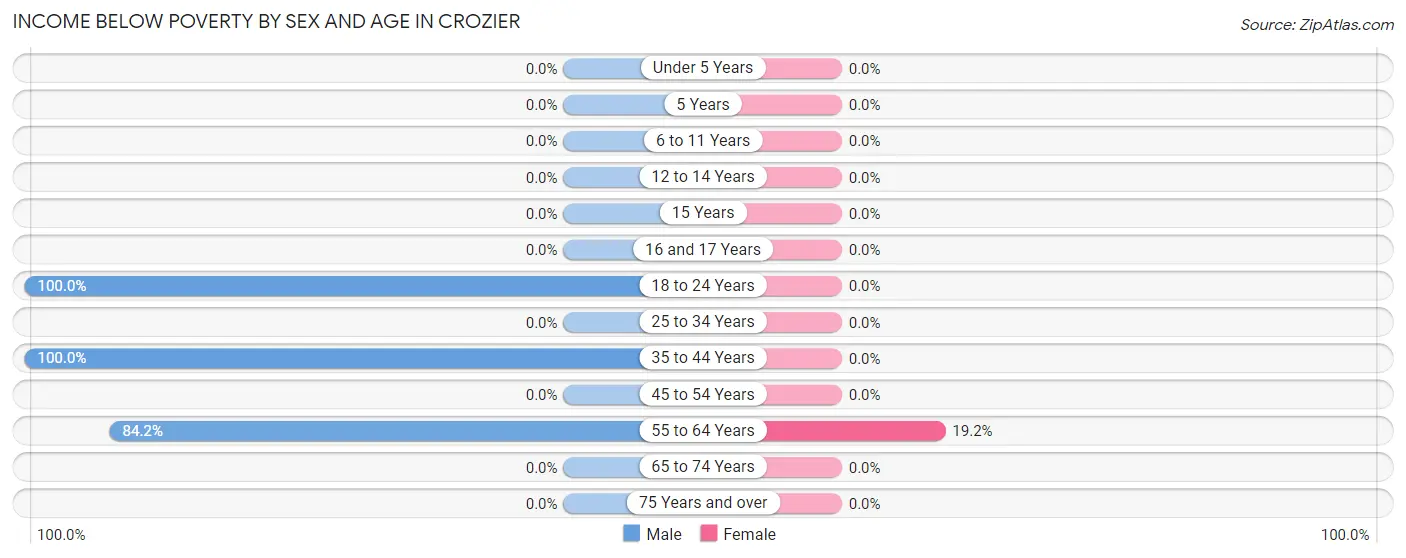
Income Below Poverty by Sex and Age in Crozier
With 51.4% poverty level for males and 18.5% for females among the residents of Crozier, 18 to 24 year old males and 55 to 64 year old females are the most vulnerable to poverty, with 1 males (100.0%) and 5 females (19.2%) in their respective age groups living below the poverty level.
| Age Bracket | Male | Female |
| Under 5 Years | 0 (0.0%) | 0 (0.0%) |
| 5 Years | 0 (0.0%) | 0 (0.0%) |
| 6 to 11 Years | 0 (0.0%) | 0 (0.0%) |
| 12 to 14 Years | 0 (0.0%) | 0 (0.0%) |
| 15 Years | 0 (0.0%) | 0 (0.0%) |
| 16 and 17 Years | 0 (0.0%) | 0 (0.0%) |
| 18 to 24 Years | 1 (100.0%) | 0 (0.0%) |
| 25 to 34 Years | 0 (0.0%) | 0 (0.0%) |
| 35 to 44 Years | 1 (100.0%) | 0 (0.0%) |
| 45 to 54 Years | 0 (0.0%) | 0 (0.0%) |
| 55 to 64 Years | 16 (84.2%) | 5 (19.2%) |
| 65 to 74 Years | 0 (0.0%) | 0 (0.0%) |
| 75 Years and over | 0 (0.0%) | 0 (0.0%) |
| Total | 18 (51.4%) | 5 (18.5%) |
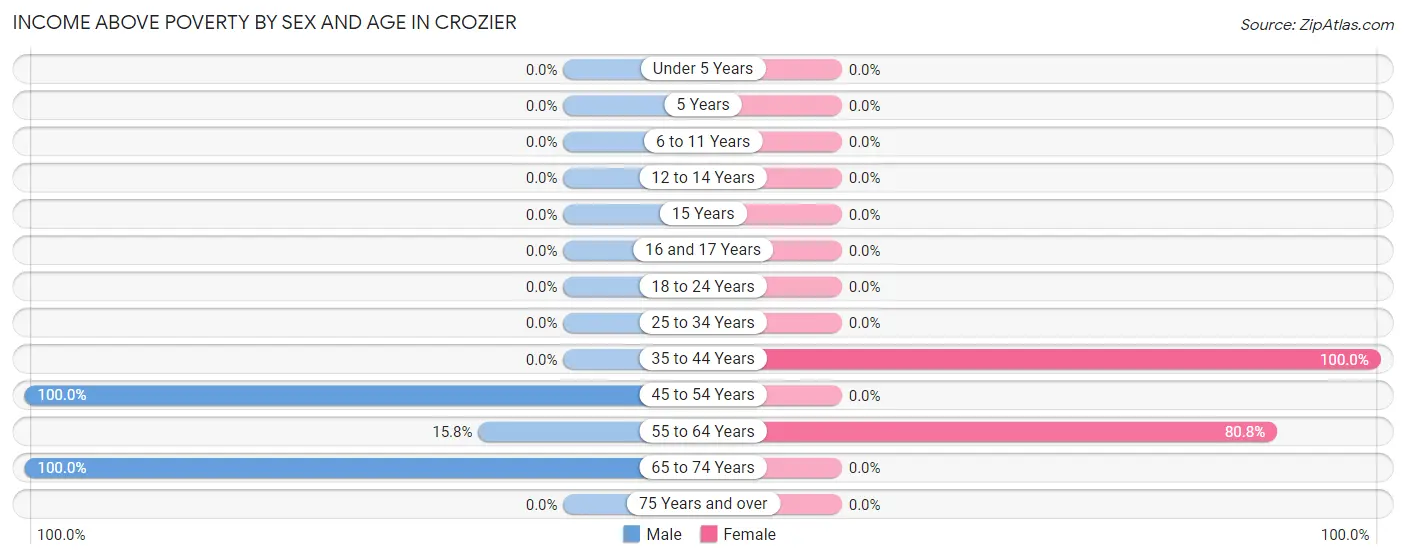
Income Above Poverty by Sex and Age in Crozier
According to the poverty statistics in Crozier, males aged 45 to 54 years and females aged 35 to 44 years are the age groups that are most secure financially, with 100.0% of males and 100.0% of females in these age groups living above the poverty line.
| Age Bracket | Male | Female |
| Under 5 Years | 0 (0.0%) | 0 (0.0%) |
| 5 Years | 0 (0.0%) | 0 (0.0%) |
| 6 to 11 Years | 0 (0.0%) | 0 (0.0%) |
| 12 to 14 Years | 0 (0.0%) | 0 (0.0%) |
| 15 Years | 0 (0.0%) | 0 (0.0%) |
| 16 and 17 Years | 0 (0.0%) | 0 (0.0%) |
| 18 to 24 Years | 0 (0.0%) | 0 (0.0%) |
| 25 to 34 Years | 0 (0.0%) | 0 (0.0%) |
| 35 to 44 Years | 0 (0.0%) | 1 (100.0%) |
| 45 to 54 Years | 8 (100.0%) | 0 (0.0%) |
| 55 to 64 Years | 3 (15.8%) | 21 (80.8%) |
| 65 to 74 Years | 6 (100.0%) | 0 (0.0%) |
| 75 Years and over | 0 (0.0%) | 0 (0.0%) |
| Total | 17 (48.6%) | 22 (81.5%) |
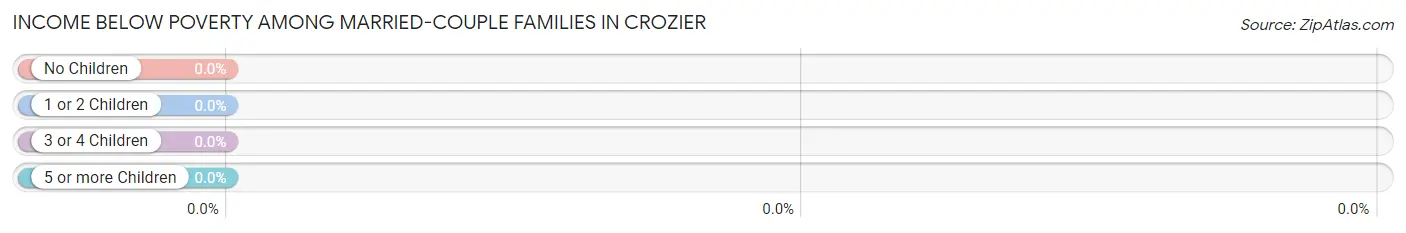
Income Below Poverty Among Married-Couple Families in Crozier
| Children | Above Poverty | Below Poverty |
| No Children | 9 (100.0%) | 0 (0.0%) |
| 1 or 2 Children | 0 (0.0%) | 0 (0.0%) |
| 3 or 4 Children | 0 (0.0%) | 0 (0.0%) |
| 5 or more Children | 0 (0.0%) | 0 (0.0%) |
| Total | 9 (100.0%) | 0 (0.0%) |
Income Below Poverty Among Single-Parent Households in Crozier
| Children | Single Father | Single Mother |
| No Children | 0 (0.0%) | 0 (0.0%) |
| 1 or 2 Children | 0 (0.0%) | 0 (0.0%) |
| 3 or 4 Children | 0 (0.0%) | 0 (0.0%) |
| 5 or more Children | 0 (0.0%) | 0 (0.0%) |
| Total | 0 (0.0%) | 0 (0.0%) |
Income Below Poverty Among Married-Couple vs Single-Parent Households in Crozier
| Children | Married-Couple Families | Single-Parent Households |
| No Children | 0 (0.0%) | 0 (0.0%) |
| 1 or 2 Children | 0 (0.0%) | 0 (0.0%) |
| 3 or 4 Children | 0 (0.0%) | 0 (0.0%) |
| 5 or more Children | 0 (0.0%) | 0 (0.0%) |
| Total | 0 (0.0%) | 0 (0.0%) |
Race in Crozier
The most populous races in Crozier are White / Caucasian (38 | 52.0%), Two or more Races (34 | 46.6%), and Hispanic or Latino (9 | 12.3%).
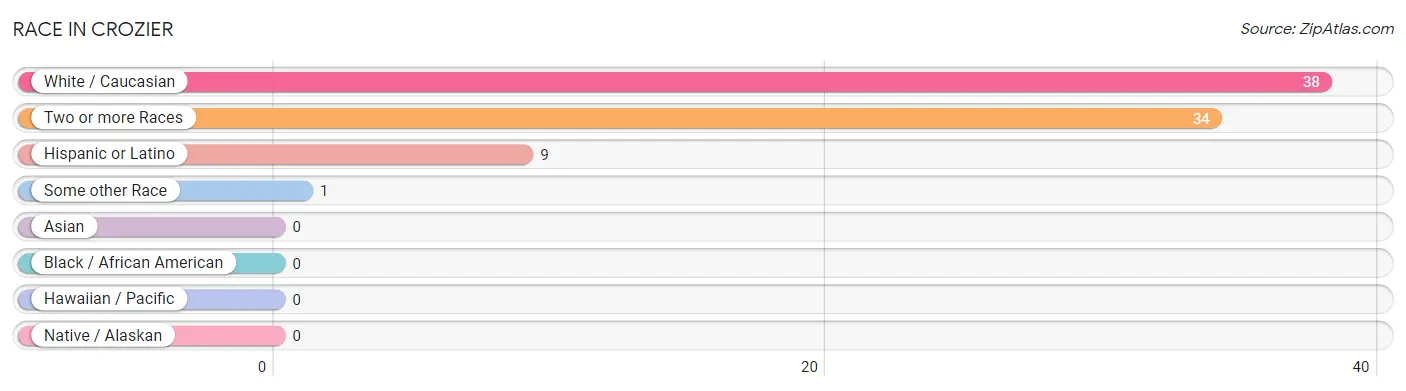
| Race | # Population | % Population |
| Asian | 0 | 0.0% |
| Black / African American | 0 | 0.0% |
| Hawaiian / Pacific | 0 | 0.0% |
| Hispanic or Latino | 9 | 12.3% |
| Native / Alaskan | 0 | 0.0% |
| White / Caucasian | 38 | 52.0% |
| Two or more Races | 34 | 46.6% |
| Some other Race | 1 | 1.4% |
| Total | 73 | 100.0% |
Ancestry in Crozier
The most populous ancestries reported in Crozier are Choctaw (34 | 46.6%), German (12 | 16.4%), Mexican (9 | 12.3%), Scotch-Irish (9 | 12.3%), and Italian (4 | 5.5%), together accounting for 93.2% of all Crozier residents.
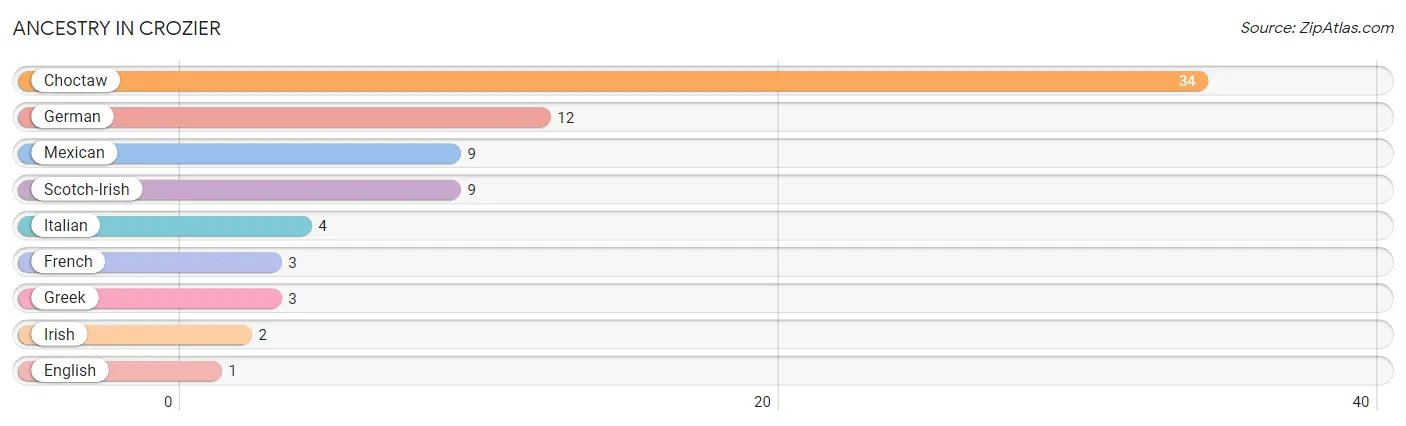
| Ancestry | # Population | % Population |
| Choctaw | 34 | 46.6% |
| English | 1 | 1.4% |
| French | 3 | 4.1% |
| German | 12 | 16.4% |
| Greek | 3 | 4.1% |
| Irish | 2 | 2.7% |
| Italian | 4 | 5.5% |
| Mexican | 9 | 12.3% |
| Scotch-Irish | 9 | 12.3% | View All 9 Rows |
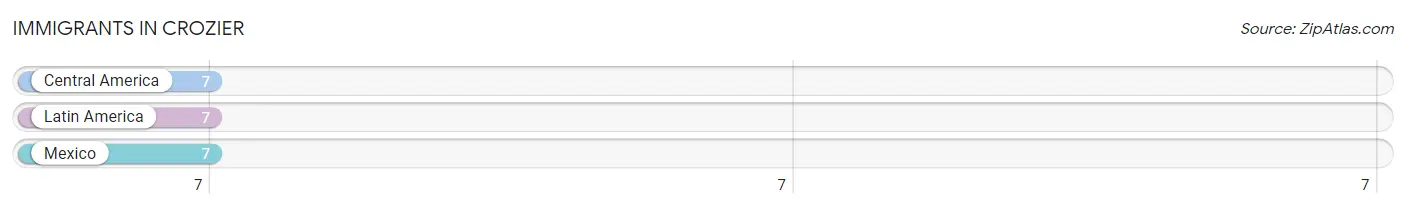
Immigrants in Crozier
The most numerous immigrant groups reported in Crozier came from Central America (7 | 9.6%), Latin America (7 | 9.6%), and Mexico (7 | 9.6%), together accounting for 28.8% of all Crozier residents.
| Immigration Origin | # Population | % Population |
| Central America | 7 | 9.6% |
| Latin America | 7 | 9.6% |
| Mexico | 7 | 9.6% | View All 3 Rows |
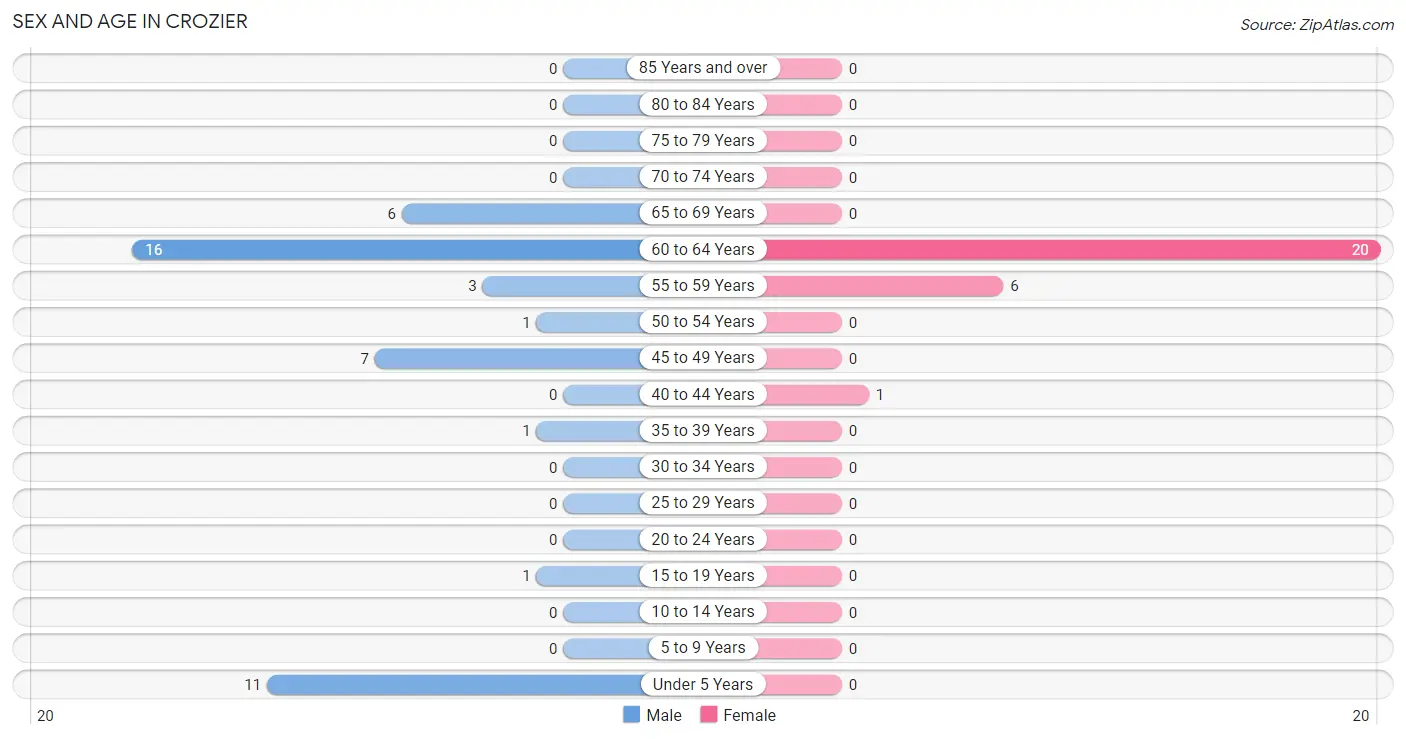
Sex and Age in Crozier
Sex and Age in Crozier
The most populous age groups in Crozier are 60 to 64 Years (16 | 34.8%) for men and 60 to 64 Years (20 | 74.1%) for women.
| Age Bracket | Male | Female |
| Under 5 Years | 11 (23.9%) | 0 (0.0%) |
| 5 to 9 Years | 0 (0.0%) | 0 (0.0%) |
| 10 to 14 Years | 0 (0.0%) | 0 (0.0%) |
| 15 to 19 Years | 1 (2.2%) | 0 (0.0%) |
| 20 to 24 Years | 0 (0.0%) | 0 (0.0%) |
| 25 to 29 Years | 0 (0.0%) | 0 (0.0%) |
| 30 to 34 Years | 0 (0.0%) | 0 (0.0%) |
| 35 to 39 Years | 1 (2.2%) | 0 (0.0%) |
| 40 to 44 Years | 0 (0.0%) | 1 (3.7%) |
| 45 to 49 Years | 7 (15.2%) | 0 (0.0%) |
| 50 to 54 Years | 1 (2.2%) | 0 (0.0%) |
| 55 to 59 Years | 3 (6.5%) | 6 (22.2%) |
| 60 to 64 Years | 16 (34.8%) | 20 (74.1%) |
| 65 to 69 Years | 6 (13.0%) | 0 (0.0%) |
| 70 to 74 Years | 0 (0.0%) | 0 (0.0%) |
| 75 to 79 Years | 0 (0.0%) | 0 (0.0%) |
| 80 to 84 Years | 0 (0.0%) | 0 (0.0%) |
| 85 Years and over | 0 (0.0%) | 0 (0.0%) |
| Total | 46 (100.0%) | 27 (100.0%) |
Families and Households in Crozier
Median Family Size in Crozier
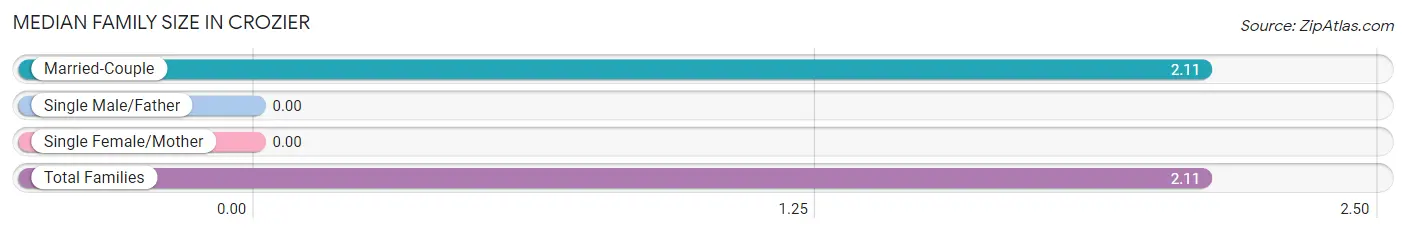
| Family Type | # Families | Family Size |
| Married-Couple | 9 (100.0%) | 2.11 |
| Single Male/Father | 0 (0.0%) | - |
| Single Female/Mother | 0 (0.0%) | - |
| Total Families | 9 (100.0%) | 2.11 |
Median Household Size in Crozier
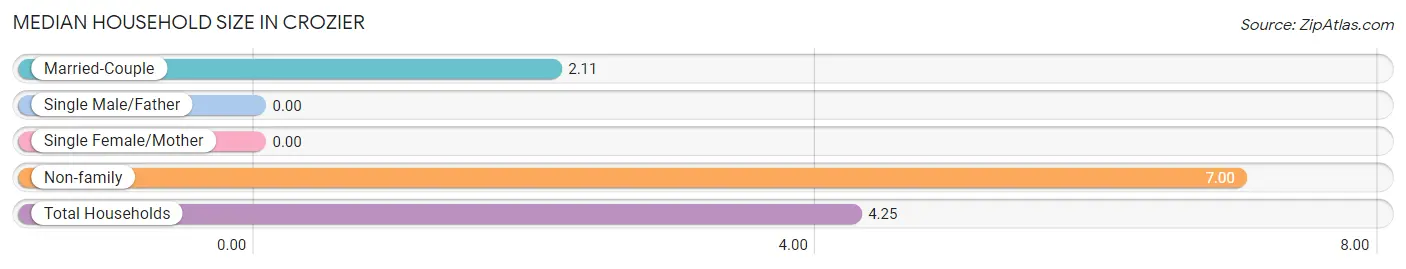
| Household Type | # Households | Household Size |
| Married-Couple | 9 (56.2%) | 2.11 |
| Single Male/Father | 0 (0.0%) | - |
| Single Female/Mother | 0 (0.0%) | - |
| Non-family | 7 (43.8%) | 7.00 |
| Total Households | 16 (100.0%) | 4.25 |
Household Size by Marriage Status in Crozier
Out of a total of 16 households in Crozier, 9 (56.2%) are family households, while 7 (43.8%) are nonfamily households. The most numerous type of family households are 2-person households, comprising 9, and the most common type of nonfamily households are 7+ person households, comprising 4.
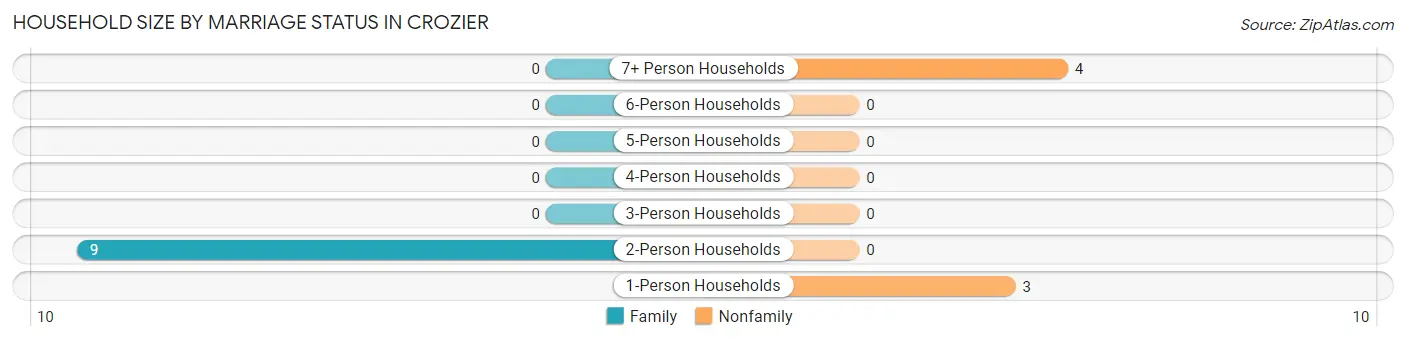
| Household Size | Family Households | Nonfamily Households |
| 1-Person Households | - | 3 (18.8%) |
| 2-Person Households | 9 (56.2%) | 0 (0.0%) |
| 3-Person Households | 0 (0.0%) | 0 (0.0%) |
| 4-Person Households | 0 (0.0%) | 0 (0.0%) |
| 5-Person Households | 0 (0.0%) | 0 (0.0%) |
| 6-Person Households | 0 (0.0%) | 0 (0.0%) |
| 7+ Person Households | 0 (0.0%) | 4 (25.0%) |
| Total | 9 (56.2%) | 7 (43.8%) |
Female Fertility in Crozier
Fertility by Age in Crozier
| Age Bracket | Women with Births | Births / 1,000 Women |
| 15 to 19 years | 0 (0.0%) | 0.0 |
| 20 to 34 years | 0 (0.0%) | 0.0 |
| 35 to 50 years | 0 (0.0%) | 0.0 |
| Total | 0 (0.0%) | 0.0 |
Fertility by Age by Marriage Status in Crozier
| Age Bracket | Married | Unmarried |
| 15 to 19 years | 0 (0.0%) | 0 (0.0%) |
| 20 to 34 years | 0 (0.0%) | 0 (0.0%) |
| 35 to 50 years | 0 (0.0%) | 0 (0.0%) |
| Total | 0 (0.0%) | 0 (0.0%) |
Fertility by Education in Crozier
| Educational Attainment | Women with Births | Births / 1,000 Women |
| Less than High School | 0 (0.0%) | 0.0 |
| High School Diploma | 0 (0.0%) | 0.0 |
| College or Associate's Degree | 0 (0.0%) | 0.0 |
| Bachelor's Degree | 0 (0.0%) | 0.0 |
| Graduate Degree | 0 (0.0%) | 0.0 |
| Total | 0 (0.0%) | 0.0 |
Fertility by Education by Marriage Status in Crozier
| Educational Attainment | Married | Unmarried |
| Less than High School | 0 (0.0%) | 0 (0.0%) |
| High School Diploma | 0 (0.0%) | 0 (0.0%) |
| College or Associate's Degree | 0 (0.0%) | 0 (0.0%) |
| Bachelor's Degree | 0 (0.0%) | 0 (0.0%) |
| Graduate Degree | 0 (0.0%) | 0 (0.0%) |
| Total | 0 (0.0%) | 0 (0.0%) |
Employment Characteristics in Crozier
Employment by Class of Employer in Crozier
Among the 12 employed individuals in Crozier, private company employees (8 | 66.7%), federal government employees (3 | 25.0%), and self-employed (incorporated) (1 | 8.3%) make up the most common classes of employment.
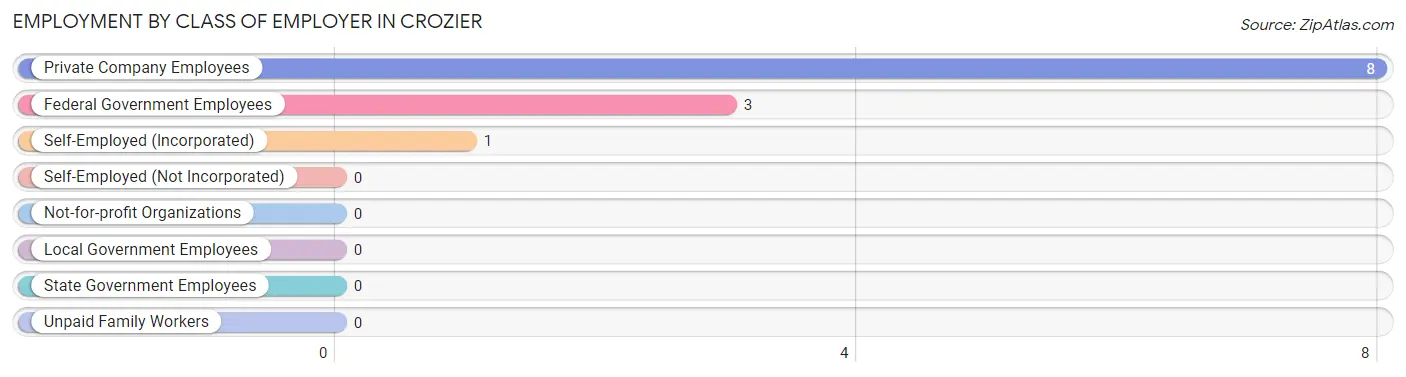
| Employer Class | # Employees | % Employees |
| Private Company Employees | 8 | 66.7% |
| Self-Employed (Incorporated) | 1 | 8.3% |
| Self-Employed (Not Incorporated) | 0 | 0.0% |
| Not-for-profit Organizations | 0 | 0.0% |
| Local Government Employees | 0 | 0.0% |
| State Government Employees | 0 | 0.0% |
| Federal Government Employees | 3 | 25.0% |
| Unpaid Family Workers | 0 | 0.0% |
| Total | 12 | 100.0% |
Employment Status by Age in Crozier
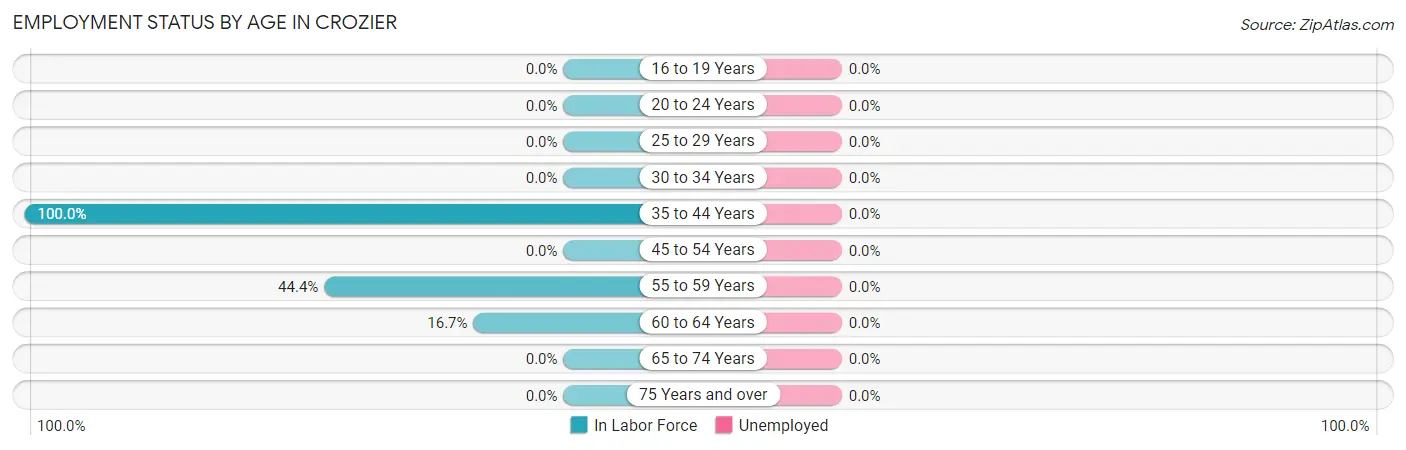
| Age Bracket | In Labor Force | Unemployed |
| 16 to 19 Years | 0 (0.0%) | 0 (0.0%) |
| 20 to 24 Years | 0 (0.0%) | 0 (0.0%) |
| 25 to 29 Years | 0 (0.0%) | 0 (0.0%) |
| 30 to 34 Years | 0 (0.0%) | 0 (0.0%) |
| 35 to 44 Years | 2 (100.0%) | 0 (0.0%) |
| 45 to 54 Years | 0 (0.0%) | 0 (0.0%) |
| 55 to 59 Years | 4 (44.4%) | 0 (0.0%) |
| 60 to 64 Years | 6 (16.7%) | 0 (0.0%) |
| 65 to 74 Years | 0 (0.0%) | 0 (0.0%) |
| 75 Years and over | 0 (0.0%) | 0 (0.0%) |
| Total | 12 (19.4%) | 0 (0.0%) |
Employment Status by Educational Attainment in Crozier
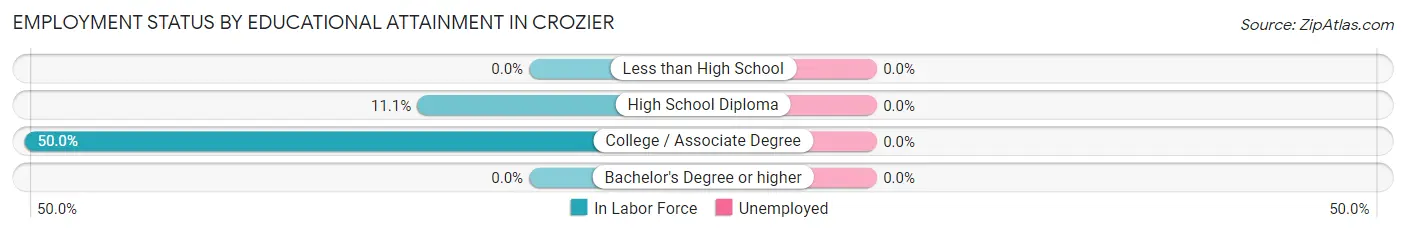
| Educational Attainment | In Labor Force | Unemployed |
| Less than High School | 0 (0.0%) | 0 (0.0%) |
| High School Diploma | 1 (11.1%) | 0 (0.0%) |
| College / Associate Degree | 11 (50.0%) | 0 (0.0%) |
| Bachelor's Degree or higher | 0 (0.0%) | 0 (0.0%) |
| Total | 12 (21.8%) | 0 (0.0%) |
Employment Occupations by Sex in Crozier
Management, Business, Science and Arts Occupations
The most common Management, Business, Science and Arts occupations in Crozier are , and Business & Financial (1 | 8.3%).
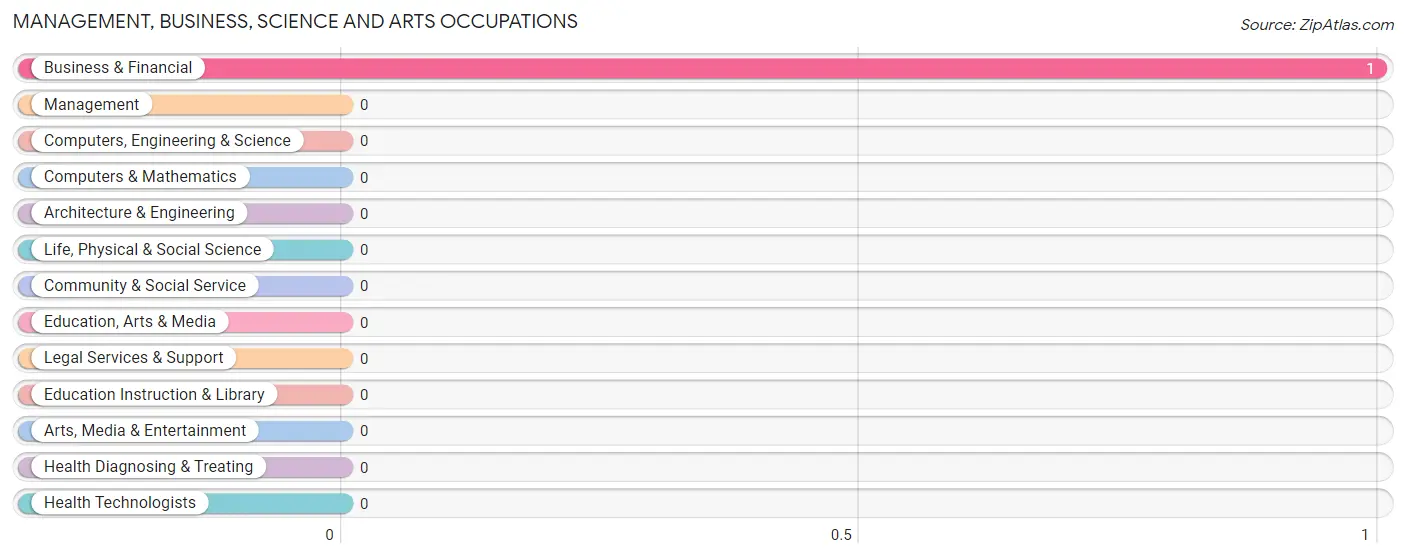
Management, Business, Science and Arts Occupations by Sex
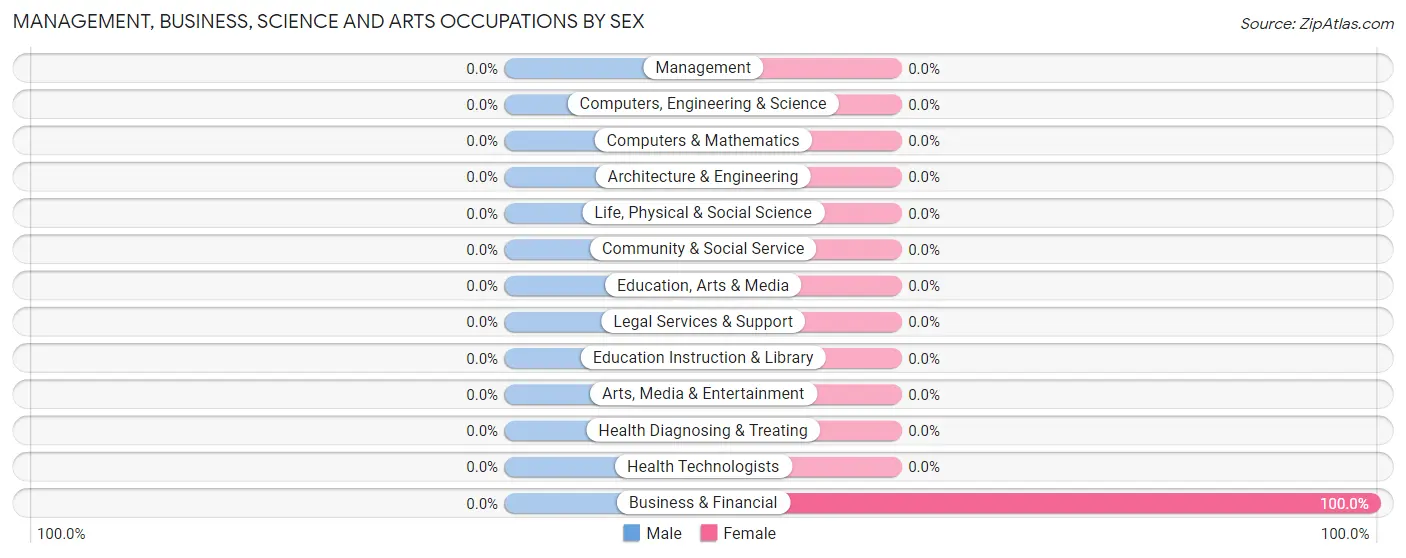
| Occupation | Male | Female |
| Management | 0 (0.0%) | 0 (0.0%) |
| Business & Financial | 0 (0.0%) | 1 (100.0%) |
| Computers, Engineering & Science | 0 (0.0%) | 0 (0.0%) |
| Computers & Mathematics | 0 (0.0%) | 0 (0.0%) |
| Architecture & Engineering | 0 (0.0%) | 0 (0.0%) |
| Life, Physical & Social Science | 0 (0.0%) | 0 (0.0%) |
| Community & Social Service | 0 (0.0%) | 0 (0.0%) |
| Education, Arts & Media | 0 (0.0%) | 0 (0.0%) |
| Legal Services & Support | 0 (0.0%) | 0 (0.0%) |
| Education Instruction & Library | 0 (0.0%) | 0 (0.0%) |
| Arts, Media & Entertainment | 0 (0.0%) | 0 (0.0%) |
| Health Diagnosing & Treating | 0 (0.0%) | 0 (0.0%) |
| Health Technologists | 0 (0.0%) | 0 (0.0%) |
| Total (Category) | 0 (0.0%) | 1 (100.0%) |
| Total (Overall) | 4 (33.3%) | 8 (66.7%) |
Services Occupations
The most common Services occupations in Crozier are , and Healthcare Support (6 | 50.0%).
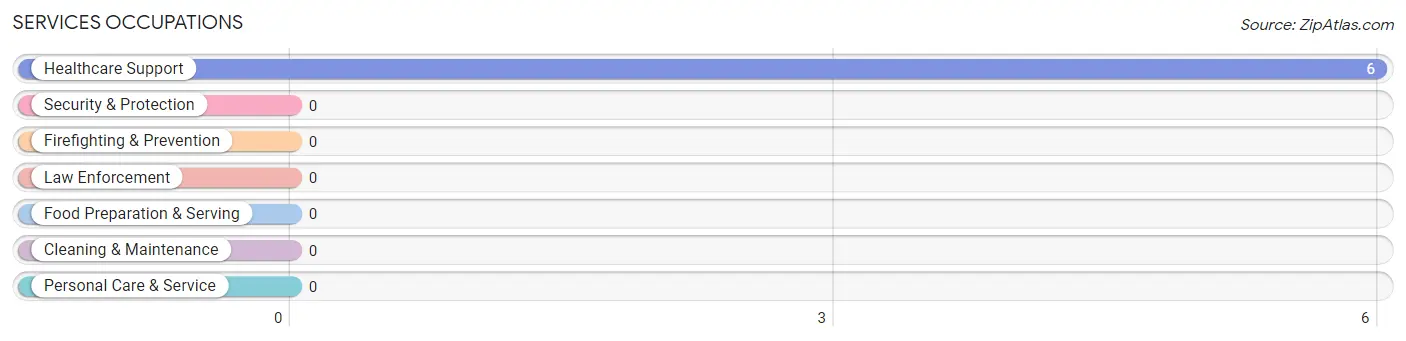
Services Occupations by Sex
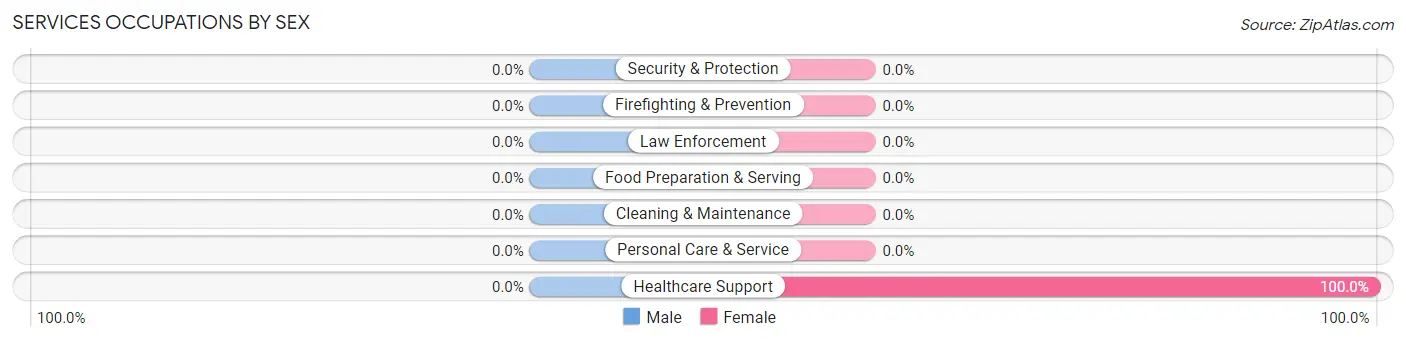
| Occupation | Male | Female |
| Healthcare Support | 0 (0.0%) | 6 (100.0%) |
| Security & Protection | 0 (0.0%) | 0 (0.0%) |
| Firefighting & Prevention | 0 (0.0%) | 0 (0.0%) |
| Law Enforcement | 0 (0.0%) | 0 (0.0%) |
| Food Preparation & Serving | 0 (0.0%) | 0 (0.0%) |
| Cleaning & Maintenance | 0 (0.0%) | 0 (0.0%) |
| Personal Care & Service | 0 (0.0%) | 0 (0.0%) |
| Total (Category) | 0 (0.0%) | 6 (100.0%) |
| Total (Overall) | 4 (33.3%) | 8 (66.7%) |
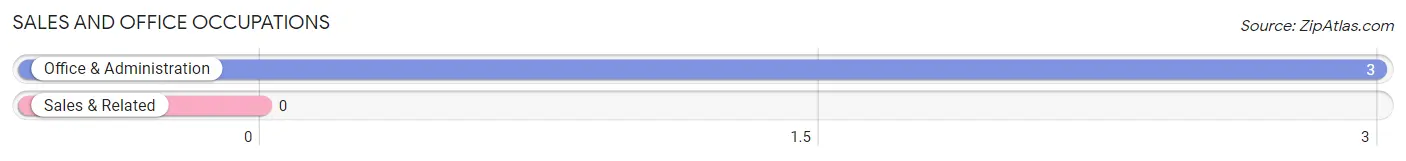
Sales and Office Occupations
The most common Sales and Office occupations in Crozier are , and Office & Administration (3 | 25.0%).
Sales and Office Occupations by Sex
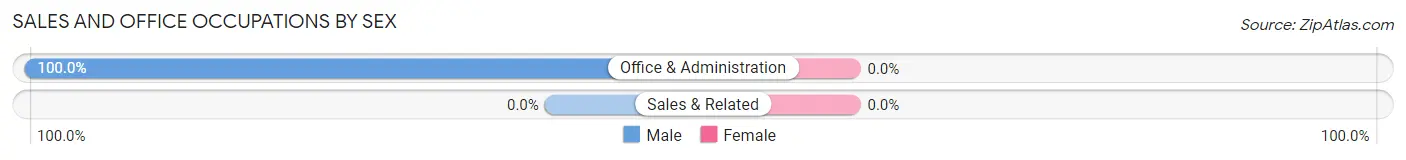
| Occupation | Male | Female |
| Sales & Related | 0 (0.0%) | 0 (0.0%) |
| Office & Administration | 3 (100.0%) | 0 (0.0%) |
| Total (Category) | 3 (100.0%) | 0 (0.0%) |
| Total (Overall) | 4 (33.3%) | 8 (66.7%) |
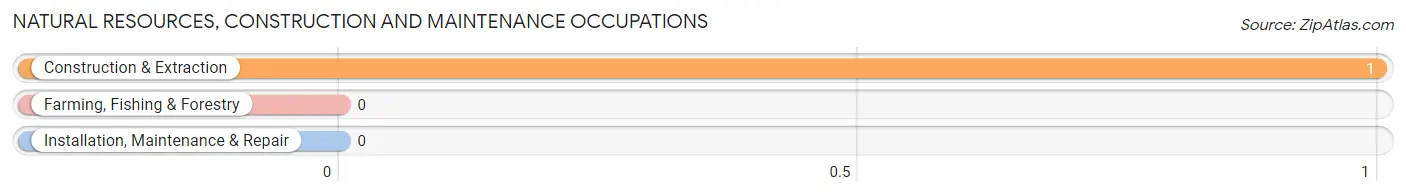
Natural Resources, Construction and Maintenance Occupations
The most common Natural Resources, Construction and Maintenance occupations in Crozier are , and Construction & Extraction (1 | 8.3%).
Natural Resources, Construction and Maintenance Occupations by Sex
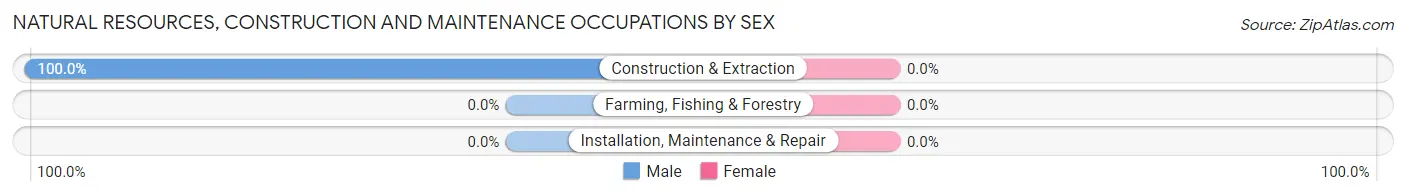
| Occupation | Male | Female |
| Farming, Fishing & Forestry | 0 (0.0%) | 0 (0.0%) |
| Construction & Extraction | 1 (100.0%) | 0 (0.0%) |
| Installation, Maintenance & Repair | 0 (0.0%) | 0 (0.0%) |
| Total (Category) | 1 (100.0%) | 0 (0.0%) |
| Total (Overall) | 4 (33.3%) | 8 (66.7%) |
Production, Transportation and Moving Occupations
The most common Production, Transportation and Moving occupations in Crozier are , and Production (1 | 8.3%).
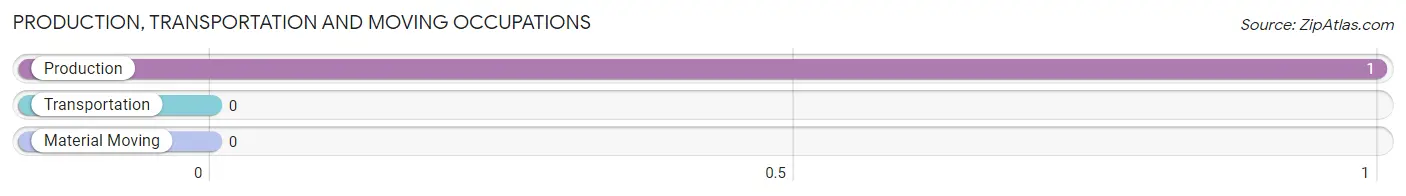
Production, Transportation and Moving Occupations by Sex
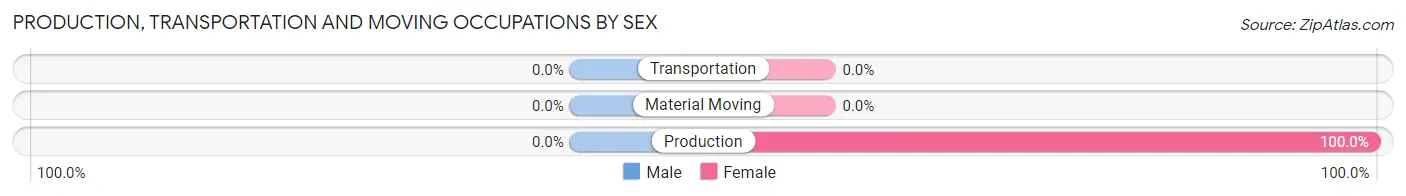
| Occupation | Male | Female |
| Production | 0 (0.0%) | 1 (100.0%) |
| Transportation | 0 (0.0%) | 0 (0.0%) |
| Material Moving | 0 (0.0%) | 0 (0.0%) |
| Total (Category) | 0 (0.0%) | 1 (100.0%) |
| Total (Overall) | 4 (33.3%) | 8 (66.7%) |
Employment Industries by Sex in Crozier
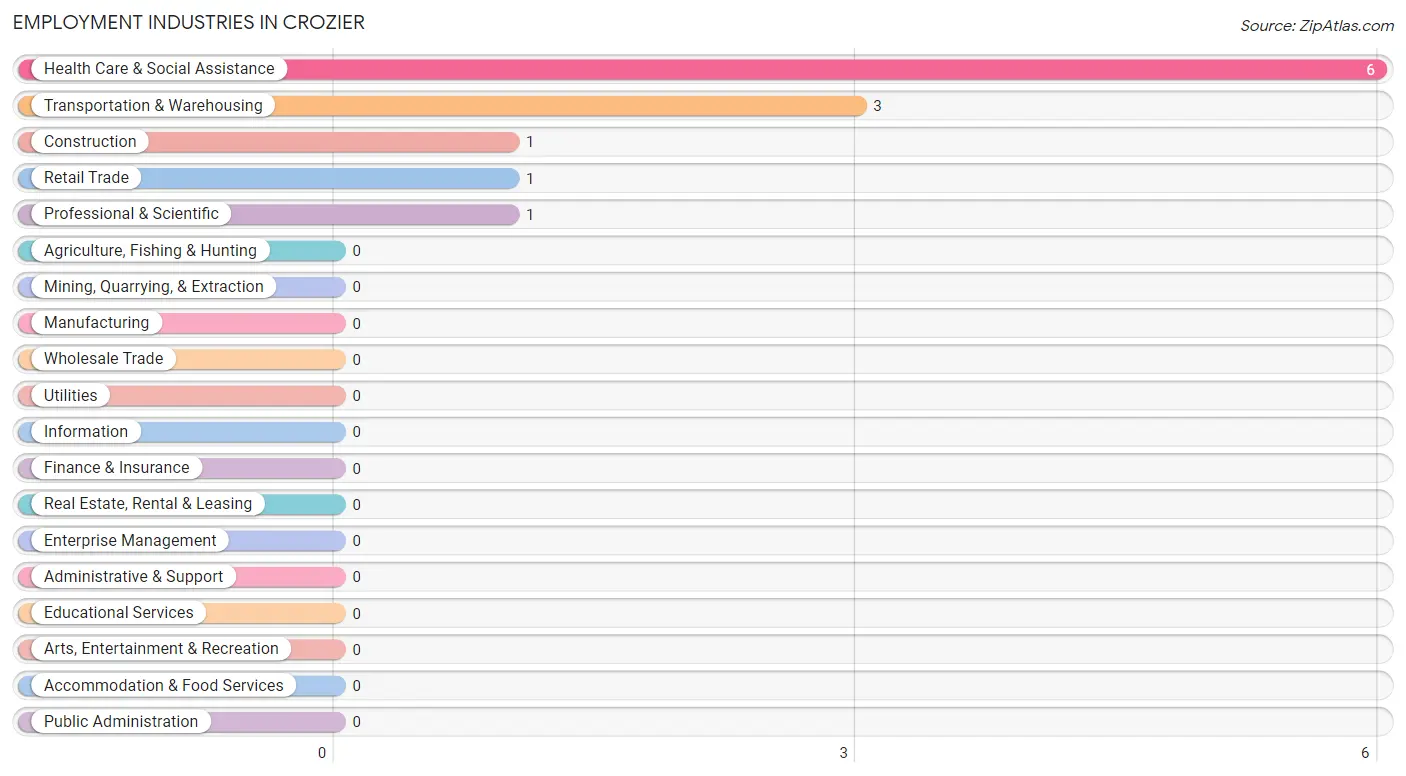
Employment Industries in Crozier
The major employment industries in Crozier include Health Care & Social Assistance (6 | 50.0%), Transportation & Warehousing (3 | 25.0%), Construction (1 | 8.3%), Retail Trade (1 | 8.3%), and Professional & Scientific (1 | 8.3%).
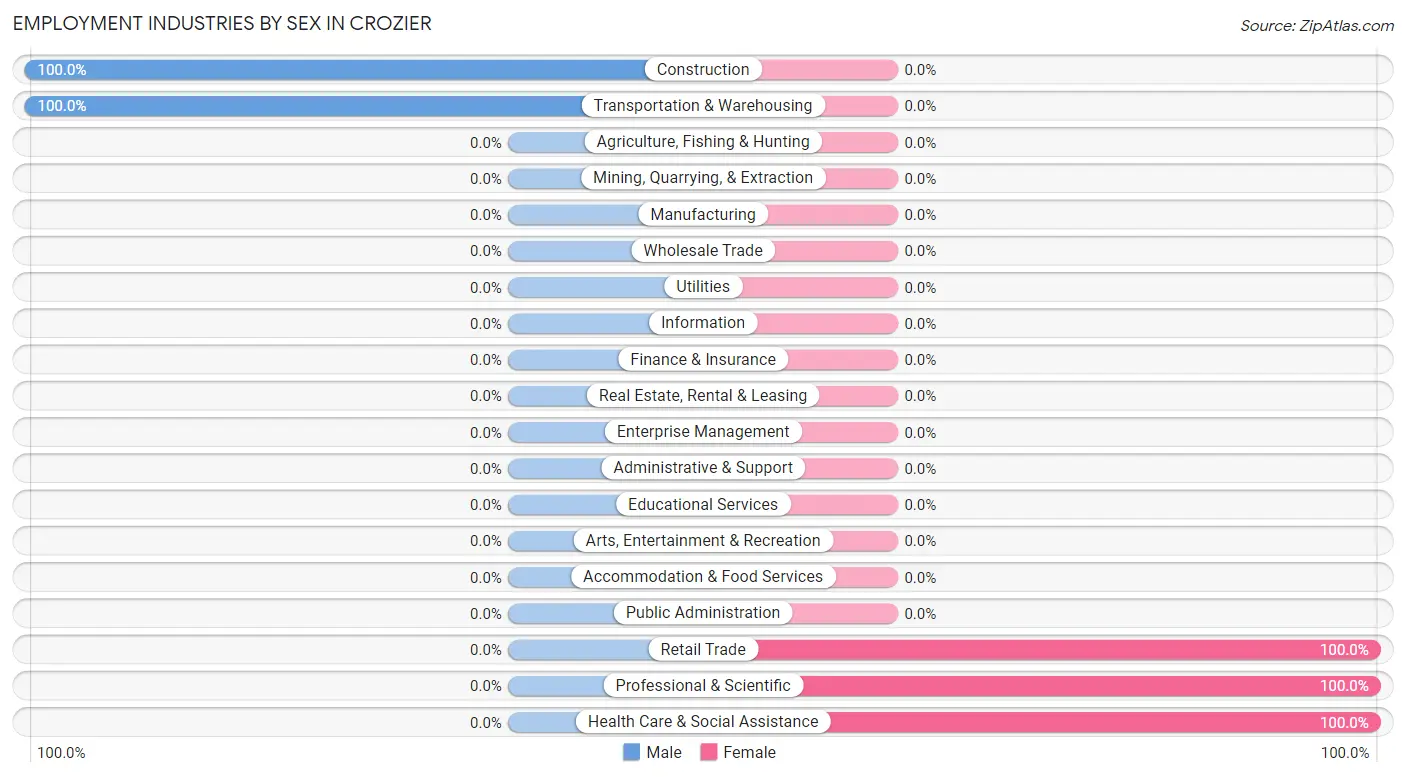
Employment Industries by Sex in Crozier
The Crozier industries that see more men than women are Construction (100.0%), and Transportation & Warehousing (100.0%), whereas the industries that tend to have a higher number of women are Retail Trade (100.0%), Professional & Scientific (100.0%), and Health Care & Social Assistance (100.0%).
| Industry | Male | Female |
| Agriculture, Fishing & Hunting | 0 (0.0%) | 0 (0.0%) |
| Mining, Quarrying, & Extraction | 0 (0.0%) | 0 (0.0%) |
| Construction | 1 (100.0%) | 0 (0.0%) |
| Manufacturing | 0 (0.0%) | 0 (0.0%) |
| Wholesale Trade | 0 (0.0%) | 0 (0.0%) |
| Retail Trade | 0 (0.0%) | 1 (100.0%) |
| Transportation & Warehousing | 3 (100.0%) | 0 (0.0%) |
| Utilities | 0 (0.0%) | 0 (0.0%) |
| Information | 0 (0.0%) | 0 (0.0%) |
| Finance & Insurance | 0 (0.0%) | 0 (0.0%) |
| Real Estate, Rental & Leasing | 0 (0.0%) | 0 (0.0%) |
| Professional & Scientific | 0 (0.0%) | 1 (100.0%) |
| Enterprise Management | 0 (0.0%) | 0 (0.0%) |
| Administrative & Support | 0 (0.0%) | 0 (0.0%) |
| Educational Services | 0 (0.0%) | 0 (0.0%) |
| Health Care & Social Assistance | 0 (0.0%) | 6 (100.0%) |
| Arts, Entertainment & Recreation | 0 (0.0%) | 0 (0.0%) |
| Accommodation & Food Services | 0 (0.0%) | 0 (0.0%) |
| Public Administration | 0 (0.0%) | 0 (0.0%) |
| Total | 4 (33.3%) | 8 (66.7%) |
Education in Crozier
School Enrollment in Crozier
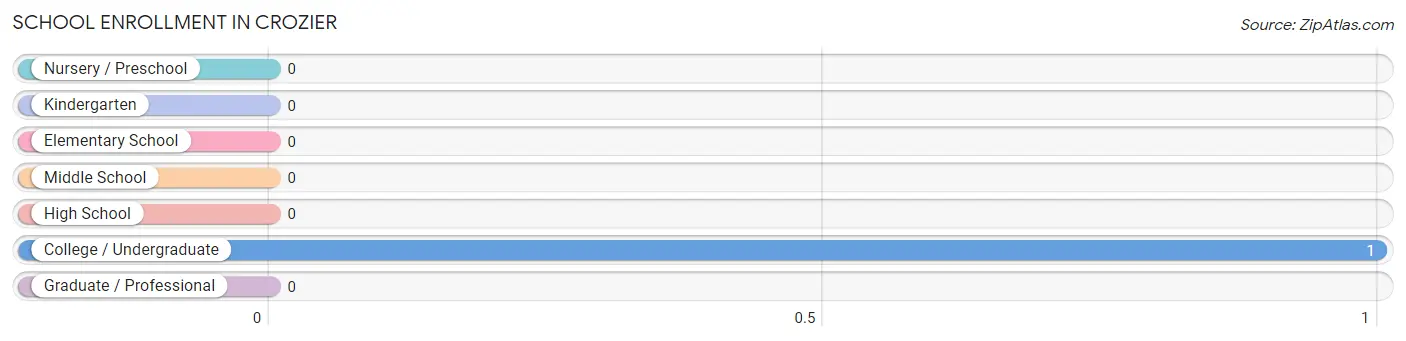
| School Level | # Students | % Students |
| Nursery / Preschool | 0 | 0.0% |
| Kindergarten | 0 | 0.0% |
| Elementary School | 0 | 0.0% |
| Middle School | 0 | 0.0% |
| High School | 0 | 0.0% |
| College / Undergraduate | 1 | 100.0% |
| Graduate / Professional | 0 | 0.0% |
| Total | 1 | 100.0% |
School Enrollment by Age by Funding Source in Crozier
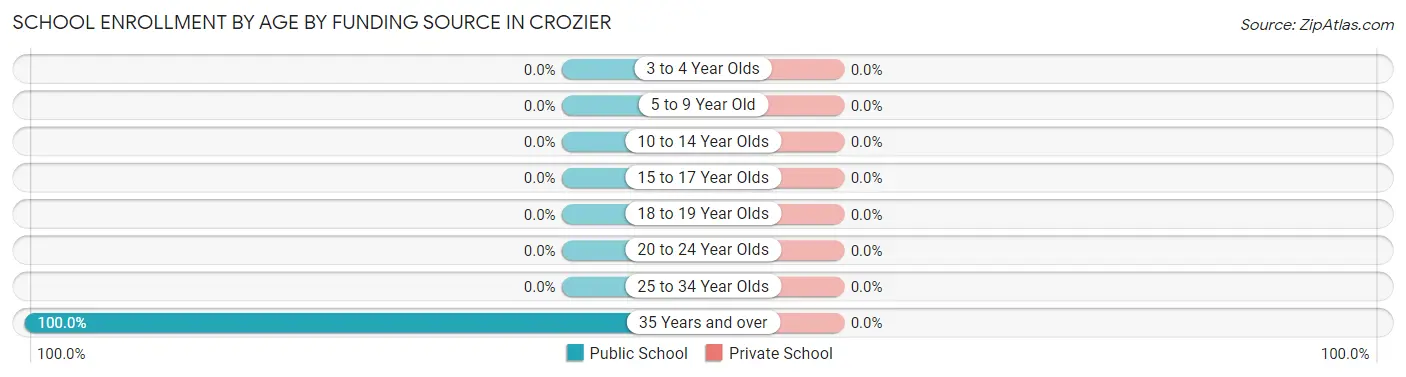
| Age Bracket | Public School | Private School |
| 3 to 4 Year Olds | 0 (0.0%) | 0 (0.0%) |
| 5 to 9 Year Old | 0 (0.0%) | 0 (0.0%) |
| 10 to 14 Year Olds | 0 (0.0%) | 0 (0.0%) |
| 15 to 17 Year Olds | 0 (0.0%) | 0 (0.0%) |
| 18 to 19 Year Olds | 0 (0.0%) | 0 (0.0%) |
| 20 to 24 Year Olds | 0 (0.0%) | 0 (0.0%) |
| 25 to 34 Year Olds | 0 (0.0%) | 0 (0.0%) |
| 35 Years and over | 1 (100.0%) | 0 (0.0%) |
| Total | 1 (100.0%) | 0 (0.0%) |
Educational Attainment by Field of Study in Crozier
Business (7 | 53.8%), and liberal arts & history (6 | 46.2%) are the most common fields of study among 13 individuals in Crozier who have obtained a bachelor's degree or higher.
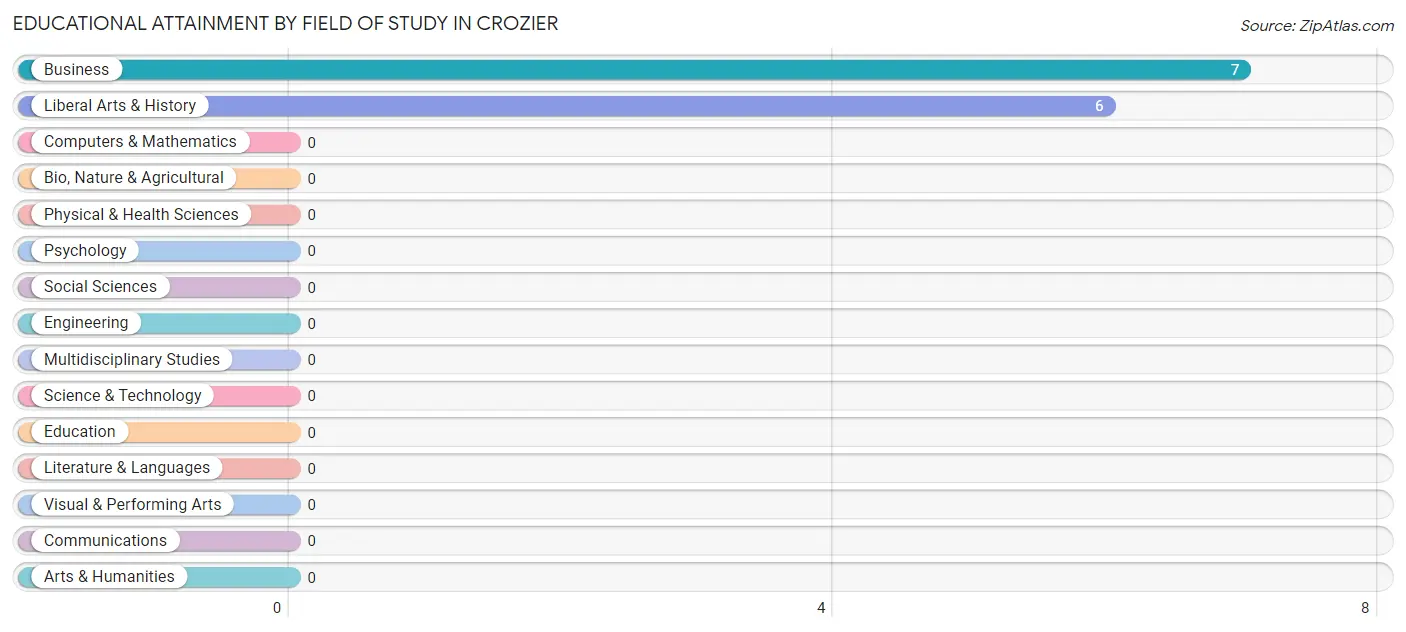
| Field of Study | # Graduates | % Graduates |
| Computers & Mathematics | 0 | 0.0% |
| Bio, Nature & Agricultural | 0 | 0.0% |
| Physical & Health Sciences | 0 | 0.0% |
| Psychology | 0 | 0.0% |
| Social Sciences | 0 | 0.0% |
| Engineering | 0 | 0.0% |
| Multidisciplinary Studies | 0 | 0.0% |
| Science & Technology | 0 | 0.0% |
| Business | 7 | 53.8% |
| Education | 0 | 0.0% |
| Literature & Languages | 0 | 0.0% |
| Liberal Arts & History | 6 | 46.2% |
| Visual & Performing Arts | 0 | 0.0% |
| Communications | 0 | 0.0% |
| Arts & Humanities | 0 | 0.0% |
| Total | 13 | 100.0% |
Transportation & Commute in Crozier
Vehicle Availability by Sex in Crozier
The most prevalent vehicle ownership categories in Crozier are males with 4 vehicles (3, accounting for 100.0%) and females with 4 vehicles (0, making up 50.0%).
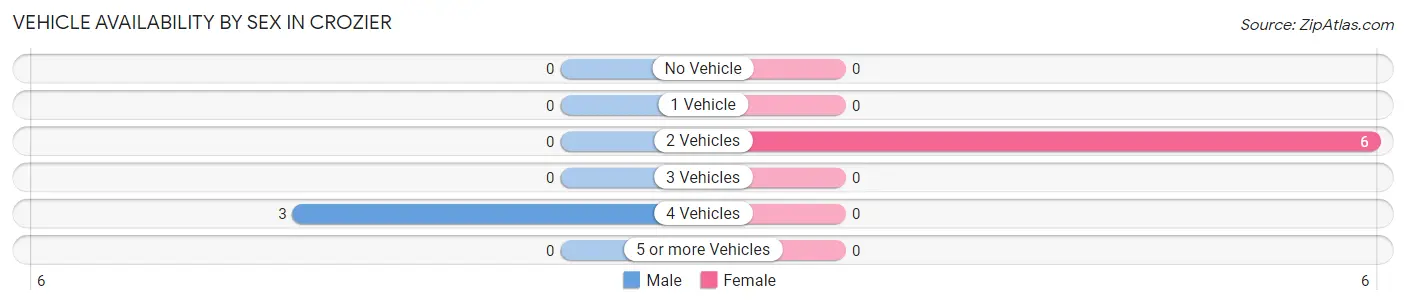
| Vehicles Available | Male | Female |
| No Vehicle | 0 (0.0%) | 0 (0.0%) |
| 1 Vehicle | 0 (0.0%) | 0 (0.0%) |
| 2 Vehicles | 0 (0.0%) | 6 (100.0%) |
| 3 Vehicles | 0 (0.0%) | 0 (0.0%) |
| 4 Vehicles | 3 (100.0%) | 0 (0.0%) |
| 5 or more Vehicles | 0 (0.0%) | 0 (0.0%) |
| Total | 3 (100.0%) | 6 (100.0%) |
Commute Time in Crozier
The most frequently occuring commute durations in Crozier are 45 to 59 minutes (6 commuters, 50.0%), 40 to 44 minutes (3 commuters, 25.0%), and 10 to 14 minutes (1 commuters, 8.3%).
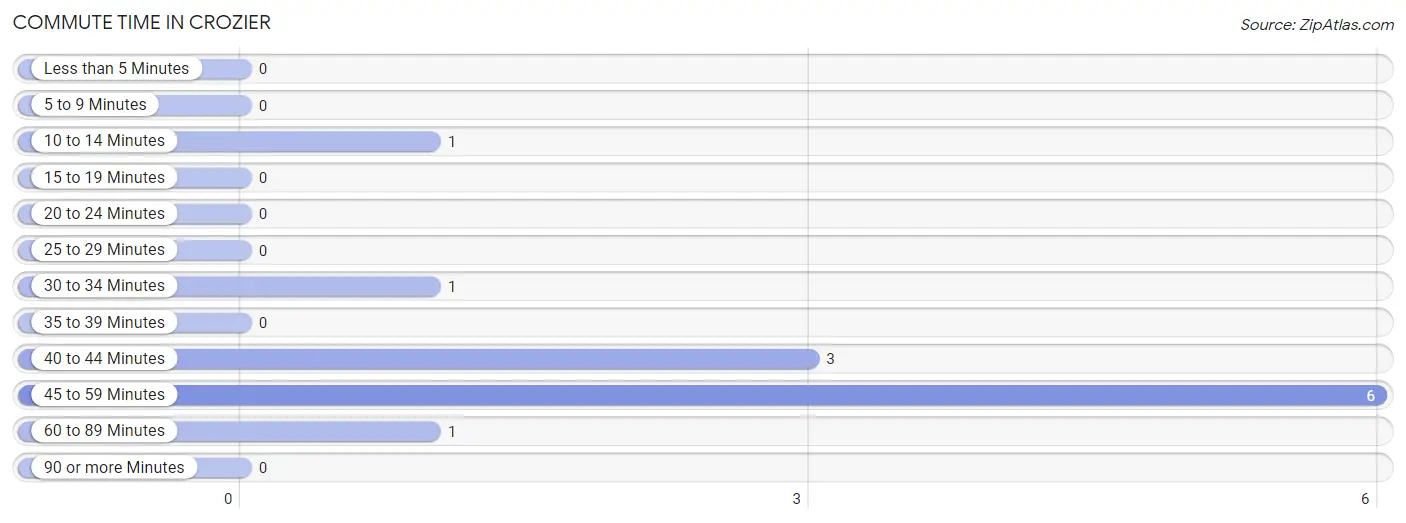
| Commute Time | # Commuters | % Commuters |
| Less than 5 Minutes | 0 | 0.0% |
| 5 to 9 Minutes | 0 | 0.0% |
| 10 to 14 Minutes | 1 | 8.3% |
| 15 to 19 Minutes | 0 | 0.0% |
| 20 to 24 Minutes | 0 | 0.0% |
| 25 to 29 Minutes | 0 | 0.0% |
| 30 to 34 Minutes | 1 | 8.3% |
| 35 to 39 Minutes | 0 | 0.0% |
| 40 to 44 Minutes | 3 | 25.0% |
| 45 to 59 Minutes | 6 | 50.0% |
| 60 to 89 Minutes | 1 | 8.3% |
| 90 or more Minutes | 0 | 0.0% |
Commute Time by Sex in Crozier
The most common commute times in Crozier are 40 to 44 minutes (3 commuters, 75.0%) for males and 45 to 59 minutes (6 commuters, 75.0%) for females.
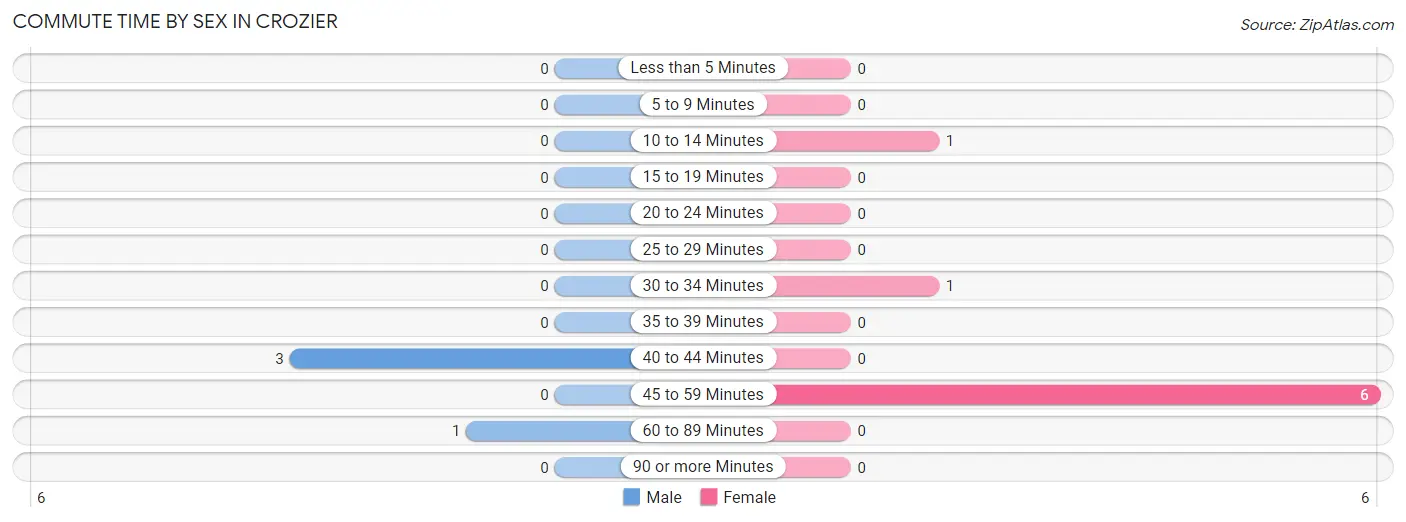
| Commute Time | Male | Female |
| Less than 5 Minutes | 0 (0.0%) | 0 (0.0%) |
| 5 to 9 Minutes | 0 (0.0%) | 0 (0.0%) |
| 10 to 14 Minutes | 0 (0.0%) | 1 (12.5%) |
| 15 to 19 Minutes | 0 (0.0%) | 0 (0.0%) |
| 20 to 24 Minutes | 0 (0.0%) | 0 (0.0%) |
| 25 to 29 Minutes | 0 (0.0%) | 0 (0.0%) |
| 30 to 34 Minutes | 0 (0.0%) | 1 (12.5%) |
| 35 to 39 Minutes | 0 (0.0%) | 0 (0.0%) |
| 40 to 44 Minutes | 3 (75.0%) | 0 (0.0%) |
| 45 to 59 Minutes | 0 (0.0%) | 6 (75.0%) |
| 60 to 89 Minutes | 1 (25.0%) | 0 (0.0%) |
| 90 or more Minutes | 0 (0.0%) | 0 (0.0%) |
Time of Departure to Work by Sex in Crozier
The most frequent times of departure to work in Crozier are 5:00 AM to 5:29 AM (3, 75.0%) for males and 5:00 AM to 5:29 AM (6, 75.0%) for females.
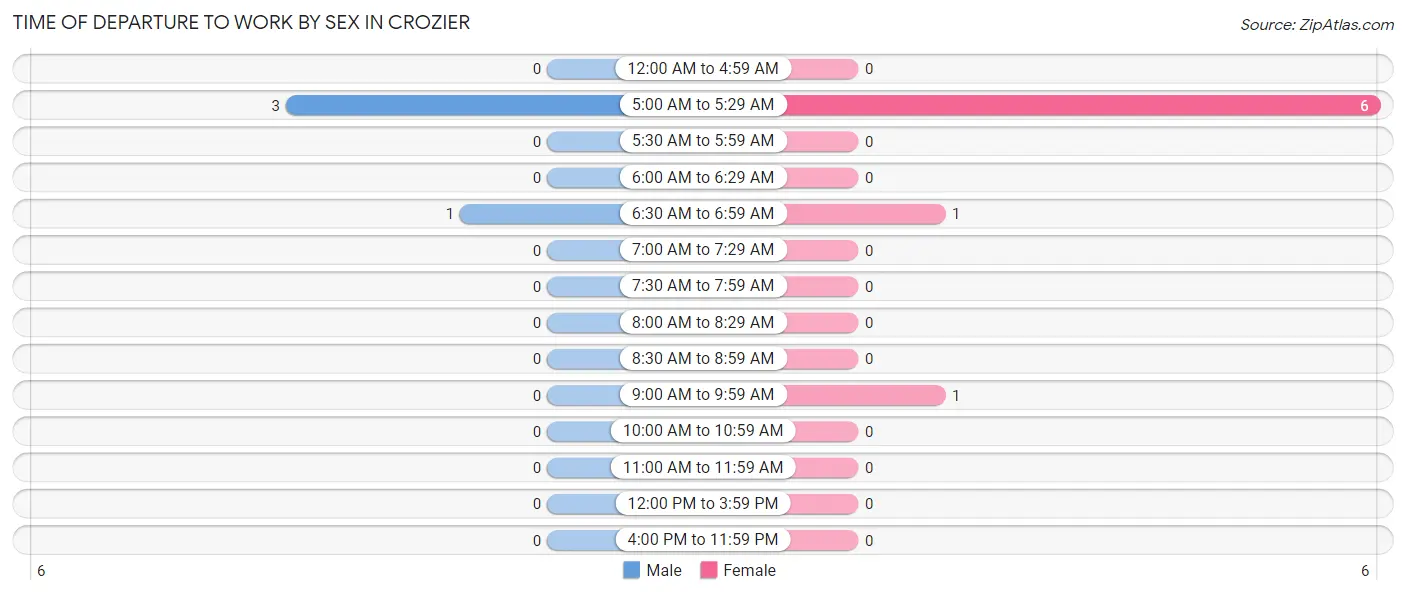
| Time of Departure | Male | Female |
| 12:00 AM to 4:59 AM | 0 (0.0%) | 0 (0.0%) |
| 5:00 AM to 5:29 AM | 3 (75.0%) | 6 (75.0%) |
| 5:30 AM to 5:59 AM | 0 (0.0%) | 0 (0.0%) |
| 6:00 AM to 6:29 AM | 0 (0.0%) | 0 (0.0%) |
| 6:30 AM to 6:59 AM | 1 (25.0%) | 1 (12.5%) |
| 7:00 AM to 7:29 AM | 0 (0.0%) | 0 (0.0%) |
| 7:30 AM to 7:59 AM | 0 (0.0%) | 0 (0.0%) |
| 8:00 AM to 8:29 AM | 0 (0.0%) | 0 (0.0%) |
| 8:30 AM to 8:59 AM | 0 (0.0%) | 0 (0.0%) |
| 9:00 AM to 9:59 AM | 0 (0.0%) | 1 (12.5%) |
| 10:00 AM to 10:59 AM | 0 (0.0%) | 0 (0.0%) |
| 11:00 AM to 11:59 AM | 0 (0.0%) | 0 (0.0%) |
| 12:00 PM to 3:59 PM | 0 (0.0%) | 0 (0.0%) |
| 4:00 PM to 11:59 PM | 0 (0.0%) | 0 (0.0%) |
| Total | 4 (100.0%) | 8 (100.0%) |
Housing Occupancy in Crozier
Occupancy by Ownership in Crozier
Of the total 16 dwellings in Crozier, owner-occupied units account for 12 (75.0%), while renter-occupied units make up 4 (25.0%).
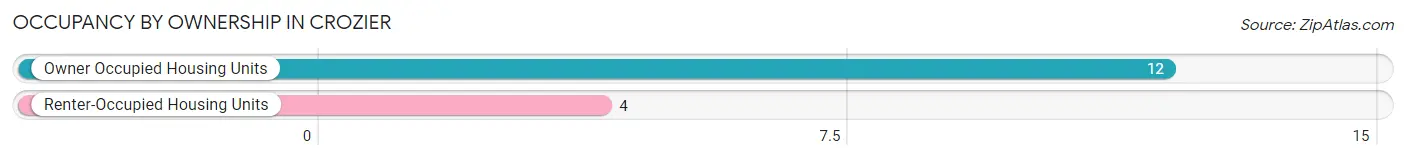
| Occupancy | # Housing Units | % Housing Units |
| Owner Occupied Housing Units | 12 | 75.0% |
| Renter-Occupied Housing Units | 4 | 25.0% |
| Total Occupied Housing Units | 16 | 100.0% |
Occupancy by Household Size in Crozier
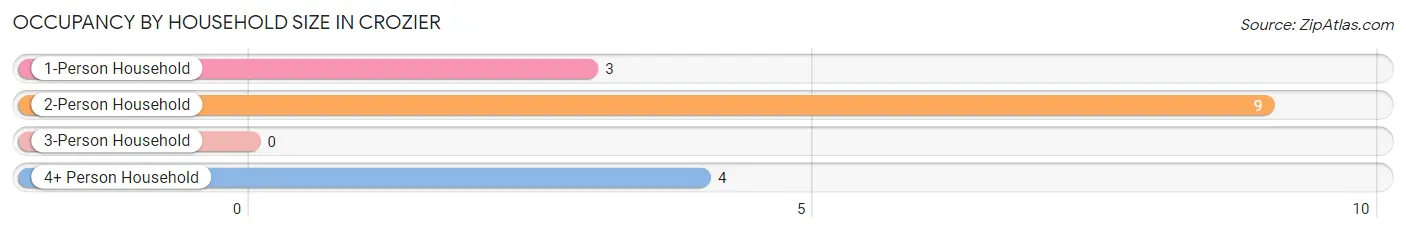
| Household Size | # Housing Units | % Housing Units |
| 1-Person Household | 3 | 18.8% |
| 2-Person Household | 9 | 56.2% |
| 3-Person Household | 0 | 0.0% |
| 4+ Person Household | 4 | 25.0% |
| Total Housing Units | 16 | 100.0% |
Occupancy by Ownership by Household Size in Crozier
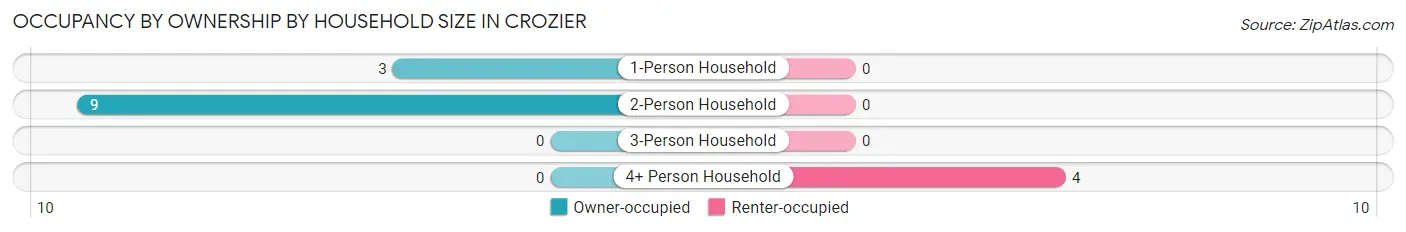
| Household Size | Owner-occupied | Renter-occupied |
| 1-Person Household | 3 (100.0%) | 0 (0.0%) |
| 2-Person Household | 9 (100.0%) | 0 (0.0%) |
| 3-Person Household | 0 (0.0%) | 0 (0.0%) |
| 4+ Person Household | 0 (0.0%) | 4 (100.0%) |
| Total Housing Units | 12 (75.0%) | 4 (25.0%) |
Occupancy by Educational Attainment in Crozier
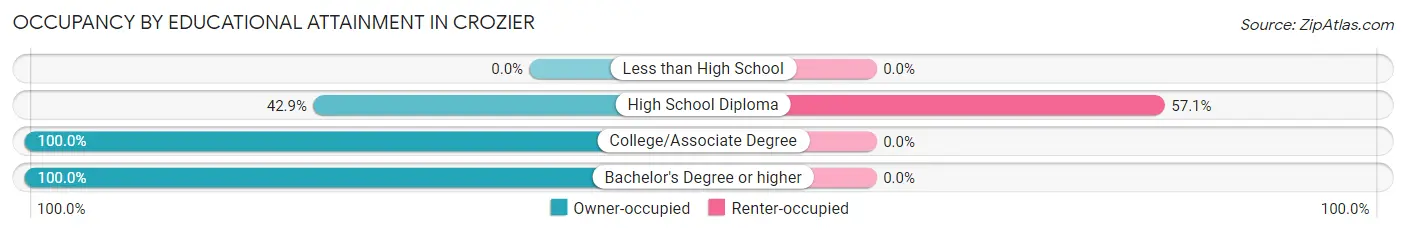
| Household Size | Owner-occupied | Renter-occupied |
| Less than High School | 0 (0.0%) | 0 (0.0%) |
| High School Diploma | 3 (42.9%) | 4 (57.1%) |
| College/Associate Degree | 3 (100.0%) | 0 (0.0%) |
| Bachelor's Degree or higher | 6 (100.0%) | 0 (0.0%) |
Occupancy by Age of Householder in Crozier
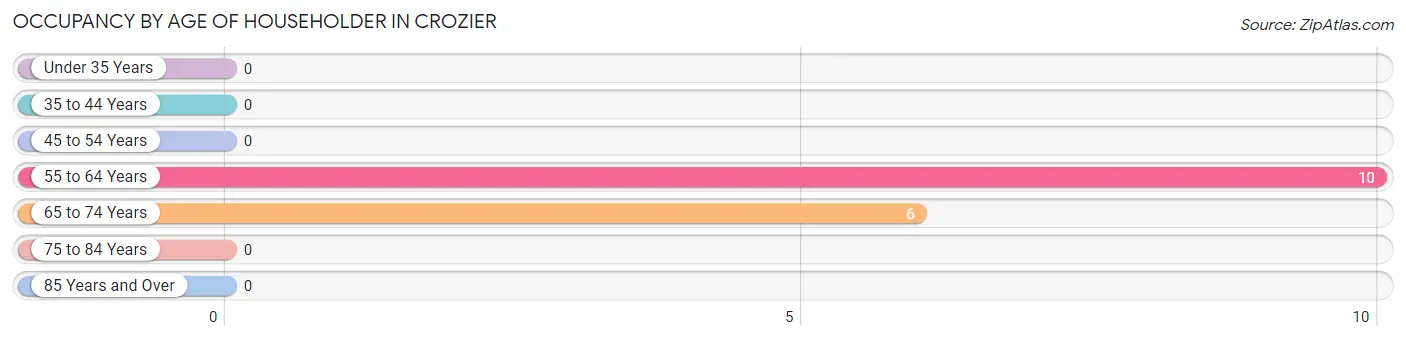
| Age Bracket | # Households | % Households |
| Under 35 Years | 0 | 0.0% |
| 35 to 44 Years | 0 | 0.0% |
| 45 to 54 Years | 0 | 0.0% |
| 55 to 64 Years | 10 | 62.5% |
| 65 to 74 Years | 6 | 37.5% |
| 75 to 84 Years | 0 | 0.0% |
| 85 Years and Over | 0 | 0.0% |
| Total | 16 | 100.0% |
Housing Finances in Crozier
Median Income by Occupancy in Crozier
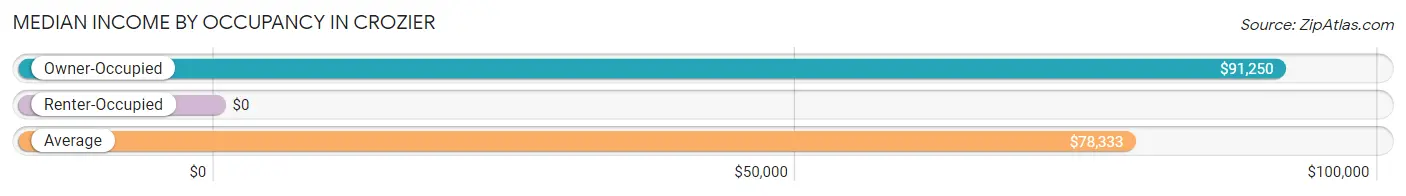
| Occupancy Type | # Households | Median Income |
| Owner-Occupied | 12 (75.0%) | $91,250 |
| Renter-Occupied | 4 (25.0%) | $0 |
| Average | 16 (100.0%) | $78,333 |
Occupancy by Householder Income Bracket in Crozier
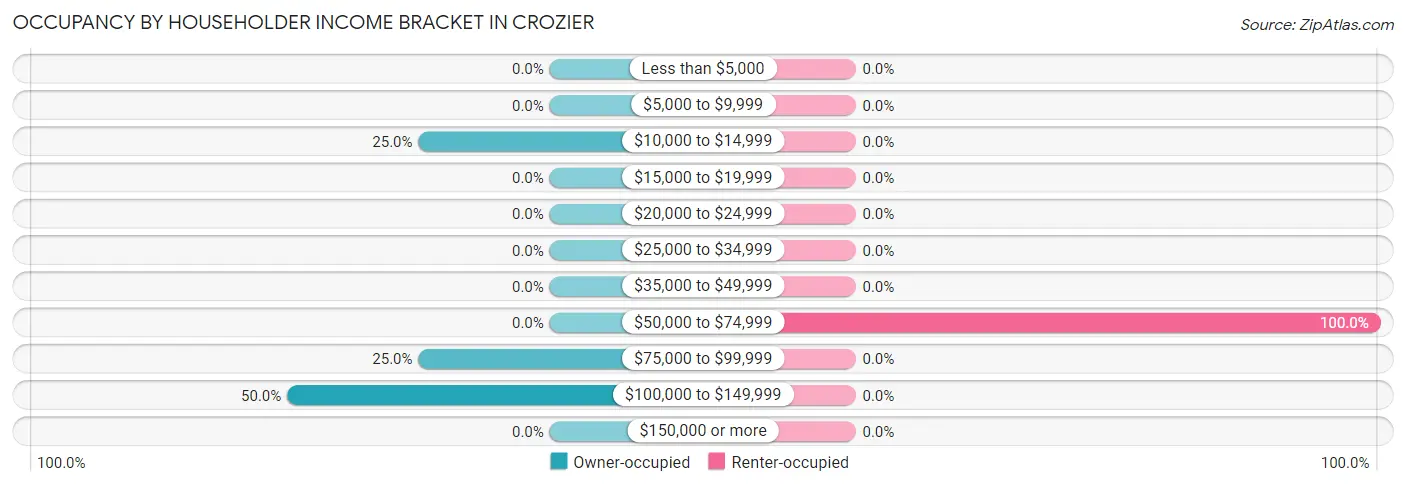
| Income Bracket | Owner-occupied | Renter-occupied |
| Less than $5,000 | 0 (0.0%) | 0 (0.0%) |
| $5,000 to $9,999 | 0 (0.0%) | 0 (0.0%) |
| $10,000 to $14,999 | 3 (25.0%) | 0 (0.0%) |
| $15,000 to $19,999 | 0 (0.0%) | 0 (0.0%) |
| $20,000 to $24,999 | 0 (0.0%) | 0 (0.0%) |
| $25,000 to $34,999 | 0 (0.0%) | 0 (0.0%) |
| $35,000 to $49,999 | 0 (0.0%) | 0 (0.0%) |
| $50,000 to $74,999 | 0 (0.0%) | 4 (100.0%) |
| $75,000 to $99,999 | 3 (25.0%) | 0 (0.0%) |
| $100,000 to $149,999 | 6 (50.0%) | 0 (0.0%) |
| $150,000 or more | 0 (0.0%) | 0 (0.0%) |
| Total | 12 (100.0%) | 4 (100.0%) |
Monthly Housing Cost Tiers in Crozier
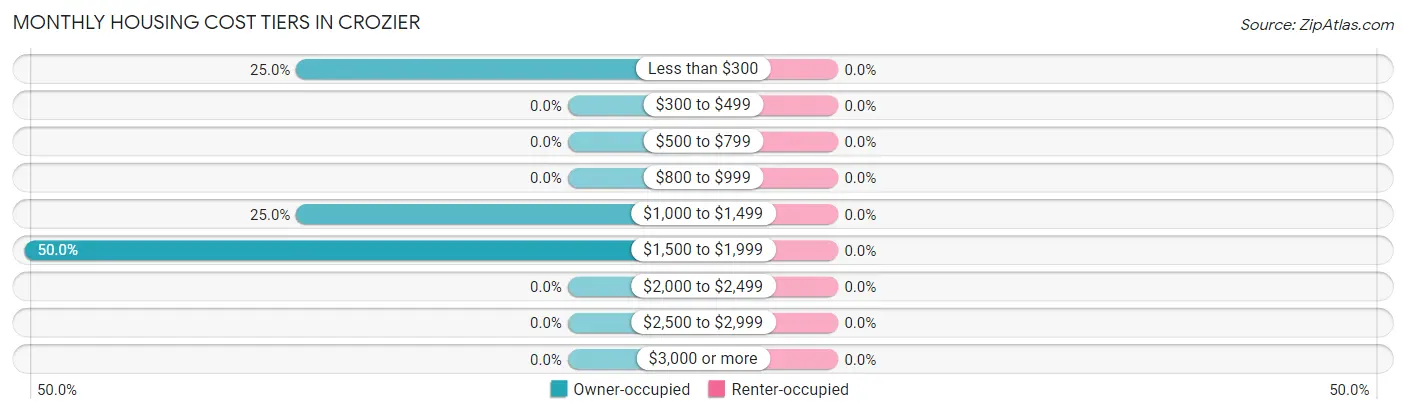
| Monthly Cost | Owner-occupied | Renter-occupied |
| Less than $300 | 3 (25.0%) | 0 (0.0%) |
| $300 to $499 | 0 (0.0%) | 0 (0.0%) |
| $500 to $799 | 0 (0.0%) | 0 (0.0%) |
| $800 to $999 | 0 (0.0%) | 0 (0.0%) |
| $1,000 to $1,499 | 3 (25.0%) | 0 (0.0%) |
| $1,500 to $1,999 | 6 (50.0%) | 0 (0.0%) |
| $2,000 to $2,499 | 0 (0.0%) | 0 (0.0%) |
| $2,500 to $2,999 | 0 (0.0%) | 0 (0.0%) |
| $3,000 or more | 0 (0.0%) | 0 (0.0%) |
| Total | 12 (100.0%) | 4 (100.0%) |
Physical Housing Characteristics in Crozier
Housing Structures in Crozier
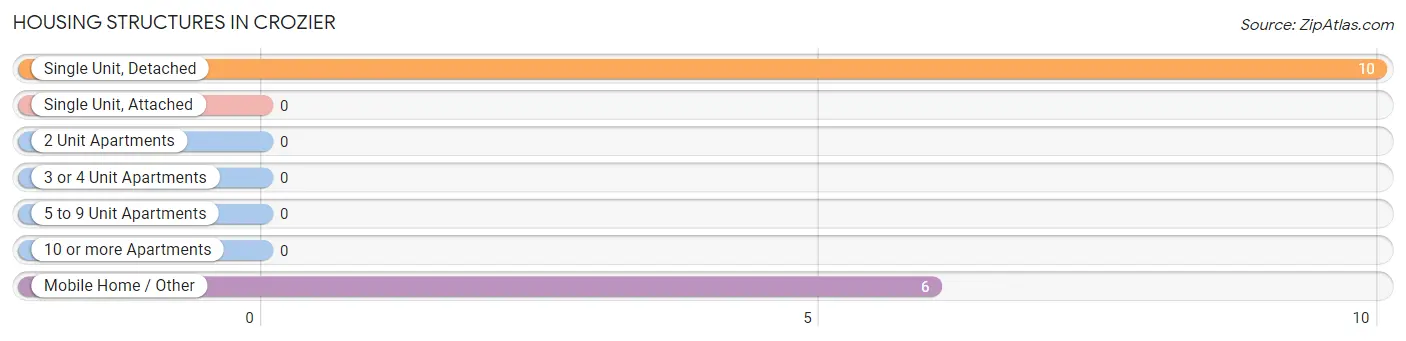
| Structure Type | # Housing Units | % Housing Units |
| Single Unit, Detached | 10 | 62.5% |
| Single Unit, Attached | 0 | 0.0% |
| 2 Unit Apartments | 0 | 0.0% |
| 3 or 4 Unit Apartments | 0 | 0.0% |
| 5 to 9 Unit Apartments | 0 | 0.0% |
| 10 or more Apartments | 0 | 0.0% |
| Mobile Home / Other | 6 | 37.5% |
| Total | 16 | 100.0% |
Housing Structures by Occupancy in Crozier
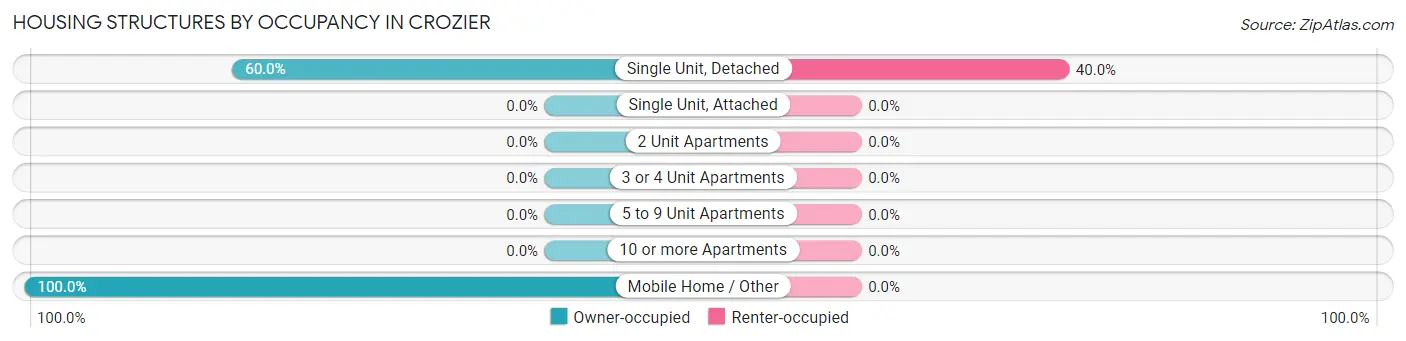
| Structure Type | Owner-occupied | Renter-occupied |
| Single Unit, Detached | 6 (60.0%) | 4 (40.0%) |
| Single Unit, Attached | 0 (0.0%) | 0 (0.0%) |
| 2 Unit Apartments | 0 (0.0%) | 0 (0.0%) |
| 3 or 4 Unit Apartments | 0 (0.0%) | 0 (0.0%) |
| 5 to 9 Unit Apartments | 0 (0.0%) | 0 (0.0%) |
| 10 or more Apartments | 0 (0.0%) | 0 (0.0%) |
| Mobile Home / Other | 6 (100.0%) | 0 (0.0%) |
| Total | 12 (75.0%) | 4 (25.0%) |
Housing Structures by Number of Rooms in Crozier
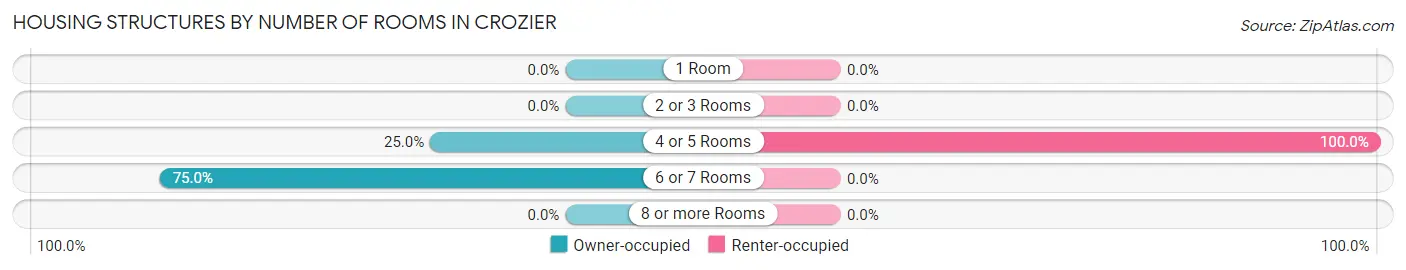
| Number of Rooms | Owner-occupied | Renter-occupied |
| 1 Room | 0 (0.0%) | 0 (0.0%) |
| 2 or 3 Rooms | 0 (0.0%) | 0 (0.0%) |
| 4 or 5 Rooms | 3 (25.0%) | 4 (100.0%) |
| 6 or 7 Rooms | 9 (75.0%) | 0 (0.0%) |
| 8 or more Rooms | 0 (0.0%) | 0 (0.0%) |
| Total | 12 (100.0%) | 4 (100.0%) |
Housing Structure by Heating Type in Crozier
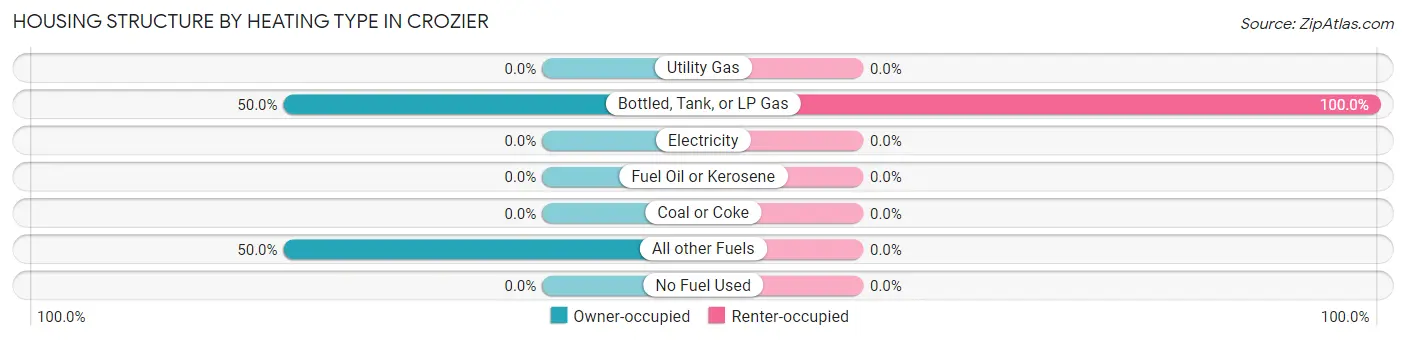
| Heating Type | Owner-occupied | Renter-occupied |
| Utility Gas | 0 (0.0%) | 0 (0.0%) |
| Bottled, Tank, or LP Gas | 6 (50.0%) | 4 (100.0%) |
| Electricity | 0 (0.0%) | 0 (0.0%) |
| Fuel Oil or Kerosene | 0 (0.0%) | 0 (0.0%) |
| Coal or Coke | 0 (0.0%) | 0 (0.0%) |
| All other Fuels | 6 (50.0%) | 0 (0.0%) |
| No Fuel Used | 0 (0.0%) | 0 (0.0%) |
| Total | 12 (100.0%) | 4 (100.0%) |
Household Vehicle Usage in Crozier
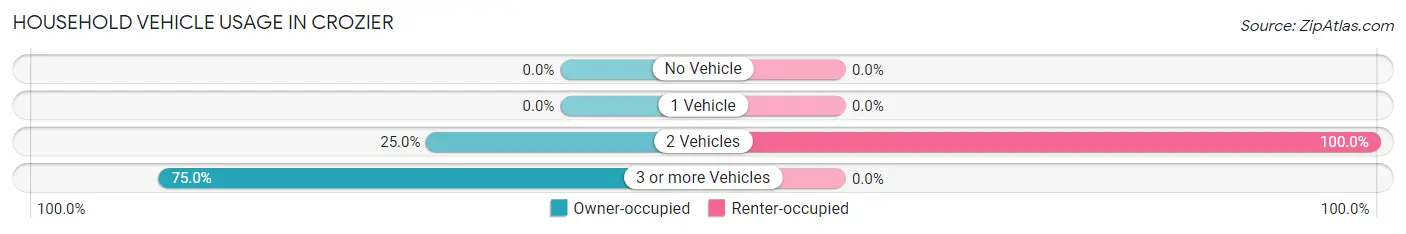
| Vehicles per Household | Owner-occupied | Renter-occupied |
| No Vehicle | 0 (0.0%) | 0 (0.0%) |
| 1 Vehicle | 0 (0.0%) | 0 (0.0%) |
| 2 Vehicles | 3 (25.0%) | 4 (100.0%) |
| 3 or more Vehicles | 9 (75.0%) | 0 (0.0%) |
| Total | 12 (100.0%) | 4 (100.0%) |
Real Estate & Mortgages in Crozier
Real Estate and Mortgage Overview in Crozier
| Characteristic | Without Mortgage | With Mortgage |
| Housing Units | 3 | 9 |
| Median Property Value | - | - |
| Median Household Income | - | - |
| Monthly Housing Costs | - | - |
| Real Estate Taxes | - | - |
Property Value by Mortgage Status in Crozier
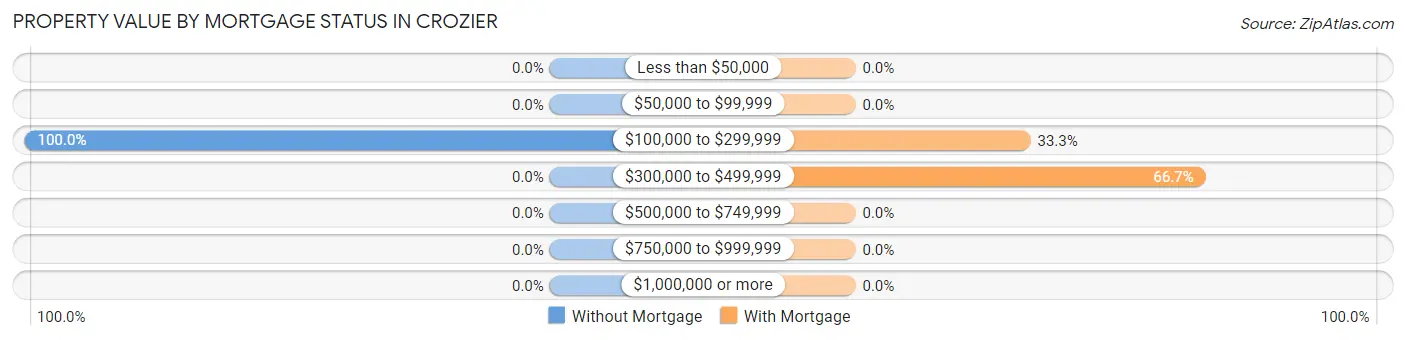
| Property Value | Without Mortgage | With Mortgage |
| Less than $50,000 | 0 (0.0%) | 0 (0.0%) |
| $50,000 to $99,999 | 0 (0.0%) | 0 (0.0%) |
| $100,000 to $299,999 | 3 (100.0%) | 3 (33.3%) |
| $300,000 to $499,999 | 0 (0.0%) | 6 (66.7%) |
| $500,000 to $749,999 | 0 (0.0%) | 0 (0.0%) |
| $750,000 to $999,999 | 0 (0.0%) | 0 (0.0%) |
| $1,000,000 or more | 0 (0.0%) | 0 (0.0%) |
| Total | 3 (100.0%) | 9 (100.0%) |
Household Income by Mortgage Status in Crozier
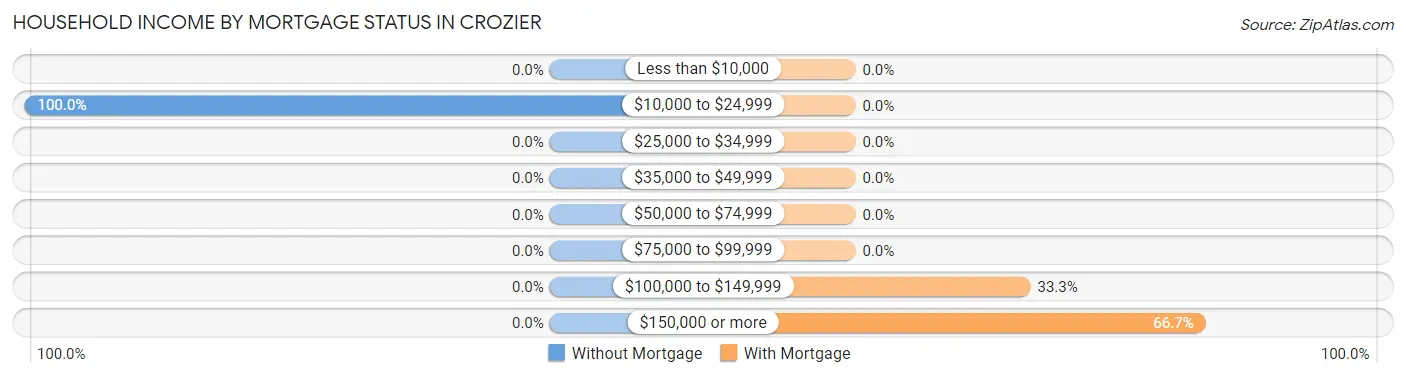
| Household Income | Without Mortgage | With Mortgage |
| Less than $10,000 | 0 (0.0%) | 0 (0.0%) |
| $10,000 to $24,999 | 3 (100.0%) | 0 (0.0%) |
| $25,000 to $34,999 | 0 (0.0%) | 0 (0.0%) |
| $35,000 to $49,999 | 0 (0.0%) | 0 (0.0%) |
| $50,000 to $74,999 | 0 (0.0%) | 0 (0.0%) |
| $75,000 to $99,999 | 0 (0.0%) | 0 (0.0%) |
| $100,000 to $149,999 | 0 (0.0%) | 3 (33.3%) |
| $150,000 or more | 0 (0.0%) | 6 (66.7%) |
| Total | 3 (100.0%) | 9 (100.0%) |
Property Value to Household Income Ratio in Crozier
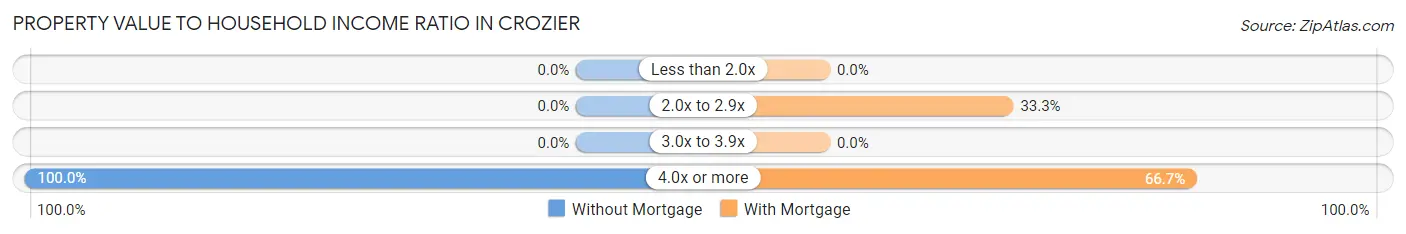
| Value-to-Income Ratio | Without Mortgage | With Mortgage |
| Less than 2.0x | 0 (0.0%) | 0 (0.0%) |
| 2.0x to 2.9x | 0 (0.0%) | 3 (33.3%) |
| 3.0x to 3.9x | 0 (0.0%) | 0 (0.0%) |
| 4.0x or more | 3 (100.0%) | 6 (66.7%) |
| Total | 3 (100.0%) | 9 (100.0%) |
Real Estate Taxes by Mortgage Status in Crozier
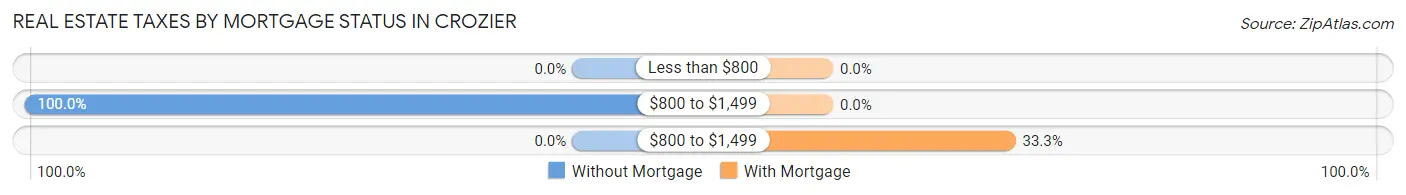
| Property Taxes | Without Mortgage | With Mortgage |
| Less than $800 | 0 (0.0%) | 0 (0.0%) |
| $800 to $1,499 | 3 (100.0%) | 0 (0.0%) |
| $800 to $1,499 | 0 (0.0%) | 3 (33.3%) |
| Total | 3 (100.0%) | 9 (100.0%) |
Health & Disability in Crozier
Health Insurance Coverage by Age in Crozier
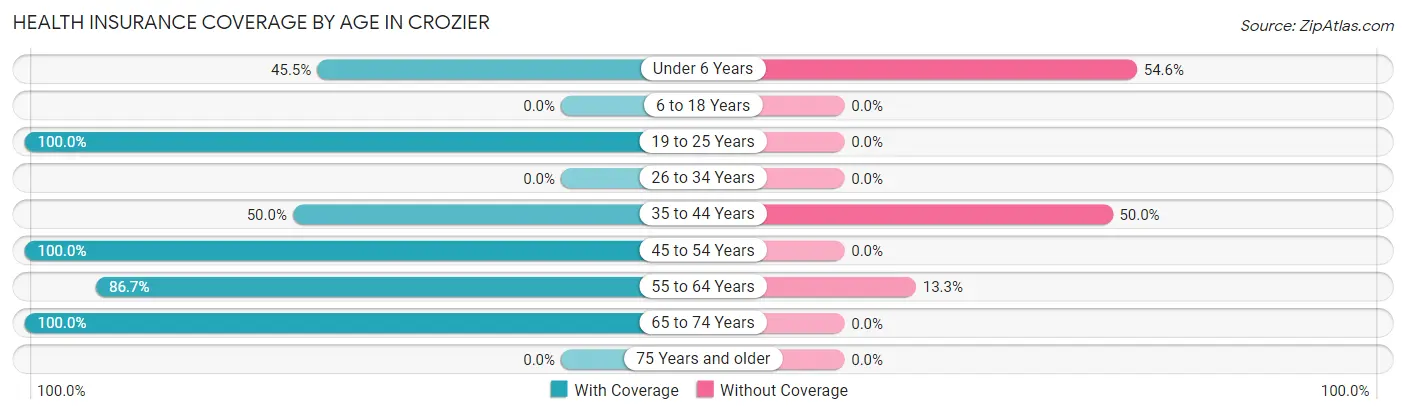
| Age Bracket | With Coverage | Without Coverage |
| Under 6 Years | 5 (45.5%) | 6 (54.5%) |
| 6 to 18 Years | 0 (0.0%) | 0 (0.0%) |
| 19 to 25 Years | 1 (100.0%) | 0 (0.0%) |
| 26 to 34 Years | 0 (0.0%) | 0 (0.0%) |
| 35 to 44 Years | 1 (50.0%) | 1 (50.0%) |
| 45 to 54 Years | 8 (100.0%) | 0 (0.0%) |
| 55 to 64 Years | 39 (86.7%) | 6 (13.3%) |
| 65 to 74 Years | 6 (100.0%) | 0 (0.0%) |
| 75 Years and older | 0 (0.0%) | 0 (0.0%) |
| Total | 60 (82.2%) | 13 (17.8%) |
Health Insurance Coverage by Citizenship Status in Crozier
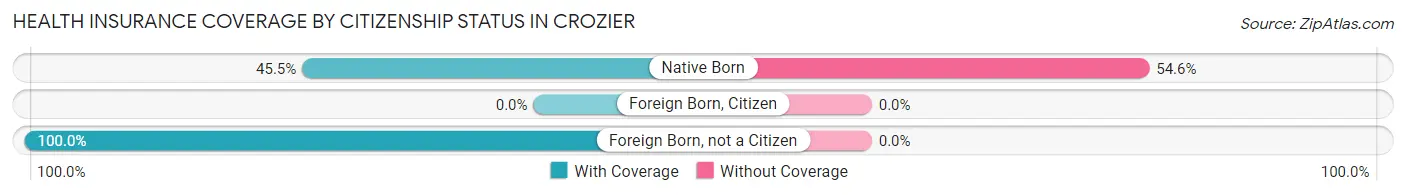
| Citizenship Status | With Coverage | Without Coverage |
| Native Born | 5 (45.5%) | 6 (54.5%) |
| Foreign Born, Citizen | 0 (0.0%) | 0 (0.0%) |
| Foreign Born, not a Citizen | 1 (100.0%) | 0 (0.0%) |
Health Insurance Coverage by Household Income in Crozier
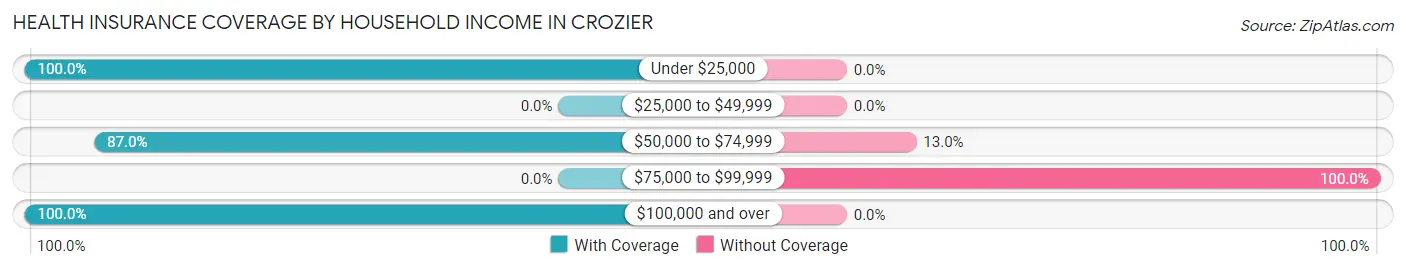
| Household Income | With Coverage | Without Coverage |
| Under $25,000 | 3 (100.0%) | 0 (0.0%) |
| $25,000 to $49,999 | 0 (0.0%) | 0 (0.0%) |
| $50,000 to $74,999 | 40 (87.0%) | 6 (13.0%) |
| $75,000 to $99,999 | 0 (0.0%) | 6 (100.0%) |
| $100,000 and over | 13 (100.0%) | 0 (0.0%) |
Public vs Private Health Insurance Coverage by Age in Crozier
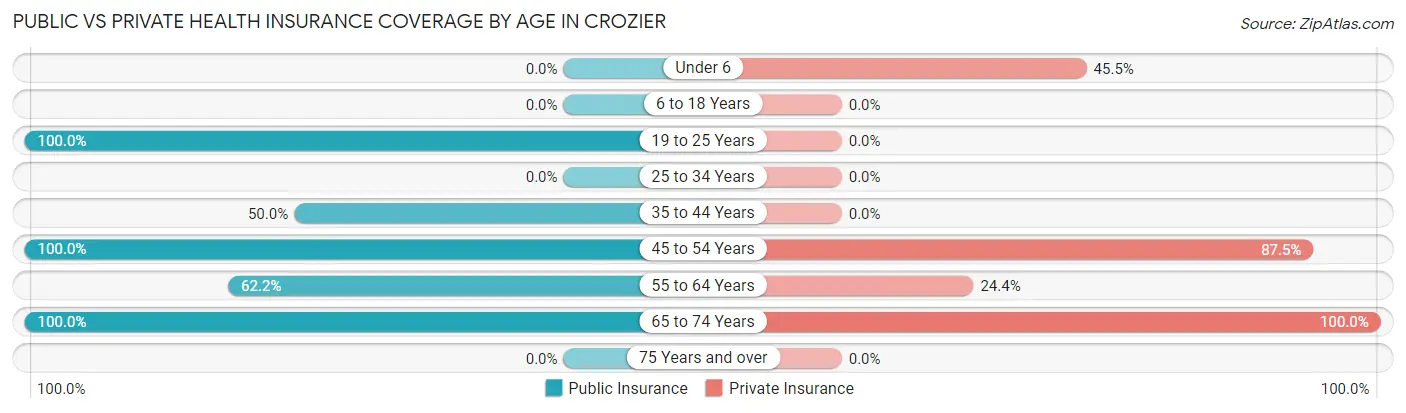
| Age Bracket | Public Insurance | Private Insurance |
| Under 6 | 0 (0.0%) | 5 (45.5%) |
| 6 to 18 Years | 0 (0.0%) | 0 (0.0%) |
| 19 to 25 Years | 1 (100.0%) | 0 (0.0%) |
| 25 to 34 Years | 0 (0.0%) | 0 (0.0%) |
| 35 to 44 Years | 1 (50.0%) | 0 (0.0%) |
| 45 to 54 Years | 8 (100.0%) | 7 (87.5%) |
| 55 to 64 Years | 28 (62.2%) | 11 (24.4%) |
| 65 to 74 Years | 6 (100.0%) | 6 (100.0%) |
| 75 Years and over | 0 (0.0%) | 0 (0.0%) |
| Total | 44 (60.3%) | 29 (39.7%) |
Disability Status by Sex by Age in Crozier
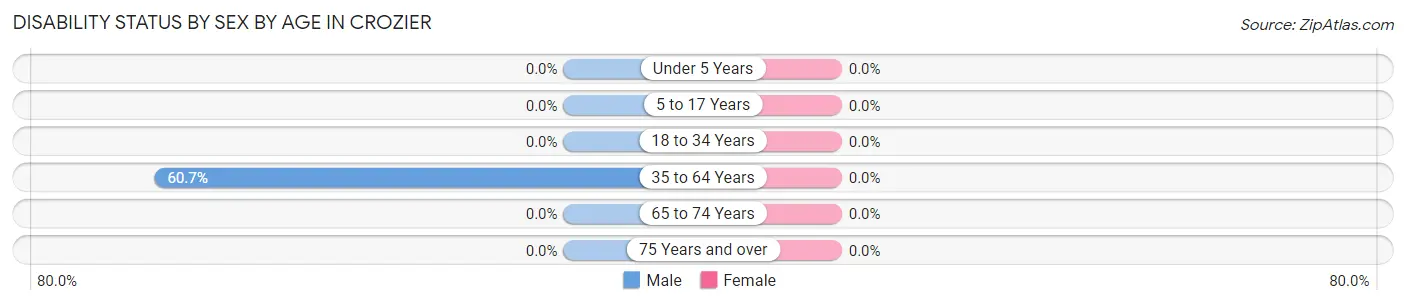
| Age Bracket | Male | Female |
| Under 5 Years | 0 (0.0%) | 0 (0.0%) |
| 5 to 17 Years | 0 (0.0%) | 0 (0.0%) |
| 18 to 34 Years | 0 (0.0%) | 0 (0.0%) |
| 35 to 64 Years | 17 (60.7%) | 0 (0.0%) |
| 65 to 74 Years | 0 (0.0%) | 0 (0.0%) |
| 75 Years and over | 0 (0.0%) | 0 (0.0%) |
Disability Class by Sex by Age in Crozier
Disability Class: Hearing Difficulty
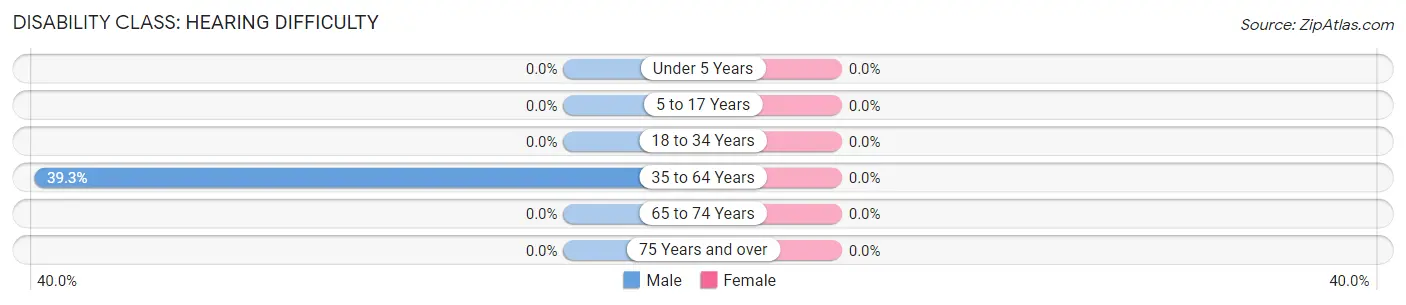
| Age Bracket | Male | Female |
| Under 5 Years | 0 (0.0%) | 0 (0.0%) |
| 5 to 17 Years | 0 (0.0%) | 0 (0.0%) |
| 18 to 34 Years | 0 (0.0%) | 0 (0.0%) |
| 35 to 64 Years | 11 (39.3%) | 0 (0.0%) |
| 65 to 74 Years | 0 (0.0%) | 0 (0.0%) |
| 75 Years and over | 0 (0.0%) | 0 (0.0%) |
Disability Class: Vision Difficulty
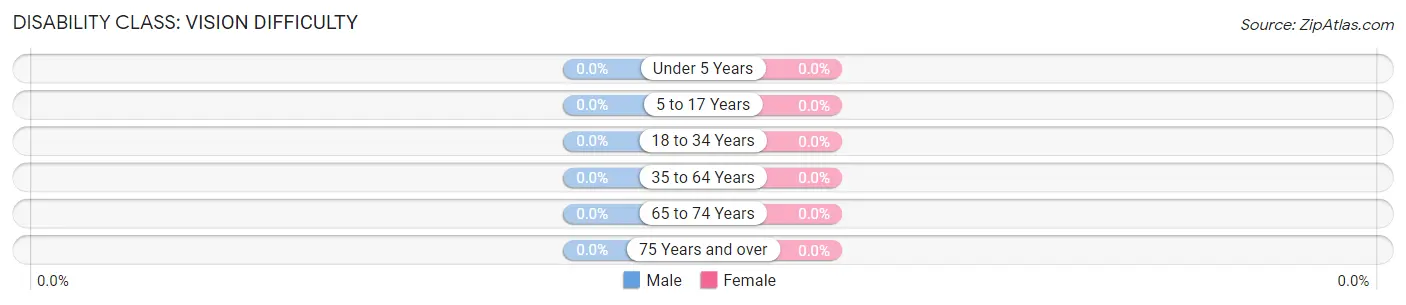
| Age Bracket | Male | Female |
| Under 5 Years | 0 (0.0%) | 0 (0.0%) |
| 5 to 17 Years | 0 (0.0%) | 0 (0.0%) |
| 18 to 34 Years | 0 (0.0%) | 0 (0.0%) |
| 35 to 64 Years | 0 (0.0%) | 0 (0.0%) |
| 65 to 74 Years | 0 (0.0%) | 0 (0.0%) |
| 75 Years and over | 0 (0.0%) | 0 (0.0%) |
Disability Class: Cognitive Difficulty
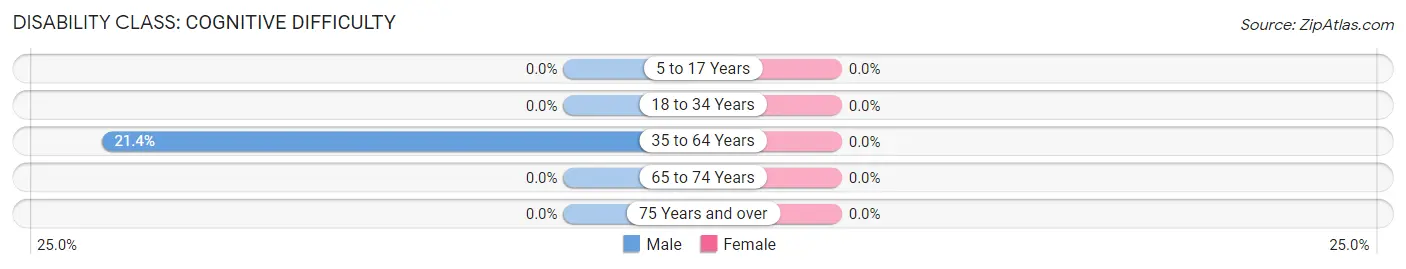
| Age Bracket | Male | Female |
| 5 to 17 Years | 0 (0.0%) | 0 (0.0%) |
| 18 to 34 Years | 0 (0.0%) | 0 (0.0%) |
| 35 to 64 Years | 6 (21.4%) | 0 (0.0%) |
| 65 to 74 Years | 0 (0.0%) | 0 (0.0%) |
| 75 Years and over | 0 (0.0%) | 0 (0.0%) |
Disability Class: Ambulatory Difficulty
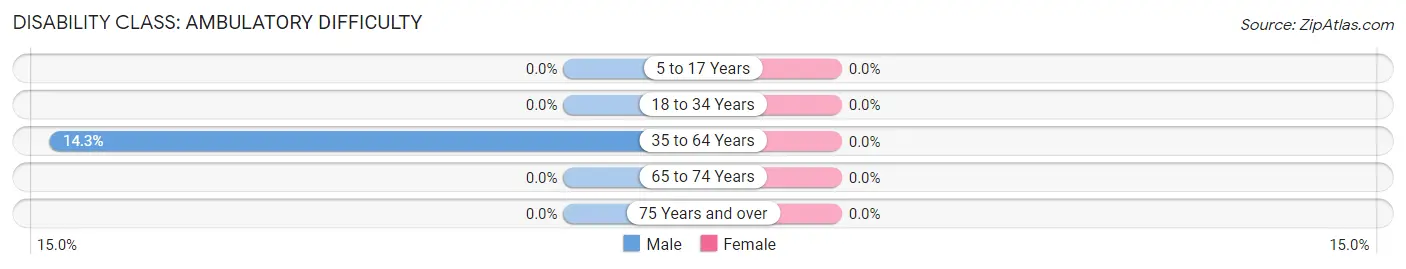
| Age Bracket | Male | Female |
| 5 to 17 Years | 0 (0.0%) | 0 (0.0%) |
| 18 to 34 Years | 0 (0.0%) | 0 (0.0%) |
| 35 to 64 Years | 4 (14.3%) | 0 (0.0%) |
| 65 to 74 Years | 0 (0.0%) | 0 (0.0%) |
| 75 Years and over | 0 (0.0%) | 0 (0.0%) |
Disability Class: Self-Care Difficulty
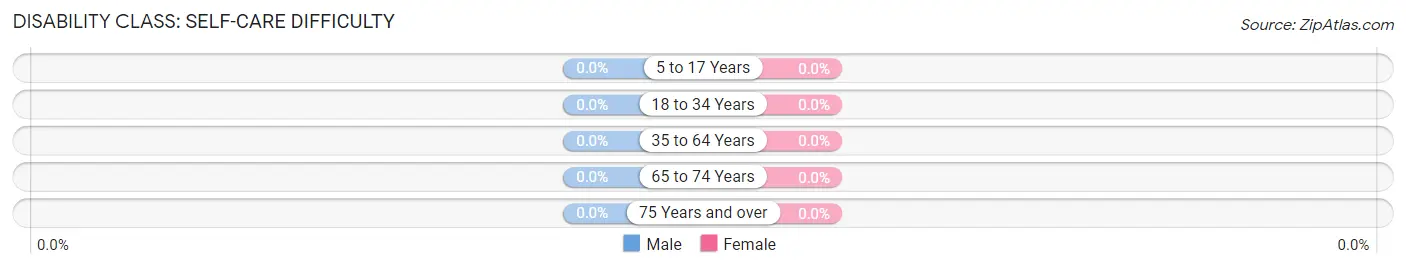
| Age Bracket | Male | Female |
| 5 to 17 Years | 0 (0.0%) | 0 (0.0%) |
| 18 to 34 Years | 0 (0.0%) | 0 (0.0%) |
| 35 to 64 Years | 0 (0.0%) | 0 (0.0%) |
| 65 to 74 Years | 0 (0.0%) | 0 (0.0%) |
| 75 Years and over | 0 (0.0%) | 0 (0.0%) |
Technology Access in Crozier
Computing Device Access in Crozier
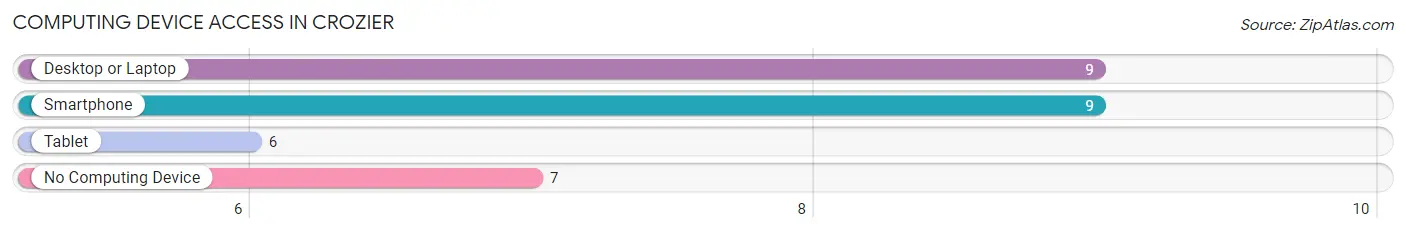
| Device Type | # Households | % Households |
| Desktop or Laptop | 9 | 56.2% |
| Smartphone | 9 | 56.2% |
| Tablet | 6 | 37.5% |
| No Computing Device | 7 | 43.8% |
| Total | 16 | 100.0% |
Internet Access in Crozier
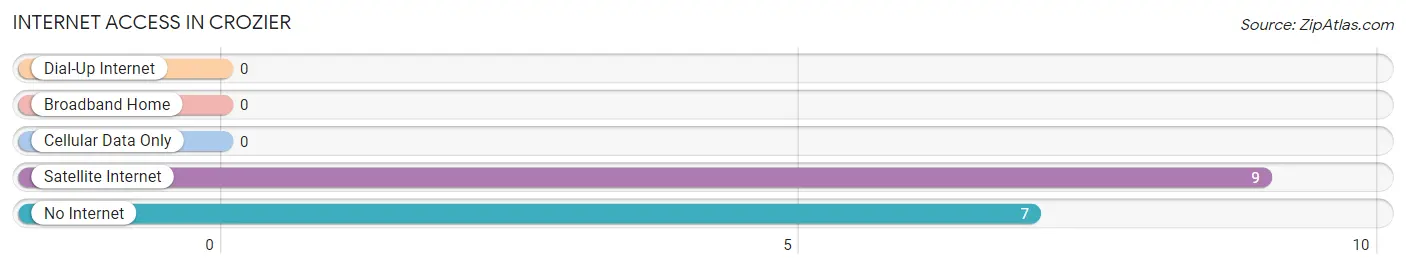
| Internet Type | # Households | % Households |
| Dial-Up Internet | 0 | 0.0% |
| Broadband Home | 0 | 0.0% |
| Cellular Data Only | 0 | 0.0% |
| Satellite Internet | 9 | 56.2% |
| No Internet | 7 | 43.8% |
| Total | 16 | 100.0% |
Crozier Summary
Crozier, Arizona is a small unincorporated community located in Yavapai County, Arizona. It is situated in the Verde Valley, approximately 20 miles south of Cottonwood and 25 miles north of Camp Verde. The population of Crozier is estimated to be around 200 people.
History
Crozier was founded in the late 1800s by a group of settlers from the Midwest. The settlers were looking for a place to settle and start a new life. The area was originally known as “Crozier’s Ranch” and was named after the first settler, John Crozier. The settlers built a small store, a post office, and a school. The town grew slowly but steadily over the years and by the early 1900s, it had become a thriving community.
Geography
Crozier is located in the Verde Valley, which is a large valley in central Arizona. The valley is surrounded by the Mogollon Rim to the north and the Bradshaw Mountains to the south. The Verde River runs through the valley and is a major source of water for the area. The climate in Crozier is semi-arid, with hot summers and mild winters. The average annual temperature is around 70 degrees Fahrenheit.
Economy
The economy of Crozier is largely based on agriculture. The area is known for its production of pecans, cotton, and alfalfa. There are also several small businesses in the area, including a gas station, a grocery store, and a few restaurants. The town also has a small airport, which is used for recreational flying.
Demographics
The population of Crozier is estimated to be around 200 people. The majority of the population is white, with a small percentage of African Americans, Hispanics, and Native Americans. The median household income is around $30,000, and the median age is around 40 years old.
Conclusion
Crozier, Arizona is a small unincorporated community located in Yavapai County, Arizona. It was founded in the late 1800s by a group of settlers from the Midwest and has grown slowly but steadily over the years. The economy of Crozier is largely based on agriculture, and the population is estimated to be around 200 people. The majority of the population is white, with a small percentage of African Americans, Hispanics, and Native Americans. The median household income is around $30,000, and the median age is around 40 years old.
Common Questions
What is Per Capita Income in Crozier?
Per Capita income in Crozier is $18,878.
What is the Median Household income in Crozier?
Median Household Income in Crozier is $78,333.
What is Income or Wage Gap in Crozier?
Income or Wage Gap in Crozier is 78.0%.
Women in Crozier earn 22.0 cents for every dollar earned by a man.
What is Inequality or Gini Index in Crozier?
Inequality or Gini Index in Crozier is 0.23.
What is the Total Population of Crozier?
Total Population of Crozier is 73.
What is the Total Male Population of Crozier?
Total Male Population of Crozier is 46.
What is the Total Female Population of Crozier?
Total Female Population of Crozier is 27.
What is the Ratio of Males per 100 Females in Crozier?
There are 170.37 Males per 100 Females in Crozier.
What is the Ratio of Females per 100 Males in Crozier?
There are 58.70 Females per 100 Males in Crozier.
What is the Median Population Age in Crozier?
Median Population Age in Crozier is 60.3 Years.
What is the Average Family Size in Crozier
Average Family Size in Crozier is 2.1 People.
What is the Average Household Size in Crozier
Average Household Size in Crozier is 4.2 People.
How Large is the Labor Force in Crozier?
There are 12 People in the Labor Forcein in Crozier.
What is the Percentage of People in the Labor Force in Crozier?
19.4% of People are in the Labor Force in Crozier.