Oxbow Estates, AZ Map & Demographics
Oxbow Estates Map
Oxbow Estates Overview
$38,381
PER CAPITA INCOME
$58,889
AVG FAMILY INCOME
$68,750
AVG HOUSEHOLD INCOME
0.15
INEQUALITY / GINI INDEX
110
TOTAL POPULATION
72
MALE POPULATION
38
FEMALE POPULATION
189.47
MALES / 100 FEMALES
52.78
FEMALES / 100 MALES
61.4
MEDIAN AGE
2.1
AVG FAMILY SIZE
2.3
AVG HOUSEHOLD SIZE
66
LABOR FORCE [ PEOPLE ]
60.0%
PERCENT IN LABOR FORCE
Income in Oxbow Estates
Income Overview in Oxbow Estates
Per Capita Income in Oxbow Estates is $38,381, while median incomes of families and households are $58,889 and $68,750 respectively.
| Characteristic | Number | Measure |
| Per Capita Income | 110 | $38,381 |
| Median Family Income | 40 | $58,889 |
| Mean Family Income | 40 | $71,863 |
| Median Household Income | 48 | $68,750 |
| Mean Household Income | 48 | $83,288 |
| Income Deficit | 40 | $0 |
| Wage / Income Gap (%) | 110 | 0.00% |
| Wage / Income Gap ($) | 110 | 100.00¢ per $1 |
| Gini / Inequality Index | 110 | 0.15 |
Earnings by Sex in Oxbow Estates
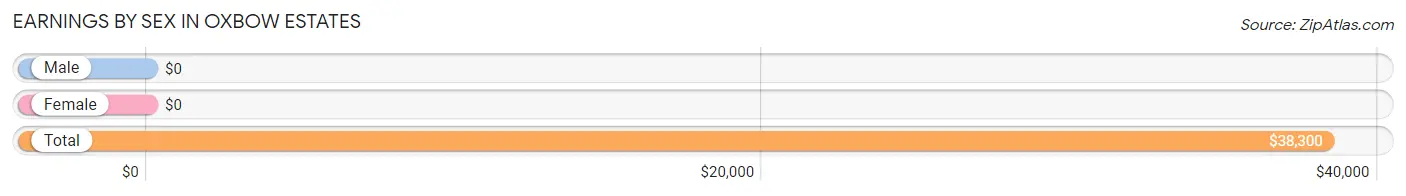
| Sex | Number | Average Earnings |
| Male | 41 (62.1%) | $0 |
| Female | 25 (37.9%) | $0 |
| Total | 66 (100.0%) | $38,300 |
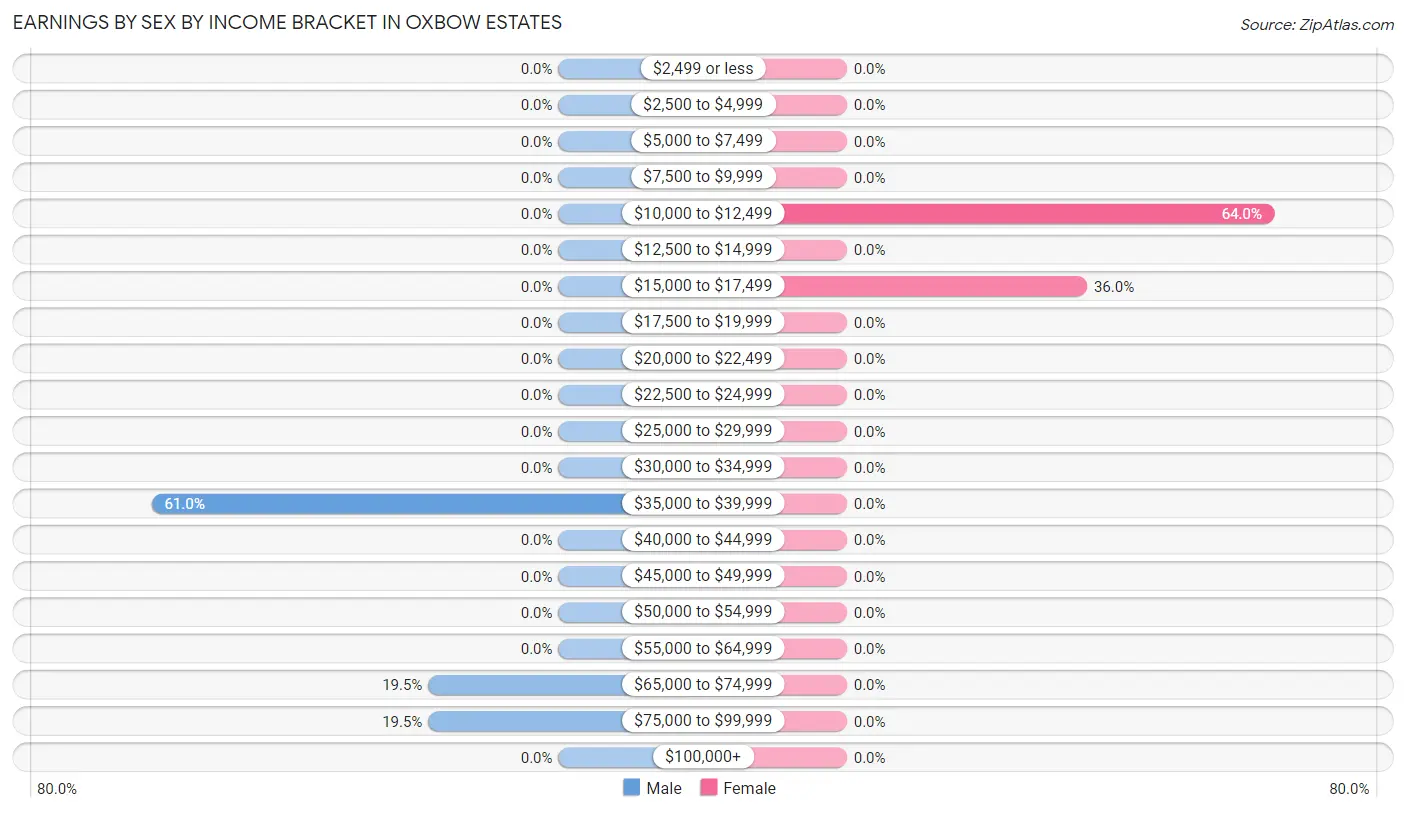
Earnings by Sex by Income Bracket in Oxbow Estates
The most common earnings brackets in Oxbow Estates are $35,000 to $39,999 for men (25 | 61.0%) and $10,000 to $12,499 for women (16 | 64.0%).
| Income | Male | Female |
| $2,499 or less | 0 (0.0%) | 0 (0.0%) |
| $2,500 to $4,999 | 0 (0.0%) | 0 (0.0%) |
| $5,000 to $7,499 | 0 (0.0%) | 0 (0.0%) |
| $7,500 to $9,999 | 0 (0.0%) | 0 (0.0%) |
| $10,000 to $12,499 | 0 (0.0%) | 16 (64.0%) |
| $12,500 to $14,999 | 0 (0.0%) | 0 (0.0%) |
| $15,000 to $17,499 | 0 (0.0%) | 9 (36.0%) |
| $17,500 to $19,999 | 0 (0.0%) | 0 (0.0%) |
| $20,000 to $22,499 | 0 (0.0%) | 0 (0.0%) |
| $22,500 to $24,999 | 0 (0.0%) | 0 (0.0%) |
| $25,000 to $29,999 | 0 (0.0%) | 0 (0.0%) |
| $30,000 to $34,999 | 0 (0.0%) | 0 (0.0%) |
| $35,000 to $39,999 | 25 (61.0%) | 0 (0.0%) |
| $40,000 to $44,999 | 0 (0.0%) | 0 (0.0%) |
| $45,000 to $49,999 | 0 (0.0%) | 0 (0.0%) |
| $50,000 to $54,999 | 0 (0.0%) | 0 (0.0%) |
| $55,000 to $64,999 | 0 (0.0%) | 0 (0.0%) |
| $65,000 to $74,999 | 8 (19.5%) | 0 (0.0%) |
| $75,000 to $99,999 | 8 (19.5%) | 0 (0.0%) |
| $100,000+ | 0 (0.0%) | 0 (0.0%) |
| Total | 41 (100.0%) | 25 (100.0%) |
Earnings by Sex by Educational Attainment in Oxbow Estates
| Educational Attainment | Male Income | Female Income |
| Less than High School | - | - |
| High School Diploma | - | - |
| College or Associate's Degree | - | - |
| Bachelor's Degree | - | - |
| Graduate Degree | - | - |
| Total | - | - |
Family Income in Oxbow Estates
Family Income Brackets in Oxbow Estates
According to the Oxbow Estates family income data, there are 31 families falling into the $50,000 to $74,999 income range, which is the most common income bracket and makes up 77.5% of all families.
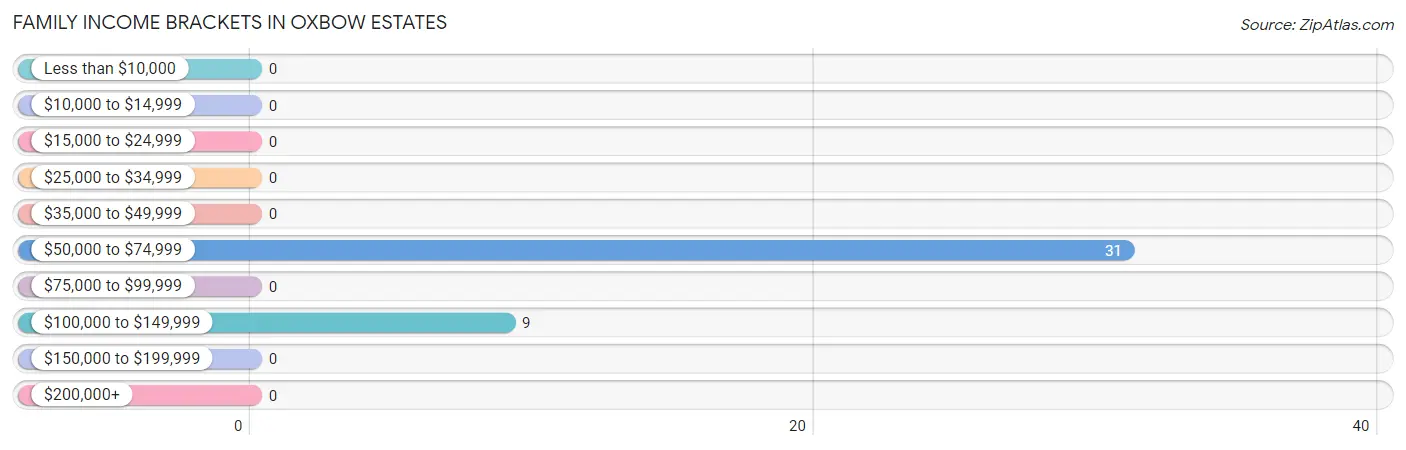
| Income Bracket | # Families | % Families |
| Less than $10,000 | 0 | 0.0% |
| $10,000 to $14,999 | 0 | 0.0% |
| $15,000 to $24,999 | 0 | 0.0% |
| $25,000 to $34,999 | 0 | 0.0% |
| $35,000 to $49,999 | 0 | 0.0% |
| $50,000 to $74,999 | 31 | 77.5% |
| $75,000 to $99,999 | 0 | 0.0% |
| $100,000 to $149,999 | 9 | 22.5% |
| $150,000 to $199,999 | 0 | 0.0% |
| $200,000+ | 0 | 0.0% |
Family Income by Famaliy Size in Oxbow Estates
2-person families (40 | 100.0%) account for the highest median family income in Oxbow Estates with $58,889 per family, while 2-person families (40 | 100.0%) have the highest median income of $29,444 per family member.
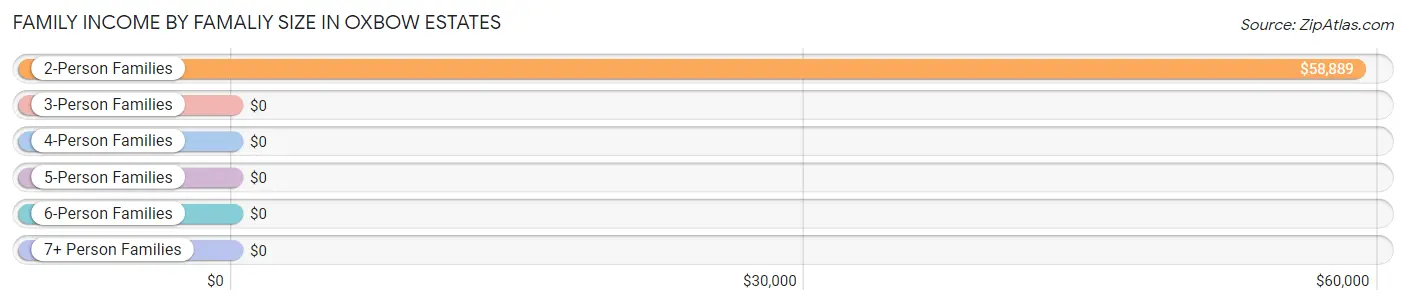
| Income Bracket | # Families | Median Income |
| 2-Person Families | 40 (100.0%) | $58,889 |
| 3-Person Families | 0 (0.0%) | $0 |
| 4-Person Families | 0 (0.0%) | $0 |
| 5-Person Families | 0 (0.0%) | $0 |
| 6-Person Families | 0 (0.0%) | $0 |
| 7+ Person Families | 0 (0.0%) | $0 |
| Total | 40 (100.0%) | $58,889 |
Family Income by Number of Earners in Oxbow Estates
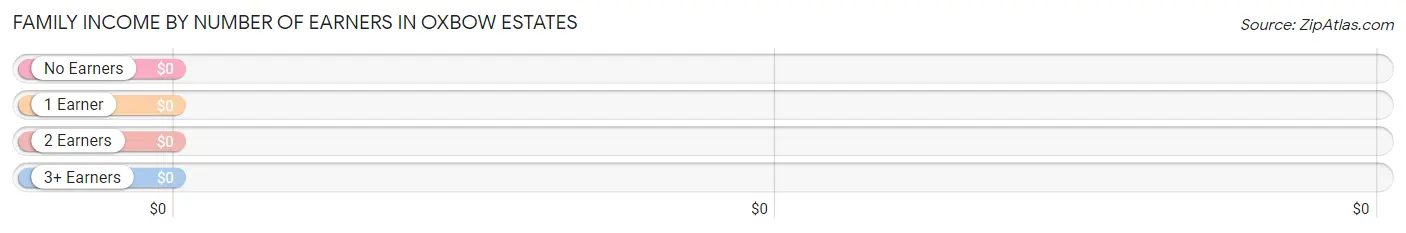
| Number of Earners | # Families | Median Income |
| No Earners | 16 (40.0%) | $0 |
| 1 Earner | 15 (37.5%) | $0 |
| 2 Earners | 9 (22.5%) | $0 |
| 3+ Earners | 0 (0.0%) | $0 |
| Total | 40 (100.0%) | $58,889 |
Household Income in Oxbow Estates
Household Income Brackets in Oxbow Estates
With 31 households falling in the category, the $50,000 to $74,999 income range is the most frequent in Oxbow Estates, accounting for 64.6% of all households.
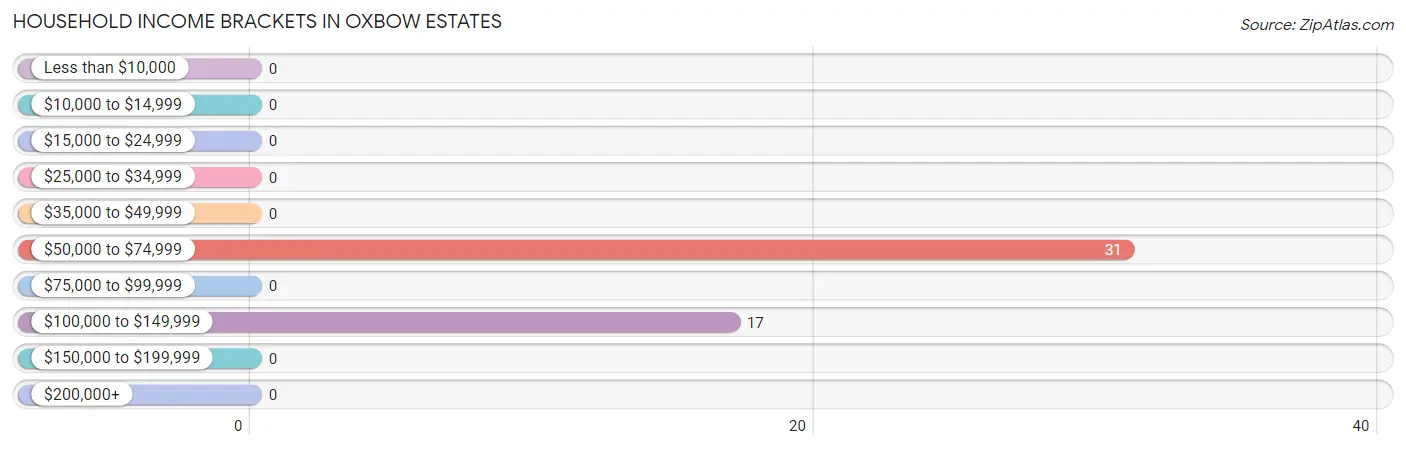
| Income Bracket | # Households | % Households |
| Less than $10,000 | 0 | 0.0% |
| $10,000 to $14,999 | 0 | 0.0% |
| $15,000 to $24,999 | 0 | 0.0% |
| $25,000 to $34,999 | 0 | 0.0% |
| $35,000 to $49,999 | 0 | 0.0% |
| $50,000 to $74,999 | 31 | 64.6% |
| $75,000 to $99,999 | 0 | 0.0% |
| $100,000 to $149,999 | 17 | 35.4% |
| $150,000 to $199,999 | 0 | 0.0% |
| $200,000+ | 0 | 0.0% |
Household Income by Householder Age in Oxbow Estates
The median household income in Oxbow Estates is $68,750, with the highest median household income of $66,083 found in the 65+ years age bracket for the primary householder. A total of 31 households (64.6%) fall into this category.
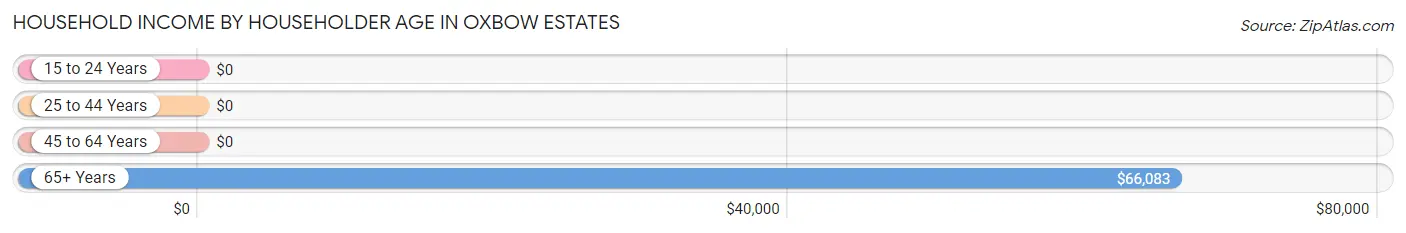
| Income Bracket | # Households | Median Income |
| 15 to 24 Years | 0 (0.0%) | $0 |
| 25 to 44 Years | 0 (0.0%) | $0 |
| 45 to 64 Years | 17 (35.4%) | $0 |
| 65+ Years | 31 (64.6%) | $66,083 |
| Total | 48 (100.0%) | $68,750 |
Poverty in Oxbow Estates
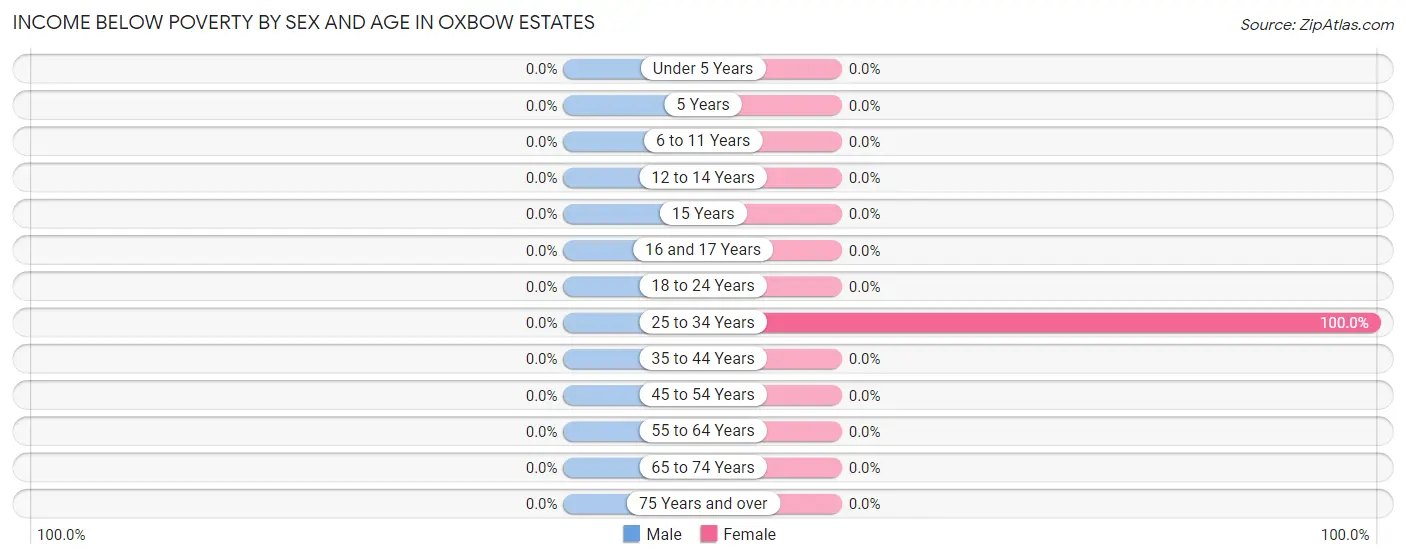
Income Below Poverty by Sex and Age in Oxbow Estates
| Age Bracket | Male | Female |
| Under 5 Years | 0 (0.0%) | 0 (0.0%) |
| 5 Years | 0 (0.0%) | 0 (0.0%) |
| 6 to 11 Years | 0 (0.0%) | 0 (0.0%) |
| 12 to 14 Years | 0 (0.0%) | 0 (0.0%) |
| 15 Years | 0 (0.0%) | 0 (0.0%) |
| 16 and 17 Years | 0 (0.0%) | 0 (0.0%) |
| 18 to 24 Years | 0 (0.0%) | 0 (0.0%) |
| 25 to 34 Years | 0 (0.0%) | 16 (100.0%) |
| 35 to 44 Years | 0 (0.0%) | 0 (0.0%) |
| 45 to 54 Years | 0 (0.0%) | 0 (0.0%) |
| 55 to 64 Years | 0 (0.0%) | 0 (0.0%) |
| 65 to 74 Years | 0 (0.0%) | 0 (0.0%) |
| 75 Years and over | 0 (0.0%) | 0 (0.0%) |
| Total | 0 (0.0%) | 16 (42.1%) |
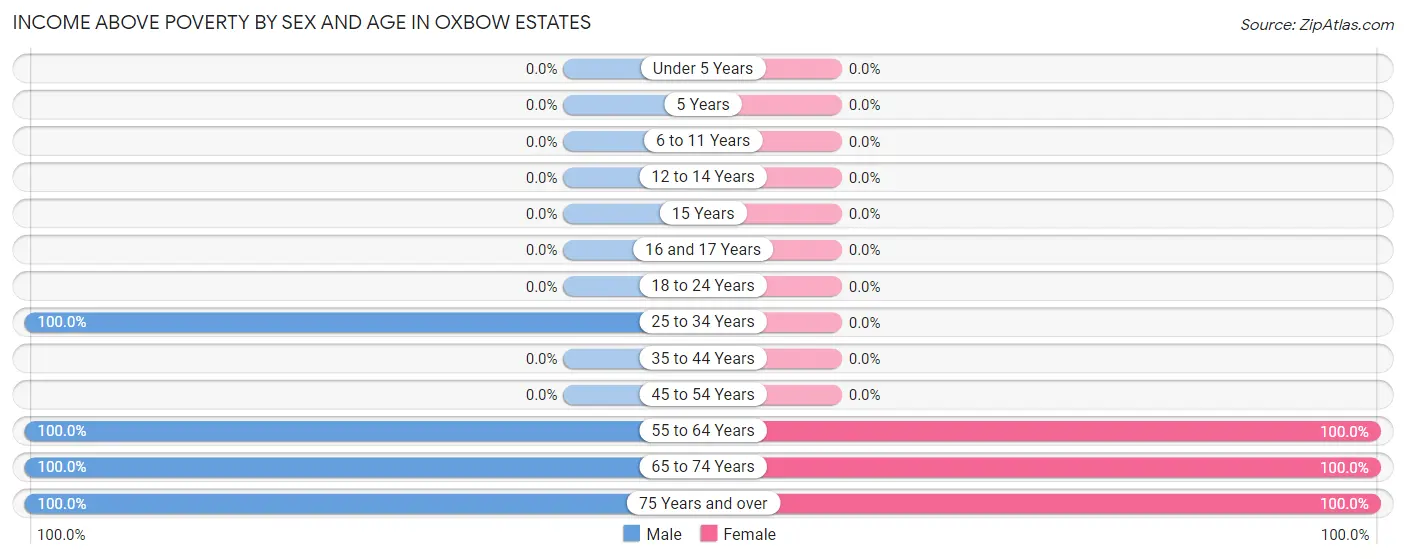
Income Above Poverty by Sex and Age in Oxbow Estates
According to the poverty statistics in Oxbow Estates, males aged 25 to 34 years and females aged 55 to 64 years are the age groups that are most secure financially, with 100.0% of males and 100.0% of females in these age groups living above the poverty line.
| Age Bracket | Male | Female |
| Under 5 Years | 0 (0.0%) | 0 (0.0%) |
| 5 Years | 0 (0.0%) | 0 (0.0%) |
| 6 to 11 Years | 0 (0.0%) | 0 (0.0%) |
| 12 to 14 Years | 0 (0.0%) | 0 (0.0%) |
| 15 Years | 0 (0.0%) | 0 (0.0%) |
| 16 and 17 Years | 0 (0.0%) | 0 (0.0%) |
| 18 to 24 Years | 0 (0.0%) | 0 (0.0%) |
| 25 to 34 Years | 25 (100.0%) | 0 (0.0%) |
| 35 to 44 Years | 0 (0.0%) | 0 (0.0%) |
| 45 to 54 Years | 0 (0.0%) | 0 (0.0%) |
| 55 to 64 Years | 16 (100.0%) | 9 (100.0%) |
| 65 to 74 Years | 22 (100.0%) | 6 (100.0%) |
| 75 Years and over | 9 (100.0%) | 7 (100.0%) |
| Total | 72 (100.0%) | 22 (57.9%) |
Income Below Poverty Among Married-Couple Families in Oxbow Estates
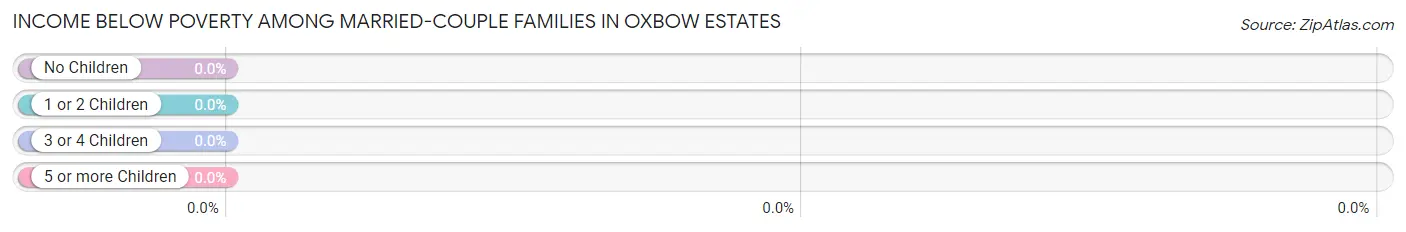
| Children | Above Poverty | Below Poverty |
| No Children | 25 (100.0%) | 0 (0.0%) |
| 1 or 2 Children | 0 (0.0%) | 0 (0.0%) |
| 3 or 4 Children | 0 (0.0%) | 0 (0.0%) |
| 5 or more Children | 0 (0.0%) | 0 (0.0%) |
| Total | 25 (100.0%) | 0 (0.0%) |
Income Below Poverty Among Single-Parent Households in Oxbow Estates
| Children | Single Father | Single Mother |
| No Children | 0 (0.0%) | 0 (0.0%) |
| 1 or 2 Children | 0 (0.0%) | 0 (0.0%) |
| 3 or 4 Children | 0 (0.0%) | 0 (0.0%) |
| 5 or more Children | 0 (0.0%) | 0 (0.0%) |
| Total | 0 (0.0%) | 0 (0.0%) |
Income Below Poverty Among Married-Couple vs Single-Parent Households in Oxbow Estates
| Children | Married-Couple Families | Single-Parent Households |
| No Children | 0 (0.0%) | 0 (0.0%) |
| 1 or 2 Children | 0 (0.0%) | 0 (0.0%) |
| 3 or 4 Children | 0 (0.0%) | 0 (0.0%) |
| 5 or more Children | 0 (0.0%) | 0 (0.0%) |
| Total | 0 (0.0%) | 0 (0.0%) |
Race in Oxbow Estates
The most populous races in Oxbow Estates are White / Caucasian (103 | 93.6%), Hispanic or Latino (7 | 6.4%), and Two or more Races (7 | 6.4%).
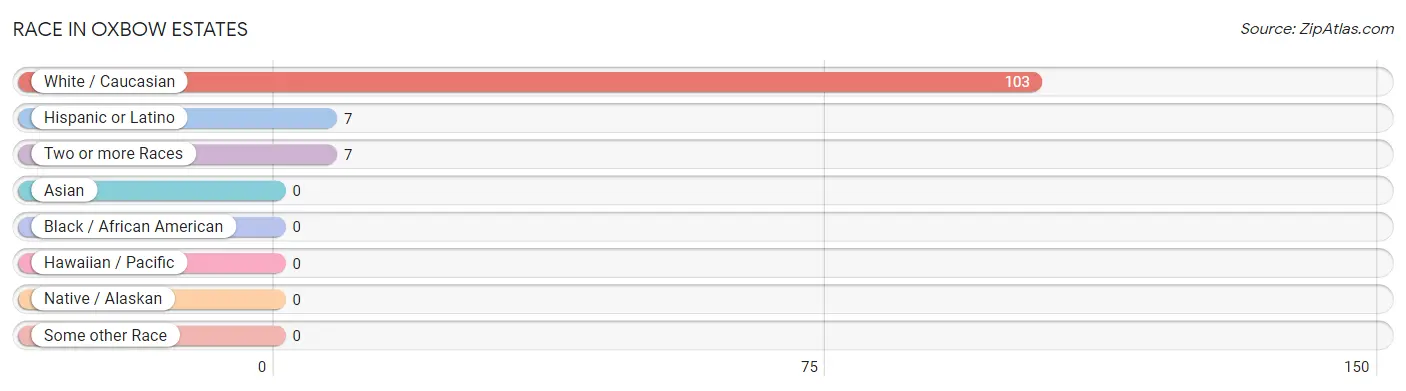
| Race | # Population | % Population |
| Asian | 0 | 0.0% |
| Black / African American | 0 | 0.0% |
| Hawaiian / Pacific | 0 | 0.0% |
| Hispanic or Latino | 7 | 6.4% |
| Native / Alaskan | 0 | 0.0% |
| White / Caucasian | 103 | 93.6% |
| Two or more Races | 7 | 6.4% |
| Some other Race | 0 | 0.0% |
| Total | 110 | 100.0% |
Ancestry in Oxbow Estates
The most populous ancestries reported in Oxbow Estates are French Canadian (49 | 44.6%), German (9 | 8.2%), American (8 | 7.3%), Spanish (7 | 6.4%), and English (6 | 5.4%), together accounting for 71.8% of all Oxbow Estates residents.
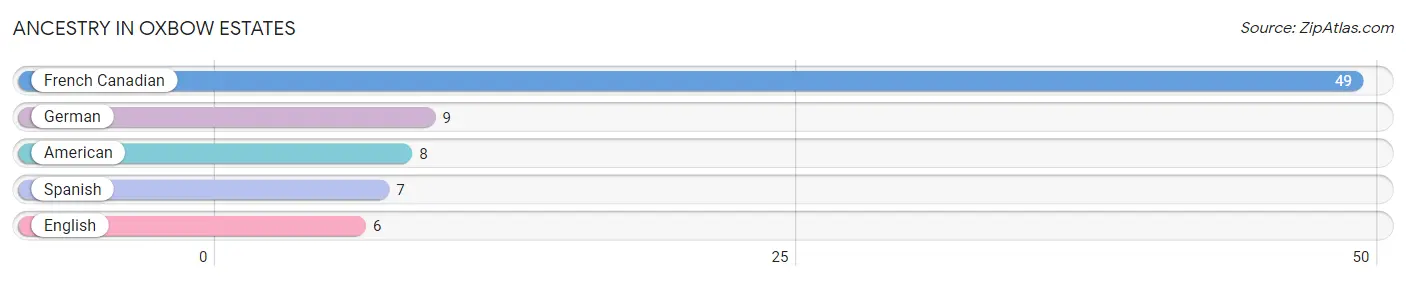
| Ancestry | # Population | % Population |
| American | 8 | 7.3% |
| English | 6 | 5.4% |
| French Canadian | 49 | 44.6% |
| German | 9 | 8.2% |
| Spanish | 7 | 6.4% | View All 5 Rows |
Immigrants in Oxbow Estates

| Immigration Origin | # Population | % Population | View All 0 Rows |
Sex and Age in Oxbow Estates
Sex and Age in Oxbow Estates
The most populous age groups in Oxbow Estates are 30 to 34 Years (25 | 34.7%) for men and 25 to 29 Years (16 | 42.1%) for women.
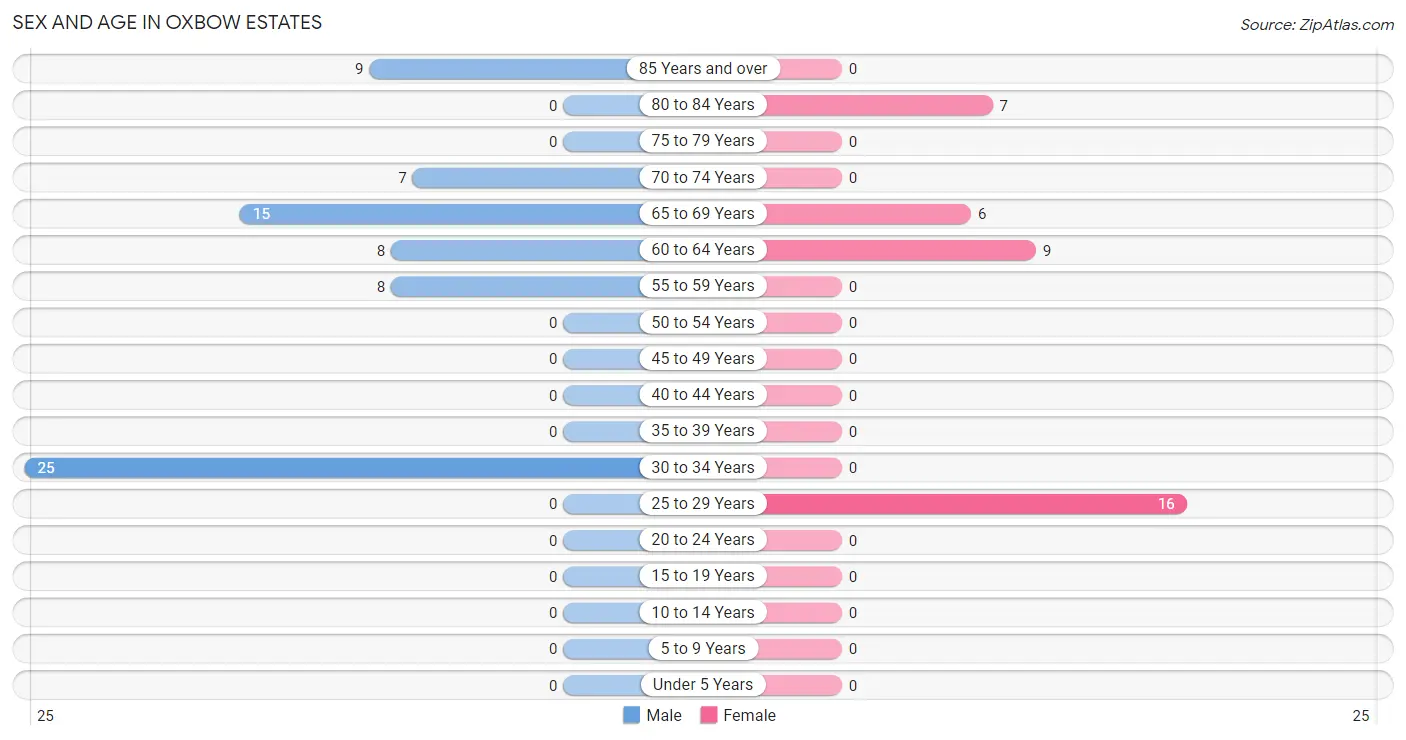
| Age Bracket | Male | Female |
| Under 5 Years | 0 (0.0%) | 0 (0.0%) |
| 5 to 9 Years | 0 (0.0%) | 0 (0.0%) |
| 10 to 14 Years | 0 (0.0%) | 0 (0.0%) |
| 15 to 19 Years | 0 (0.0%) | 0 (0.0%) |
| 20 to 24 Years | 0 (0.0%) | 0 (0.0%) |
| 25 to 29 Years | 0 (0.0%) | 16 (42.1%) |
| 30 to 34 Years | 25 (34.7%) | 0 (0.0%) |
| 35 to 39 Years | 0 (0.0%) | 0 (0.0%) |
| 40 to 44 Years | 0 (0.0%) | 0 (0.0%) |
| 45 to 49 Years | 0 (0.0%) | 0 (0.0%) |
| 50 to 54 Years | 0 (0.0%) | 0 (0.0%) |
| 55 to 59 Years | 8 (11.1%) | 0 (0.0%) |
| 60 to 64 Years | 8 (11.1%) | 9 (23.7%) |
| 65 to 69 Years | 15 (20.8%) | 6 (15.8%) |
| 70 to 74 Years | 7 (9.7%) | 0 (0.0%) |
| 75 to 79 Years | 0 (0.0%) | 0 (0.0%) |
| 80 to 84 Years | 0 (0.0%) | 7 (18.4%) |
| 85 Years and over | 9 (12.5%) | 0 (0.0%) |
| Total | 72 (100.0%) | 38 (100.0%) |
Families and Households in Oxbow Estates
Median Family Size in Oxbow Estates
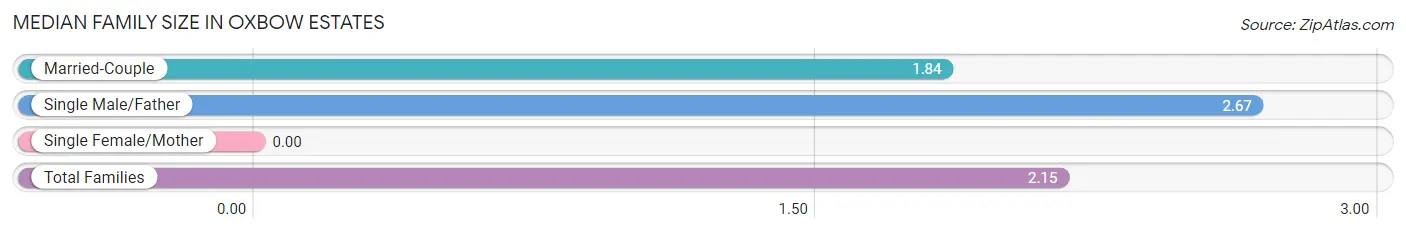
| Family Type | # Families | Family Size |
| Married-Couple | 25 (62.5%) | 1.84 |
| Single Male/Father | 15 (37.5%) | 2.67 |
| Single Female/Mother | 0 (0.0%) | - |
| Total Families | 40 (100.0%) | 2.15 |
Median Household Size in Oxbow Estates
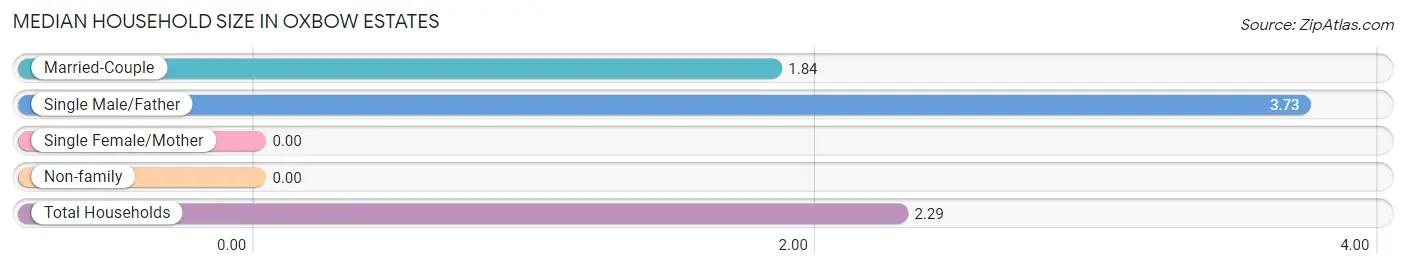
| Household Type | # Households | Household Size |
| Married-Couple | 25 (52.1%) | 1.84 |
| Single Male/Father | 15 (31.2%) | 3.73 |
| Single Female/Mother | 0 (0.0%) | - |
| Non-family | 8 (16.7%) | - |
| Total Households | 48 (100.0%) | 2.29 |
Household Size by Marriage Status in Oxbow Estates
Out of a total of 48 households in Oxbow Estates, 40 (83.3%) are family households, while 8 (16.7%) are nonfamily households. The most numerous type of family households are 2-person households, comprising 25, and the most common type of nonfamily households are 1-person households, comprising 8.
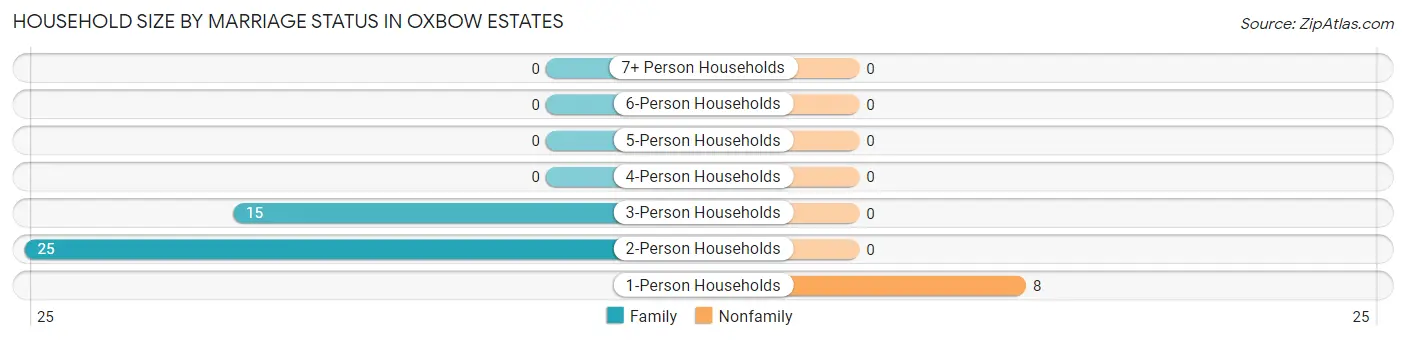
| Household Size | Family Households | Nonfamily Households |
| 1-Person Households | - | 8 (16.7%) |
| 2-Person Households | 25 (52.1%) | 0 (0.0%) |
| 3-Person Households | 15 (31.2%) | 0 (0.0%) |
| 4-Person Households | 0 (0.0%) | 0 (0.0%) |
| 5-Person Households | 0 (0.0%) | 0 (0.0%) |
| 6-Person Households | 0 (0.0%) | 0 (0.0%) |
| 7+ Person Households | 0 (0.0%) | 0 (0.0%) |
| Total | 40 (83.3%) | 8 (16.7%) |
Female Fertility in Oxbow Estates
Fertility by Age in Oxbow Estates
| Age Bracket | Women with Births | Births / 1,000 Women |
| 15 to 19 years | 0 (0.0%) | 0.0 |
| 20 to 34 years | 0 (0.0%) | 0.0 |
| 35 to 50 years | 0 (0.0%) | 0.0 |
| Total | 0 (0.0%) | 0.0 |
Fertility by Age by Marriage Status in Oxbow Estates
| Age Bracket | Married | Unmarried |
| 15 to 19 years | 0 (0.0%) | 0 (0.0%) |
| 20 to 34 years | 0 (0.0%) | 0 (0.0%) |
| 35 to 50 years | 0 (0.0%) | 0 (0.0%) |
| Total | 0 (0.0%) | 0 (0.0%) |
Fertility by Education in Oxbow Estates
| Educational Attainment | Women with Births | Births / 1,000 Women |
| Less than High School | 0 (0.0%) | 0.0 |
| High School Diploma | 0 (0.0%) | 0.0 |
| College or Associate's Degree | 0 (0.0%) | 0.0 |
| Bachelor's Degree | 0 (0.0%) | 0.0 |
| Graduate Degree | 0 (0.0%) | 0.0 |
| Total | 0 (0.0%) | 0.0 |
Fertility by Education by Marriage Status in Oxbow Estates
| Educational Attainment | Married | Unmarried |
| Less than High School | 0 (0.0%) | 0 (0.0%) |
| High School Diploma | 0 (0.0%) | 0 (0.0%) |
| College or Associate's Degree | 0 (0.0%) | 0 (0.0%) |
| Bachelor's Degree | 0 (0.0%) | 0 (0.0%) |
| Graduate Degree | 0 (0.0%) | 0 (0.0%) |
| Total | 0 (0.0%) | 0 (0.0%) |
Employment Characteristics in Oxbow Estates
Employment by Class of Employer in Oxbow Estates
Among the 66 employed individuals in Oxbow Estates, private company employees (49 | 74.2%), and self-employed (incorporated) (17 | 25.8%) make up the most common classes of employment.
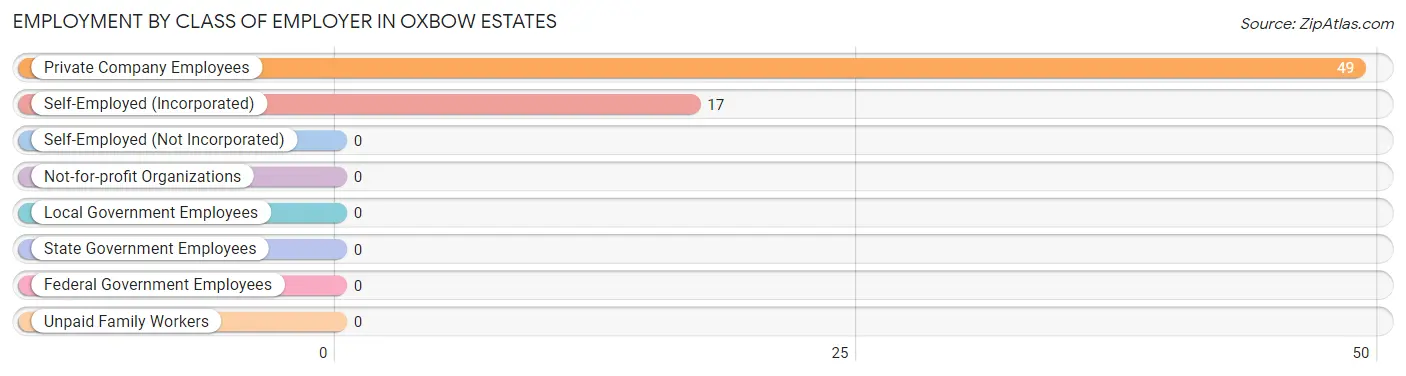
| Employer Class | # Employees | % Employees |
| Private Company Employees | 49 | 74.2% |
| Self-Employed (Incorporated) | 17 | 25.8% |
| Self-Employed (Not Incorporated) | 0 | 0.0% |
| Not-for-profit Organizations | 0 | 0.0% |
| Local Government Employees | 0 | 0.0% |
| State Government Employees | 0 | 0.0% |
| Federal Government Employees | 0 | 0.0% |
| Unpaid Family Workers | 0 | 0.0% |
| Total | 66 | 100.0% |
Employment Status by Age in Oxbow Estates
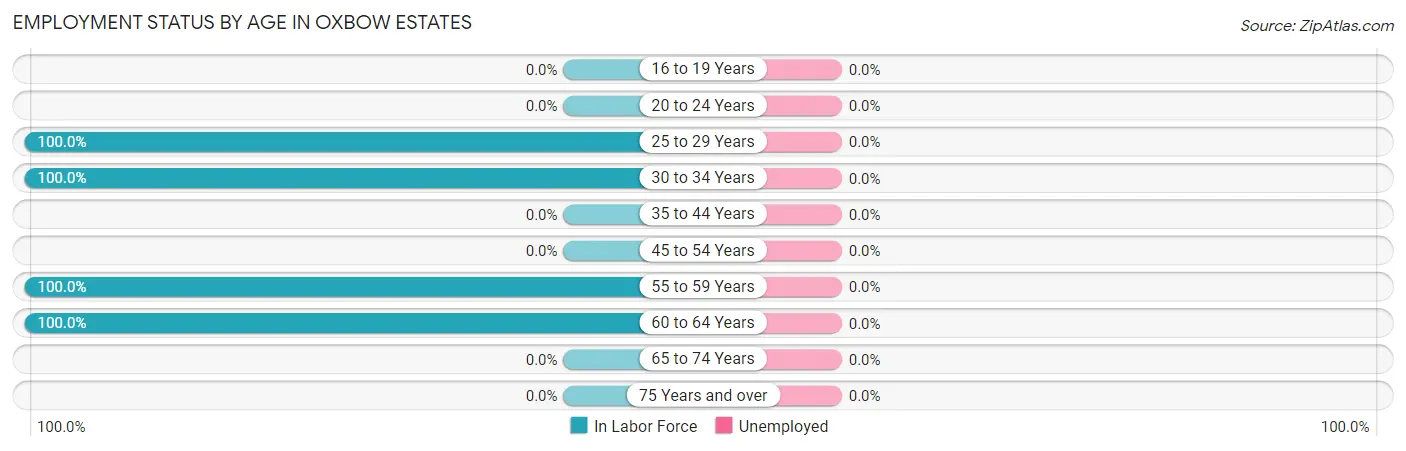
| Age Bracket | In Labor Force | Unemployed |
| 16 to 19 Years | 0 (0.0%) | 0 (0.0%) |
| 20 to 24 Years | 0 (0.0%) | 0 (0.0%) |
| 25 to 29 Years | 16 (100.0%) | 0 (0.0%) |
| 30 to 34 Years | 25 (100.0%) | 0 (0.0%) |
| 35 to 44 Years | 0 (0.0%) | 0 (0.0%) |
| 45 to 54 Years | 0 (0.0%) | 0 (0.0%) |
| 55 to 59 Years | 8 (100.0%) | 0 (0.0%) |
| 60 to 64 Years | 17 (100.0%) | 0 (0.0%) |
| 65 to 74 Years | 0 (0.0%) | 0 (0.0%) |
| 75 Years and over | 0 (0.0%) | 0 (0.0%) |
| Total | 66 (60.0%) | 0 (0.0%) |
Employment Status by Educational Attainment in Oxbow Estates
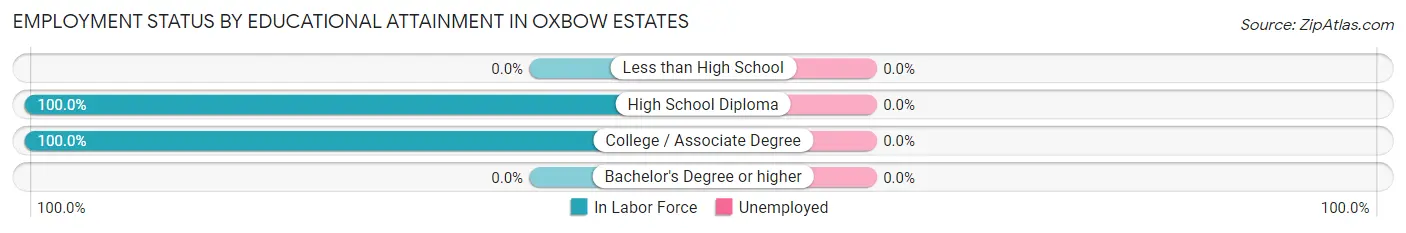
| Educational Attainment | In Labor Force | Unemployed |
| Less than High School | 0 (0.0%) | 0 (0.0%) |
| High School Diploma | 50 (100.0%) | 0 (0.0%) |
| College / Associate Degree | 16 (100.0%) | 0 (0.0%) |
| Bachelor's Degree or higher | 0 (0.0%) | 0 (0.0%) |
| Total | 66 (100.0%) | 0 (0.0%) |
Employment Occupations by Sex in Oxbow Estates
Management, Business, Science and Arts Occupations
The most common Management, Business, Science and Arts occupations in Oxbow Estates are , and Health Diagnosing & Treating (8 | 12.1%).
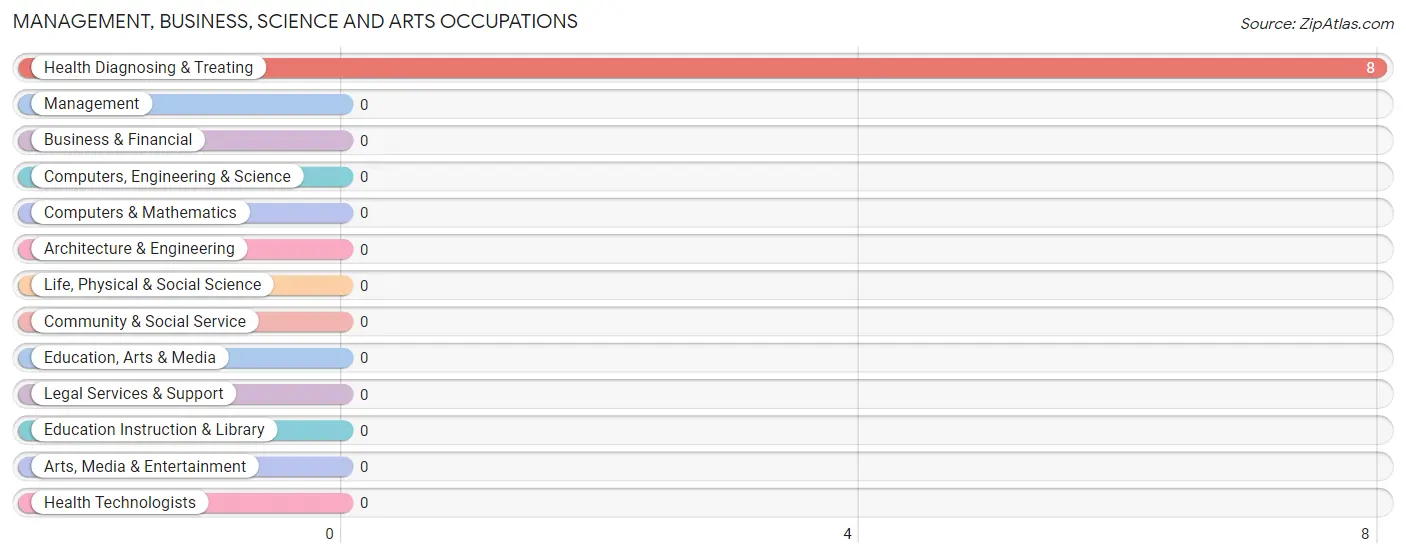
Management, Business, Science and Arts Occupations by Sex
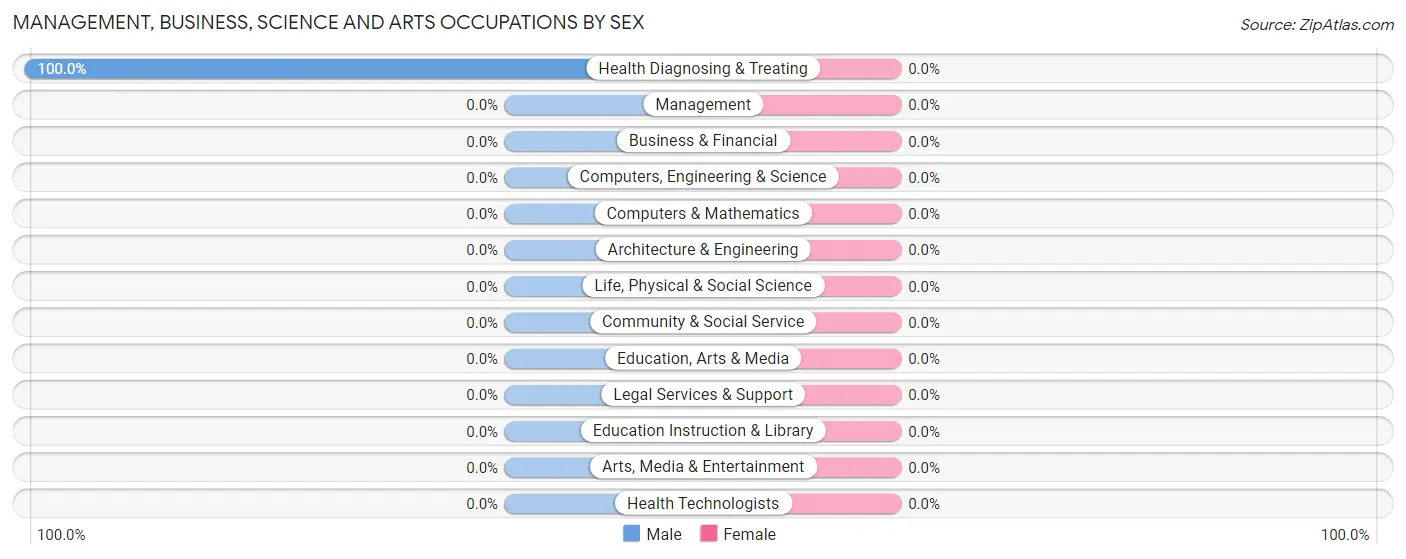
| Occupation | Male | Female |
| Management | 0 (0.0%) | 0 (0.0%) |
| Business & Financial | 0 (0.0%) | 0 (0.0%) |
| Computers, Engineering & Science | 0 (0.0%) | 0 (0.0%) |
| Computers & Mathematics | 0 (0.0%) | 0 (0.0%) |
| Architecture & Engineering | 0 (0.0%) | 0 (0.0%) |
| Life, Physical & Social Science | 0 (0.0%) | 0 (0.0%) |
| Community & Social Service | 0 (0.0%) | 0 (0.0%) |
| Education, Arts & Media | 0 (0.0%) | 0 (0.0%) |
| Legal Services & Support | 0 (0.0%) | 0 (0.0%) |
| Education Instruction & Library | 0 (0.0%) | 0 (0.0%) |
| Arts, Media & Entertainment | 0 (0.0%) | 0 (0.0%) |
| Health Diagnosing & Treating | 8 (100.0%) | 0 (0.0%) |
| Health Technologists | 0 (0.0%) | 0 (0.0%) |
| Total (Category) | 8 (100.0%) | 0 (0.0%) |
| Total (Overall) | 41 (62.1%) | 25 (37.9%) |
Services Occupations
Services Occupations by Sex
| Occupation | Male | Female |
| Healthcare Support | 0 (0.0%) | 0 (0.0%) |
| Security & Protection | 0 (0.0%) | 0 (0.0%) |
| Firefighting & Prevention | 0 (0.0%) | 0 (0.0%) |
| Law Enforcement | 0 (0.0%) | 0 (0.0%) |
| Food Preparation & Serving | 0 (0.0%) | 0 (0.0%) |
| Cleaning & Maintenance | 0 (0.0%) | 0 (0.0%) |
| Personal Care & Service | 0 (0.0%) | 0 (0.0%) |
| Total (Category) | 0 (0.0%) | 0 (0.0%) |
| Total (Overall) | 41 (62.1%) | 25 (37.9%) |
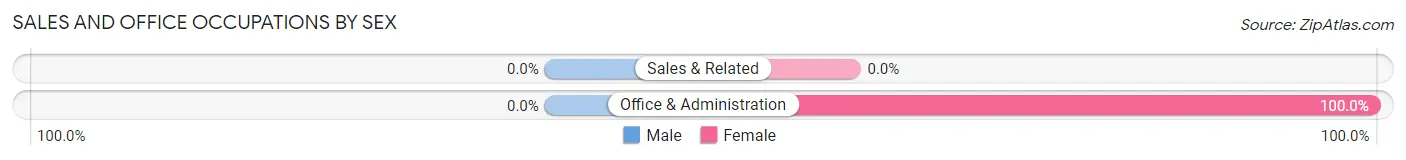
Sales and Office Occupations
The most common Sales and Office occupations in Oxbow Estates are , and Office & Administration (9 | 13.6%).
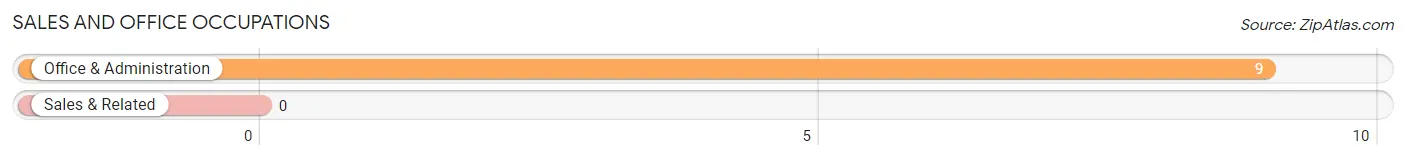
Sales and Office Occupations by Sex
| Occupation | Male | Female |
| Sales & Related | 0 (0.0%) | 0 (0.0%) |
| Office & Administration | 0 (0.0%) | 9 (100.0%) |
| Total (Category) | 0 (0.0%) | 9 (100.0%) |
| Total (Overall) | 41 (62.1%) | 25 (37.9%) |
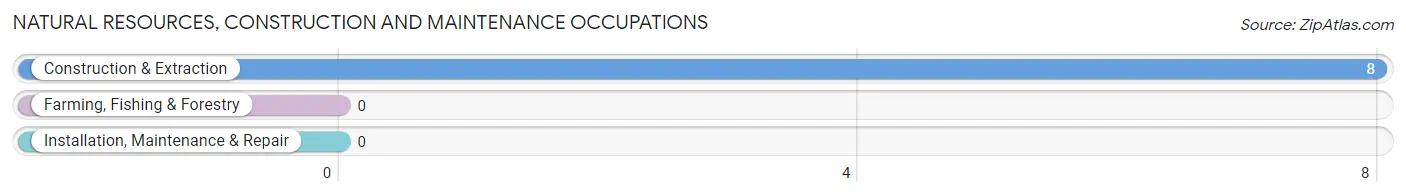
Natural Resources, Construction and Maintenance Occupations
The most common Natural Resources, Construction and Maintenance occupations in Oxbow Estates are , and Construction & Extraction (8 | 12.1%).
Natural Resources, Construction and Maintenance Occupations by Sex
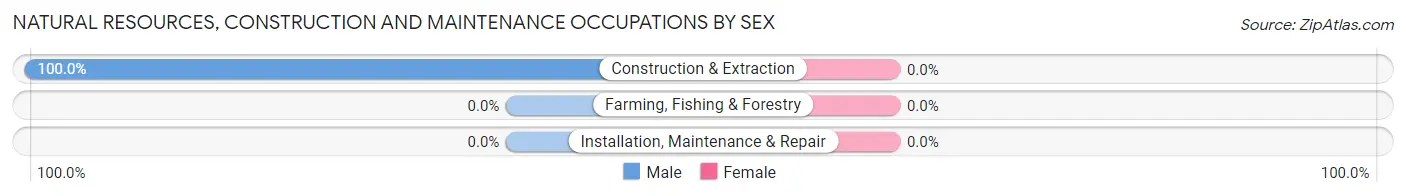
| Occupation | Male | Female |
| Farming, Fishing & Forestry | 0 (0.0%) | 0 (0.0%) |
| Construction & Extraction | 8 (100.0%) | 0 (0.0%) |
| Installation, Maintenance & Repair | 0 (0.0%) | 0 (0.0%) |
| Total (Category) | 8 (100.0%) | 0 (0.0%) |
| Total (Overall) | 41 (62.1%) | 25 (37.9%) |
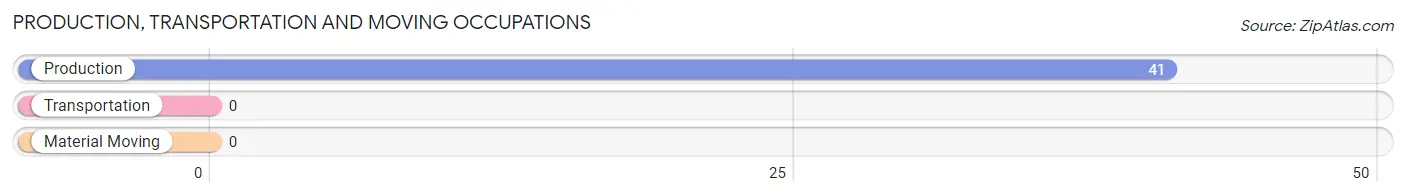
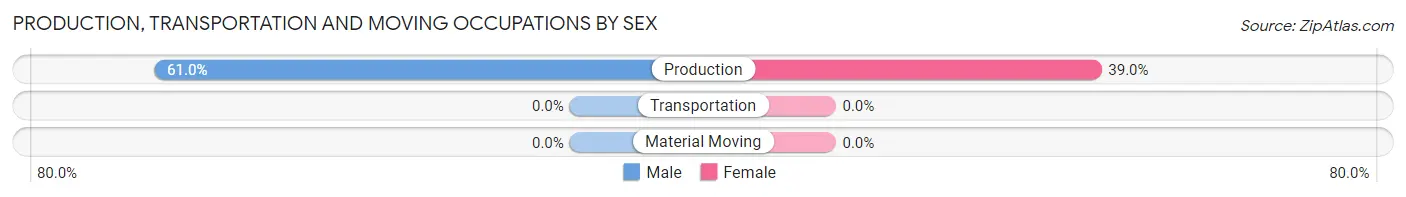
Production, Transportation and Moving Occupations
The most common Production, Transportation and Moving occupations in Oxbow Estates are , and Production (41 | 62.1%).
Production, Transportation and Moving Occupations by Sex
| Occupation | Male | Female |
| Production | 25 (61.0%) | 16 (39.0%) |
| Transportation | 0 (0.0%) | 0 (0.0%) |
| Material Moving | 0 (0.0%) | 0 (0.0%) |
| Total (Category) | 25 (61.0%) | 16 (39.0%) |
| Total (Overall) | 41 (62.1%) | 25 (37.9%) |
Employment Industries by Sex in Oxbow Estates
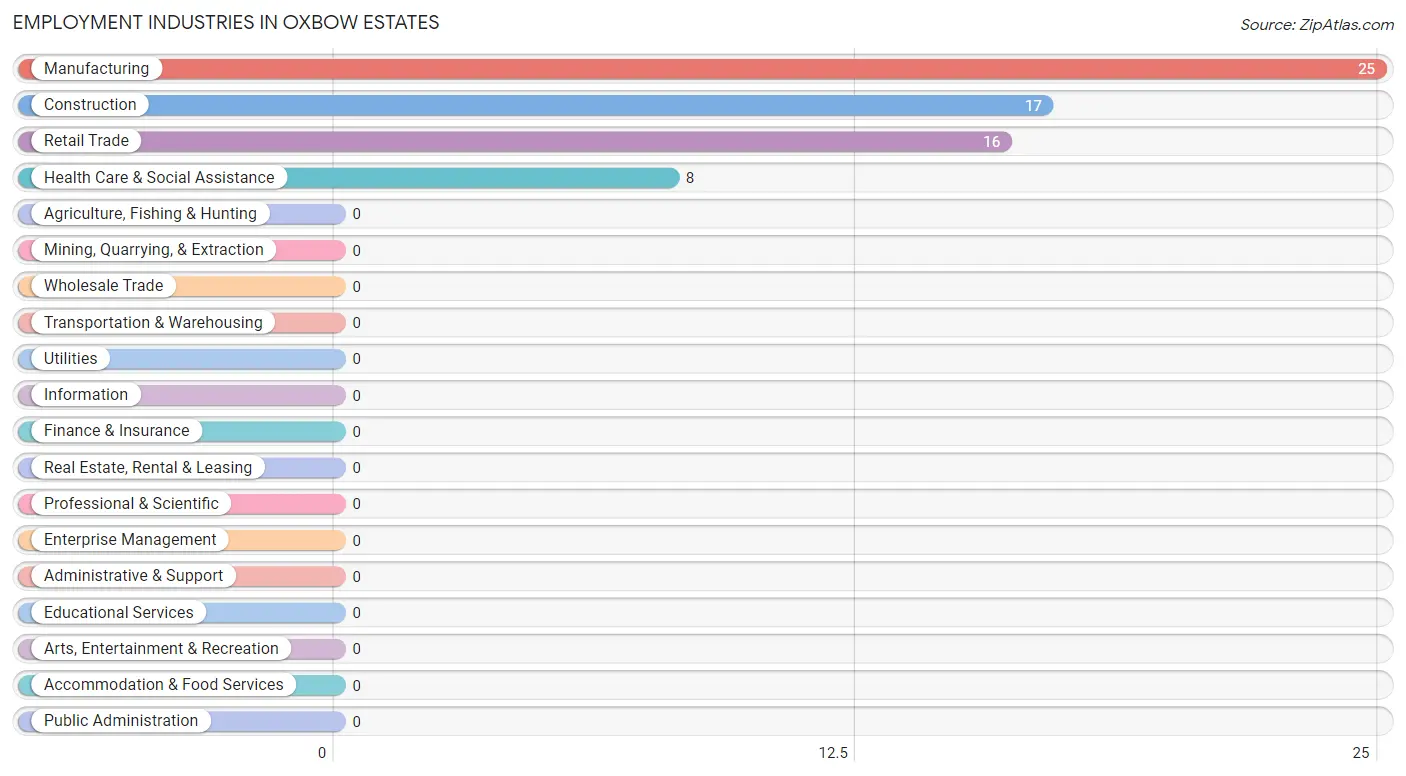
Employment Industries in Oxbow Estates
The major employment industries in Oxbow Estates include Manufacturing (25 | 37.9%), Construction (17 | 25.8%), Retail Trade (16 | 24.2%), and Health Care & Social Assistance (8 | 12.1%).
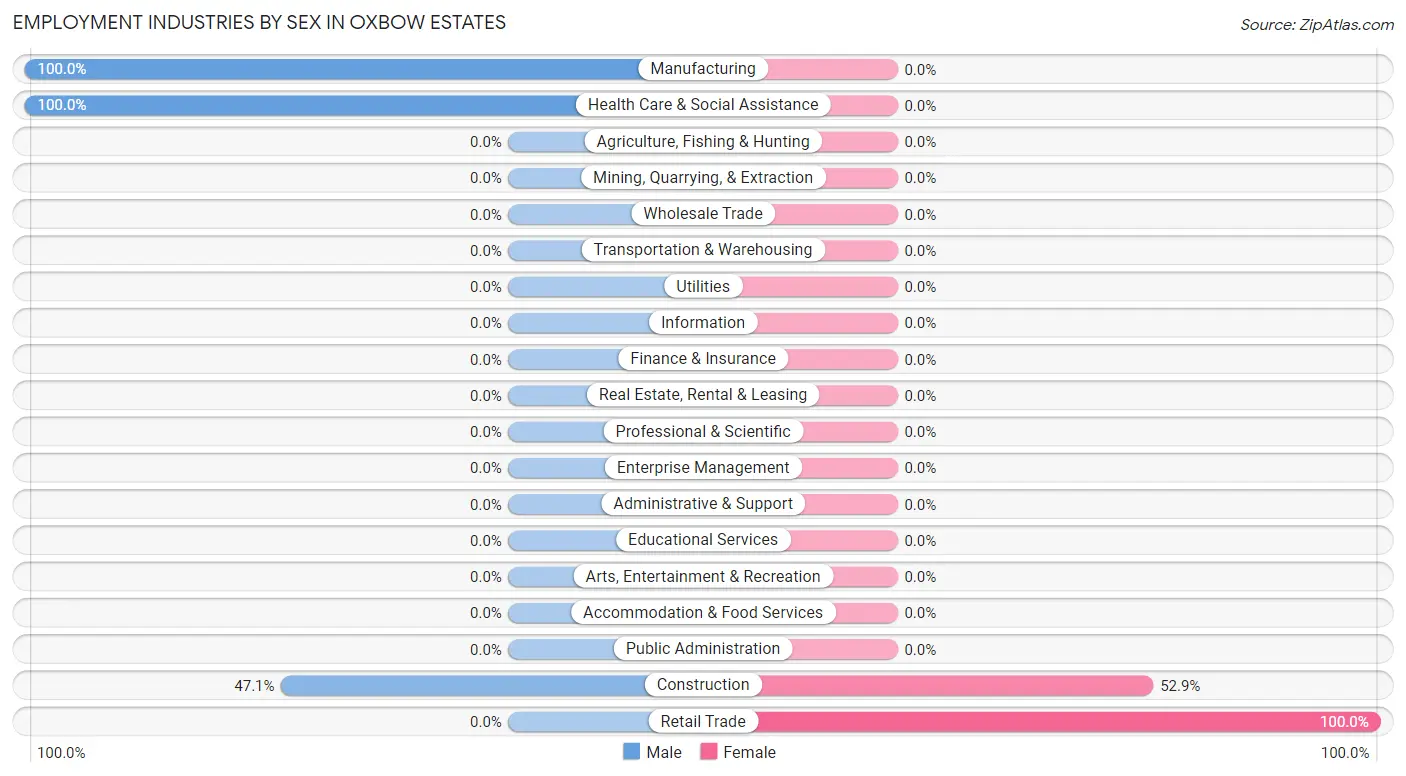
Employment Industries by Sex in Oxbow Estates
The Oxbow Estates industries that see more men than women are Manufacturing (100.0%), Health Care & Social Assistance (100.0%), and Construction (47.1%), whereas the industries that tend to have a higher number of women are Retail Trade (100.0%), and Construction (52.9%).
| Industry | Male | Female |
| Agriculture, Fishing & Hunting | 0 (0.0%) | 0 (0.0%) |
| Mining, Quarrying, & Extraction | 0 (0.0%) | 0 (0.0%) |
| Construction | 8 (47.1%) | 9 (52.9%) |
| Manufacturing | 25 (100.0%) | 0 (0.0%) |
| Wholesale Trade | 0 (0.0%) | 0 (0.0%) |
| Retail Trade | 0 (0.0%) | 16 (100.0%) |
| Transportation & Warehousing | 0 (0.0%) | 0 (0.0%) |
| Utilities | 0 (0.0%) | 0 (0.0%) |
| Information | 0 (0.0%) | 0 (0.0%) |
| Finance & Insurance | 0 (0.0%) | 0 (0.0%) |
| Real Estate, Rental & Leasing | 0 (0.0%) | 0 (0.0%) |
| Professional & Scientific | 0 (0.0%) | 0 (0.0%) |
| Enterprise Management | 0 (0.0%) | 0 (0.0%) |
| Administrative & Support | 0 (0.0%) | 0 (0.0%) |
| Educational Services | 0 (0.0%) | 0 (0.0%) |
| Health Care & Social Assistance | 8 (100.0%) | 0 (0.0%) |
| Arts, Entertainment & Recreation | 0 (0.0%) | 0 (0.0%) |
| Accommodation & Food Services | 0 (0.0%) | 0 (0.0%) |
| Public Administration | 0 (0.0%) | 0 (0.0%) |
| Total | 41 (62.1%) | 25 (37.9%) |
Education in Oxbow Estates
School Enrollment in Oxbow Estates
| School Level | # Students | % Students |
| Nursery / Preschool | 0 | 0.0% |
| Kindergarten | 0 | 0.0% |
| Elementary School | 0 | 0.0% |
| Middle School | 0 | 0.0% |
| High School | 0 | 0.0% |
| College / Undergraduate | 0 | 0.0% |
| Graduate / Professional | 0 | 0.0% |
| Total | 0 | 0.0% |
School Enrollment by Age by Funding Source in Oxbow Estates
| Age Bracket | Public School | Private School |
| 3 to 4 Year Olds | 0 (0.0%) | 0 (0.0%) |
| 5 to 9 Year Old | 0 (0.0%) | 0 (0.0%) |
| 10 to 14 Year Olds | 0 (0.0%) | 0 (0.0%) |
| 15 to 17 Year Olds | 0 (0.0%) | 0 (0.0%) |
| 18 to 19 Year Olds | 0 (0.0%) | 0 (0.0%) |
| 20 to 24 Year Olds | 0 (0.0%) | 0 (0.0%) |
| 25 to 34 Year Olds | 0 (0.0%) | 0 (0.0%) |
| 35 Years and over | 0 (0.0%) | 0 (0.0%) |
| Total | 0 (0.0%) | 0 (0.0%) |
Educational Attainment by Field of Study in Oxbow Estates
| Field of Study | # Graduates | % Graduates |
| Computers & Mathematics | 0 | 0.0% |
| Bio, Nature & Agricultural | 0 | 0.0% |
| Physical & Health Sciences | 0 | 0.0% |
| Psychology | 0 | 0.0% |
| Social Sciences | 0 | 0.0% |
| Engineering | 0 | 0.0% |
| Multidisciplinary Studies | 0 | 0.0% |
| Science & Technology | 0 | 0.0% |
| Business | 0 | 0.0% |
| Education | 0 | 0.0% |
| Literature & Languages | 0 | 0.0% |
| Liberal Arts & History | 0 | 0.0% |
| Visual & Performing Arts | 0 | 0.0% |
| Communications | 0 | 0.0% |
| Arts & Humanities | 0 | 0.0% |
| Total | 0 | 0.0% |
Transportation & Commute in Oxbow Estates
Vehicle Availability by Sex in Oxbow Estates
The most prevalent vehicle ownership categories in Oxbow Estates are males with 5 or more vehicles (25, accounting for 61.0%) and females with 5 or more vehicles (16, making up 100.0%).
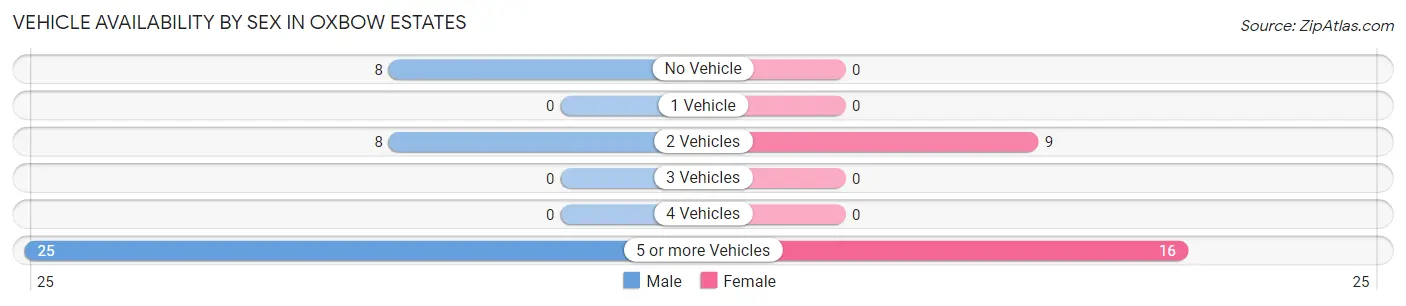
| Vehicles Available | Male | Female |
| No Vehicle | 8 (19.5%) | 0 (0.0%) |
| 1 Vehicle | 0 (0.0%) | 0 (0.0%) |
| 2 Vehicles | 8 (19.5%) | 9 (36.0%) |
| 3 Vehicles | 0 (0.0%) | 0 (0.0%) |
| 4 Vehicles | 0 (0.0%) | 0 (0.0%) |
| 5 or more Vehicles | 25 (61.0%) | 16 (64.0%) |
| Total | 41 (100.0%) | 25 (100.0%) |
Commute Time in Oxbow Estates
The most frequently occuring commute durations in Oxbow Estates are 15 to 19 minutes (58 commuters, 87.9%), 5 to 9 minutes (8 commuters, 12.1%), and less than 5 minutes (0 commuters, 0.0%).
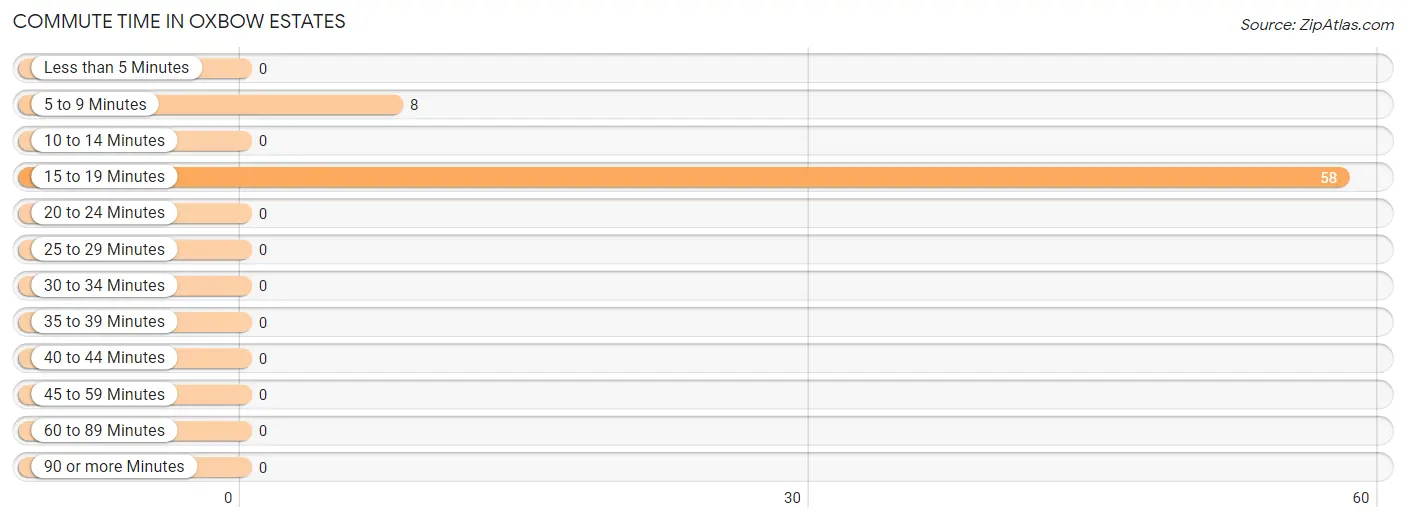
| Commute Time | # Commuters | % Commuters |
| Less than 5 Minutes | 0 | 0.0% |
| 5 to 9 Minutes | 8 | 12.1% |
| 10 to 14 Minutes | 0 | 0.0% |
| 15 to 19 Minutes | 58 | 87.9% |
| 20 to 24 Minutes | 0 | 0.0% |
| 25 to 29 Minutes | 0 | 0.0% |
| 30 to 34 Minutes | 0 | 0.0% |
| 35 to 39 Minutes | 0 | 0.0% |
| 40 to 44 Minutes | 0 | 0.0% |
| 45 to 59 Minutes | 0 | 0.0% |
| 60 to 89 Minutes | 0 | 0.0% |
| 90 or more Minutes | 0 | 0.0% |
Commute Time by Sex in Oxbow Estates
The most common commute times in Oxbow Estates are 15 to 19 minutes (33 commuters, 80.5%) for males and 15 to 19 minutes (25 commuters, 100.0%) for females.
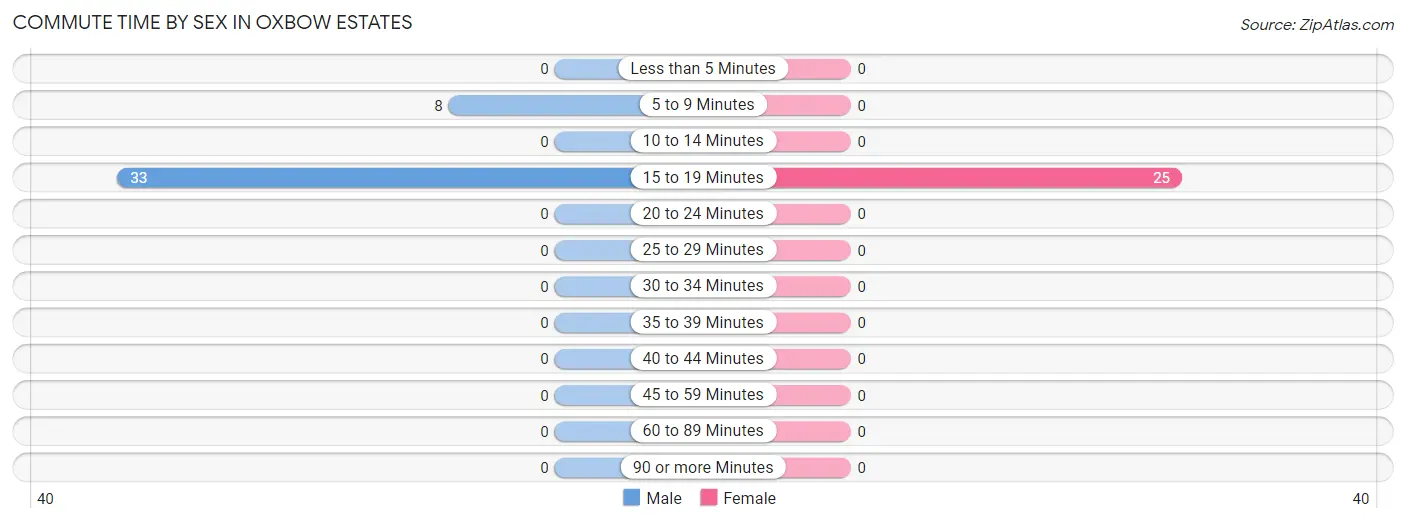
| Commute Time | Male | Female |
| Less than 5 Minutes | 0 (0.0%) | 0 (0.0%) |
| 5 to 9 Minutes | 8 (19.5%) | 0 (0.0%) |
| 10 to 14 Minutes | 0 (0.0%) | 0 (0.0%) |
| 15 to 19 Minutes | 33 (80.5%) | 25 (100.0%) |
| 20 to 24 Minutes | 0 (0.0%) | 0 (0.0%) |
| 25 to 29 Minutes | 0 (0.0%) | 0 (0.0%) |
| 30 to 34 Minutes | 0 (0.0%) | 0 (0.0%) |
| 35 to 39 Minutes | 0 (0.0%) | 0 (0.0%) |
| 40 to 44 Minutes | 0 (0.0%) | 0 (0.0%) |
| 45 to 59 Minutes | 0 (0.0%) | 0 (0.0%) |
| 60 to 89 Minutes | 0 (0.0%) | 0 (0.0%) |
| 90 or more Minutes | 0 (0.0%) | 0 (0.0%) |
Time of Departure to Work by Sex in Oxbow Estates
The most frequent times of departure to work in Oxbow Estates are 12:00 PM to 3:59 PM (25, 61.0%) for males and 8:00 AM to 8:29 AM (16, 64.0%) for females.
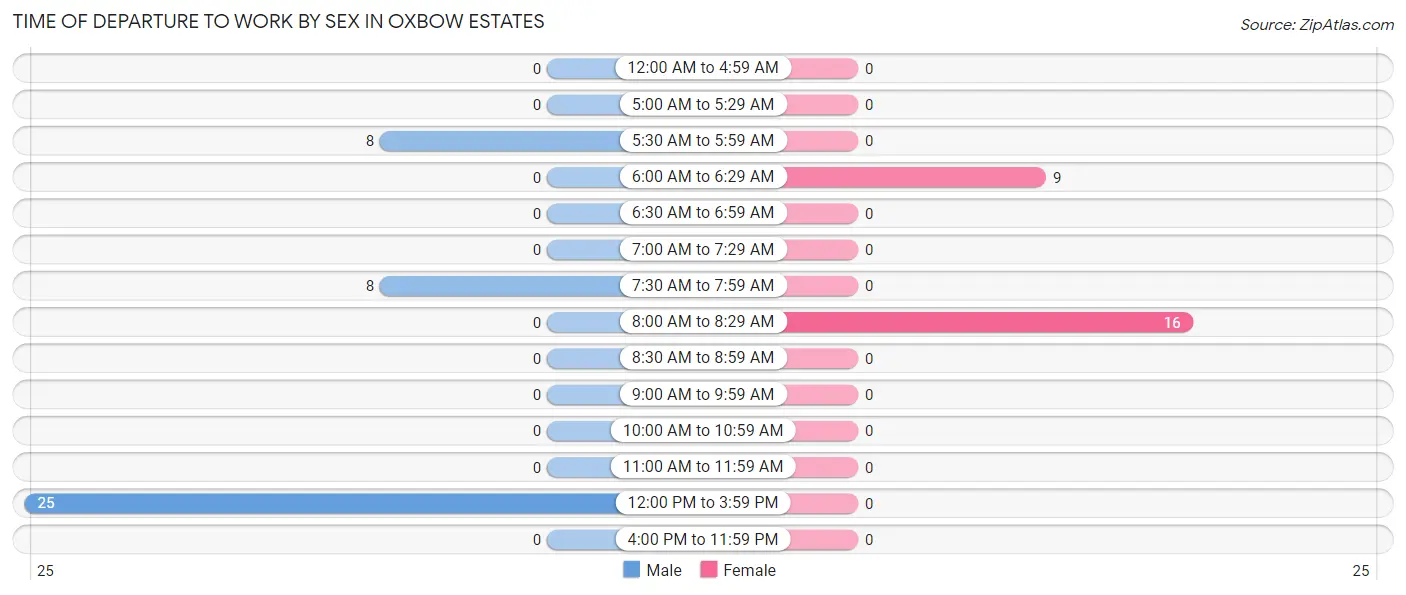
| Time of Departure | Male | Female |
| 12:00 AM to 4:59 AM | 0 (0.0%) | 0 (0.0%) |
| 5:00 AM to 5:29 AM | 0 (0.0%) | 0 (0.0%) |
| 5:30 AM to 5:59 AM | 8 (19.5%) | 0 (0.0%) |
| 6:00 AM to 6:29 AM | 0 (0.0%) | 9 (36.0%) |
| 6:30 AM to 6:59 AM | 0 (0.0%) | 0 (0.0%) |
| 7:00 AM to 7:29 AM | 0 (0.0%) | 0 (0.0%) |
| 7:30 AM to 7:59 AM | 8 (19.5%) | 0 (0.0%) |
| 8:00 AM to 8:29 AM | 0 (0.0%) | 16 (64.0%) |
| 8:30 AM to 8:59 AM | 0 (0.0%) | 0 (0.0%) |
| 9:00 AM to 9:59 AM | 0 (0.0%) | 0 (0.0%) |
| 10:00 AM to 10:59 AM | 0 (0.0%) | 0 (0.0%) |
| 11:00 AM to 11:59 AM | 0 (0.0%) | 0 (0.0%) |
| 12:00 PM to 3:59 PM | 25 (61.0%) | 0 (0.0%) |
| 4:00 PM to 11:59 PM | 0 (0.0%) | 0 (0.0%) |
| Total | 41 (100.0%) | 25 (100.0%) |
Housing Occupancy in Oxbow Estates
Occupancy by Ownership in Oxbow Estates
Of the total 48 dwellings in Oxbow Estates, owner-occupied units account for 33 (68.8%), while renter-occupied units make up 15 (31.2%).
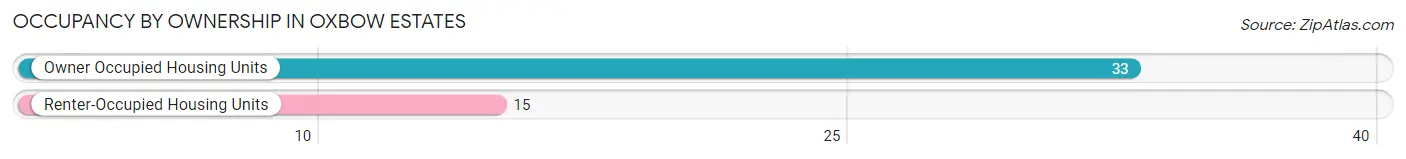
| Occupancy | # Housing Units | % Housing Units |
| Owner Occupied Housing Units | 33 | 68.8% |
| Renter-Occupied Housing Units | 15 | 31.2% |
| Total Occupied Housing Units | 48 | 100.0% |
Occupancy by Household Size in Oxbow Estates
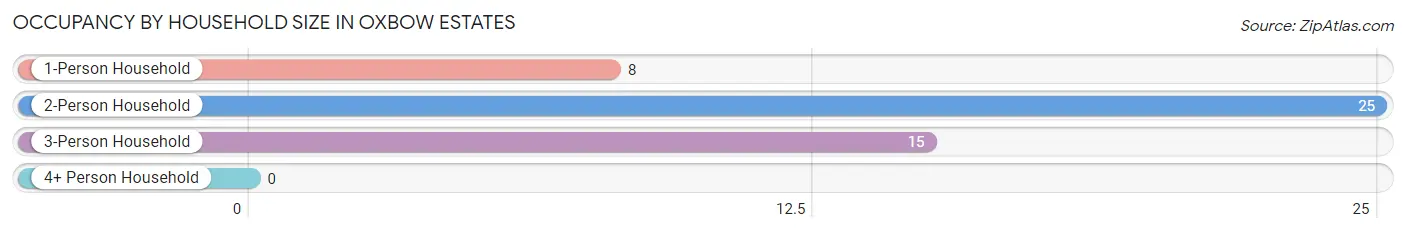
| Household Size | # Housing Units | % Housing Units |
| 1-Person Household | 8 | 16.7% |
| 2-Person Household | 25 | 52.1% |
| 3-Person Household | 15 | 31.2% |
| 4+ Person Household | 0 | 0.0% |
| Total Housing Units | 48 | 100.0% |
Occupancy by Ownership by Household Size in Oxbow Estates
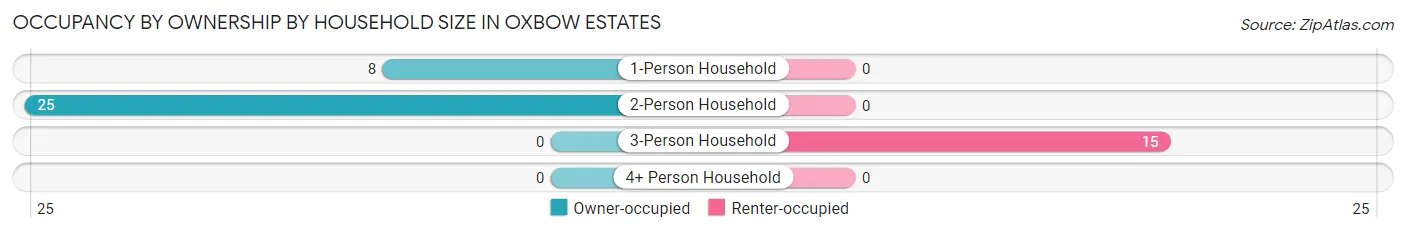
| Household Size | Owner-occupied | Renter-occupied |
| 1-Person Household | 8 (100.0%) | 0 (0.0%) |
| 2-Person Household | 25 (100.0%) | 0 (0.0%) |
| 3-Person Household | 0 (0.0%) | 15 (100.0%) |
| 4+ Person Household | 0 (0.0%) | 0 (0.0%) |
| Total Housing Units | 33 (68.8%) | 15 (31.2%) |
Occupancy by Educational Attainment in Oxbow Estates
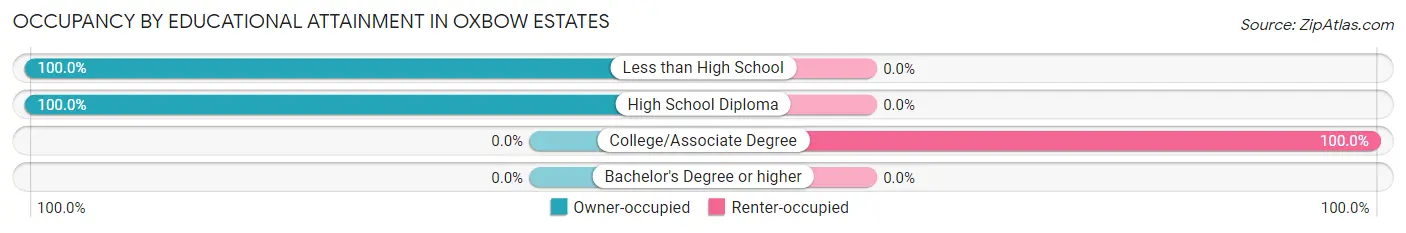
| Household Size | Owner-occupied | Renter-occupied |
| Less than High School | 9 (100.0%) | 0 (0.0%) |
| High School Diploma | 24 (100.0%) | 0 (0.0%) |
| College/Associate Degree | 0 (0.0%) | 15 (100.0%) |
| Bachelor's Degree or higher | 0 (0.0%) | 0 (0.0%) |
Occupancy by Age of Householder in Oxbow Estates
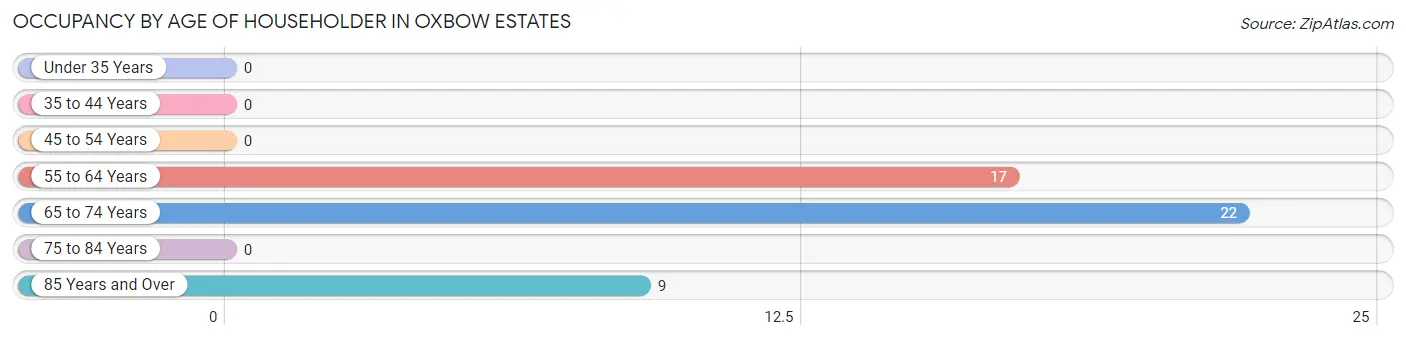
| Age Bracket | # Households | % Households |
| Under 35 Years | 0 | 0.0% |
| 35 to 44 Years | 0 | 0.0% |
| 45 to 54 Years | 0 | 0.0% |
| 55 to 64 Years | 17 | 35.4% |
| 65 to 74 Years | 22 | 45.8% |
| 75 to 84 Years | 0 | 0.0% |
| 85 Years and Over | 9 | 18.8% |
| Total | 48 | 100.0% |
Housing Finances in Oxbow Estates
Median Income by Occupancy in Oxbow Estates
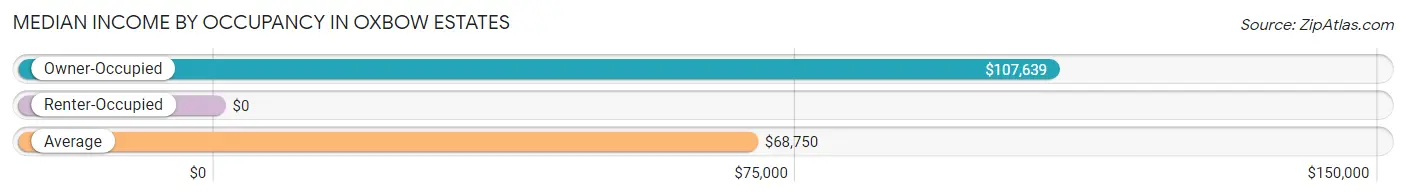
| Occupancy Type | # Households | Median Income |
| Owner-Occupied | 33 (68.8%) | $107,639 |
| Renter-Occupied | 15 (31.2%) | $0 |
| Average | 48 (100.0%) | $68,750 |
Occupancy by Householder Income Bracket in Oxbow Estates
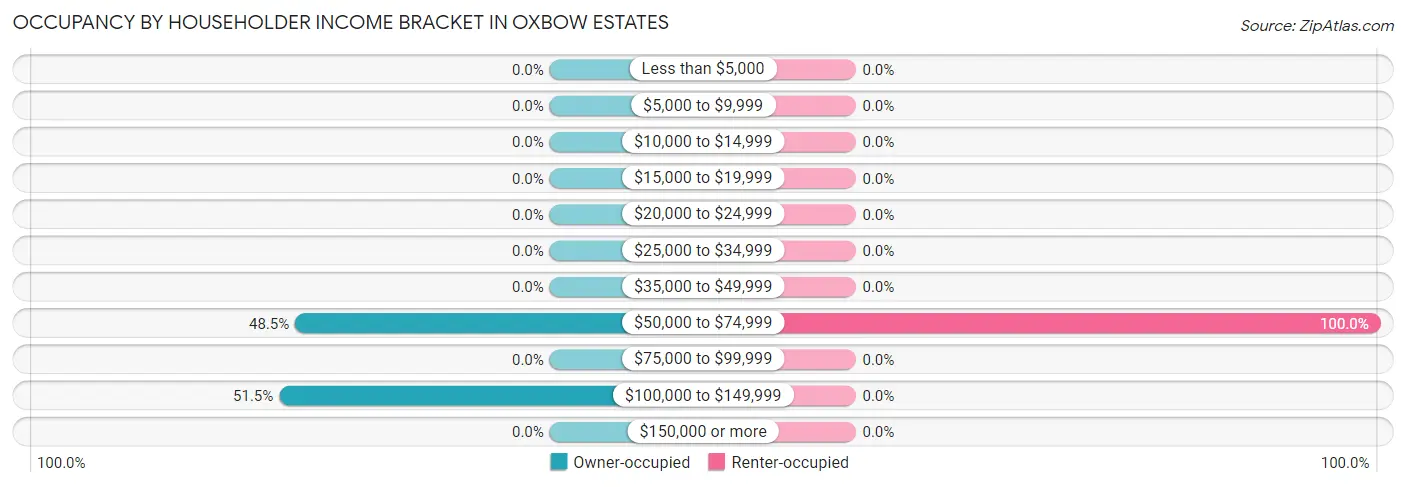
| Income Bracket | Owner-occupied | Renter-occupied |
| Less than $5,000 | 0 (0.0%) | 0 (0.0%) |
| $5,000 to $9,999 | 0 (0.0%) | 0 (0.0%) |
| $10,000 to $14,999 | 0 (0.0%) | 0 (0.0%) |
| $15,000 to $19,999 | 0 (0.0%) | 0 (0.0%) |
| $20,000 to $24,999 | 0 (0.0%) | 0 (0.0%) |
| $25,000 to $34,999 | 0 (0.0%) | 0 (0.0%) |
| $35,000 to $49,999 | 0 (0.0%) | 0 (0.0%) |
| $50,000 to $74,999 | 16 (48.5%) | 15 (100.0%) |
| $75,000 to $99,999 | 0 (0.0%) | 0 (0.0%) |
| $100,000 to $149,999 | 17 (51.5%) | 0 (0.0%) |
| $150,000 or more | 0 (0.0%) | 0 (0.0%) |
| Total | 33 (100.0%) | 15 (100.0%) |
Monthly Housing Cost Tiers in Oxbow Estates
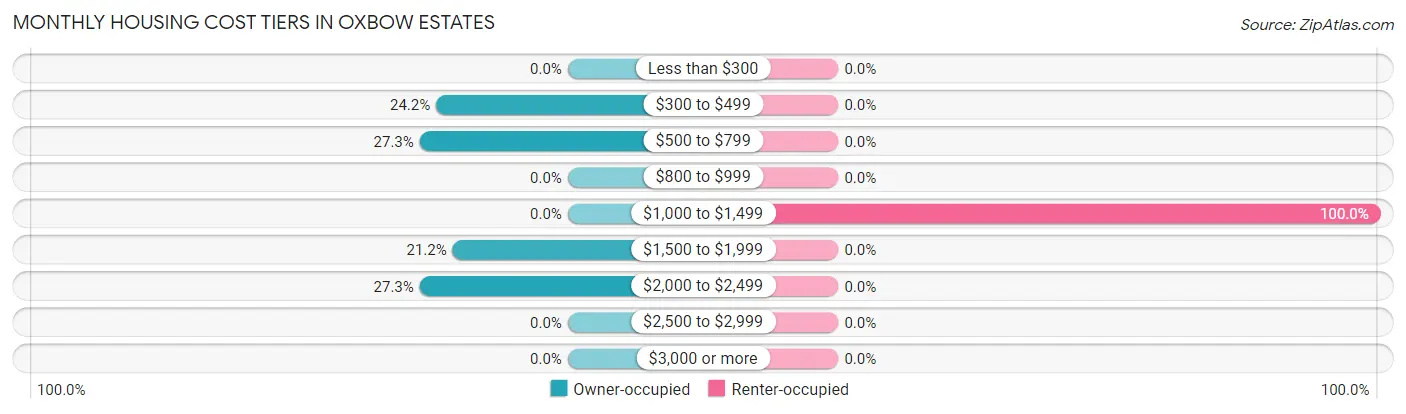
| Monthly Cost | Owner-occupied | Renter-occupied |
| Less than $300 | 0 (0.0%) | 0 (0.0%) |
| $300 to $499 | 8 (24.2%) | 0 (0.0%) |
| $500 to $799 | 9 (27.3%) | 0 (0.0%) |
| $800 to $999 | 0 (0.0%) | 0 (0.0%) |
| $1,000 to $1,499 | 0 (0.0%) | 15 (100.0%) |
| $1,500 to $1,999 | 7 (21.2%) | 0 (0.0%) |
| $2,000 to $2,499 | 9 (27.3%) | 0 (0.0%) |
| $2,500 to $2,999 | 0 (0.0%) | 0 (0.0%) |
| $3,000 or more | 0 (0.0%) | 0 (0.0%) |
| Total | 33 (100.0%) | 15 (100.0%) |
Physical Housing Characteristics in Oxbow Estates
Housing Structures in Oxbow Estates
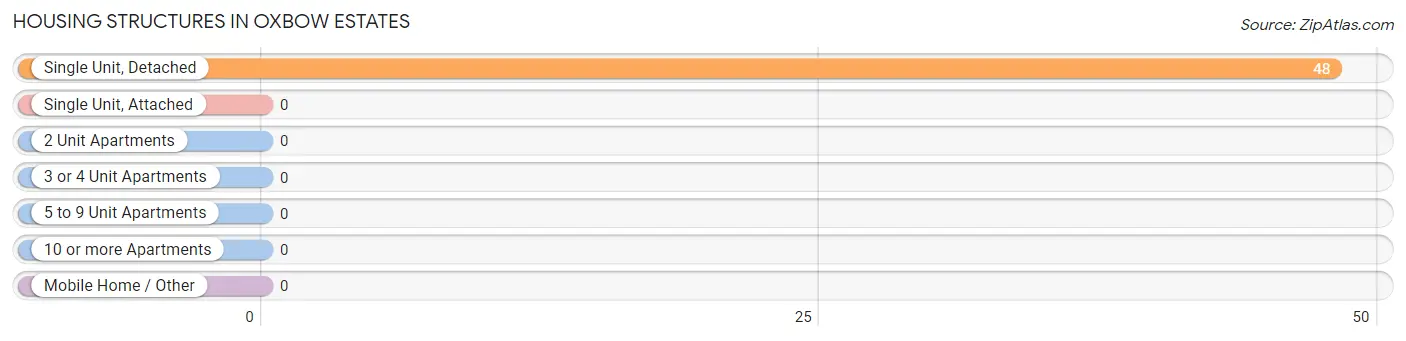
| Structure Type | # Housing Units | % Housing Units |
| Single Unit, Detached | 48 | 100.0% |
| Single Unit, Attached | 0 | 0.0% |
| 2 Unit Apartments | 0 | 0.0% |
| 3 or 4 Unit Apartments | 0 | 0.0% |
| 5 to 9 Unit Apartments | 0 | 0.0% |
| 10 or more Apartments | 0 | 0.0% |
| Mobile Home / Other | 0 | 0.0% |
| Total | 48 | 100.0% |
Housing Structures by Occupancy in Oxbow Estates
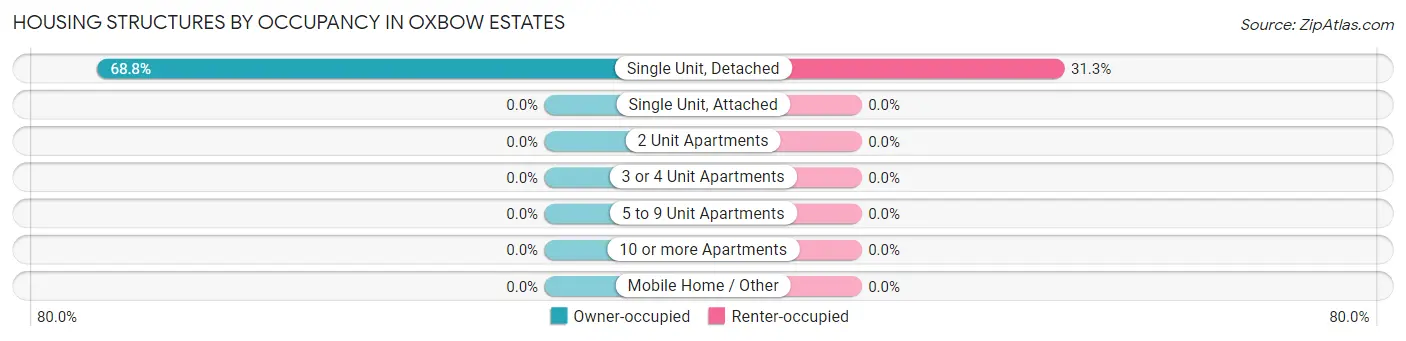
| Structure Type | Owner-occupied | Renter-occupied |
| Single Unit, Detached | 33 (68.8%) | 15 (31.2%) |
| Single Unit, Attached | 0 (0.0%) | 0 (0.0%) |
| 2 Unit Apartments | 0 (0.0%) | 0 (0.0%) |
| 3 or 4 Unit Apartments | 0 (0.0%) | 0 (0.0%) |
| 5 to 9 Unit Apartments | 0 (0.0%) | 0 (0.0%) |
| 10 or more Apartments | 0 (0.0%) | 0 (0.0%) |
| Mobile Home / Other | 0 (0.0%) | 0 (0.0%) |
| Total | 33 (68.8%) | 15 (31.2%) |
Housing Structures by Number of Rooms in Oxbow Estates
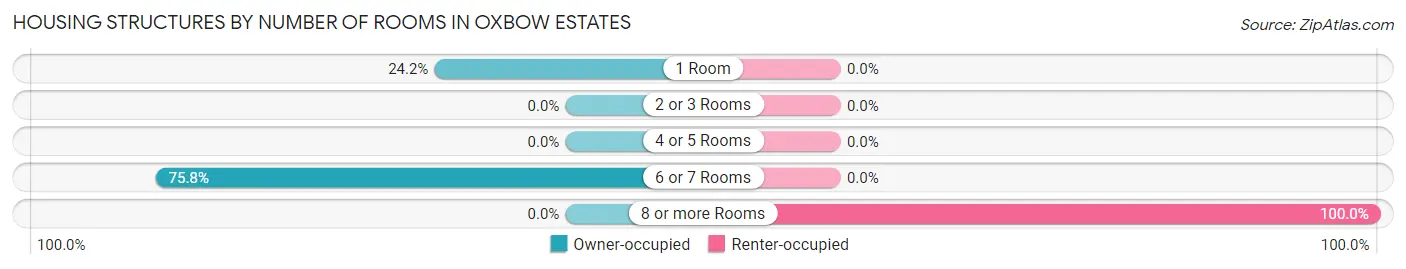
| Number of Rooms | Owner-occupied | Renter-occupied |
| 1 Room | 8 (24.2%) | 0 (0.0%) |
| 2 or 3 Rooms | 0 (0.0%) | 0 (0.0%) |
| 4 or 5 Rooms | 0 (0.0%) | 0 (0.0%) |
| 6 or 7 Rooms | 25 (75.8%) | 0 (0.0%) |
| 8 or more Rooms | 0 (0.0%) | 15 (100.0%) |
| Total | 33 (100.0%) | 15 (100.0%) |
Housing Structure by Heating Type in Oxbow Estates
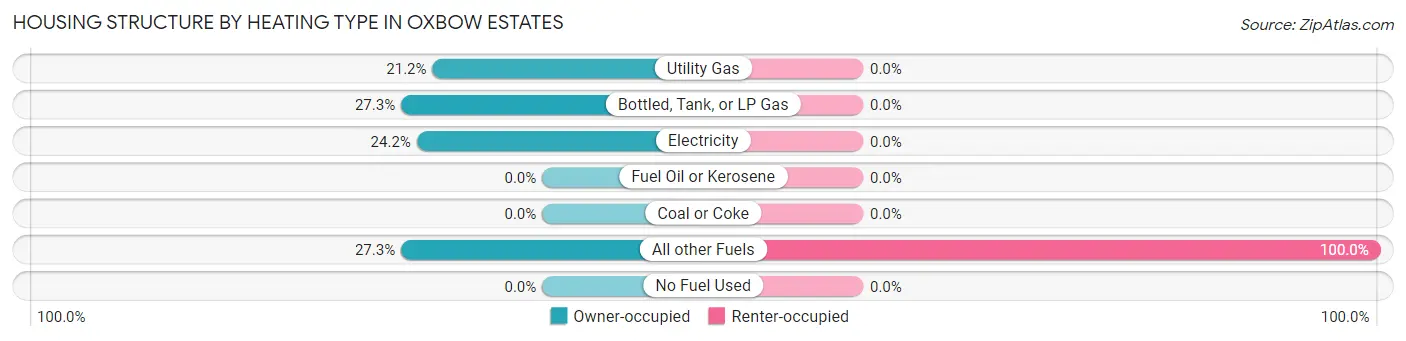
| Heating Type | Owner-occupied | Renter-occupied |
| Utility Gas | 7 (21.2%) | 0 (0.0%) |
| Bottled, Tank, or LP Gas | 9 (27.3%) | 0 (0.0%) |
| Electricity | 8 (24.2%) | 0 (0.0%) |
| Fuel Oil or Kerosene | 0 (0.0%) | 0 (0.0%) |
| Coal or Coke | 0 (0.0%) | 0 (0.0%) |
| All other Fuels | 9 (27.3%) | 15 (100.0%) |
| No Fuel Used | 0 (0.0%) | 0 (0.0%) |
| Total | 33 (100.0%) | 15 (100.0%) |
Household Vehicle Usage in Oxbow Estates
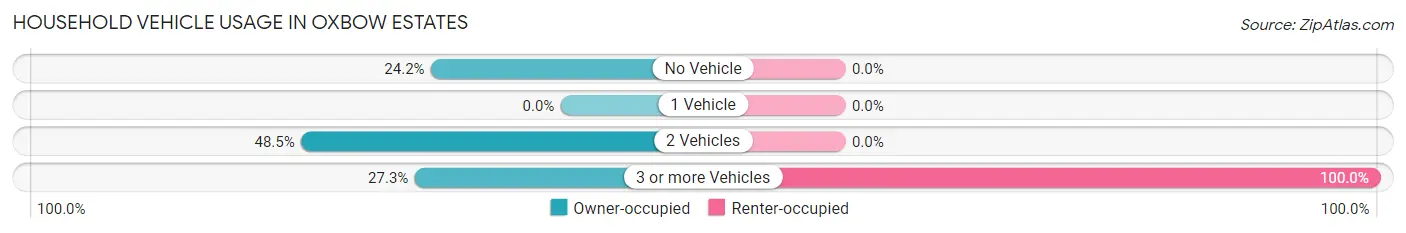
| Vehicles per Household | Owner-occupied | Renter-occupied |
| No Vehicle | 8 (24.2%) | 0 (0.0%) |
| 1 Vehicle | 0 (0.0%) | 0 (0.0%) |
| 2 Vehicles | 16 (48.5%) | 0 (0.0%) |
| 3 or more Vehicles | 9 (27.3%) | 15 (100.0%) |
| Total | 33 (100.0%) | 15 (100.0%) |
Real Estate & Mortgages in Oxbow Estates
Real Estate and Mortgage Overview in Oxbow Estates
| Characteristic | Without Mortgage | With Mortgage |
| Housing Units | 17 | 16 |
| Median Property Value | - | - |
| Median Household Income | - | - |
| Monthly Housing Costs | - | - |
| Real Estate Taxes | - | - |
Property Value by Mortgage Status in Oxbow Estates
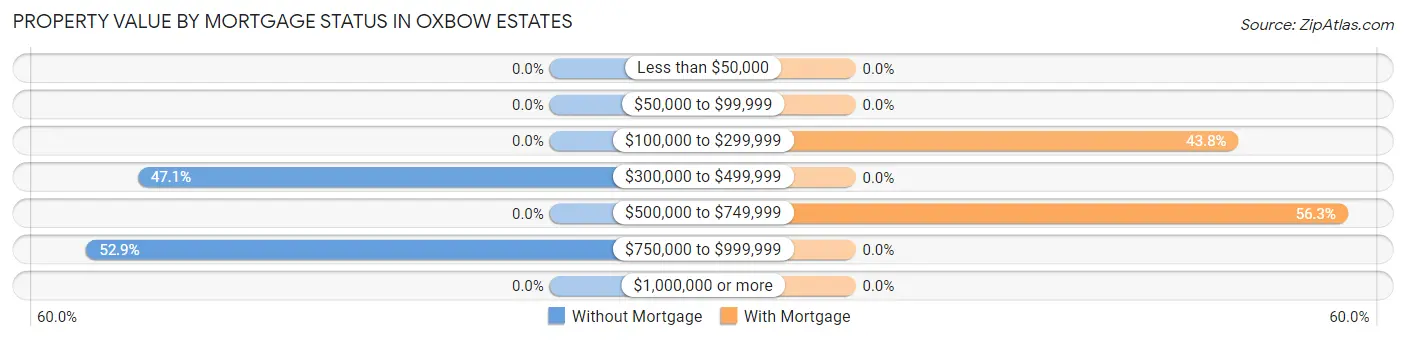
| Property Value | Without Mortgage | With Mortgage |
| Less than $50,000 | 0 (0.0%) | 0 (0.0%) |
| $50,000 to $99,999 | 0 (0.0%) | 0 (0.0%) |
| $100,000 to $299,999 | 0 (0.0%) | 7 (43.8%) |
| $300,000 to $499,999 | 8 (47.1%) | 0 (0.0%) |
| $500,000 to $749,999 | 0 (0.0%) | 9 (56.2%) |
| $750,000 to $999,999 | 9 (52.9%) | 0 (0.0%) |
| $1,000,000 or more | 0 (0.0%) | 0 (0.0%) |
| Total | 17 (100.0%) | 16 (100.0%) |
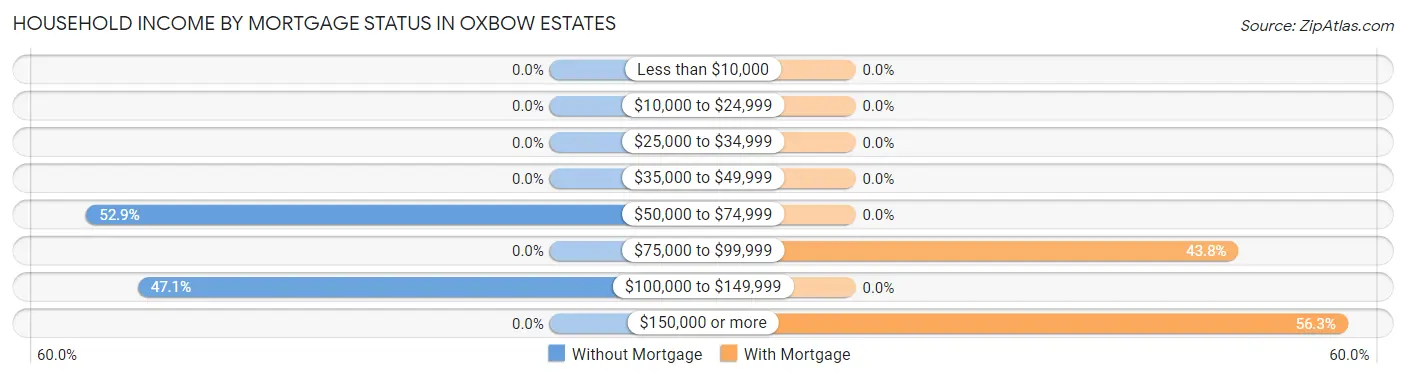
Household Income by Mortgage Status in Oxbow Estates
| Household Income | Without Mortgage | With Mortgage |
| Less than $10,000 | 0 (0.0%) | 0 (0.0%) |
| $10,000 to $24,999 | 0 (0.0%) | 0 (0.0%) |
| $25,000 to $34,999 | 0 (0.0%) | 0 (0.0%) |
| $35,000 to $49,999 | 0 (0.0%) | 0 (0.0%) |
| $50,000 to $74,999 | 9 (52.9%) | 0 (0.0%) |
| $75,000 to $99,999 | 0 (0.0%) | 7 (43.8%) |
| $100,000 to $149,999 | 8 (47.1%) | 0 (0.0%) |
| $150,000 or more | 0 (0.0%) | 9 (56.2%) |
| Total | 17 (100.0%) | 16 (100.0%) |
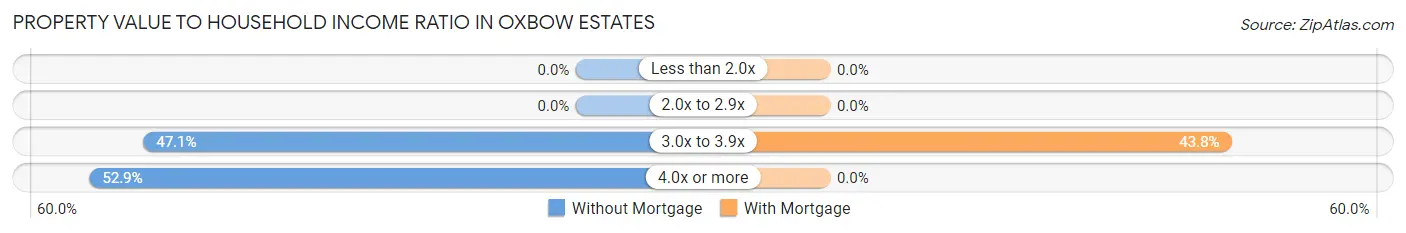
Property Value to Household Income Ratio in Oxbow Estates
| Value-to-Income Ratio | Without Mortgage | With Mortgage |
| Less than 2.0x | 0 (0.0%) | 0 (0.0%) |
| 2.0x to 2.9x | 0 (0.0%) | 0 (0.0%) |
| 3.0x to 3.9x | 8 (47.1%) | 7 (43.8%) |
| 4.0x or more | 9 (52.9%) | 0 (0.0%) |
| Total | 17 (100.0%) | 16 (100.0%) |
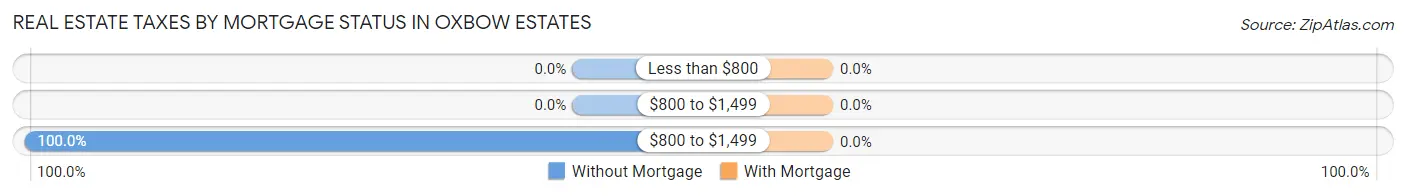
Real Estate Taxes by Mortgage Status in Oxbow Estates
| Property Taxes | Without Mortgage | With Mortgage |
| Less than $800 | 0 (0.0%) | 0 (0.0%) |
| $800 to $1,499 | 0 (0.0%) | 0 (0.0%) |
| $800 to $1,499 | 17 (100.0%) | 0 (0.0%) |
| Total | 17 (100.0%) | 16 (100.0%) |
Health & Disability in Oxbow Estates
Health Insurance Coverage by Age in Oxbow Estates

| Age Bracket | With Coverage | Without Coverage |
| Under 6 Years | 0 (0.0%) | 0 (0.0%) |
| 6 to 18 Years | 0 (0.0%) | 0 (0.0%) |
| 19 to 25 Years | 0 (0.0%) | 16 (100.0%) |
| 26 to 34 Years | 25 (100.0%) | 0 (0.0%) |
| 35 to 44 Years | 0 (0.0%) | 0 (0.0%) |
| 45 to 54 Years | 0 (0.0%) | 0 (0.0%) |
| 55 to 64 Years | 25 (100.0%) | 0 (0.0%) |
| 65 to 74 Years | 28 (100.0%) | 0 (0.0%) |
| 75 Years and older | 16 (100.0%) | 0 (0.0%) |
| Total | 94 (85.5%) | 16 (14.5%) |
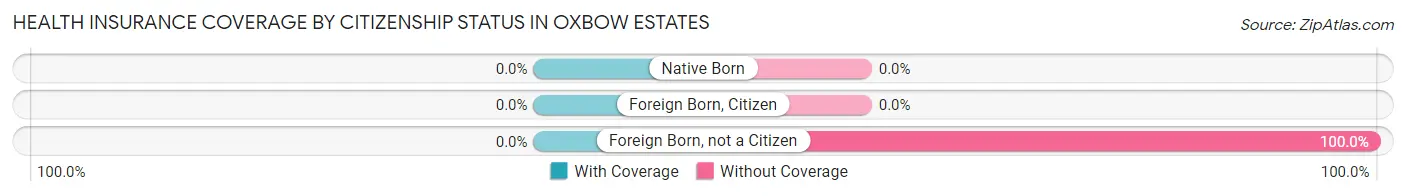
Health Insurance Coverage by Citizenship Status in Oxbow Estates
| Citizenship Status | With Coverage | Without Coverage |
| Native Born | 0 (0.0%) | 0 (0.0%) |
| Foreign Born, Citizen | 0 (0.0%) | 0 (0.0%) |
| Foreign Born, not a Citizen | 0 (0.0%) | 16 (100.0%) |
Health Insurance Coverage by Household Income in Oxbow Estates
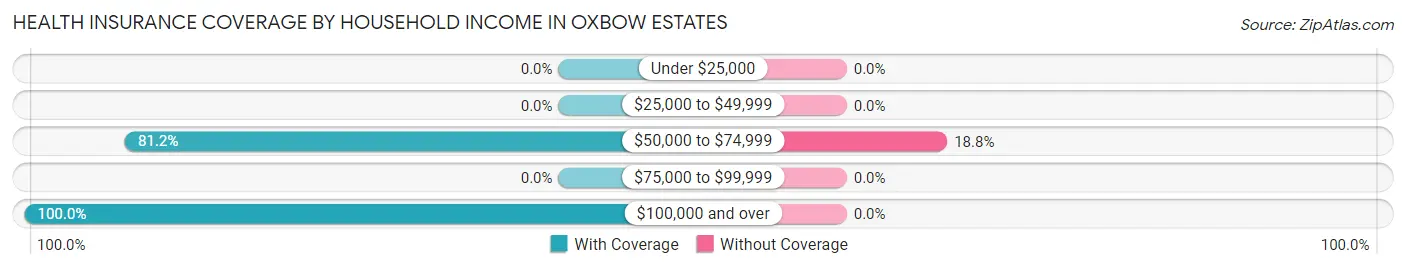
| Household Income | With Coverage | Without Coverage |
| Under $25,000 | 0 (0.0%) | 0 (0.0%) |
| $25,000 to $49,999 | 0 (0.0%) | 0 (0.0%) |
| $50,000 to $74,999 | 69 (81.2%) | 16 (18.8%) |
| $75,000 to $99,999 | 0 (0.0%) | 0 (0.0%) |
| $100,000 and over | 25 (100.0%) | 0 (0.0%) |
Public vs Private Health Insurance Coverage by Age in Oxbow Estates
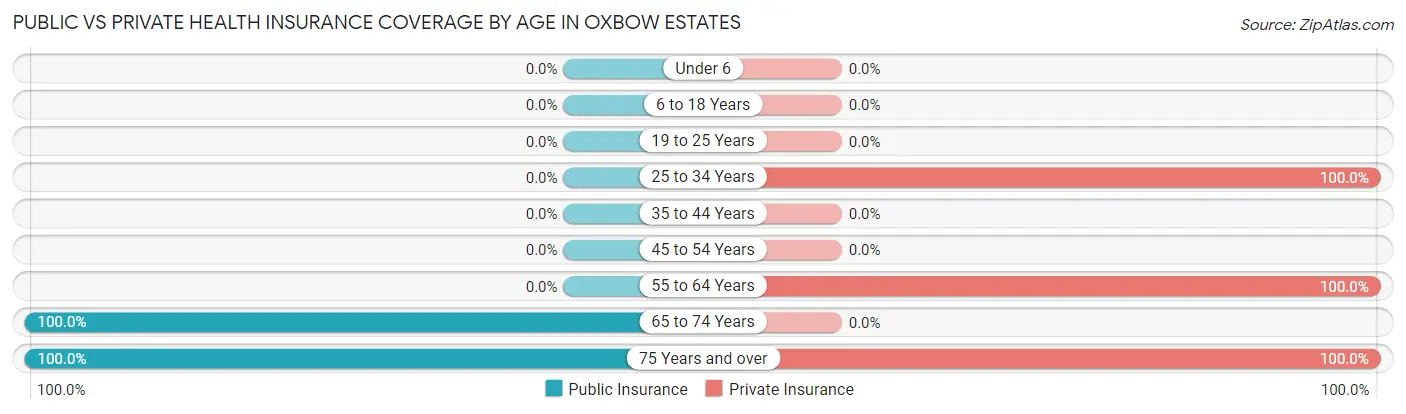
| Age Bracket | Public Insurance | Private Insurance |
| Under 6 | 0 (0.0%) | 0 (0.0%) |
| 6 to 18 Years | 0 (0.0%) | 0 (0.0%) |
| 19 to 25 Years | 0 (0.0%) | 0 (0.0%) |
| 25 to 34 Years | 0 (0.0%) | 25 (100.0%) |
| 35 to 44 Years | 0 (0.0%) | 0 (0.0%) |
| 45 to 54 Years | 0 (0.0%) | 0 (0.0%) |
| 55 to 64 Years | 0 (0.0%) | 25 (100.0%) |
| 65 to 74 Years | 28 (100.0%) | 0 (0.0%) |
| 75 Years and over | 16 (100.0%) | 16 (100.0%) |
| Total | 44 (40.0%) | 66 (60.0%) |
Disability Status by Sex by Age in Oxbow Estates
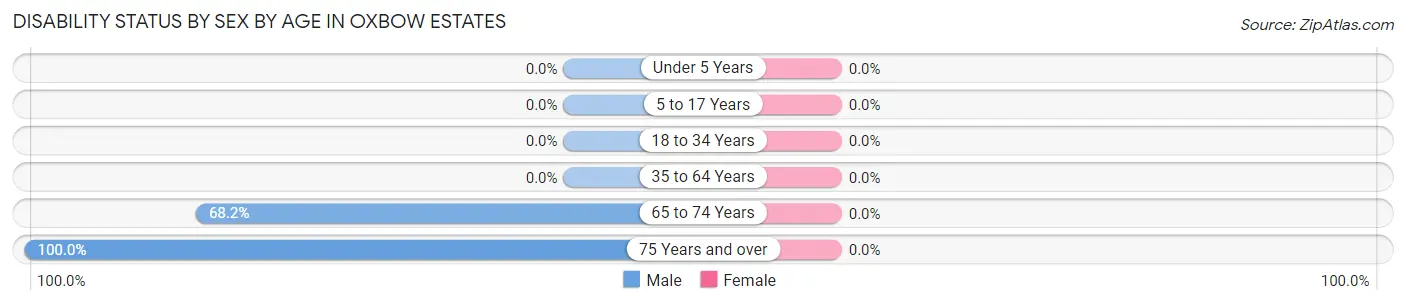
| Age Bracket | Male | Female |
| Under 5 Years | 0 (0.0%) | 0 (0.0%) |
| 5 to 17 Years | 0 (0.0%) | 0 (0.0%) |
| 18 to 34 Years | 0 (0.0%) | 0 (0.0%) |
| 35 to 64 Years | 0 (0.0%) | 0 (0.0%) |
| 65 to 74 Years | 15 (68.2%) | 0 (0.0%) |
| 75 Years and over | 9 (100.0%) | 0 (0.0%) |
Disability Class by Sex by Age in Oxbow Estates
Disability Class: Hearing Difficulty
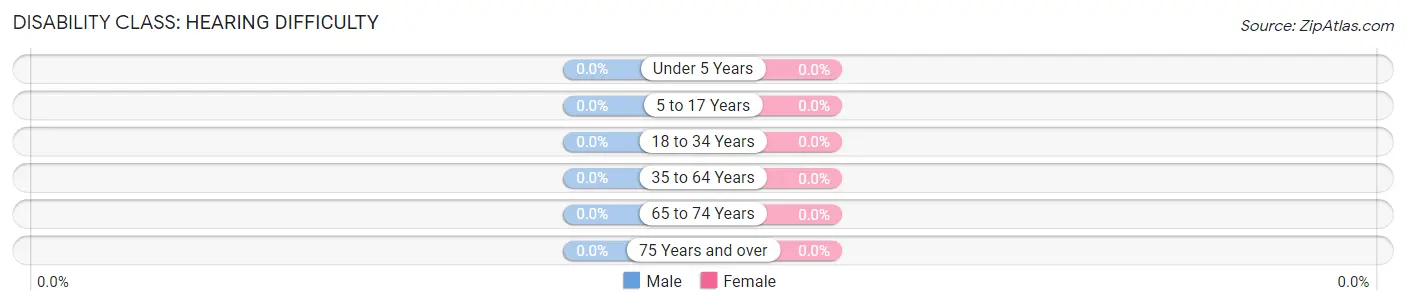
| Age Bracket | Male | Female |
| Under 5 Years | 0 (0.0%) | 0 (0.0%) |
| 5 to 17 Years | 0 (0.0%) | 0 (0.0%) |
| 18 to 34 Years | 0 (0.0%) | 0 (0.0%) |
| 35 to 64 Years | 0 (0.0%) | 0 (0.0%) |
| 65 to 74 Years | 0 (0.0%) | 0 (0.0%) |
| 75 Years and over | 0 (0.0%) | 0 (0.0%) |
Disability Class: Vision Difficulty
| Age Bracket | Male | Female |
| Under 5 Years | 0 (0.0%) | 0 (0.0%) |
| 5 to 17 Years | 0 (0.0%) | 0 (0.0%) |
| 18 to 34 Years | 0 (0.0%) | 0 (0.0%) |
| 35 to 64 Years | 0 (0.0%) | 0 (0.0%) |
| 65 to 74 Years | 0 (0.0%) | 0 (0.0%) |
| 75 Years and over | 0 (0.0%) | 0 (0.0%) |
Disability Class: Cognitive Difficulty
| Age Bracket | Male | Female |
| 5 to 17 Years | 0 (0.0%) | 0 (0.0%) |
| 18 to 34 Years | 0 (0.0%) | 0 (0.0%) |
| 35 to 64 Years | 0 (0.0%) | 0 (0.0%) |
| 65 to 74 Years | 0 (0.0%) | 0 (0.0%) |
| 75 Years and over | 0 (0.0%) | 0 (0.0%) |
Disability Class: Ambulatory Difficulty
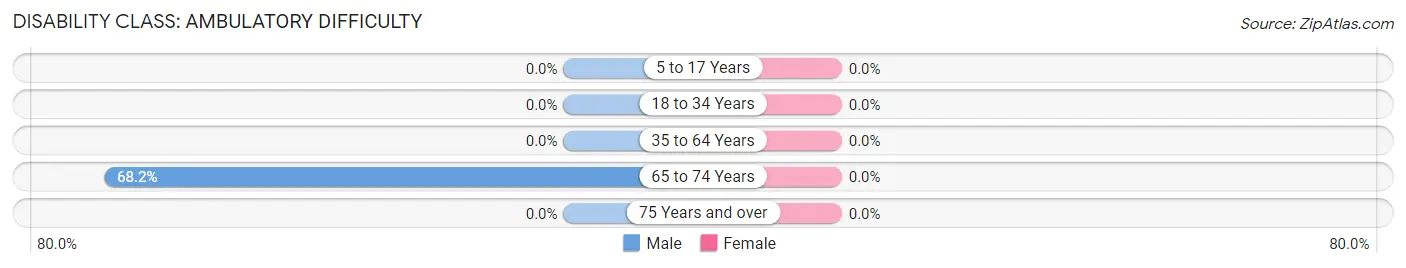
| Age Bracket | Male | Female |
| 5 to 17 Years | 0 (0.0%) | 0 (0.0%) |
| 18 to 34 Years | 0 (0.0%) | 0 (0.0%) |
| 35 to 64 Years | 0 (0.0%) | 0 (0.0%) |
| 65 to 74 Years | 15 (68.2%) | 0 (0.0%) |
| 75 Years and over | 0 (0.0%) | 0 (0.0%) |
Disability Class: Self-Care Difficulty
| Age Bracket | Male | Female |
| 5 to 17 Years | 0 (0.0%) | 0 (0.0%) |
| 18 to 34 Years | 0 (0.0%) | 0 (0.0%) |
| 35 to 64 Years | 0 (0.0%) | 0 (0.0%) |
| 65 to 74 Years | 0 (0.0%) | 0 (0.0%) |
| 75 Years and over | 0 (0.0%) | 0 (0.0%) |
Technology Access in Oxbow Estates
Computing Device Access in Oxbow Estates
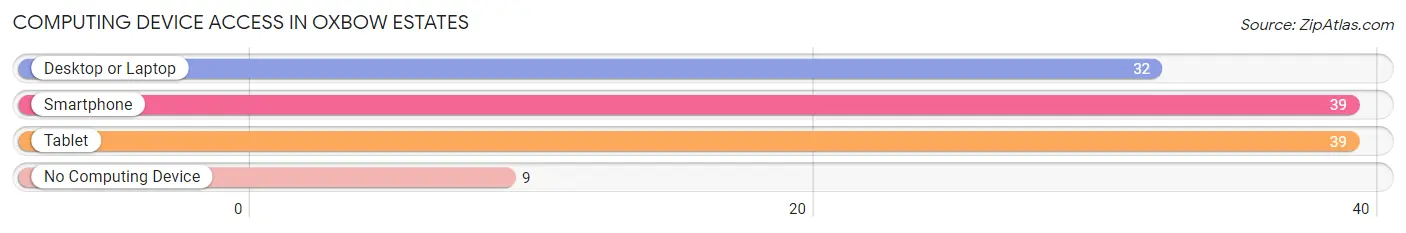
| Device Type | # Households | % Households |
| Desktop or Laptop | 32 | 66.7% |
| Smartphone | 39 | 81.2% |
| Tablet | 39 | 81.2% |
| No Computing Device | 9 | 18.8% |
| Total | 48 | 100.0% |
Internet Access in Oxbow Estates
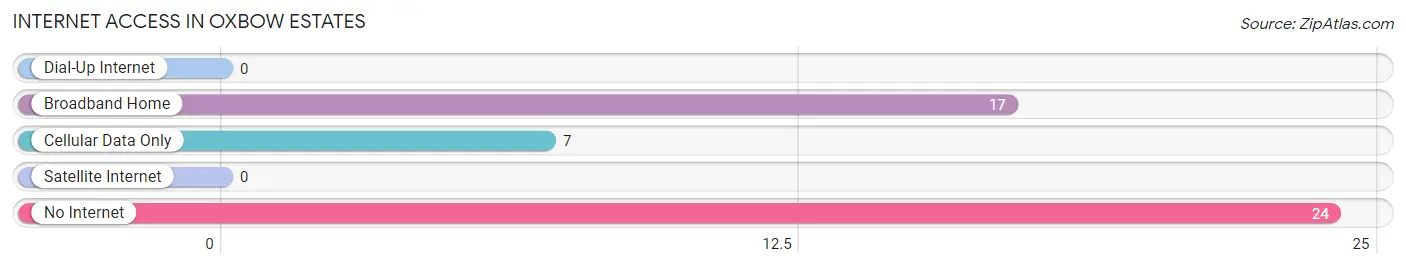
| Internet Type | # Households | % Households |
| Dial-Up Internet | 0 | 0.0% |
| Broadband Home | 17 | 35.4% |
| Cellular Data Only | 7 | 14.6% |
| Satellite Internet | 0 | 0.0% |
| No Internet | 24 | 50.0% |
| Total | 48 | 100.0% |
Oxbow Estates Summary
History
The area now known as Oxbow Estates, Arizona was first inhabited by the Hohokam people, who lived in the area from around 300 BCE to 1450 CE. The Hohokam were a semi-nomadic people who lived in small villages and farmed the land. They were known for their irrigation systems, which allowed them to grow crops in the desert.
The area was later inhabited by the Pima and Tohono O’odham tribes, who lived in the area until the late 19th century. The area was then settled by Anglo-American settlers in the late 19th century. The area was originally known as “Oxbow”, after the oxbow-shaped bend in the Santa Cruz River.
In the early 20th century, the area was developed as a farming community. The area was known for its citrus groves and other crops. The area was also home to a number of small businesses, including a general store, a post office, and a school.
In the late 20th century, the area began to be developed as a residential community. The area was annexed by the City of Tucson in the late 1990s, and the area was re-named “Oxbow Estates”.
Geography
Oxbow Estates is located in the Sonoran Desert in southern Arizona. The area is located in Pima County, and is bordered by the cities of Tucson, Marana, and Oro Valley. The area is located at an elevation of 2,000 feet, and has an average annual temperature of 73 degrees Fahrenheit.
The area is characterized by its desert landscape, with cacti, mesquite trees, and other desert vegetation. The area is also home to a variety of wildlife, including coyotes, bobcats, and javelinas.
Economy
The economy of Oxbow Estates is largely based on the service industry. The area is home to a number of restaurants, retail stores, and other businesses. The area is also home to a number of medical facilities, including a hospital and a number of clinics.
The area is also home to a number of manufacturing and industrial businesses. The area is home to a number of technology companies, as well as a number of aerospace and defense contractors.
Demographics
As of the 2010 census, the population of Oxbow Estates was 8,945. The population is largely white (77.3%), with a small Hispanic population (14.2%). The median household income is $60,945, and the median home value is $220,000.
The area is largely residential, with a small commercial district. The area is home to a number of parks and recreational facilities, including a golf course and a number of hiking trails. The area is also home to a number of schools, including a public elementary school and a public high school.
Common Questions
What is Per Capita Income in Oxbow Estates?
Per Capita income in Oxbow Estates is $38,381.
What is the Median Family Income in Oxbow Estates?
Median Family Income in Oxbow Estates is $58,889.
What is the Median Household income in Oxbow Estates?
Median Household Income in Oxbow Estates is $68,750.
What is Inequality or Gini Index in Oxbow Estates?
Inequality or Gini Index in Oxbow Estates is 0.15.
What is the Total Population of Oxbow Estates?
Total Population of Oxbow Estates is 110.
What is the Total Male Population of Oxbow Estates?
Total Male Population of Oxbow Estates is 72.
What is the Total Female Population of Oxbow Estates?
Total Female Population of Oxbow Estates is 38.
What is the Ratio of Males per 100 Females in Oxbow Estates?
There are 189.47 Males per 100 Females in Oxbow Estates.
What is the Ratio of Females per 100 Males in Oxbow Estates?
There are 52.78 Females per 100 Males in Oxbow Estates.
What is the Median Population Age in Oxbow Estates?
Median Population Age in Oxbow Estates is 61.4 Years.
What is the Average Family Size in Oxbow Estates
Average Family Size in Oxbow Estates is 2.1 People.
What is the Average Household Size in Oxbow Estates
Average Household Size in Oxbow Estates is 2.3 People.
How Large is the Labor Force in Oxbow Estates?
There are 66 People in the Labor Forcein in Oxbow Estates.
What is the Percentage of People in the Labor Force in Oxbow Estates?
60.0% of People are in the Labor Force in Oxbow Estates.