Kansas, AL Map & Demographics
Kansas Map
Kansas Overview
$24,413
PER CAPITA INCOME
$73,750
AVG FAMILY INCOME
$40,833
AVG HOUSEHOLD INCOME
0.41
INEQUALITY / GINI INDEX
109
TOTAL POPULATION
52
MALE POPULATION
57
FEMALE POPULATION
91.23
MALES / 100 FEMALES
109.62
FEMALES / 100 MALES
59.9
MEDIAN AGE
2.6
AVG FAMILY SIZE
1.9
AVG HOUSEHOLD SIZE
46
LABOR FORCE [ PEOPLE ]
45.1%
PERCENT IN LABOR FORCE
Kansas Zip Codes
Kansas Area Codes
Income in Kansas
Income Overview in Kansas
Per Capita Income in Kansas is $24,413, while median incomes of families and households are $73,750 and $40,833 respectively.
| Characteristic | Number | Measure |
| Per Capita Income | 109 | $24,413 |
| Median Family Income | 31 | $73,750 |
| Mean Family Income | 31 | $63,345 |
| Median Household Income | 58 | $40,833 |
| Mean Household Income | 58 | $44,447 |
| Income Deficit | 31 | $0 |
| Wage / Income Gap (%) | 109 | 0.00% |
| Wage / Income Gap ($) | 109 | 100.00¢ per $1 |
| Gini / Inequality Index | 109 | 0.41 |
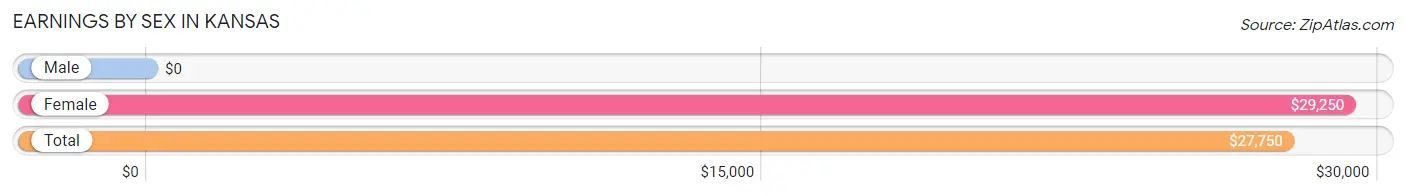
Earnings by Sex in Kansas
| Sex | Number | Average Earnings |
| Male | 26 (53.1%) | $0 |
| Female | 23 (46.9%) | $29,250 |
| Total | 49 (100.0%) | $27,750 |
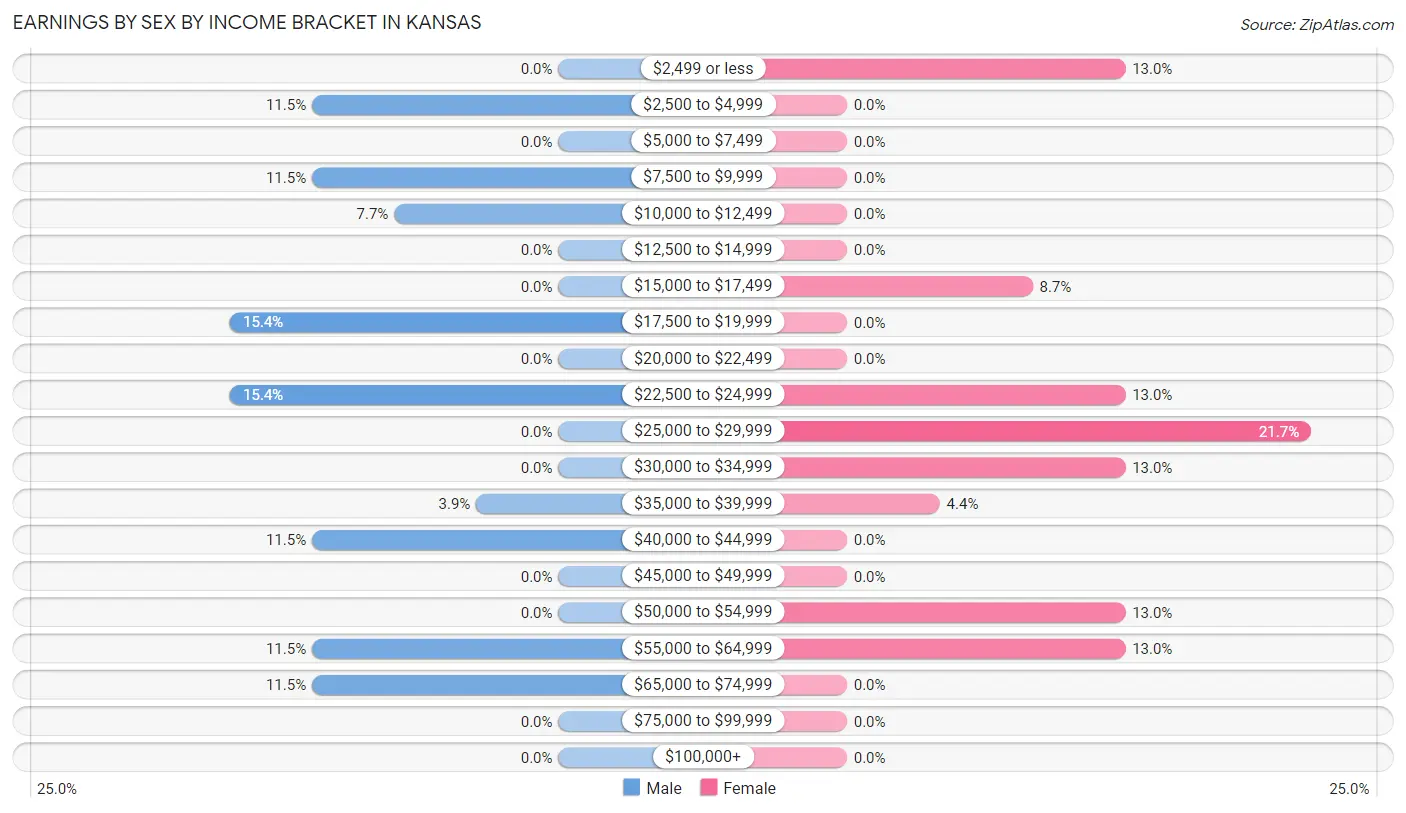
Earnings by Sex by Income Bracket in Kansas
The most common earnings brackets in Kansas are $17,500 to $19,999 for men (4 | 15.4%) and $25,000 to $29,999 for women (5 | 21.7%).
| Income | Male | Female |
| $2,499 or less | 0 (0.0%) | 3 (13.0%) |
| $2,500 to $4,999 | 3 (11.5%) | 0 (0.0%) |
| $5,000 to $7,499 | 0 (0.0%) | 0 (0.0%) |
| $7,500 to $9,999 | 3 (11.5%) | 0 (0.0%) |
| $10,000 to $12,499 | 2 (7.7%) | 0 (0.0%) |
| $12,500 to $14,999 | 0 (0.0%) | 0 (0.0%) |
| $15,000 to $17,499 | 0 (0.0%) | 2 (8.7%) |
| $17,500 to $19,999 | 4 (15.4%) | 0 (0.0%) |
| $20,000 to $22,499 | 0 (0.0%) | 0 (0.0%) |
| $22,500 to $24,999 | 4 (15.4%) | 3 (13.0%) |
| $25,000 to $29,999 | 0 (0.0%) | 5 (21.7%) |
| $30,000 to $34,999 | 0 (0.0%) | 3 (13.0%) |
| $35,000 to $39,999 | 1 (3.8%) | 1 (4.3%) |
| $40,000 to $44,999 | 3 (11.5%) | 0 (0.0%) |
| $45,000 to $49,999 | 0 (0.0%) | 0 (0.0%) |
| $50,000 to $54,999 | 0 (0.0%) | 3 (13.0%) |
| $55,000 to $64,999 | 3 (11.5%) | 3 (13.0%) |
| $65,000 to $74,999 | 3 (11.5%) | 0 (0.0%) |
| $75,000 to $99,999 | 0 (0.0%) | 0 (0.0%) |
| $100,000+ | 0 (0.0%) | 0 (0.0%) |
| Total | 26 (100.0%) | 23 (100.0%) |
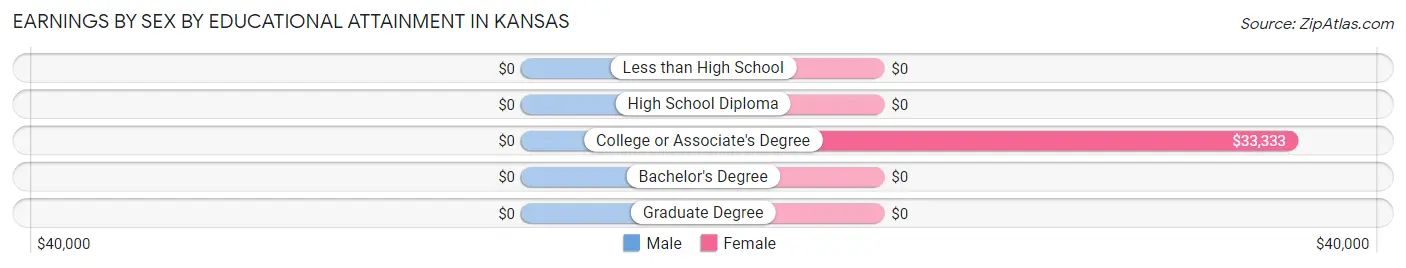
Earnings by Sex by Educational Attainment in Kansas
| Educational Attainment | Male Income | Female Income |
| Less than High School | - | - |
| High School Diploma | - | - |
| College or Associate's Degree | - | - |
| Bachelor's Degree | - | - |
| Graduate Degree | - | - |
| Total | $36,250 | $31,250 |
Family Income in Kansas
Family Income Brackets in Kansas
According to the Kansas family income data, there are 12 families falling into the $75,000 to $99,999 income range, which is the most common income bracket and makes up 38.7% of all families.
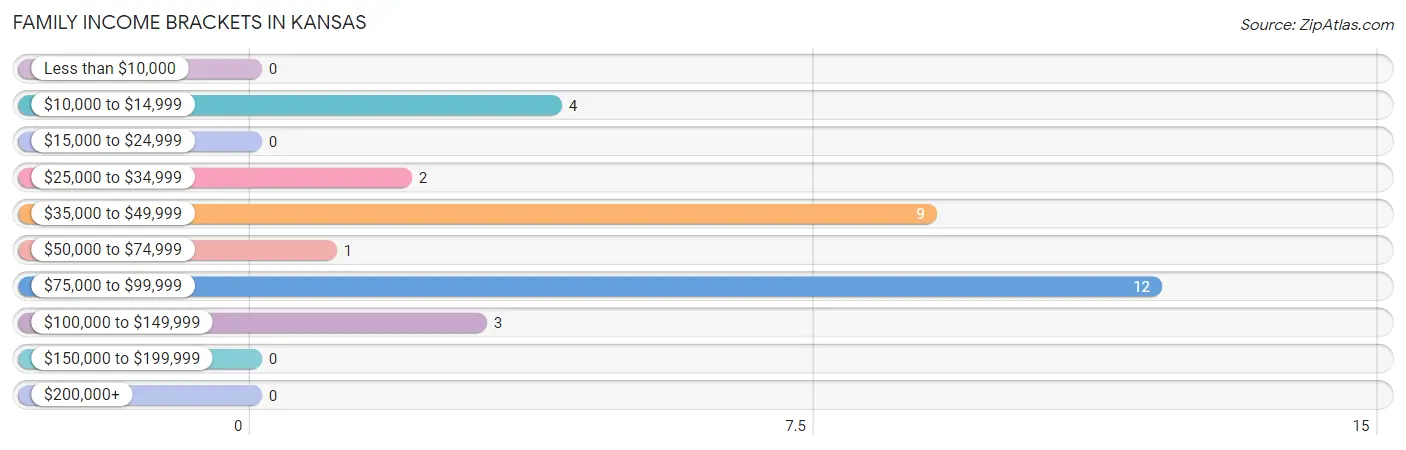
| Income Bracket | # Families | % Families |
| Less than $10,000 | 0 | 0.0% |
| $10,000 to $14,999 | 4 | 12.9% |
| $15,000 to $24,999 | 0 | 0.0% |
| $25,000 to $34,999 | 2 | 6.5% |
| $35,000 to $49,999 | 9 | 29.0% |
| $50,000 to $74,999 | 1 | 3.2% |
| $75,000 to $99,999 | 12 | 38.7% |
| $100,000 to $149,999 | 3 | 9.7% |
| $150,000 to $199,999 | 0 | 0.0% |
| $200,000+ | 0 | 0.0% |
Family Income by Famaliy Size in Kansas
2-person families (24 | 77.4%) account for the highest median family income in Kansas with $65,000 per family, while 2-person families (24 | 77.4%) have the highest median income of $32,500 per family member.
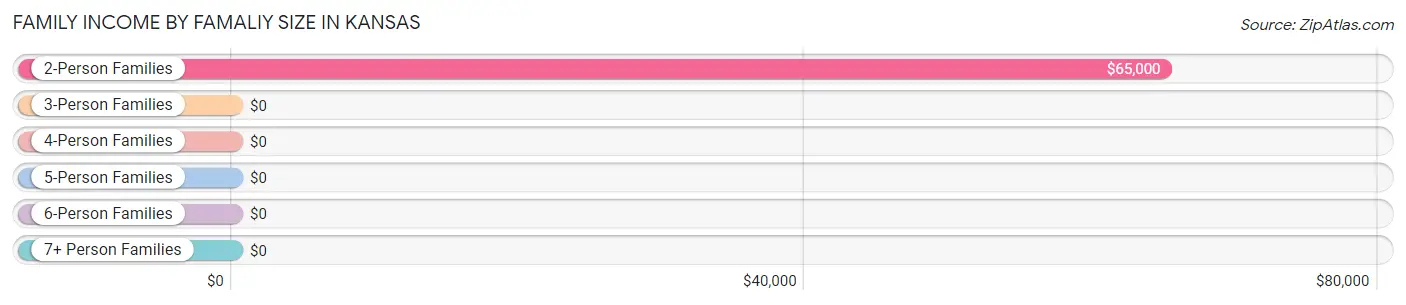
| Income Bracket | # Families | Median Income |
| 2-Person Families | 24 (77.4%) | $65,000 |
| 3-Person Families | 3 (9.7%) | $0 |
| 4-Person Families | 1 (3.2%) | $0 |
| 5-Person Families | 3 (9.7%) | $0 |
| 6-Person Families | 0 (0.0%) | $0 |
| 7+ Person Families | 0 (0.0%) | $0 |
| Total | 31 (100.0%) | $73,750 |
Family Income by Number of Earners in Kansas
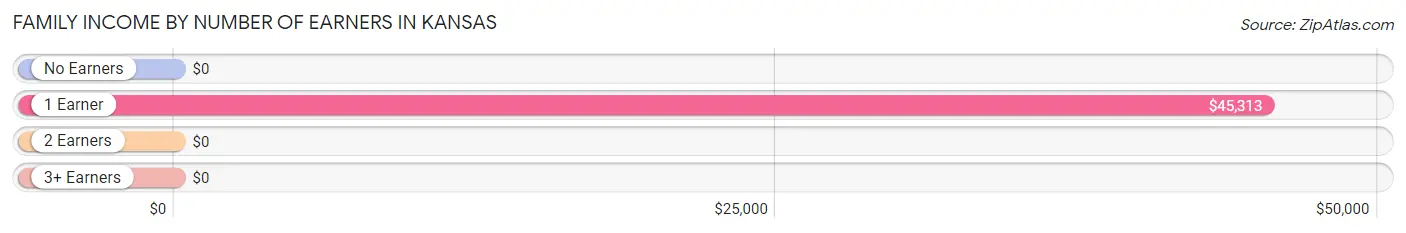
| Number of Earners | # Families | Median Income |
| No Earners | 10 (32.3%) | $0 |
| 1 Earner | 11 (35.5%) | $45,313 |
| 2 Earners | 7 (22.6%) | $0 |
| 3+ Earners | 3 (9.7%) | $0 |
| Total | 31 (100.0%) | $73,750 |
Household Income in Kansas
Household Income Brackets in Kansas
With 12 households falling in the category, the $15,000 to $24,999 income range is the most frequent in Kansas, accounting for 20.7% of all households.
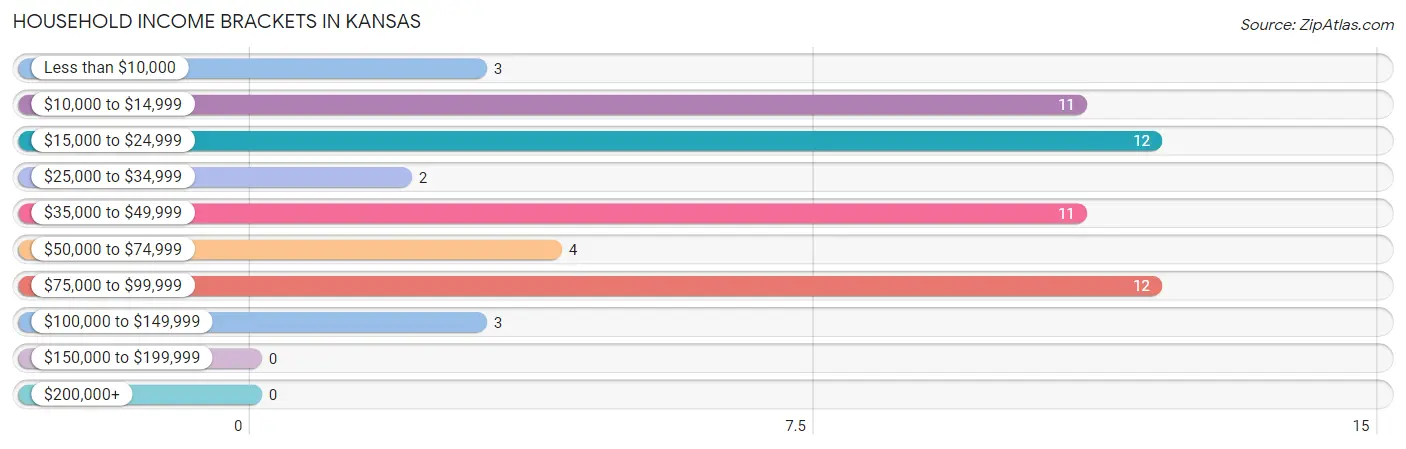
| Income Bracket | # Households | % Households |
| Less than $10,000 | 3 | 5.2% |
| $10,000 to $14,999 | 11 | 19.0% |
| $15,000 to $24,999 | 12 | 20.7% |
| $25,000 to $34,999 | 2 | 3.4% |
| $35,000 to $49,999 | 11 | 19.0% |
| $50,000 to $74,999 | 4 | 6.9% |
| $75,000 to $99,999 | 12 | 20.7% |
| $100,000 to $149,999 | 3 | 5.2% |
| $150,000 to $199,999 | 0 | 0.0% |
| $200,000+ | 0 | 0.0% |
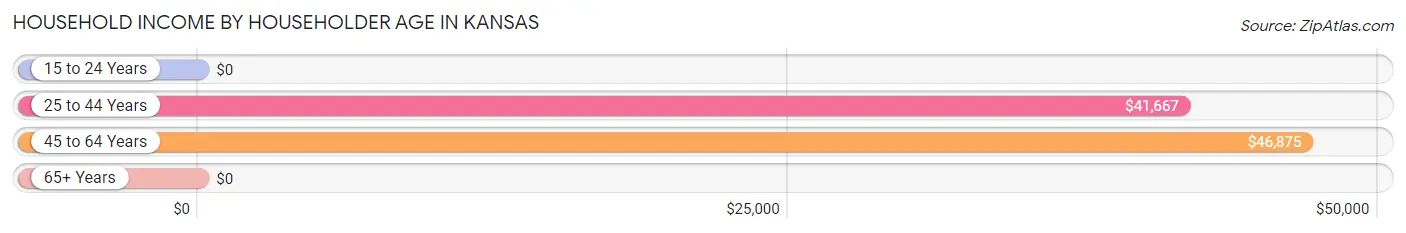
Household Income by Householder Age in Kansas
The median household income in Kansas is $40,833, with the highest median household income of $46,875 found in the 45 to 64 years age bracket for the primary householder. A total of 20 households (34.5%) fall into this category.
| Income Bracket | # Households | Median Income |
| 15 to 24 Years | 0 (0.0%) | $0 |
| 25 to 44 Years | 10 (17.2%) | $41,667 |
| 45 to 64 Years | 20 (34.5%) | $46,875 |
| 65+ Years | 28 (48.3%) | $0 |
| Total | 58 (100.0%) | $40,833 |
Poverty in Kansas
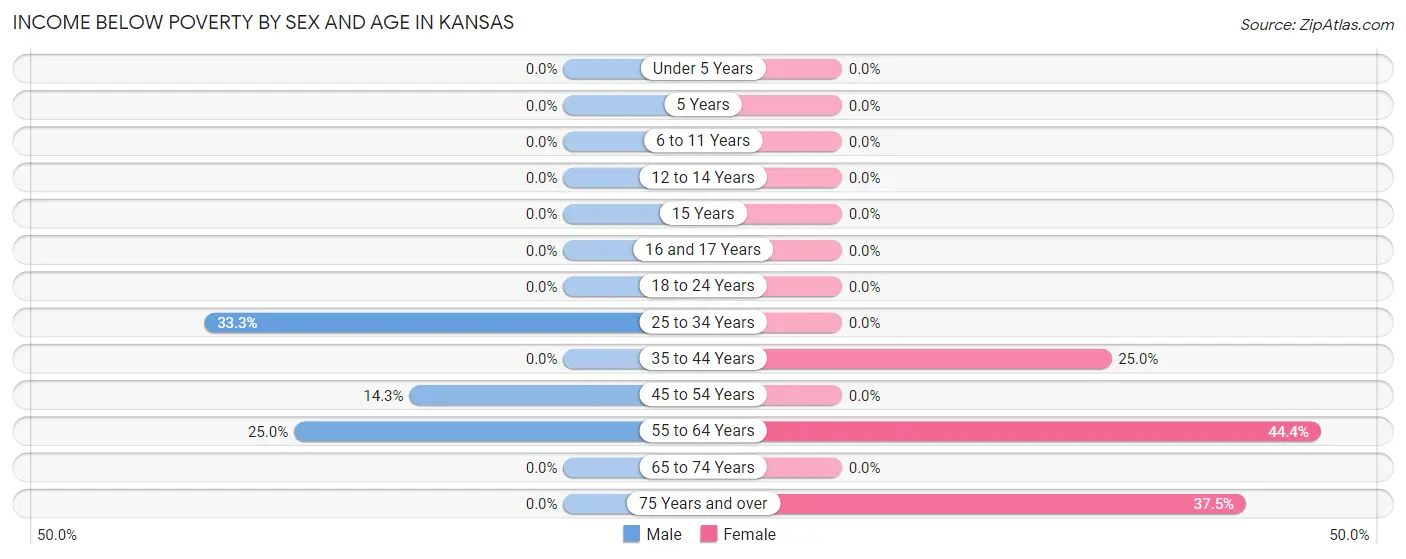
Income Below Poverty by Sex and Age in Kansas
With 13.5% poverty level for males and 19.3% for females among the residents of Kansas, 25 to 34 year old males and 55 to 64 year old females are the most vulnerable to poverty, with 3 males (33.3%) and 4 females (44.4%) in their respective age groups living below the poverty level.
| Age Bracket | Male | Female |
| Under 5 Years | 0 (0.0%) | 0 (0.0%) |
| 5 Years | 0 (0.0%) | 0 (0.0%) |
| 6 to 11 Years | 0 (0.0%) | 0 (0.0%) |
| 12 to 14 Years | 0 (0.0%) | 0 (0.0%) |
| 15 Years | 0 (0.0%) | 0 (0.0%) |
| 16 and 17 Years | 0 (0.0%) | 0 (0.0%) |
| 18 to 24 Years | 0 (0.0%) | 0 (0.0%) |
| 25 to 34 Years | 3 (33.3%) | 0 (0.0%) |
| 35 to 44 Years | 0 (0.0%) | 1 (25.0%) |
| 45 to 54 Years | 1 (14.3%) | 0 (0.0%) |
| 55 to 64 Years | 3 (25.0%) | 4 (44.4%) |
| 65 to 74 Years | 0 (0.0%) | 0 (0.0%) |
| 75 Years and over | 0 (0.0%) | 6 (37.5%) |
| Total | 7 (13.5%) | 11 (19.3%) |
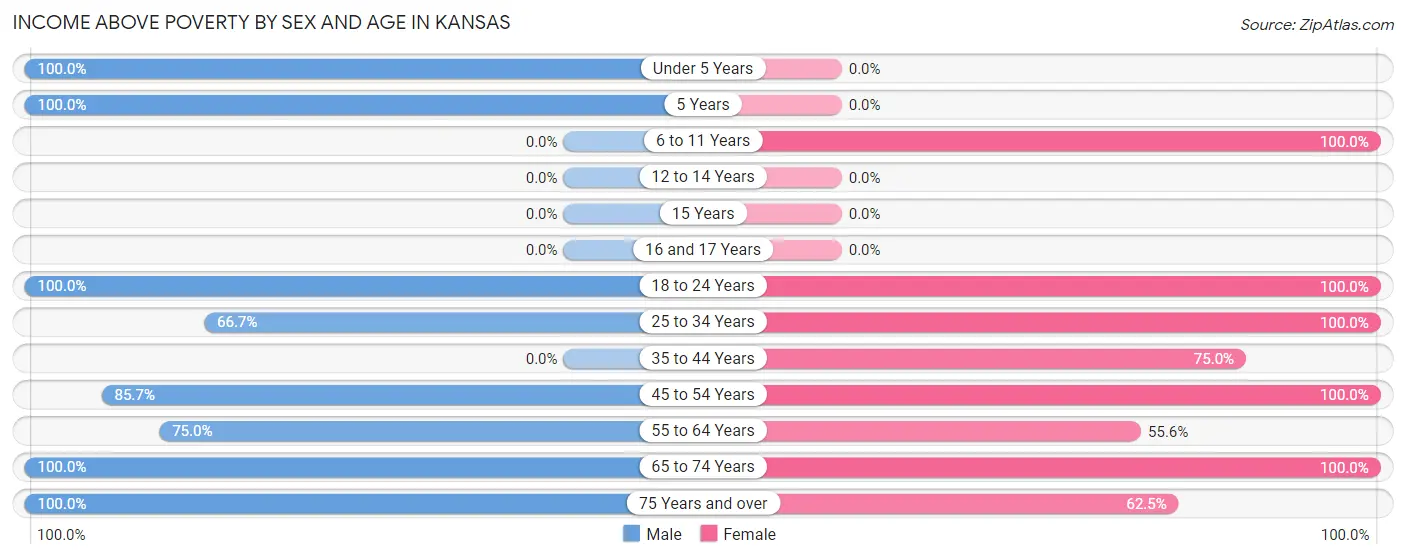
Income Above Poverty by Sex and Age in Kansas
According to the poverty statistics in Kansas, males aged under 5 years and females aged 6 to 11 years are the age groups that are most secure financially, with 100.0% of males and 100.0% of females in these age groups living above the poverty line.
| Age Bracket | Male | Female |
| Under 5 Years | 4 (100.0%) | 0 (0.0%) |
| 5 Years | 2 (100.0%) | 0 (0.0%) |
| 6 to 11 Years | 0 (0.0%) | 1 (100.0%) |
| 12 to 14 Years | 0 (0.0%) | 0 (0.0%) |
| 15 Years | 0 (0.0%) | 0 (0.0%) |
| 16 and 17 Years | 0 (0.0%) | 0 (0.0%) |
| 18 to 24 Years | 7 (100.0%) | 5 (100.0%) |
| 25 to 34 Years | 6 (66.7%) | 4 (100.0%) |
| 35 to 44 Years | 0 (0.0%) | 3 (75.0%) |
| 45 to 54 Years | 6 (85.7%) | 3 (100.0%) |
| 55 to 64 Years | 9 (75.0%) | 5 (55.6%) |
| 65 to 74 Years | 9 (100.0%) | 15 (100.0%) |
| 75 Years and over | 2 (100.0%) | 10 (62.5%) |
| Total | 45 (86.5%) | 46 (80.7%) |
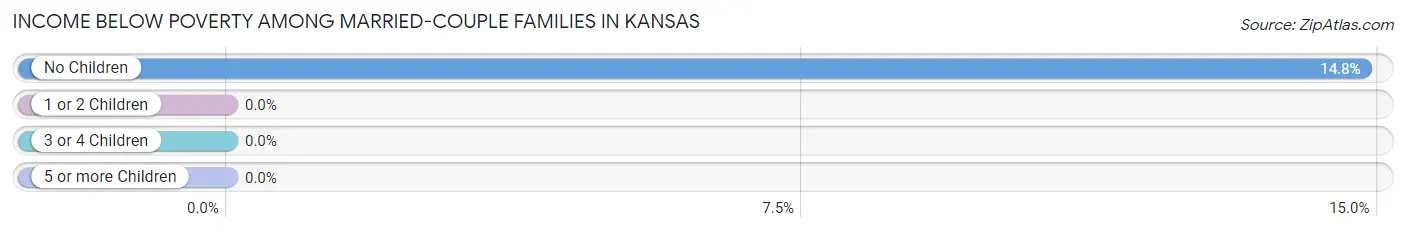
Income Below Poverty Among Married-Couple Families in Kansas
The poverty statistics for married-couple families in Kansas show that 12.9% or 4 of the total 31 families live below the poverty line. Families with no children have the highest poverty rate of 14.8%, comprising of 4 families. On the other hand, families with 1 or 2 children have the lowest poverty rate of 0.0%, which includes 0 families.
| Children | Above Poverty | Below Poverty |
| No Children | 23 (85.2%) | 4 (14.8%) |
| 1 or 2 Children | 4 (100.0%) | 0 (0.0%) |
| 3 or 4 Children | 0 (0.0%) | 0 (0.0%) |
| 5 or more Children | 0 (0.0%) | 0 (0.0%) |
| Total | 27 (87.1%) | 4 (12.9%) |
Income Below Poverty Among Single-Parent Households in Kansas
| Children | Single Father | Single Mother |
| No Children | 0 (0.0%) | 0 (0.0%) |
| 1 or 2 Children | 0 (0.0%) | 0 (0.0%) |
| 3 or 4 Children | 0 (0.0%) | 0 (0.0%) |
| 5 or more Children | 0 (0.0%) | 0 (0.0%) |
| Total | 0 (0.0%) | 0 (0.0%) |
Income Below Poverty Among Married-Couple vs Single-Parent Households in Kansas
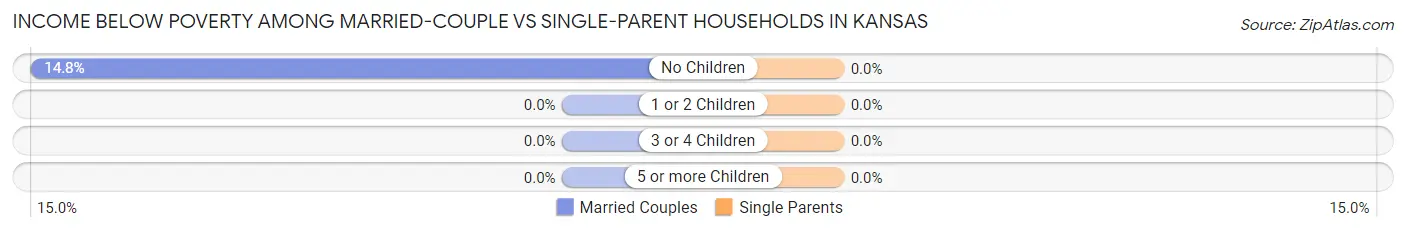
| Children | Married-Couple Families | Single-Parent Households |
| No Children | 4 (14.8%) | 0 (0.0%) |
| 1 or 2 Children | 0 (0.0%) | 0 (0.0%) |
| 3 or 4 Children | 0 (0.0%) | 0 (0.0%) |
| 5 or more Children | 0 (0.0%) | 0 (0.0%) |
| Total | 4 (12.9%) | 0 (0.0%) |
Race in Kansas
The most populous races in Kansas are , and White / Caucasian (109 | 100.0%).
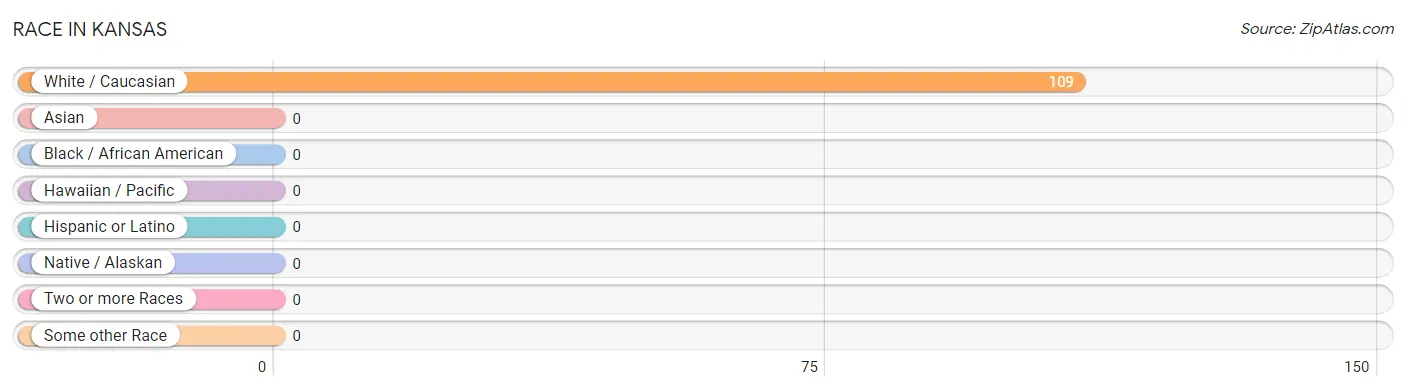
| Race | # Population | % Population |
| Asian | 0 | 0.0% |
| Black / African American | 0 | 0.0% |
| Hawaiian / Pacific | 0 | 0.0% |
| Hispanic or Latino | 0 | 0.0% |
| Native / Alaskan | 0 | 0.0% |
| White / Caucasian | 109 | 100.0% |
| Two or more Races | 0 | 0.0% |
| Some other Race | 0 | 0.0% |
| Total | 109 | 100.0% |
Ancestry in Kansas
The most populous ancestries reported in Kansas are American (30 | 27.5%), English (25 | 22.9%), Irish (16 | 14.7%), German (12 | 11.0%), and Italian (5 | 4.6%), together accounting for 80.7% of all Kansas residents.
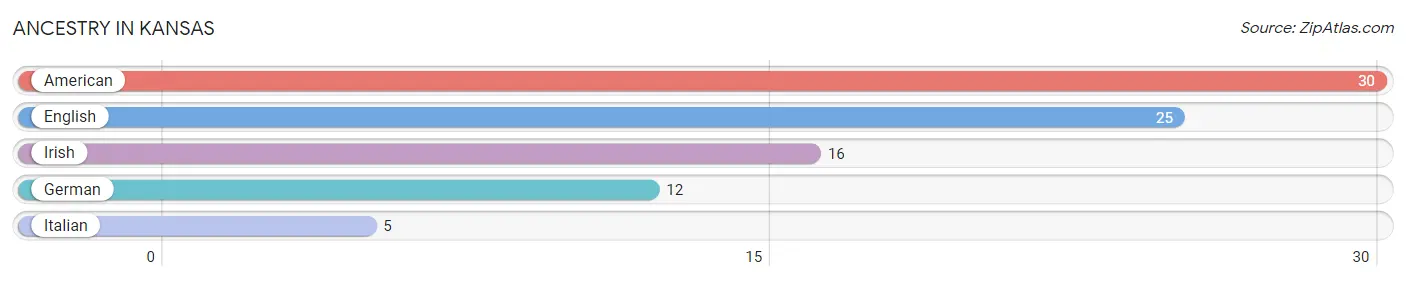
| Ancestry | # Population | % Population |
| American | 30 | 27.5% |
| English | 25 | 22.9% |
| German | 12 | 11.0% |
| Irish | 16 | 14.7% |
| Italian | 5 | 4.6% | View All 5 Rows |
Immigrants in Kansas

| Immigration Origin | # Population | % Population | View All 0 Rows |
Sex and Age in Kansas
Sex and Age in Kansas
The most populous age groups in Kansas are 65 to 69 Years (9 | 17.3%) for men and 65 to 69 Years (13 | 22.8%) for women.
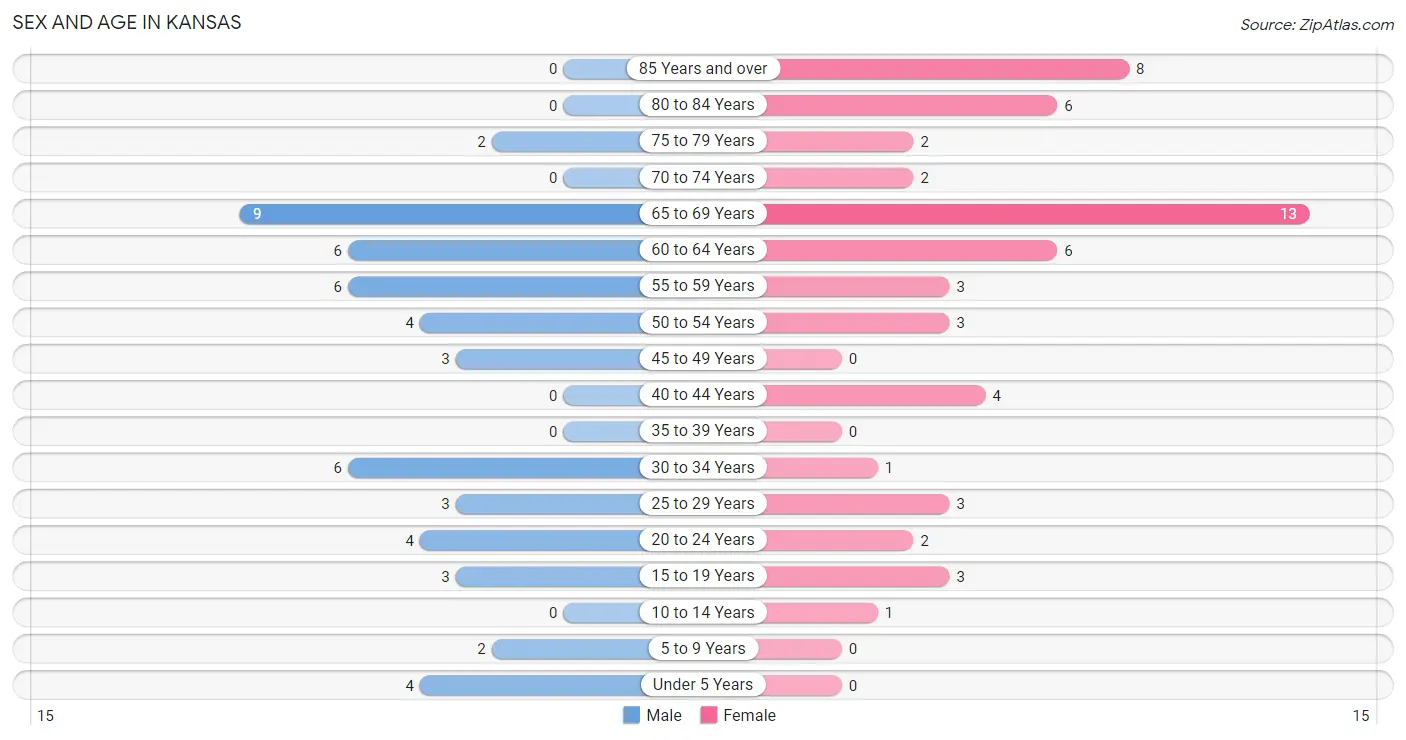
| Age Bracket | Male | Female |
| Under 5 Years | 4 (7.7%) | 0 (0.0%) |
| 5 to 9 Years | 2 (3.8%) | 0 (0.0%) |
| 10 to 14 Years | 0 (0.0%) | 1 (1.8%) |
| 15 to 19 Years | 3 (5.8%) | 3 (5.3%) |
| 20 to 24 Years | 4 (7.7%) | 2 (3.5%) |
| 25 to 29 Years | 3 (5.8%) | 3 (5.3%) |
| 30 to 34 Years | 6 (11.5%) | 1 (1.8%) |
| 35 to 39 Years | 0 (0.0%) | 0 (0.0%) |
| 40 to 44 Years | 0 (0.0%) | 4 (7.0%) |
| 45 to 49 Years | 3 (5.8%) | 0 (0.0%) |
| 50 to 54 Years | 4 (7.7%) | 3 (5.3%) |
| 55 to 59 Years | 6 (11.5%) | 3 (5.3%) |
| 60 to 64 Years | 6 (11.5%) | 6 (10.5%) |
| 65 to 69 Years | 9 (17.3%) | 13 (22.8%) |
| 70 to 74 Years | 0 (0.0%) | 2 (3.5%) |
| 75 to 79 Years | 2 (3.8%) | 2 (3.5%) |
| 80 to 84 Years | 0 (0.0%) | 6 (10.5%) |
| 85 Years and over | 0 (0.0%) | 8 (14.0%) |
| Total | 52 (100.0%) | 57 (100.0%) |
Families and Households in Kansas
Median Family Size in Kansas
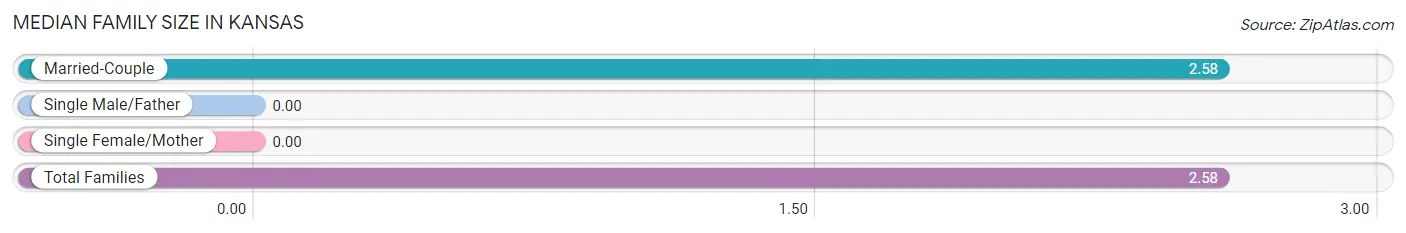
| Family Type | # Families | Family Size |
| Married-Couple | 31 (100.0%) | 2.58 |
| Single Male/Father | 0 (0.0%) | - |
| Single Female/Mother | 0 (0.0%) | - |
| Total Families | 31 (100.0%) | 2.58 |
Median Household Size in Kansas
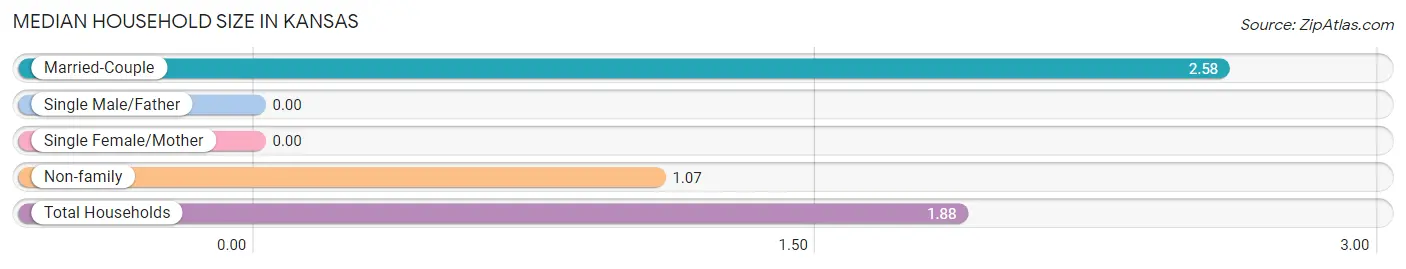
| Household Type | # Households | Household Size |
| Married-Couple | 31 (53.4%) | 2.58 |
| Single Male/Father | 0 (0.0%) | - |
| Single Female/Mother | 0 (0.0%) | - |
| Non-family | 27 (46.6%) | 1.07 |
| Total Households | 58 (100.0%) | 1.88 |
Household Size by Marriage Status in Kansas
Out of a total of 58 households in Kansas, 31 (53.4%) are family households, while 27 (46.6%) are nonfamily households. The most numerous type of family households are 2-person households, comprising 24, and the most common type of nonfamily households are 1-person households, comprising 24.
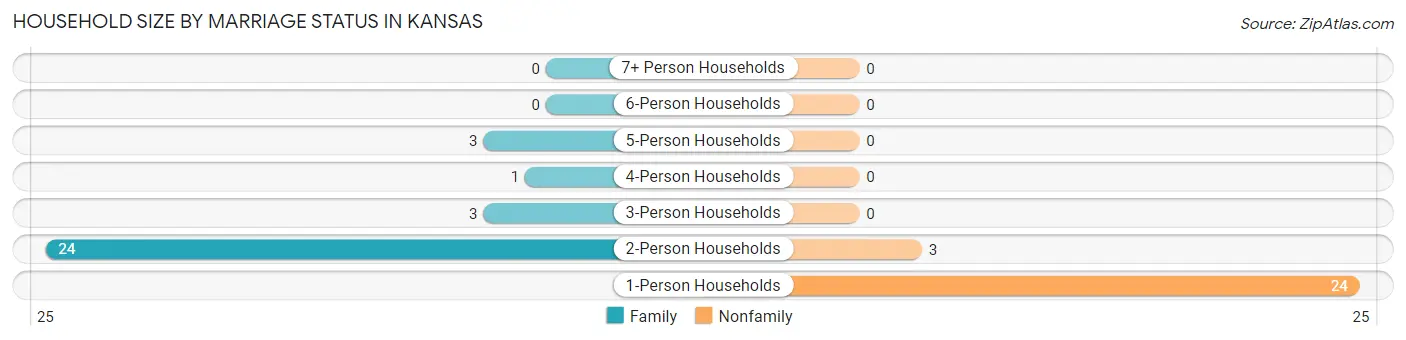
| Household Size | Family Households | Nonfamily Households |
| 1-Person Households | - | 24 (41.4%) |
| 2-Person Households | 24 (41.4%) | 3 (5.2%) |
| 3-Person Households | 3 (5.2%) | 0 (0.0%) |
| 4-Person Households | 1 (1.7%) | 0 (0.0%) |
| 5-Person Households | 3 (5.2%) | 0 (0.0%) |
| 6-Person Households | 0 (0.0%) | 0 (0.0%) |
| 7+ Person Households | 0 (0.0%) | 0 (0.0%) |
| Total | 31 (53.4%) | 27 (46.6%) |
Female Fertility in Kansas
Fertility by Age in Kansas
| Age Bracket | Women with Births | Births / 1,000 Women |
| 15 to 19 years | 0 (0.0%) | 0.0 |
| 20 to 34 years | 0 (0.0%) | 0.0 |
| 35 to 50 years | 0 (0.0%) | 0.0 |
| Total | 0 (0.0%) | 0.0 |
Fertility by Age by Marriage Status in Kansas
| Age Bracket | Married | Unmarried |
| 15 to 19 years | 0 (0.0%) | 0 (0.0%) |
| 20 to 34 years | 0 (0.0%) | 0 (0.0%) |
| 35 to 50 years | 0 (0.0%) | 0 (0.0%) |
| Total | 0 (0.0%) | 0 (0.0%) |
Fertility by Education in Kansas
| Educational Attainment | Women with Births | Births / 1,000 Women |
| Less than High School | 0 (0.0%) | 0.0 |
| High School Diploma | 0 (0.0%) | 0.0 |
| College or Associate's Degree | 0 (0.0%) | 0.0 |
| Bachelor's Degree | 0 (0.0%) | 0.0 |
| Graduate Degree | 0 (0.0%) | 0.0 |
| Total | 0 (0.0%) | 0.0 |
Fertility by Education by Marriage Status in Kansas
| Educational Attainment | Married | Unmarried |
| Less than High School | 0 (0.0%) | 0 (0.0%) |
| High School Diploma | 0 (0.0%) | 0 (0.0%) |
| College or Associate's Degree | 0 (0.0%) | 0 (0.0%) |
| Bachelor's Degree | 0 (0.0%) | 0 (0.0%) |
| Graduate Degree | 0 (0.0%) | 0 (0.0%) |
| Total | 0 (0.0%) | 0 (0.0%) |
Employment Characteristics in Kansas
Employment by Class of Employer in Kansas
Among the 46 employed individuals in Kansas, private company employees (29 | 63.0%), not-for-profit organizations (5 | 10.9%), and self-employed (not incorporated) (4 | 8.7%) make up the most common classes of employment.
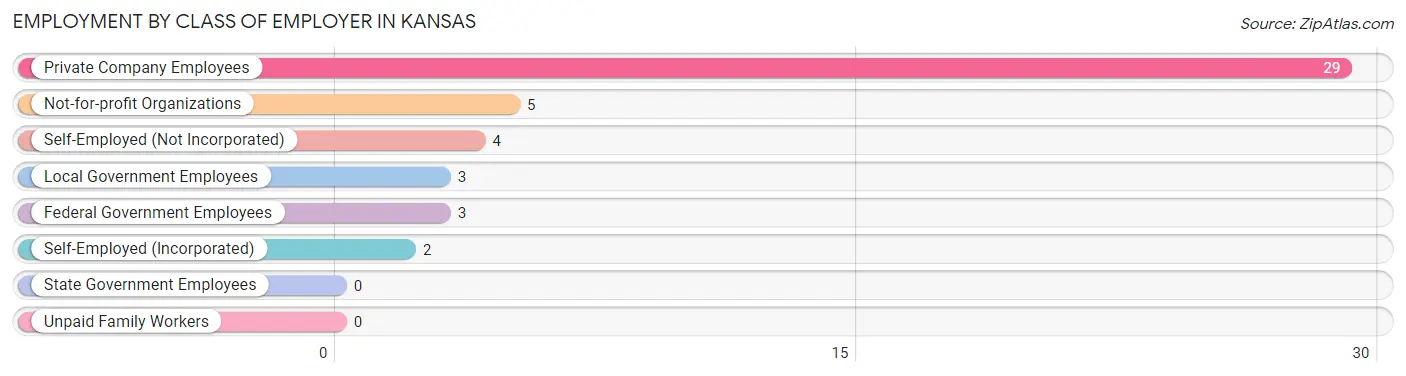
| Employer Class | # Employees | % Employees |
| Private Company Employees | 29 | 63.0% |
| Self-Employed (Incorporated) | 2 | 4.3% |
| Self-Employed (Not Incorporated) | 4 | 8.7% |
| Not-for-profit Organizations | 5 | 10.9% |
| Local Government Employees | 3 | 6.5% |
| State Government Employees | 0 | 0.0% |
| Federal Government Employees | 3 | 6.5% |
| Unpaid Family Workers | 0 | 0.0% |
| Total | 46 | 100.0% |
Employment Status by Age in Kansas
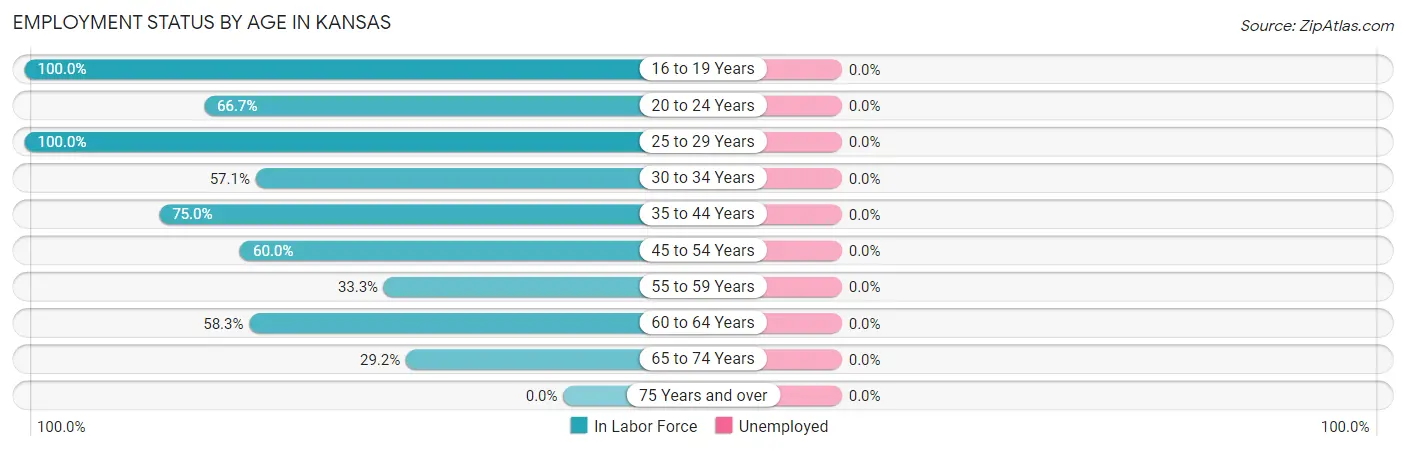
| Age Bracket | In Labor Force | Unemployed |
| 16 to 19 Years | 6 (100.0%) | 0 (0.0%) |
| 20 to 24 Years | 4 (66.7%) | 0 (0.0%) |
| 25 to 29 Years | 6 (100.0%) | 0 (0.0%) |
| 30 to 34 Years | 4 (57.1%) | 0 (0.0%) |
| 35 to 44 Years | 3 (75.0%) | 0 (0.0%) |
| 45 to 54 Years | 6 (60.0%) | 0 (0.0%) |
| 55 to 59 Years | 3 (33.3%) | 0 (0.0%) |
| 60 to 64 Years | 7 (58.3%) | 0 (0.0%) |
| 65 to 74 Years | 7 (29.2%) | 0 (0.0%) |
| 75 Years and over | 0 (0.0%) | 0 (0.0%) |
| Total | 46 (45.1%) | 0 (0.0%) |
Employment Status by Educational Attainment in Kansas
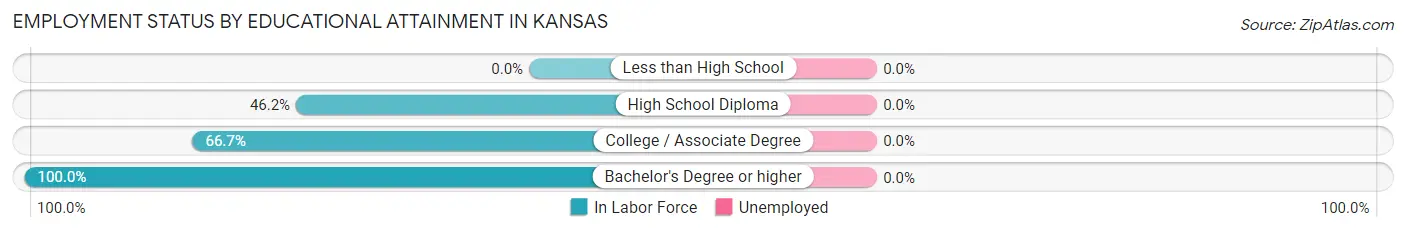
| Educational Attainment | In Labor Force | Unemployed |
| Less than High School | 0 (0.0%) | 0 (0.0%) |
| High School Diploma | 6 (46.2%) | 0 (0.0%) |
| College / Associate Degree | 14 (66.7%) | 0 (0.0%) |
| Bachelor's Degree or higher | 9 (100.0%) | 0 (0.0%) |
| Total | 29 (60.4%) | 0 (0.0%) |
Employment Occupations by Sex in Kansas
Management, Business, Science and Arts Occupations
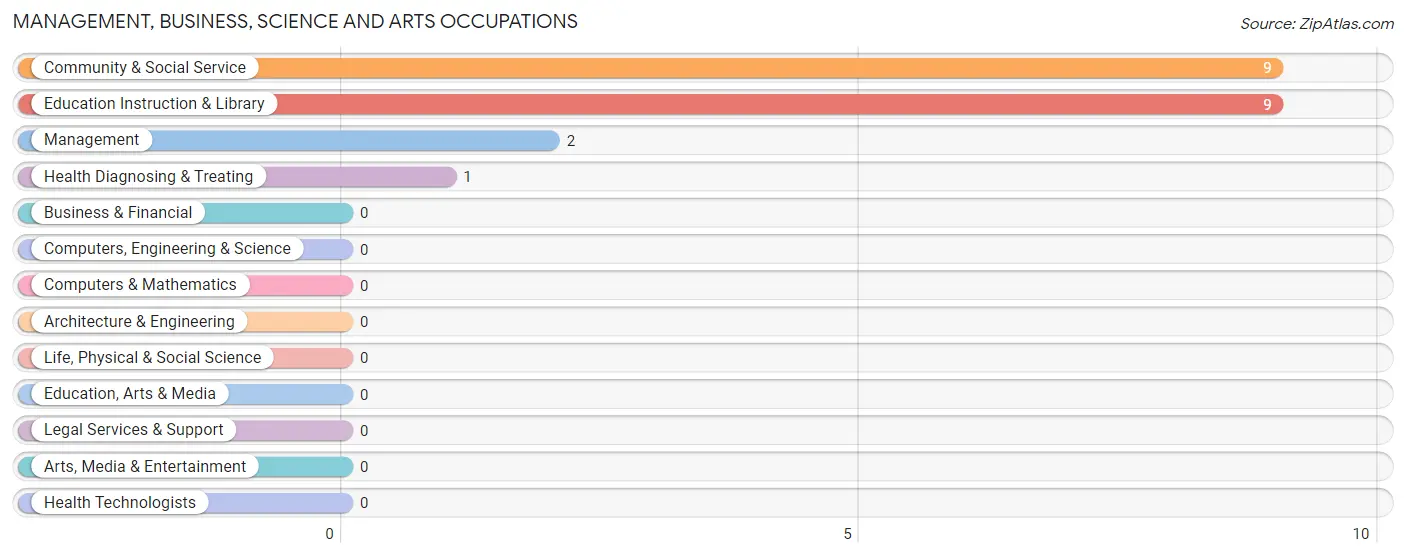
The most common Management, Business, Science and Arts occupations in Kansas are Community & Social Service (9 | 19.6%), Education Instruction & Library (9 | 19.6%), Management (2 | 4.3%), and Health Diagnosing & Treating (1 | 2.2%).
Management, Business, Science and Arts Occupations by Sex
Within the Management, Business, Science and Arts occupations in Kansas, the most male-oriented occupations are Management (100.0%), Community & Social Service (33.3%), and Education Instruction & Library (33.3%), while the most female-oriented occupations are Health Diagnosing & Treating (100.0%), Community & Social Service (66.7%), and Education Instruction & Library (66.7%).
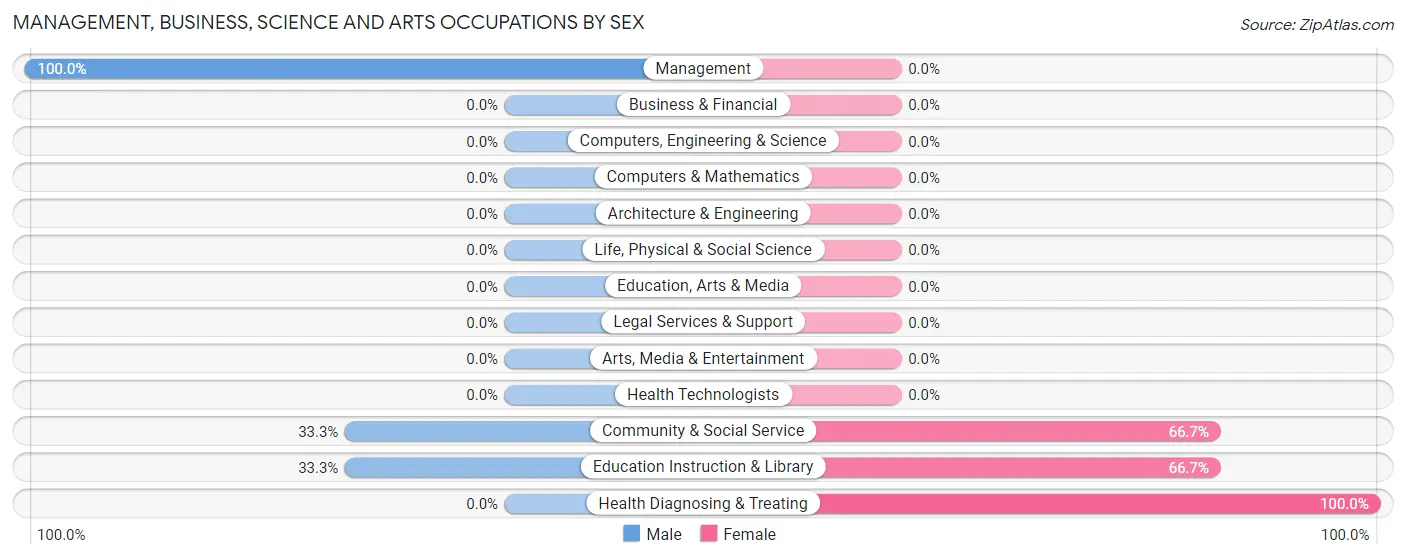
| Occupation | Male | Female |
| Management | 2 (100.0%) | 0 (0.0%) |
| Business & Financial | 0 (0.0%) | 0 (0.0%) |
| Computers, Engineering & Science | 0 (0.0%) | 0 (0.0%) |
| Computers & Mathematics | 0 (0.0%) | 0 (0.0%) |
| Architecture & Engineering | 0 (0.0%) | 0 (0.0%) |
| Life, Physical & Social Science | 0 (0.0%) | 0 (0.0%) |
| Community & Social Service | 3 (33.3%) | 6 (66.7%) |
| Education, Arts & Media | 0 (0.0%) | 0 (0.0%) |
| Legal Services & Support | 0 (0.0%) | 0 (0.0%) |
| Education Instruction & Library | 3 (33.3%) | 6 (66.7%) |
| Arts, Media & Entertainment | 0 (0.0%) | 0 (0.0%) |
| Health Diagnosing & Treating | 0 (0.0%) | 1 (100.0%) |
| Health Technologists | 0 (0.0%) | 0 (0.0%) |
| Total (Category) | 5 (41.7%) | 7 (58.3%) |
| Total (Overall) | 23 (50.0%) | 23 (50.0%) |
Services Occupations
The most common Services occupations in Kansas are Healthcare Support (5 | 10.9%), and Food Preparation & Serving (3 | 6.5%).
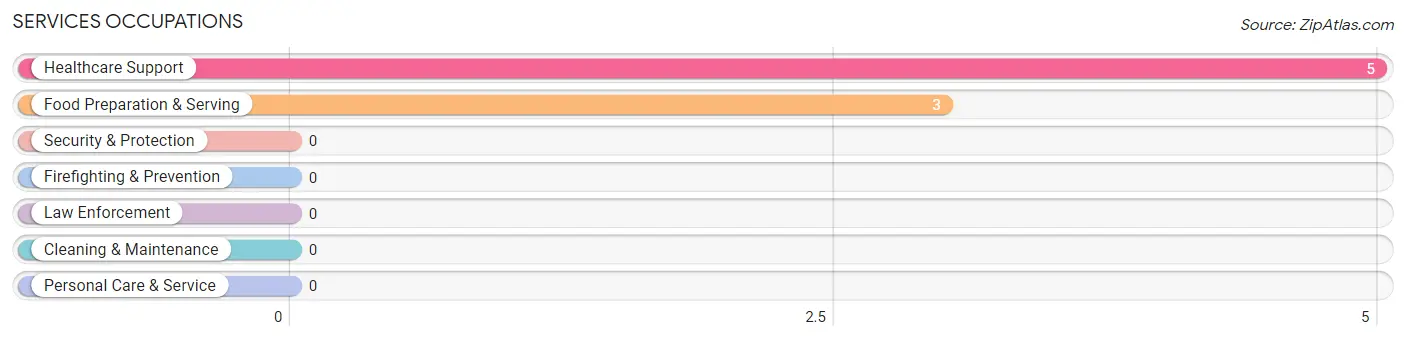
Services Occupations by Sex
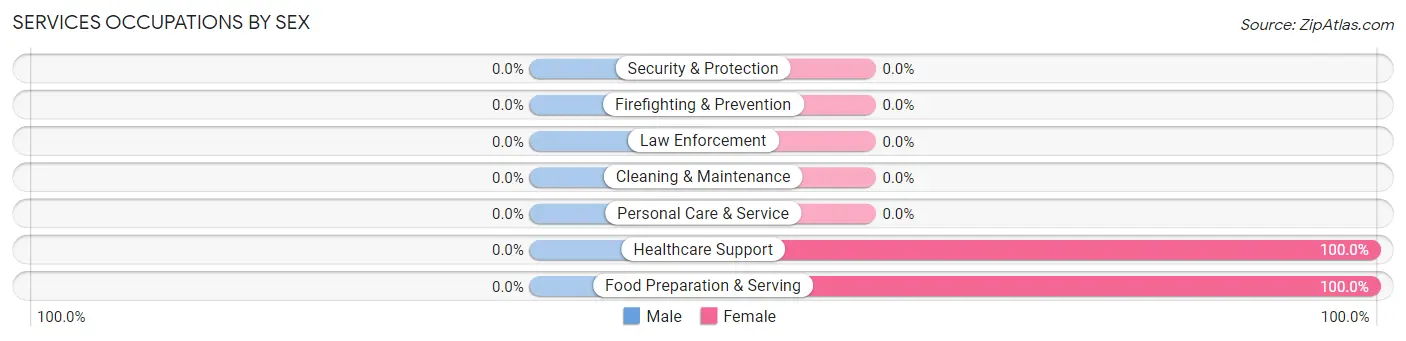
| Occupation | Male | Female |
| Healthcare Support | 0 (0.0%) | 5 (100.0%) |
| Security & Protection | 0 (0.0%) | 0 (0.0%) |
| Firefighting & Prevention | 0 (0.0%) | 0 (0.0%) |
| Law Enforcement | 0 (0.0%) | 0 (0.0%) |
| Food Preparation & Serving | 0 (0.0%) | 3 (100.0%) |
| Cleaning & Maintenance | 0 (0.0%) | 0 (0.0%) |
| Personal Care & Service | 0 (0.0%) | 0 (0.0%) |
| Total (Category) | 0 (0.0%) | 8 (100.0%) |
| Total (Overall) | 23 (50.0%) | 23 (50.0%) |
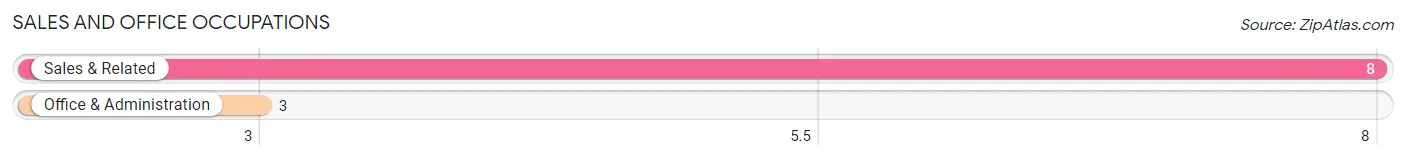
Sales and Office Occupations
The most common Sales and Office occupations in Kansas are Sales & Related (8 | 17.4%), and Office & Administration (3 | 6.5%).
Sales and Office Occupations by Sex
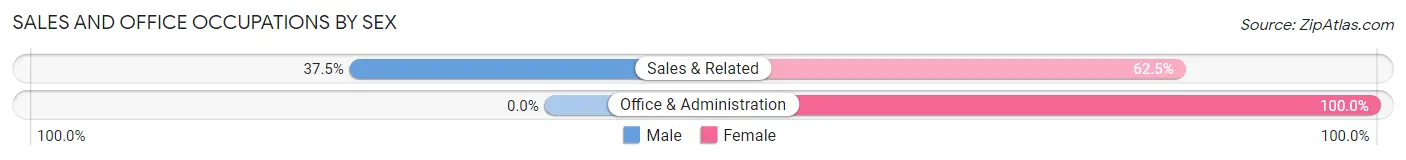
| Occupation | Male | Female |
| Sales & Related | 3 (37.5%) | 5 (62.5%) |
| Office & Administration | 0 (0.0%) | 3 (100.0%) |
| Total (Category) | 3 (27.3%) | 8 (72.7%) |
| Total (Overall) | 23 (50.0%) | 23 (50.0%) |
Natural Resources, Construction and Maintenance Occupations
The most common Natural Resources, Construction and Maintenance occupations in Kansas are Construction & Extraction (2 | 4.3%), and Installation, Maintenance & Repair (1 | 2.2%).
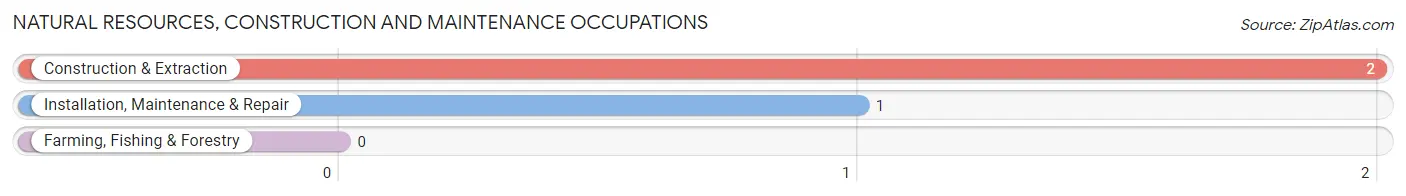
Natural Resources, Construction and Maintenance Occupations by Sex
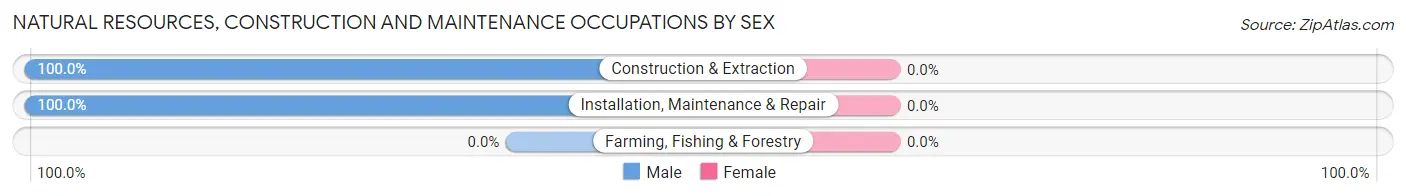
| Occupation | Male | Female |
| Farming, Fishing & Forestry | 0 (0.0%) | 0 (0.0%) |
| Construction & Extraction | 2 (100.0%) | 0 (0.0%) |
| Installation, Maintenance & Repair | 1 (100.0%) | 0 (0.0%) |
| Total (Category) | 3 (100.0%) | 0 (0.0%) |
| Total (Overall) | 23 (50.0%) | 23 (50.0%) |
Production, Transportation and Moving Occupations
The most common Production, Transportation and Moving occupations in Kansas are Production (9 | 19.6%), and Material Moving (3 | 6.5%).
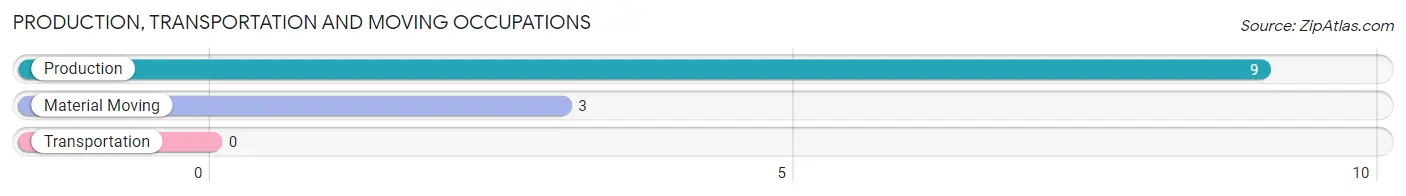
Production, Transportation and Moving Occupations by Sex
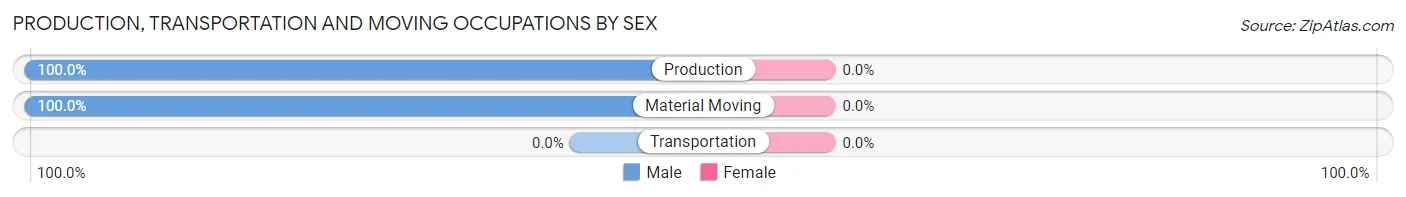
| Occupation | Male | Female |
| Production | 9 (100.0%) | 0 (0.0%) |
| Transportation | 0 (0.0%) | 0 (0.0%) |
| Material Moving | 3 (100.0%) | 0 (0.0%) |
| Total (Category) | 12 (100.0%) | 0 (0.0%) |
| Total (Overall) | 23 (50.0%) | 23 (50.0%) |
Employment Industries by Sex in Kansas
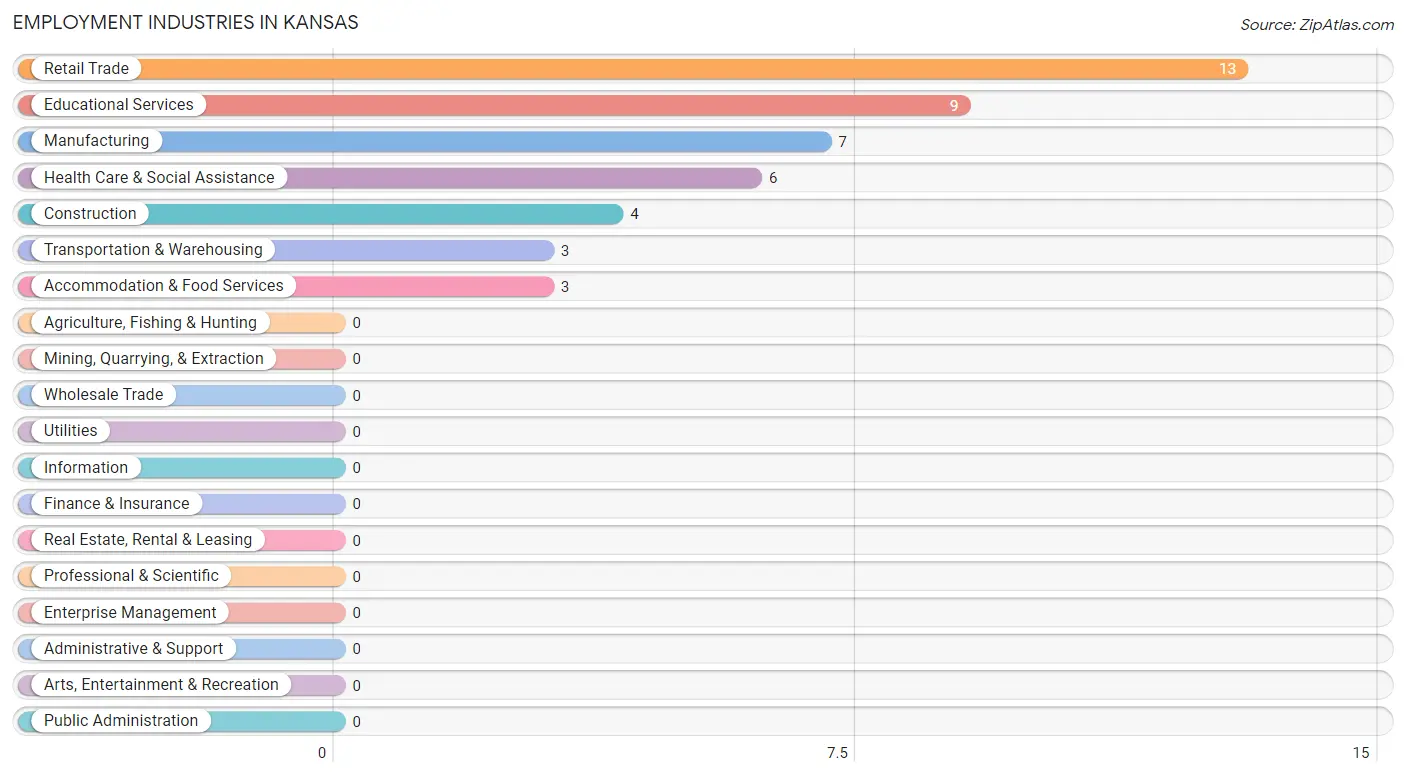
Employment Industries in Kansas
The major employment industries in Kansas include Retail Trade (13 | 28.3%), Educational Services (9 | 19.6%), Manufacturing (7 | 15.2%), Health Care & Social Assistance (6 | 13.0%), and Construction (4 | 8.7%).
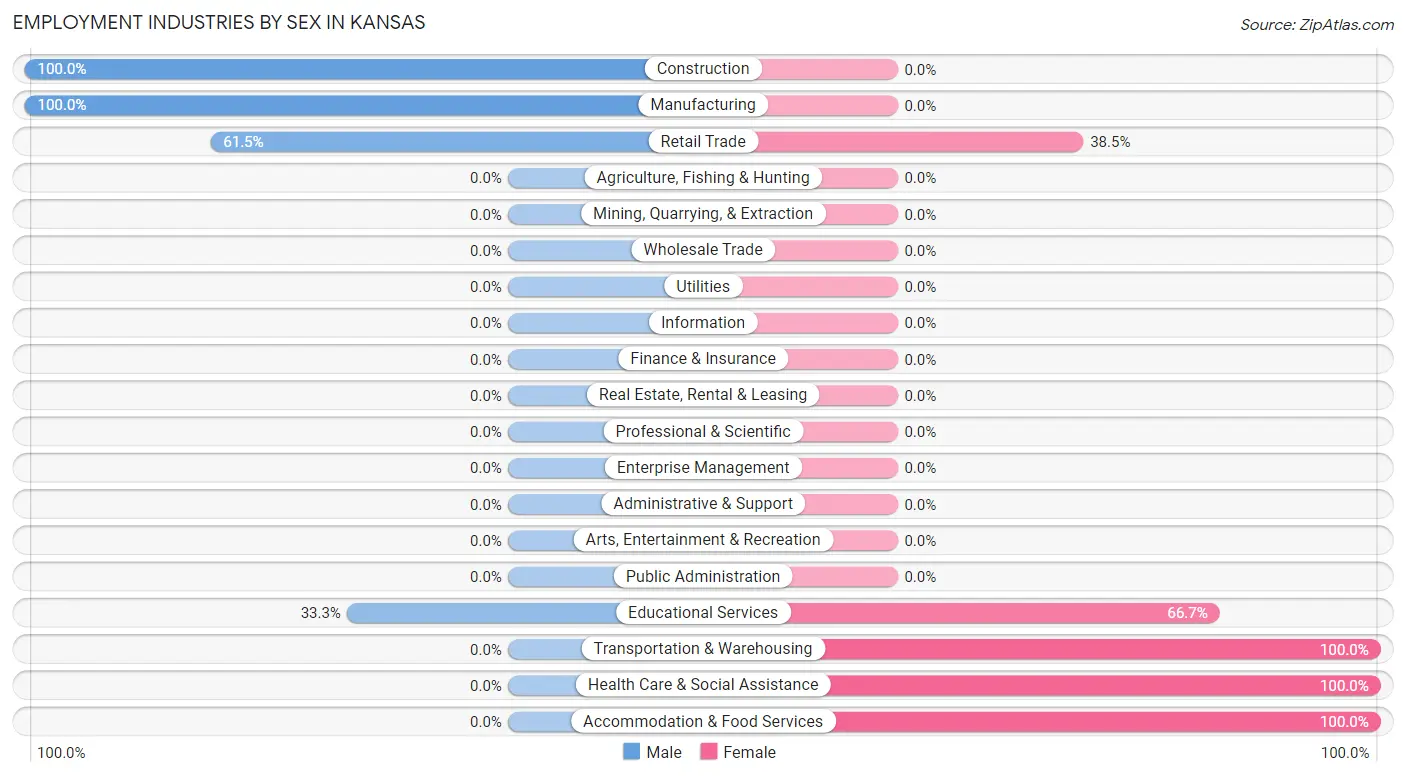
Employment Industries by Sex in Kansas
The Kansas industries that see more men than women are Construction (100.0%), Manufacturing (100.0%), and Retail Trade (61.5%), whereas the industries that tend to have a higher number of women are Transportation & Warehousing (100.0%), Health Care & Social Assistance (100.0%), and Accommodation & Food Services (100.0%).
| Industry | Male | Female |
| Agriculture, Fishing & Hunting | 0 (0.0%) | 0 (0.0%) |
| Mining, Quarrying, & Extraction | 0 (0.0%) | 0 (0.0%) |
| Construction | 4 (100.0%) | 0 (0.0%) |
| Manufacturing | 7 (100.0%) | 0 (0.0%) |
| Wholesale Trade | 0 (0.0%) | 0 (0.0%) |
| Retail Trade | 8 (61.5%) | 5 (38.5%) |
| Transportation & Warehousing | 0 (0.0%) | 3 (100.0%) |
| Utilities | 0 (0.0%) | 0 (0.0%) |
| Information | 0 (0.0%) | 0 (0.0%) |
| Finance & Insurance | 0 (0.0%) | 0 (0.0%) |
| Real Estate, Rental & Leasing | 0 (0.0%) | 0 (0.0%) |
| Professional & Scientific | 0 (0.0%) | 0 (0.0%) |
| Enterprise Management | 0 (0.0%) | 0 (0.0%) |
| Administrative & Support | 0 (0.0%) | 0 (0.0%) |
| Educational Services | 3 (33.3%) | 6 (66.7%) |
| Health Care & Social Assistance | 0 (0.0%) | 6 (100.0%) |
| Arts, Entertainment & Recreation | 0 (0.0%) | 0 (0.0%) |
| Accommodation & Food Services | 0 (0.0%) | 3 (100.0%) |
| Public Administration | 0 (0.0%) | 0 (0.0%) |
| Total | 23 (50.0%) | 23 (50.0%) |
Education in Kansas
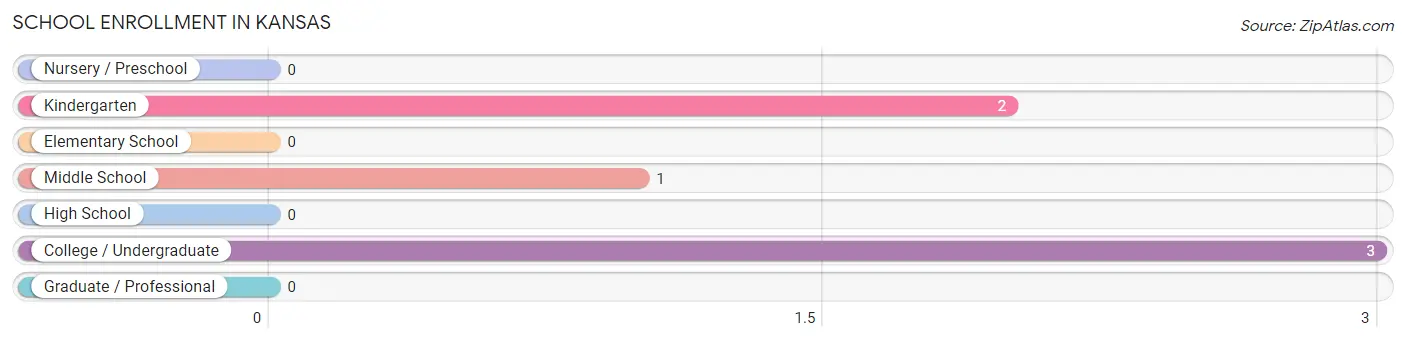
School Enrollment in Kansas
The most common levels of schooling among the 6 students in Kansas are college / undergraduate (3 | 50.0%), kindergarten (2 | 33.3%), and middle school (1 | 16.7%).
| School Level | # Students | % Students |
| Nursery / Preschool | 0 | 0.0% |
| Kindergarten | 2 | 33.3% |
| Elementary School | 0 | 0.0% |
| Middle School | 1 | 16.7% |
| High School | 0 | 0.0% |
| College / Undergraduate | 3 | 50.0% |
| Graduate / Professional | 0 | 0.0% |
| Total | 6 | 100.0% |
School Enrollment by Age by Funding Source in Kansas
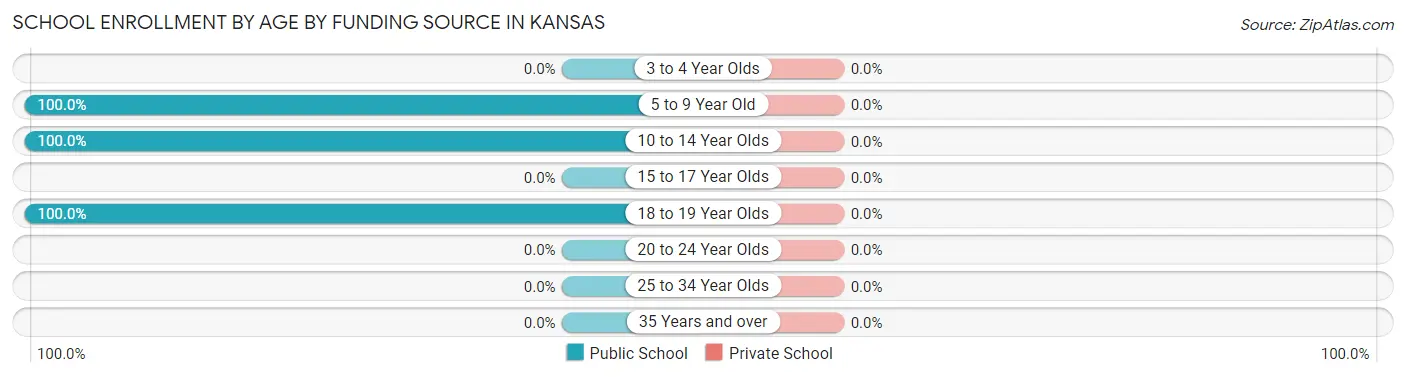
| Age Bracket | Public School | Private School |
| 3 to 4 Year Olds | 0 (0.0%) | 0 (0.0%) |
| 5 to 9 Year Old | 2 (100.0%) | 0 (0.0%) |
| 10 to 14 Year Olds | 1 (100.0%) | 0 (0.0%) |
| 15 to 17 Year Olds | 0 (0.0%) | 0 (0.0%) |
| 18 to 19 Year Olds | 3 (100.0%) | 0 (0.0%) |
| 20 to 24 Year Olds | 0 (0.0%) | 0 (0.0%) |
| 25 to 34 Year Olds | 0 (0.0%) | 0 (0.0%) |
| 35 Years and over | 0 (0.0%) | 0 (0.0%) |
| Total | 6 (100.0%) | 0 (0.0%) |
Educational Attainment by Field of Study in Kansas
Science & technology (3 | 33.3%), education (3 | 33.3%), and arts & humanities (3 | 33.3%) are the most common fields of study among 9 individuals in Kansas who have obtained a bachelor's degree or higher.
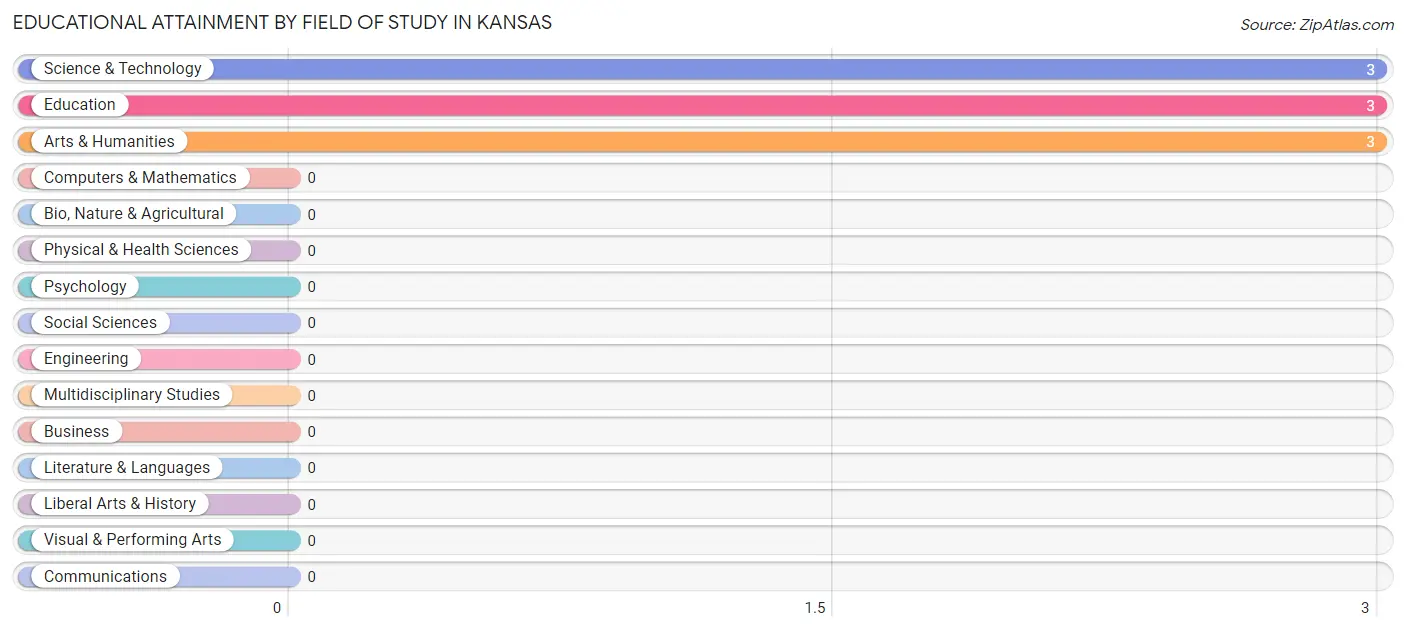
| Field of Study | # Graduates | % Graduates |
| Computers & Mathematics | 0 | 0.0% |
| Bio, Nature & Agricultural | 0 | 0.0% |
| Physical & Health Sciences | 0 | 0.0% |
| Psychology | 0 | 0.0% |
| Social Sciences | 0 | 0.0% |
| Engineering | 0 | 0.0% |
| Multidisciplinary Studies | 0 | 0.0% |
| Science & Technology | 3 | 33.3% |
| Business | 0 | 0.0% |
| Education | 3 | 33.3% |
| Literature & Languages | 0 | 0.0% |
| Liberal Arts & History | 0 | 0.0% |
| Visual & Performing Arts | 0 | 0.0% |
| Communications | 0 | 0.0% |
| Arts & Humanities | 3 | 33.3% |
| Total | 9 | 100.0% |
Transportation & Commute in Kansas
Vehicle Availability by Sex in Kansas
The most prevalent vehicle ownership categories in Kansas are males with 2 vehicles (10, accounting for 43.5%) and females with 2 vehicles (6, making up 43.5%).
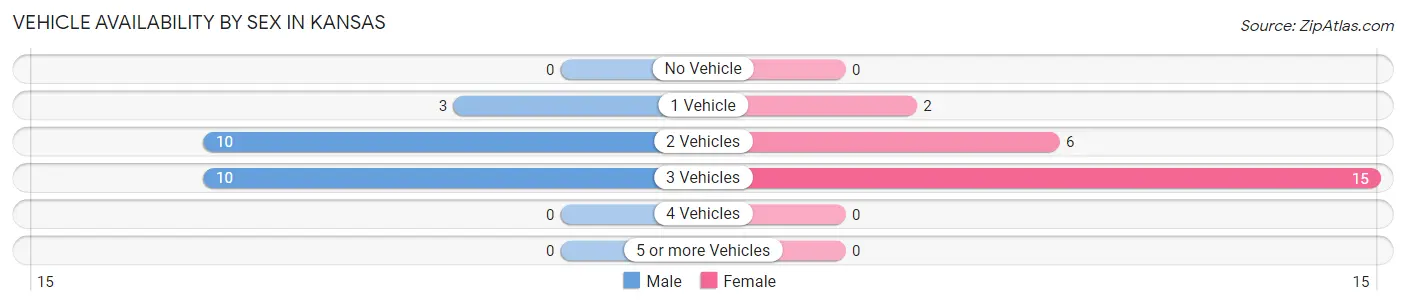
| Vehicles Available | Male | Female |
| No Vehicle | 0 (0.0%) | 0 (0.0%) |
| 1 Vehicle | 3 (13.0%) | 2 (8.7%) |
| 2 Vehicles | 10 (43.5%) | 6 (26.1%) |
| 3 Vehicles | 10 (43.5%) | 15 (65.2%) |
| 4 Vehicles | 0 (0.0%) | 0 (0.0%) |
| 5 or more Vehicles | 0 (0.0%) | 0 (0.0%) |
| Total | 23 (100.0%) | 23 (100.0%) |
Commute Time in Kansas
The most frequently occuring commute durations in Kansas are 60 to 89 minutes (11 commuters, 23.9%), 45 to 59 minutes (10 commuters, 21.7%), and 15 to 19 minutes (8 commuters, 17.4%).
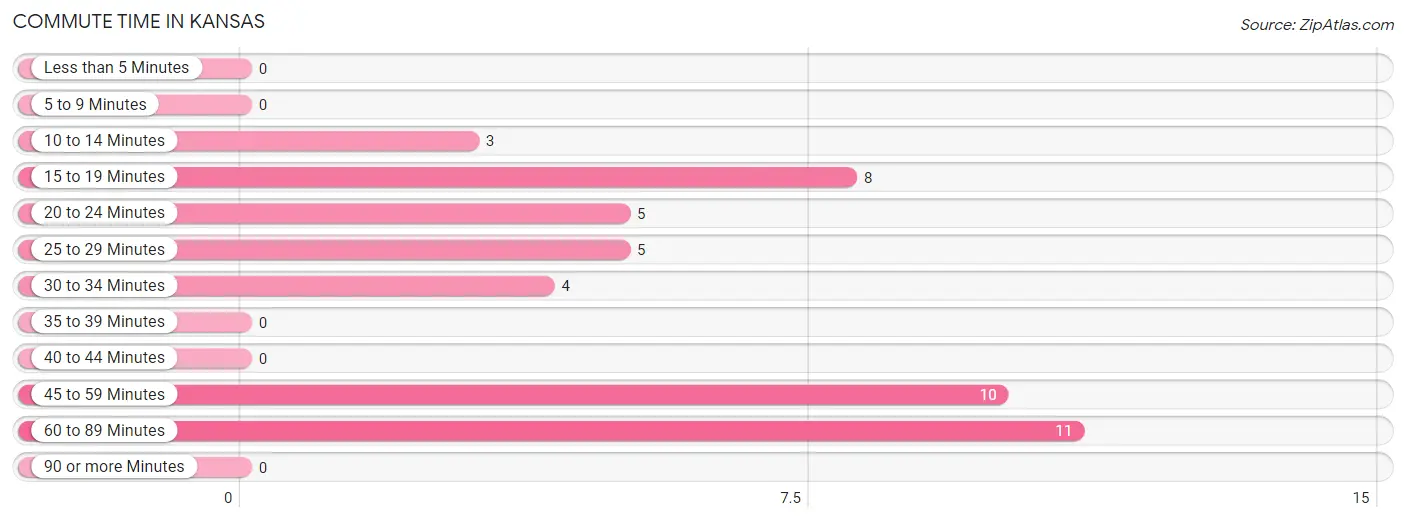
| Commute Time | # Commuters | % Commuters |
| Less than 5 Minutes | 0 | 0.0% |
| 5 to 9 Minutes | 0 | 0.0% |
| 10 to 14 Minutes | 3 | 6.5% |
| 15 to 19 Minutes | 8 | 17.4% |
| 20 to 24 Minutes | 5 | 10.9% |
| 25 to 29 Minutes | 5 | 10.9% |
| 30 to 34 Minutes | 4 | 8.7% |
| 35 to 39 Minutes | 0 | 0.0% |
| 40 to 44 Minutes | 0 | 0.0% |
| 45 to 59 Minutes | 10 | 21.7% |
| 60 to 89 Minutes | 11 | 23.9% |
| 90 or more Minutes | 0 | 0.0% |
Commute Time by Sex in Kansas
The most common commute times in Kansas are 45 to 59 minutes (7 commuters, 30.4%) for males and 60 to 89 minutes (6 commuters, 26.1%) for females.
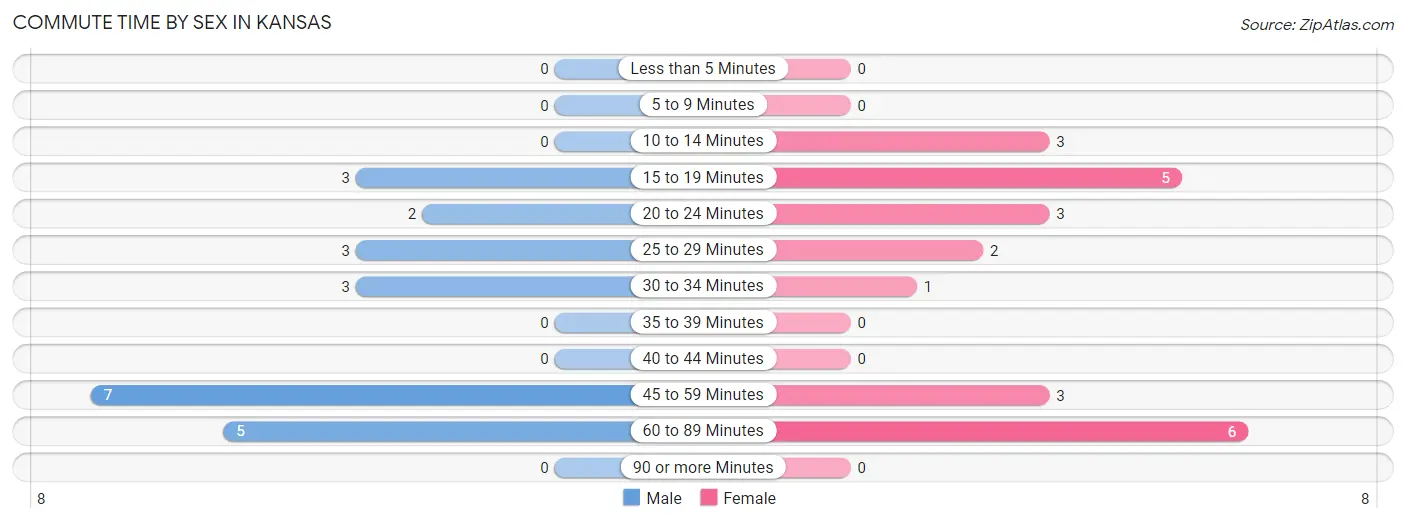
| Commute Time | Male | Female |
| Less than 5 Minutes | 0 (0.0%) | 0 (0.0%) |
| 5 to 9 Minutes | 0 (0.0%) | 0 (0.0%) |
| 10 to 14 Minutes | 0 (0.0%) | 3 (13.0%) |
| 15 to 19 Minutes | 3 (13.0%) | 5 (21.7%) |
| 20 to 24 Minutes | 2 (8.7%) | 3 (13.0%) |
| 25 to 29 Minutes | 3 (13.0%) | 2 (8.7%) |
| 30 to 34 Minutes | 3 (13.0%) | 1 (4.3%) |
| 35 to 39 Minutes | 0 (0.0%) | 0 (0.0%) |
| 40 to 44 Minutes | 0 (0.0%) | 0 (0.0%) |
| 45 to 59 Minutes | 7 (30.4%) | 3 (13.0%) |
| 60 to 89 Minutes | 5 (21.7%) | 6 (26.1%) |
| 90 or more Minutes | 0 (0.0%) | 0 (0.0%) |
Time of Departure to Work by Sex in Kansas
The most frequent times of departure to work in Kansas are 12:00 AM to 4:59 AM (7, 30.4%) for males and 6:00 AM to 6:29 AM (11, 47.8%) for females.
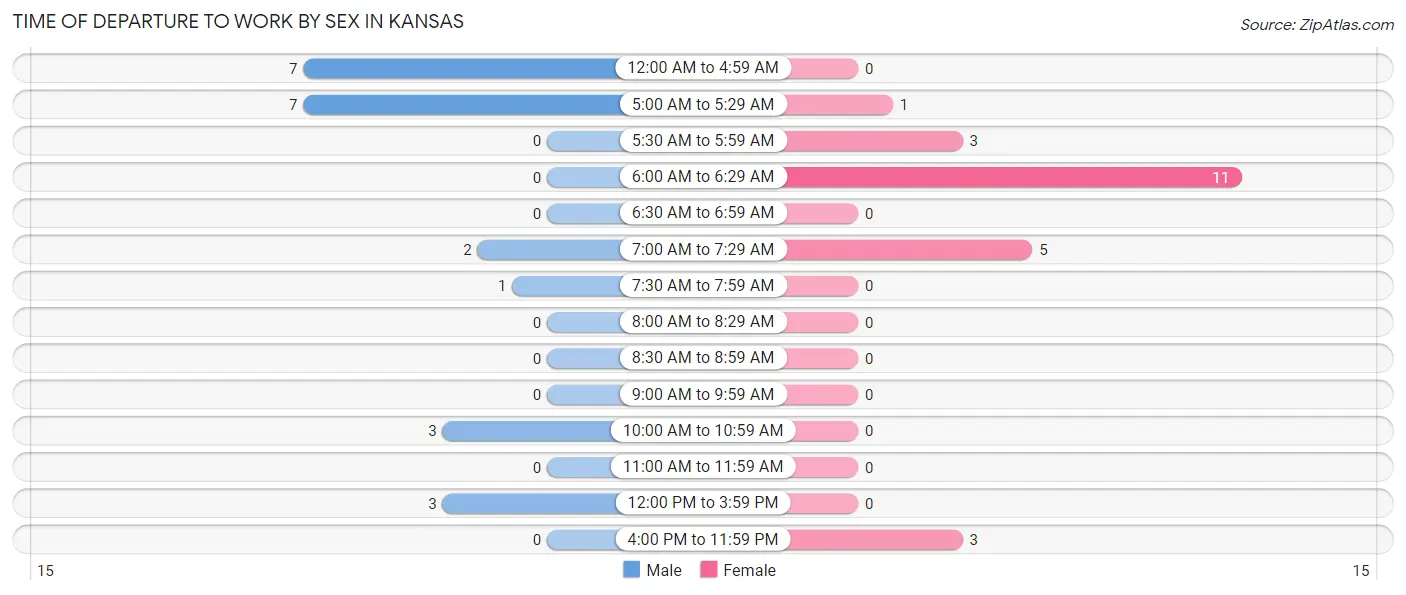
| Time of Departure | Male | Female |
| 12:00 AM to 4:59 AM | 7 (30.4%) | 0 (0.0%) |
| 5:00 AM to 5:29 AM | 7 (30.4%) | 1 (4.3%) |
| 5:30 AM to 5:59 AM | 0 (0.0%) | 3 (13.0%) |
| 6:00 AM to 6:29 AM | 0 (0.0%) | 11 (47.8%) |
| 6:30 AM to 6:59 AM | 0 (0.0%) | 0 (0.0%) |
| 7:00 AM to 7:29 AM | 2 (8.7%) | 5 (21.7%) |
| 7:30 AM to 7:59 AM | 1 (4.3%) | 0 (0.0%) |
| 8:00 AM to 8:29 AM | 0 (0.0%) | 0 (0.0%) |
| 8:30 AM to 8:59 AM | 0 (0.0%) | 0 (0.0%) |
| 9:00 AM to 9:59 AM | 0 (0.0%) | 0 (0.0%) |
| 10:00 AM to 10:59 AM | 3 (13.0%) | 0 (0.0%) |
| 11:00 AM to 11:59 AM | 0 (0.0%) | 0 (0.0%) |
| 12:00 PM to 3:59 PM | 3 (13.0%) | 0 (0.0%) |
| 4:00 PM to 11:59 PM | 0 (0.0%) | 3 (13.0%) |
| Total | 23 (100.0%) | 23 (100.0%) |
Housing Occupancy in Kansas
Occupancy by Ownership in Kansas
Of the total 58 dwellings in Kansas, owner-occupied units account for 50 (86.2%), while renter-occupied units make up 8 (13.8%).
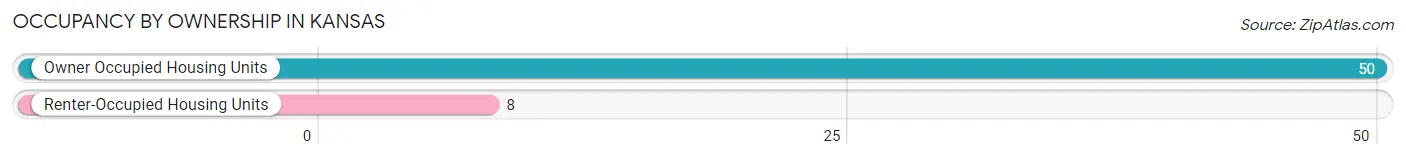
| Occupancy | # Housing Units | % Housing Units |
| Owner Occupied Housing Units | 50 | 86.2% |
| Renter-Occupied Housing Units | 8 | 13.8% |
| Total Occupied Housing Units | 58 | 100.0% |
Occupancy by Household Size in Kansas
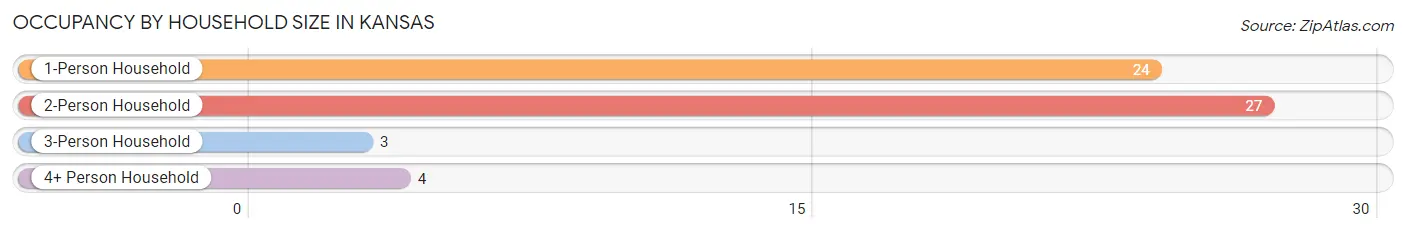
| Household Size | # Housing Units | % Housing Units |
| 1-Person Household | 24 | 41.4% |
| 2-Person Household | 27 | 46.6% |
| 3-Person Household | 3 | 5.2% |
| 4+ Person Household | 4 | 6.9% |
| Total Housing Units | 58 | 100.0% |
Occupancy by Ownership by Household Size in Kansas
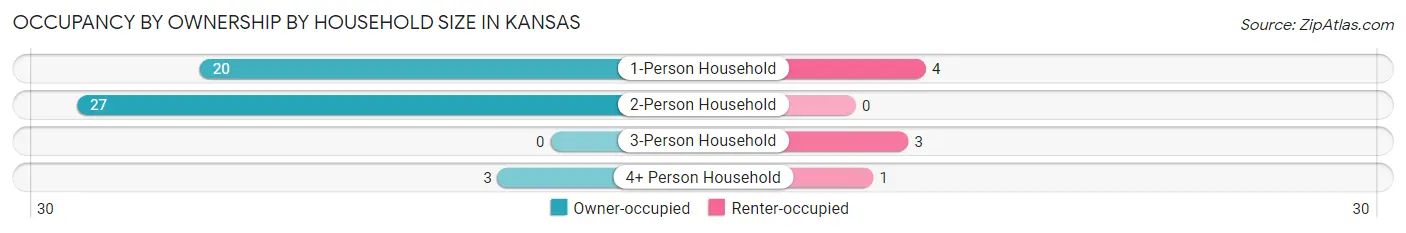
| Household Size | Owner-occupied | Renter-occupied |
| 1-Person Household | 20 (83.3%) | 4 (16.7%) |
| 2-Person Household | 27 (100.0%) | 0 (0.0%) |
| 3-Person Household | 0 (0.0%) | 3 (100.0%) |
| 4+ Person Household | 3 (75.0%) | 1 (25.0%) |
| Total Housing Units | 50 (86.2%) | 8 (13.8%) |
Occupancy by Educational Attainment in Kansas
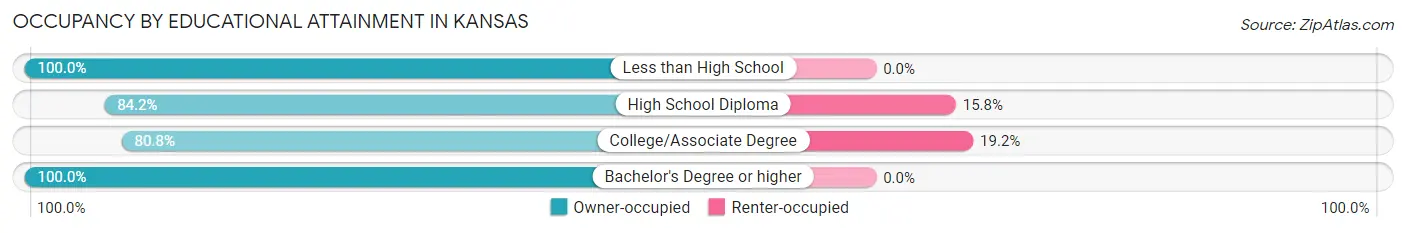
| Household Size | Owner-occupied | Renter-occupied |
| Less than High School | 10 (100.0%) | 0 (0.0%) |
| High School Diploma | 16 (84.2%) | 3 (15.8%) |
| College/Associate Degree | 21 (80.8%) | 5 (19.2%) |
| Bachelor's Degree or higher | 3 (100.0%) | 0 (0.0%) |
Occupancy by Age of Householder in Kansas
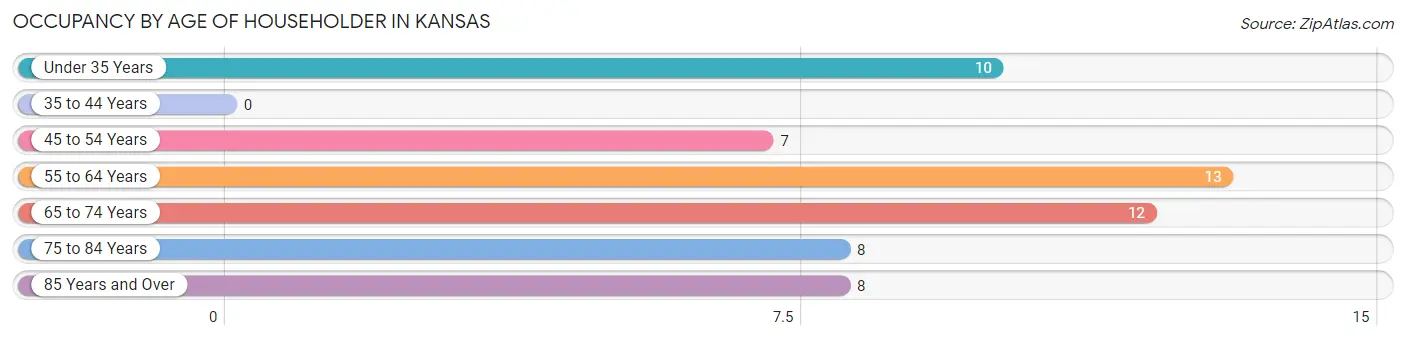
| Age Bracket | # Households | % Households |
| Under 35 Years | 10 | 17.2% |
| 35 to 44 Years | 0 | 0.0% |
| 45 to 54 Years | 7 | 12.1% |
| 55 to 64 Years | 13 | 22.4% |
| 65 to 74 Years | 12 | 20.7% |
| 75 to 84 Years | 8 | 13.8% |
| 85 Years and Over | 8 | 13.8% |
| Total | 58 | 100.0% |
Housing Finances in Kansas
Median Income by Occupancy in Kansas
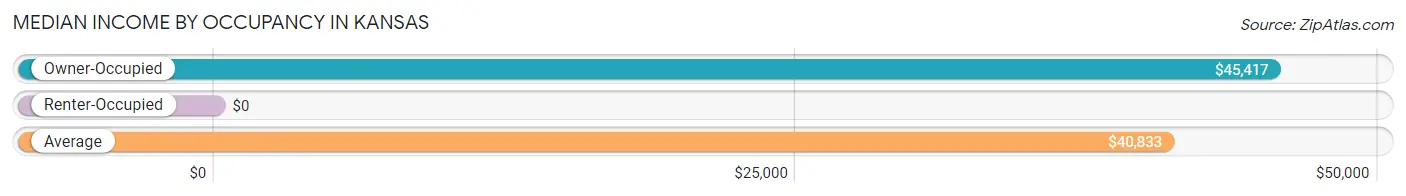
| Occupancy Type | # Households | Median Income |
| Owner-Occupied | 50 (86.2%) | $45,417 |
| Renter-Occupied | 8 (13.8%) | $0 |
| Average | 58 (100.0%) | $40,833 |
Occupancy by Householder Income Bracket in Kansas
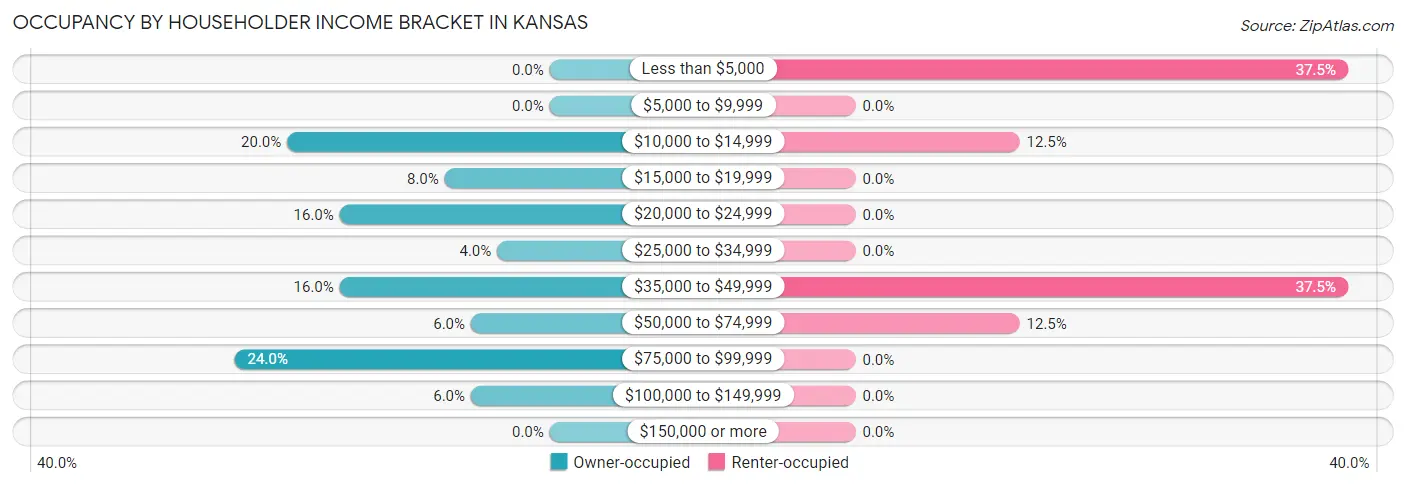
| Income Bracket | Owner-occupied | Renter-occupied |
| Less than $5,000 | 0 (0.0%) | 3 (37.5%) |
| $5,000 to $9,999 | 0 (0.0%) | 0 (0.0%) |
| $10,000 to $14,999 | 10 (20.0%) | 1 (12.5%) |
| $15,000 to $19,999 | 4 (8.0%) | 0 (0.0%) |
| $20,000 to $24,999 | 8 (16.0%) | 0 (0.0%) |
| $25,000 to $34,999 | 2 (4.0%) | 0 (0.0%) |
| $35,000 to $49,999 | 8 (16.0%) | 3 (37.5%) |
| $50,000 to $74,999 | 3 (6.0%) | 1 (12.5%) |
| $75,000 to $99,999 | 12 (24.0%) | 0 (0.0%) |
| $100,000 to $149,999 | 3 (6.0%) | 0 (0.0%) |
| $150,000 or more | 0 (0.0%) | 0 (0.0%) |
| Total | 50 (100.0%) | 8 (100.0%) |
Monthly Housing Cost Tiers in Kansas
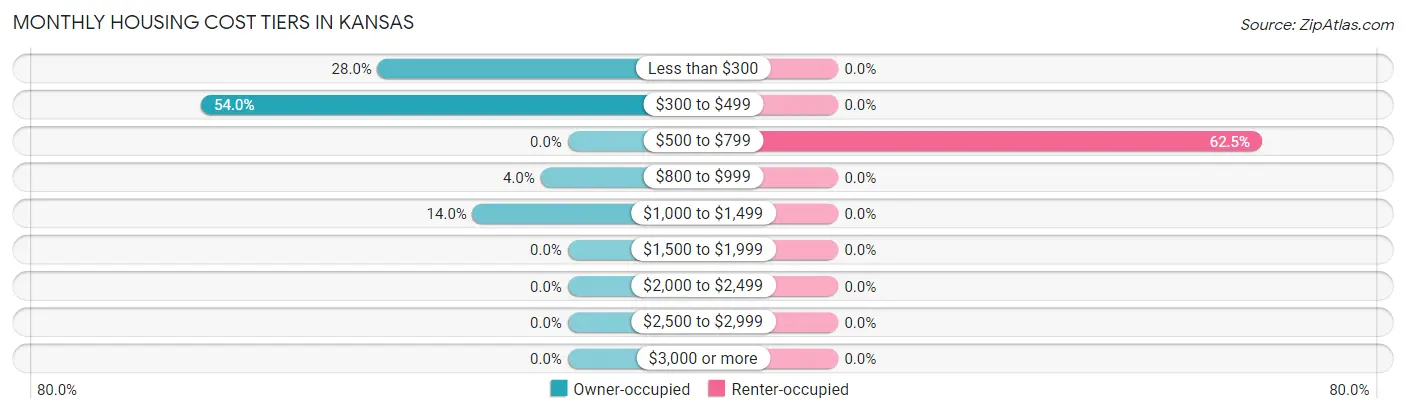
| Monthly Cost | Owner-occupied | Renter-occupied |
| Less than $300 | 14 (28.0%) | 0 (0.0%) |
| $300 to $499 | 27 (54.0%) | 0 (0.0%) |
| $500 to $799 | 0 (0.0%) | 5 (62.5%) |
| $800 to $999 | 2 (4.0%) | 0 (0.0%) |
| $1,000 to $1,499 | 7 (14.0%) | 0 (0.0%) |
| $1,500 to $1,999 | 0 (0.0%) | 0 (0.0%) |
| $2,000 to $2,499 | 0 (0.0%) | 0 (0.0%) |
| $2,500 to $2,999 | 0 (0.0%) | 0 (0.0%) |
| $3,000 or more | 0 (0.0%) | 0 (0.0%) |
| Total | 50 (100.0%) | 8 (100.0%) |
Physical Housing Characteristics in Kansas
Housing Structures in Kansas
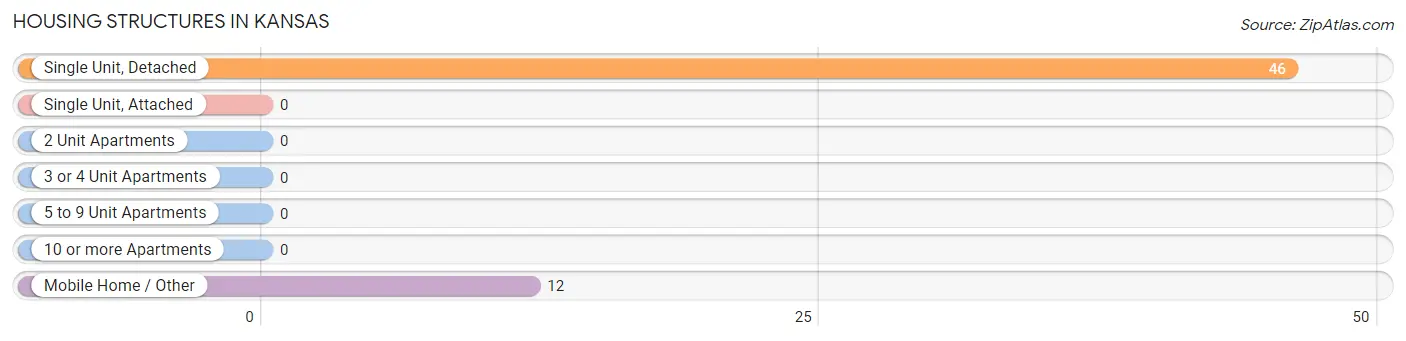
| Structure Type | # Housing Units | % Housing Units |
| Single Unit, Detached | 46 | 79.3% |
| Single Unit, Attached | 0 | 0.0% |
| 2 Unit Apartments | 0 | 0.0% |
| 3 or 4 Unit Apartments | 0 | 0.0% |
| 5 to 9 Unit Apartments | 0 | 0.0% |
| 10 or more Apartments | 0 | 0.0% |
| Mobile Home / Other | 12 | 20.7% |
| Total | 58 | 100.0% |
Housing Structures by Occupancy in Kansas
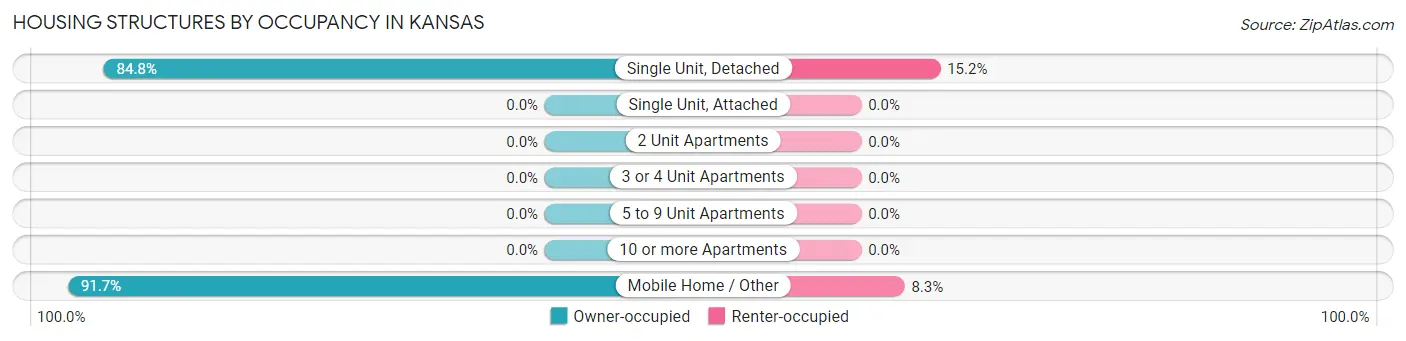
| Structure Type | Owner-occupied | Renter-occupied |
| Single Unit, Detached | 39 (84.8%) | 7 (15.2%) |
| Single Unit, Attached | 0 (0.0%) | 0 (0.0%) |
| 2 Unit Apartments | 0 (0.0%) | 0 (0.0%) |
| 3 or 4 Unit Apartments | 0 (0.0%) | 0 (0.0%) |
| 5 to 9 Unit Apartments | 0 (0.0%) | 0 (0.0%) |
| 10 or more Apartments | 0 (0.0%) | 0 (0.0%) |
| Mobile Home / Other | 11 (91.7%) | 1 (8.3%) |
| Total | 50 (86.2%) | 8 (13.8%) |
Housing Structures by Number of Rooms in Kansas
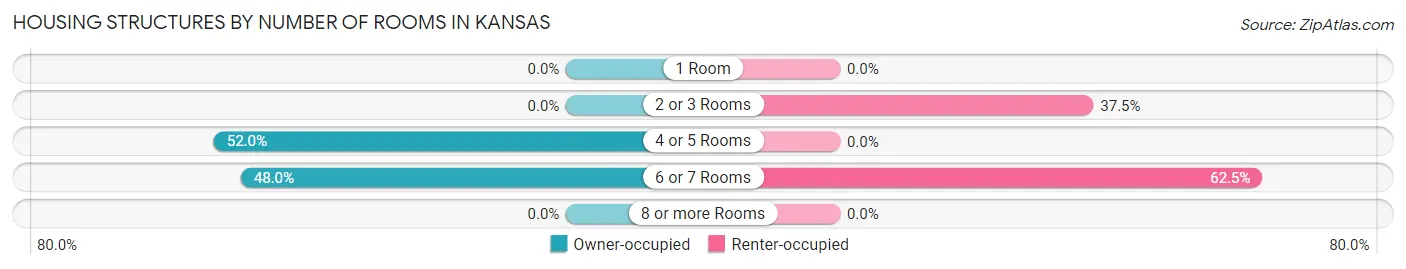
| Number of Rooms | Owner-occupied | Renter-occupied |
| 1 Room | 0 (0.0%) | 0 (0.0%) |
| 2 or 3 Rooms | 0 (0.0%) | 3 (37.5%) |
| 4 or 5 Rooms | 26 (52.0%) | 0 (0.0%) |
| 6 or 7 Rooms | 24 (48.0%) | 5 (62.5%) |
| 8 or more Rooms | 0 (0.0%) | 0 (0.0%) |
| Total | 50 (100.0%) | 8 (100.0%) |
Housing Structure by Heating Type in Kansas
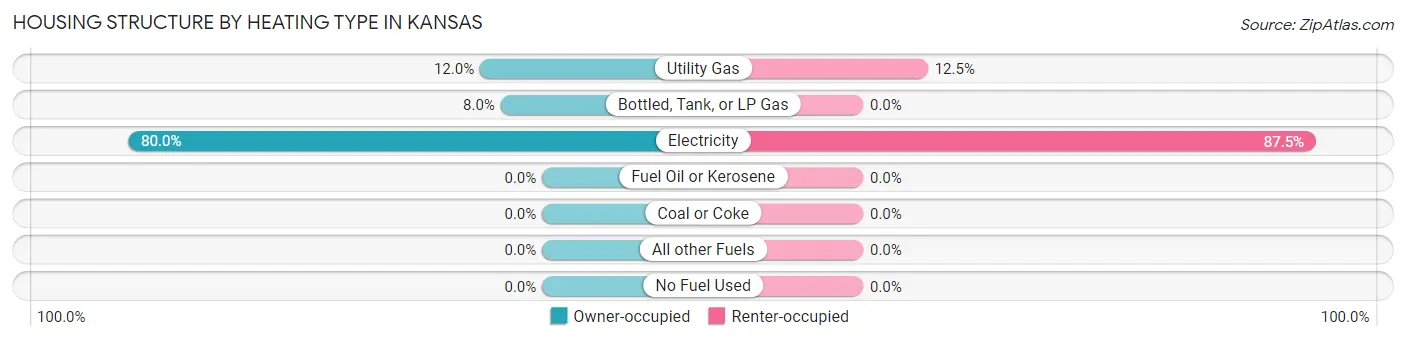
| Heating Type | Owner-occupied | Renter-occupied |
| Utility Gas | 6 (12.0%) | 1 (12.5%) |
| Bottled, Tank, or LP Gas | 4 (8.0%) | 0 (0.0%) |
| Electricity | 40 (80.0%) | 7 (87.5%) |
| Fuel Oil or Kerosene | 0 (0.0%) | 0 (0.0%) |
| Coal or Coke | 0 (0.0%) | 0 (0.0%) |
| All other Fuels | 0 (0.0%) | 0 (0.0%) |
| No Fuel Used | 0 (0.0%) | 0 (0.0%) |
| Total | 50 (100.0%) | 8 (100.0%) |
Household Vehicle Usage in Kansas
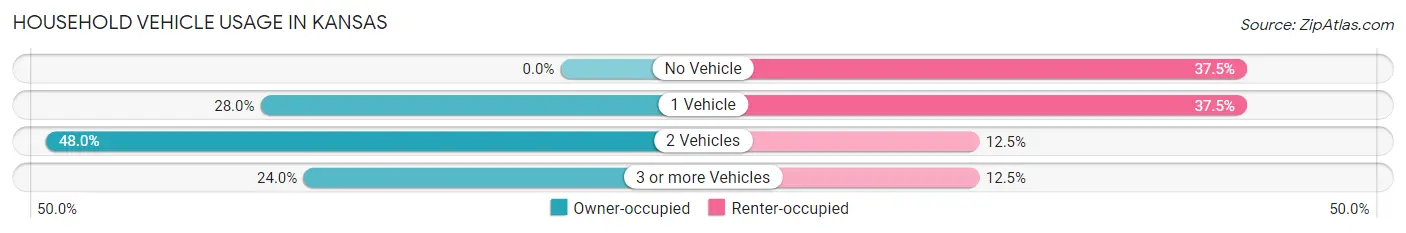
| Vehicles per Household | Owner-occupied | Renter-occupied |
| No Vehicle | 0 (0.0%) | 3 (37.5%) |
| 1 Vehicle | 14 (28.0%) | 3 (37.5%) |
| 2 Vehicles | 24 (48.0%) | 1 (12.5%) |
| 3 or more Vehicles | 12 (24.0%) | 1 (12.5%) |
| Total | 50 (100.0%) | 8 (100.0%) |
Real Estate & Mortgages in Kansas
Real Estate and Mortgage Overview in Kansas
| Characteristic | Without Mortgage | With Mortgage |
| Housing Units | 41 | 9 |
| Median Property Value | $83,800 | $0 |
| Median Household Income | - | - |
| Monthly Housing Costs | $322 | $0 |
| Real Estate Taxes | $200 | $4 |
Property Value by Mortgage Status in Kansas
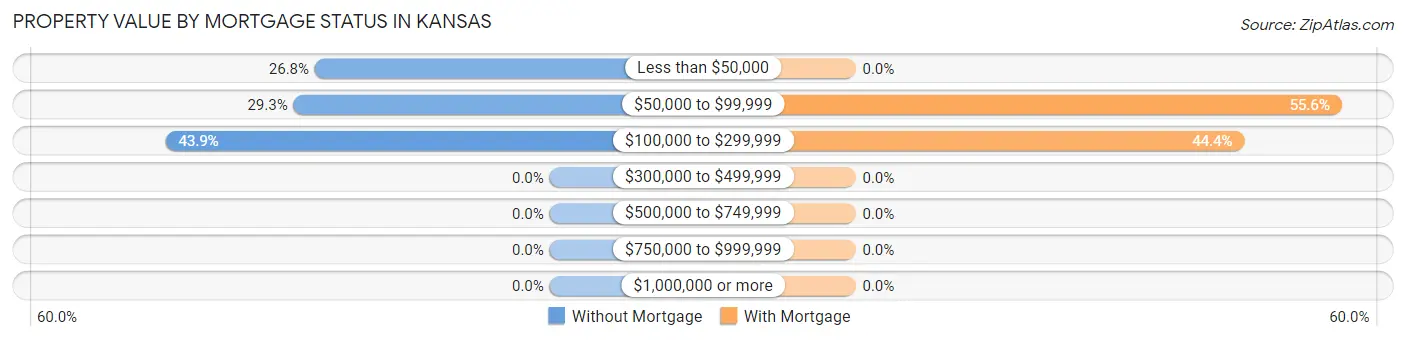
| Property Value | Without Mortgage | With Mortgage |
| Less than $50,000 | 11 (26.8%) | 0 (0.0%) |
| $50,000 to $99,999 | 12 (29.3%) | 5 (55.6%) |
| $100,000 to $299,999 | 18 (43.9%) | 4 (44.4%) |
| $300,000 to $499,999 | 0 (0.0%) | 0 (0.0%) |
| $500,000 to $749,999 | 0 (0.0%) | 0 (0.0%) |
| $750,000 to $999,999 | 0 (0.0%) | 0 (0.0%) |
| $1,000,000 or more | 0 (0.0%) | 0 (0.0%) |
| Total | 41 (100.0%) | 9 (100.0%) |
Household Income by Mortgage Status in Kansas
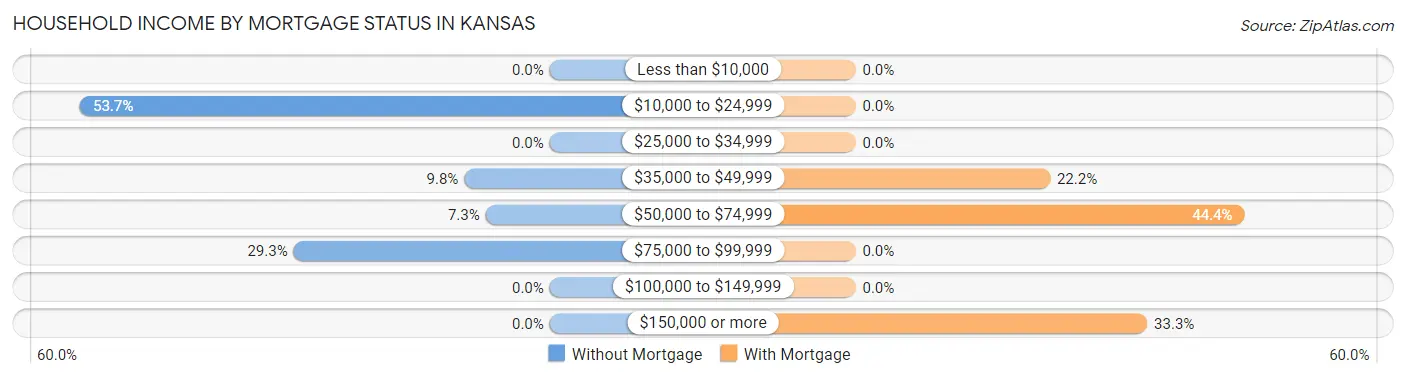
| Household Income | Without Mortgage | With Mortgage |
| Less than $10,000 | 0 (0.0%) | 0 (0.0%) |
| $10,000 to $24,999 | 22 (53.7%) | 0 (0.0%) |
| $25,000 to $34,999 | 0 (0.0%) | 0 (0.0%) |
| $35,000 to $49,999 | 4 (9.8%) | 2 (22.2%) |
| $50,000 to $74,999 | 3 (7.3%) | 4 (44.4%) |
| $75,000 to $99,999 | 12 (29.3%) | 0 (0.0%) |
| $100,000 to $149,999 | 0 (0.0%) | 0 (0.0%) |
| $150,000 or more | 0 (0.0%) | 3 (33.3%) |
| Total | 41 (100.0%) | 9 (100.0%) |
Property Value to Household Income Ratio in Kansas
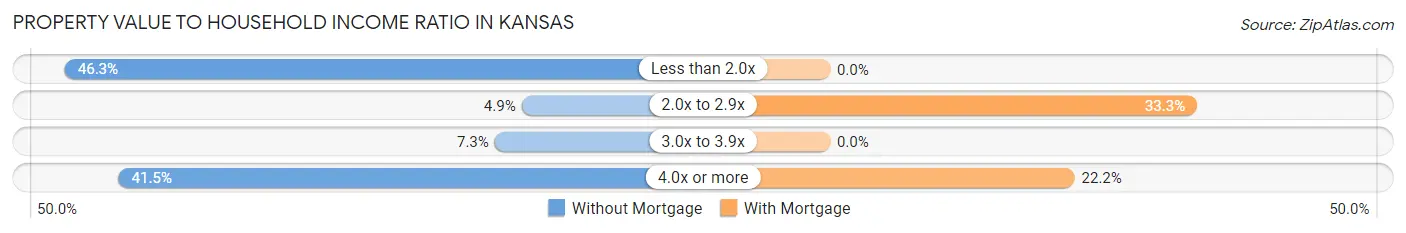
| Value-to-Income Ratio | Without Mortgage | With Mortgage |
| Less than 2.0x | 19 (46.3%) | 0 (0.0%) |
| 2.0x to 2.9x | 2 (4.9%) | 3 (33.3%) |
| 3.0x to 3.9x | 3 (7.3%) | 0 (0.0%) |
| 4.0x or more | 17 (41.5%) | 2 (22.2%) |
| Total | 41 (100.0%) | 9 (100.0%) |
Real Estate Taxes by Mortgage Status in Kansas
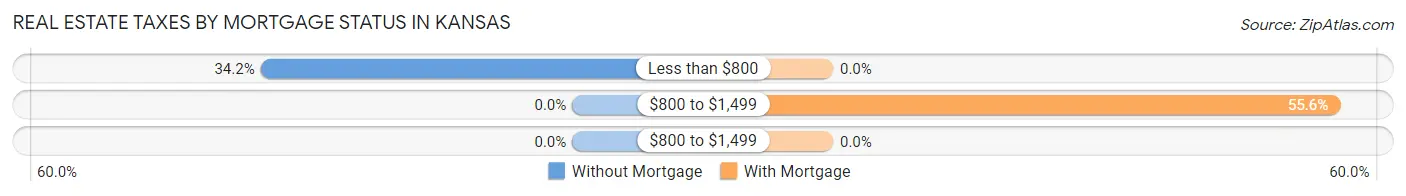
| Property Taxes | Without Mortgage | With Mortgage |
| Less than $800 | 14 (34.2%) | 0 (0.0%) |
| $800 to $1,499 | 0 (0.0%) | 5 (55.6%) |
| $800 to $1,499 | 0 (0.0%) | 0 (0.0%) |
| Total | 41 (100.0%) | 9 (100.0%) |
Health & Disability in Kansas
Health Insurance Coverage by Age in Kansas
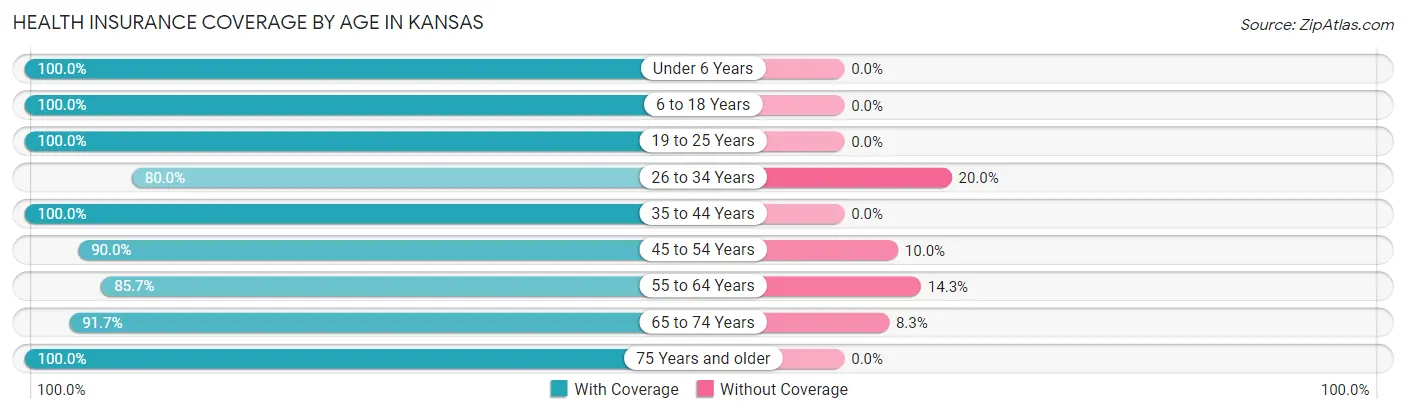
| Age Bracket | With Coverage | Without Coverage |
| Under 6 Years | 6 (100.0%) | 0 (0.0%) |
| 6 to 18 Years | 4 (100.0%) | 0 (0.0%) |
| 19 to 25 Years | 12 (100.0%) | 0 (0.0%) |
| 26 to 34 Years | 8 (80.0%) | 2 (20.0%) |
| 35 to 44 Years | 4 (100.0%) | 0 (0.0%) |
| 45 to 54 Years | 9 (90.0%) | 1 (10.0%) |
| 55 to 64 Years | 18 (85.7%) | 3 (14.3%) |
| 65 to 74 Years | 22 (91.7%) | 2 (8.3%) |
| 75 Years and older | 18 (100.0%) | 0 (0.0%) |
| Total | 101 (92.7%) | 8 (7.3%) |
Health Insurance Coverage by Citizenship Status in Kansas
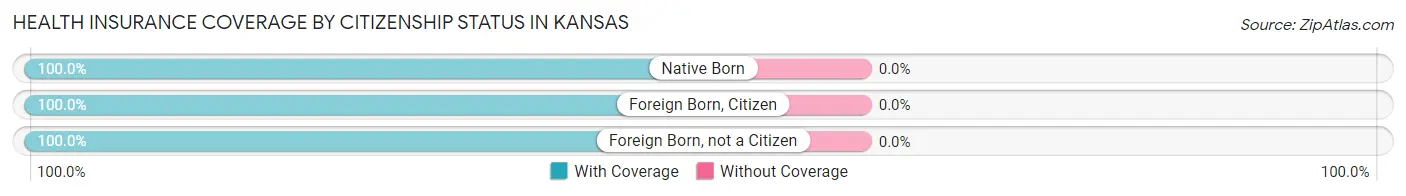
| Citizenship Status | With Coverage | Without Coverage |
| Native Born | 6 (100.0%) | 0 (0.0%) |
| Foreign Born, Citizen | 4 (100.0%) | 0 (0.0%) |
| Foreign Born, not a Citizen | 12 (100.0%) | 0 (0.0%) |
Health Insurance Coverage by Household Income in Kansas
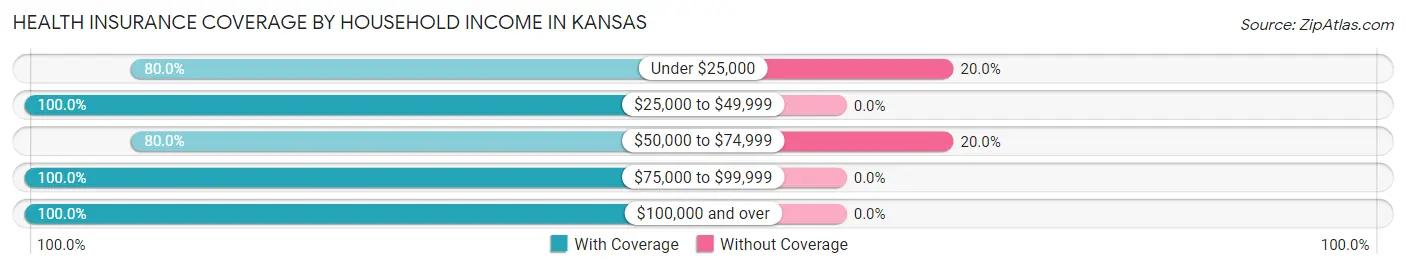
| Household Income | With Coverage | Without Coverage |
| Under $25,000 | 24 (80.0%) | 6 (20.0%) |
| $25,000 to $49,999 | 28 (100.0%) | 0 (0.0%) |
| $50,000 to $74,999 | 8 (80.0%) | 2 (20.0%) |
| $75,000 to $99,999 | 35 (100.0%) | 0 (0.0%) |
| $100,000 and over | 6 (100.0%) | 0 (0.0%) |
Public vs Private Health Insurance Coverage by Age in Kansas
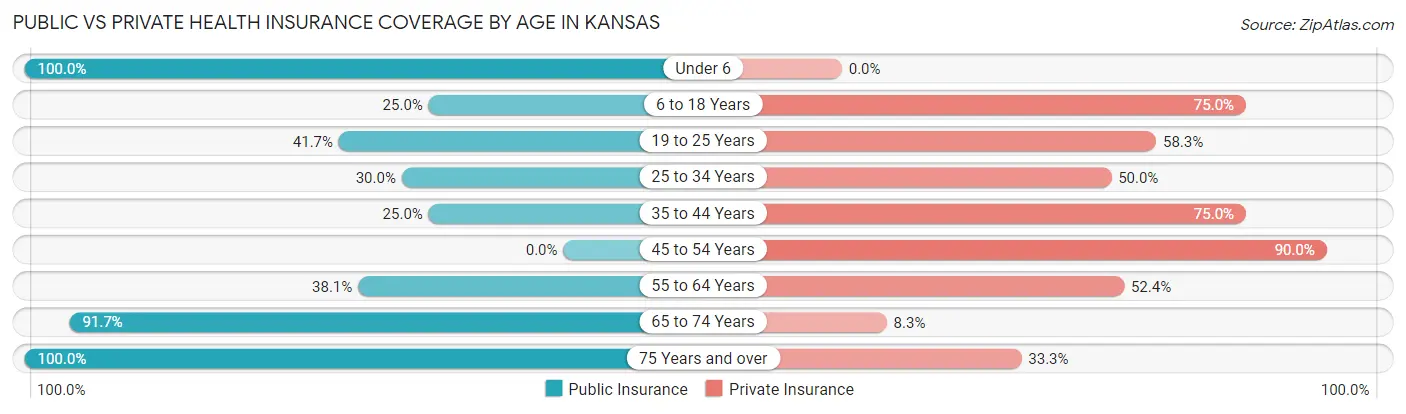
| Age Bracket | Public Insurance | Private Insurance |
| Under 6 | 6 (100.0%) | 0 (0.0%) |
| 6 to 18 Years | 1 (25.0%) | 3 (75.0%) |
| 19 to 25 Years | 5 (41.7%) | 7 (58.3%) |
| 25 to 34 Years | 3 (30.0%) | 5 (50.0%) |
| 35 to 44 Years | 1 (25.0%) | 3 (75.0%) |
| 45 to 54 Years | 0 (0.0%) | 9 (90.0%) |
| 55 to 64 Years | 8 (38.1%) | 11 (52.4%) |
| 65 to 74 Years | 22 (91.7%) | 2 (8.3%) |
| 75 Years and over | 18 (100.0%) | 6 (33.3%) |
| Total | 64 (58.7%) | 46 (42.2%) |
Disability Status by Sex by Age in Kansas
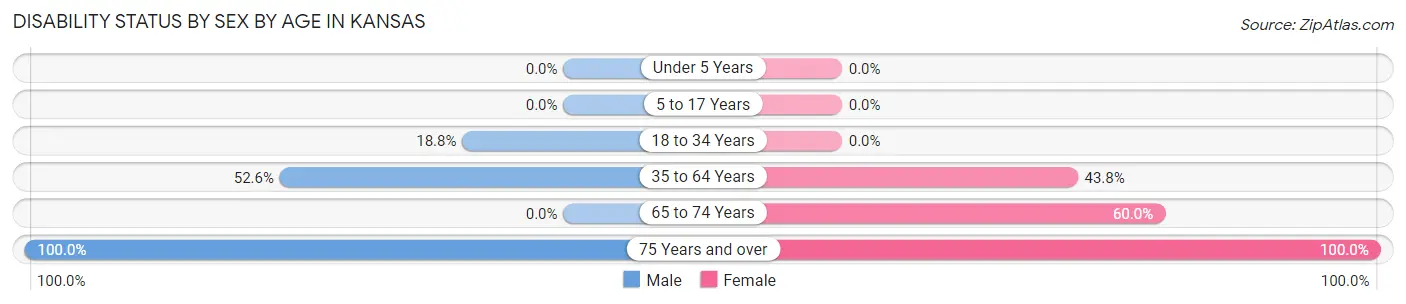
| Age Bracket | Male | Female |
| Under 5 Years | 0 (0.0%) | 0 (0.0%) |
| 5 to 17 Years | 0 (0.0%) | 0 (0.0%) |
| 18 to 34 Years | 3 (18.8%) | 0 (0.0%) |
| 35 to 64 Years | 10 (52.6%) | 7 (43.8%) |
| 65 to 74 Years | 0 (0.0%) | 9 (60.0%) |
| 75 Years and over | 2 (100.0%) | 16 (100.0%) |
Disability Class by Sex by Age in Kansas
Disability Class: Hearing Difficulty
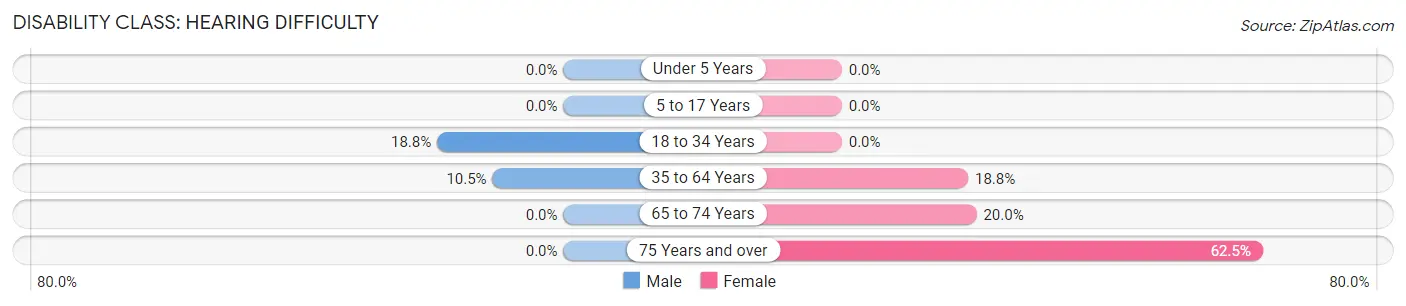
| Age Bracket | Male | Female |
| Under 5 Years | 0 (0.0%) | 0 (0.0%) |
| 5 to 17 Years | 0 (0.0%) | 0 (0.0%) |
| 18 to 34 Years | 3 (18.8%) | 0 (0.0%) |
| 35 to 64 Years | 2 (10.5%) | 3 (18.8%) |
| 65 to 74 Years | 0 (0.0%) | 3 (20.0%) |
| 75 Years and over | 0 (0.0%) | 10 (62.5%) |
Disability Class: Vision Difficulty
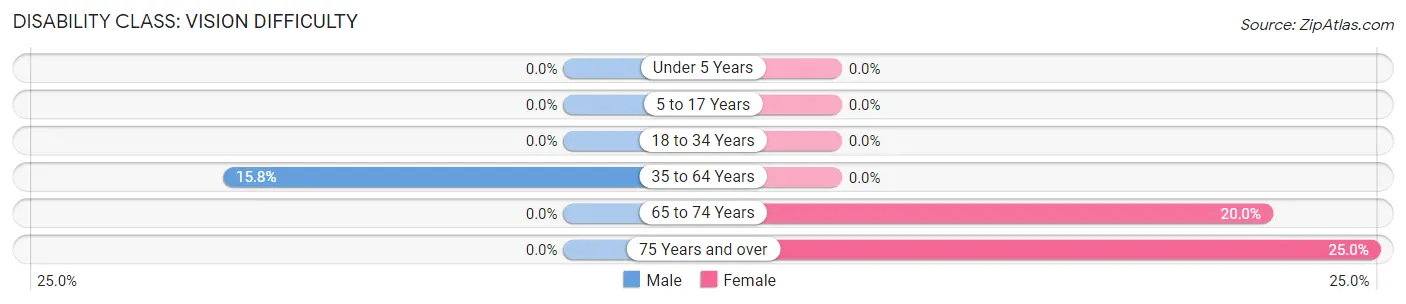
| Age Bracket | Male | Female |
| Under 5 Years | 0 (0.0%) | 0 (0.0%) |
| 5 to 17 Years | 0 (0.0%) | 0 (0.0%) |
| 18 to 34 Years | 0 (0.0%) | 0 (0.0%) |
| 35 to 64 Years | 3 (15.8%) | 0 (0.0%) |
| 65 to 74 Years | 0 (0.0%) | 3 (20.0%) |
| 75 Years and over | 0 (0.0%) | 4 (25.0%) |
Disability Class: Cognitive Difficulty
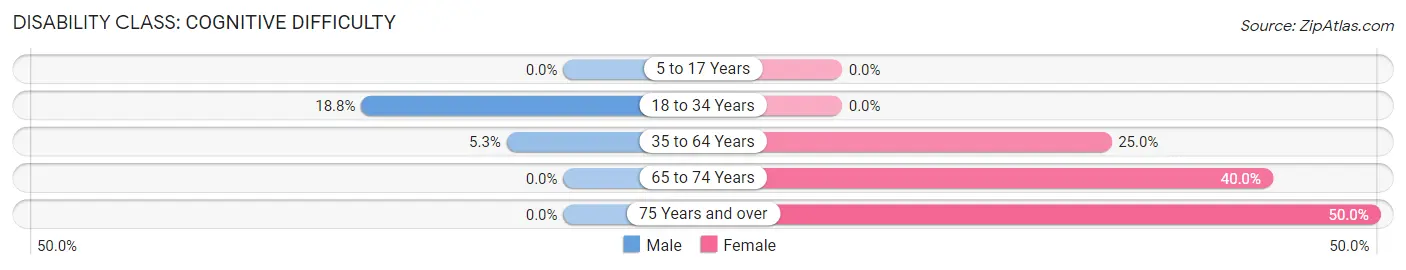
| Age Bracket | Male | Female |
| 5 to 17 Years | 0 (0.0%) | 0 (0.0%) |
| 18 to 34 Years | 3 (18.8%) | 0 (0.0%) |
| 35 to 64 Years | 1 (5.3%) | 4 (25.0%) |
| 65 to 74 Years | 0 (0.0%) | 6 (40.0%) |
| 75 Years and over | 0 (0.0%) | 8 (50.0%) |
Disability Class: Ambulatory Difficulty
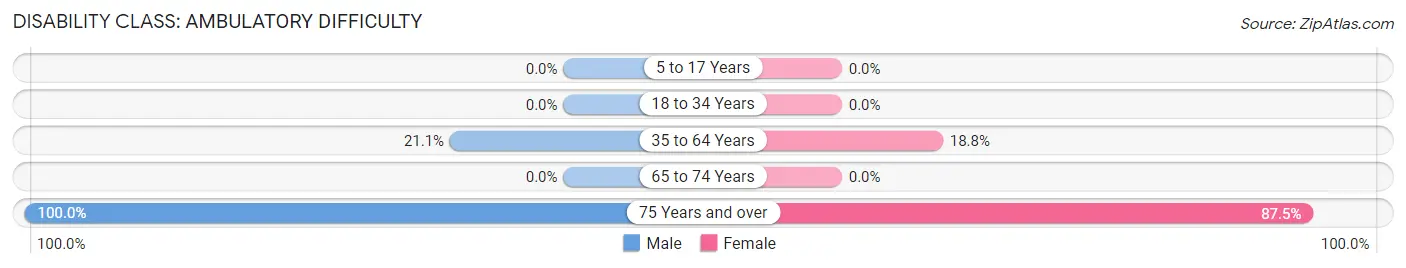
| Age Bracket | Male | Female |
| 5 to 17 Years | 0 (0.0%) | 0 (0.0%) |
| 18 to 34 Years | 0 (0.0%) | 0 (0.0%) |
| 35 to 64 Years | 4 (21.0%) | 3 (18.8%) |
| 65 to 74 Years | 0 (0.0%) | 0 (0.0%) |
| 75 Years and over | 2 (100.0%) | 14 (87.5%) |
Disability Class: Self-Care Difficulty
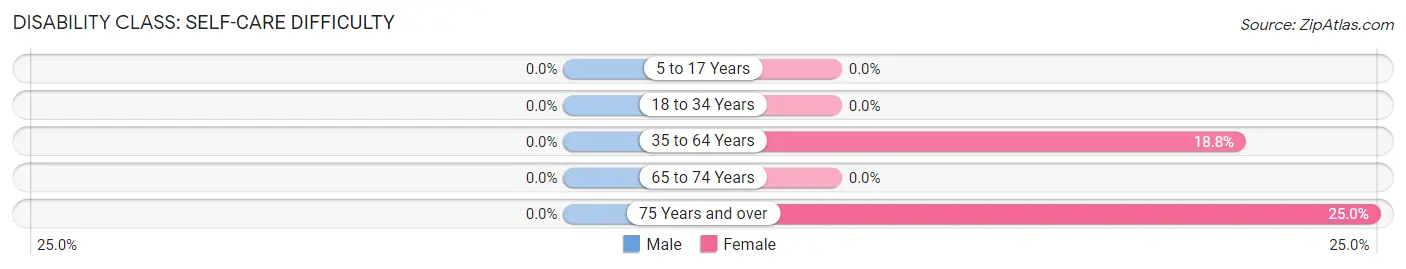
| Age Bracket | Male | Female |
| 5 to 17 Years | 0 (0.0%) | 0 (0.0%) |
| 18 to 34 Years | 0 (0.0%) | 0 (0.0%) |
| 35 to 64 Years | 0 (0.0%) | 3 (18.8%) |
| 65 to 74 Years | 0 (0.0%) | 0 (0.0%) |
| 75 Years and over | 0 (0.0%) | 4 (25.0%) |
Technology Access in Kansas
Computing Device Access in Kansas
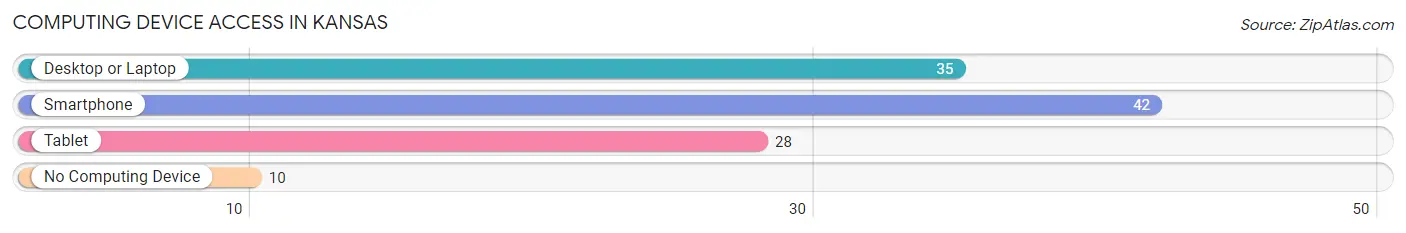
| Device Type | # Households | % Households |
| Desktop or Laptop | 35 | 60.3% |
| Smartphone | 42 | 72.4% |
| Tablet | 28 | 48.3% |
| No Computing Device | 10 | 17.2% |
| Total | 58 | 100.0% |
Internet Access in Kansas
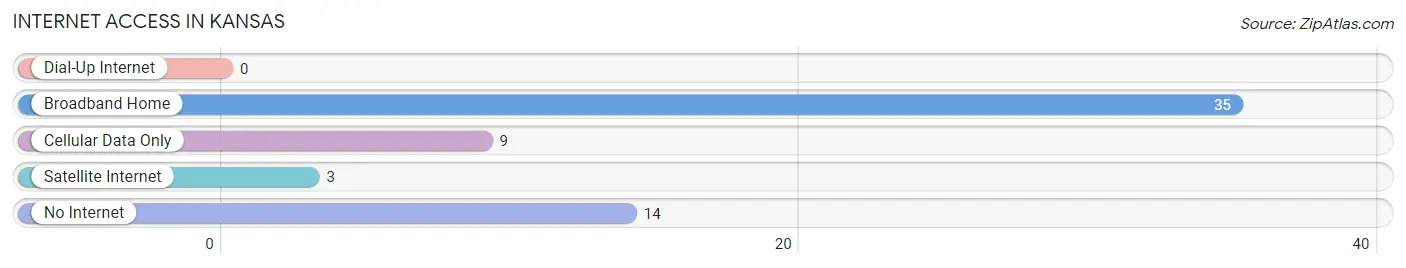
| Internet Type | # Households | % Households |
| Dial-Up Internet | 0 | 0.0% |
| Broadband Home | 35 | 60.3% |
| Cellular Data Only | 9 | 15.5% |
| Satellite Internet | 3 | 5.2% |
| No Internet | 14 | 24.1% |
| Total | 58 | 100.0% |
Kansas Summary
Kansas is a state located in the Midwestern United States. It is bordered by Nebraska to the north, Missouri to the east, Oklahoma to the south, and Colorado to the west. With an area of 82,278 square miles (213,100 km2), Kansas is the 15th-largest state by area and is the 34th most-populous of the 50 states with a population of 2,913,314. Kansas is bordered by Nebraska on the north; Missouri on the east; Oklahoma on the south; and Colorado on the west.
History
The area now known as Kansas was first settled by Native Americans in the late 17th century. The first European to explore the area was the French explorer Etienne de Veniard, Sieur de Bourgmont, who explored the area in 1724. The first permanent settlement was established in 1827 by the American Fur Company. The area was opened to settlement by the Kansas-Nebraska Act of 1854, which allowed settlers to choose whether they wanted to live in a free or slave state.
The state of Kansas was admitted to the Union on January 29, 1861, as the 34th state. During the Civil War, Kansas was a major battleground, with several battles fought in the state. After the war, Kansas experienced a period of rapid growth and development, becoming an important agricultural and industrial center.
Geography
Kansas is located in the Midwestern United States. It is bordered by Nebraska to the north, Missouri to the east, Oklahoma to the south, and Colorado to the west. With an area of 82,278 square miles (213,100 km2), Kansas is the 15th-largest state by area and is the 34th most-populous of the 50 states with a population of 2,913,314.
The state is divided into 105 counties and contains 628 incorporated cities and towns. The capital of Kansas is Topeka, located in the northeast corner of the state. Other major cities include Wichita, Kansas City, Lawrence, and Salina.
The geography of Kansas is diverse, with the eastern two-thirds of the state consisting of gently rolling hills and prairies, while the western third is characterized by rugged mountains and high plains. The highest point in Kansas is Mount Sunflower, located in Wallace County in the northwest corner of the state.
Economy
The economy of Kansas is largely based on agriculture, with wheat, corn, and sorghum being the state’s major crops. Other important agricultural products include soybeans, hay, and livestock. Kansas is also a major producer of petroleum and natural gas.
Manufacturing is also an important part of the state’s economy, with aircraft, transportation equipment, food processing, and printing and publishing being the major industries. Kansas is also home to several major corporations, including Sprint, Cessna, and Koch Industries.
Demographics
As of the 2010 census, the population of Kansas was 2,913,314, making it the 34th most populous state in the United States. The racial makeup of the state was 85.3% White, 6.8% Black or African American, 1.7% American Indian and Alaska Native, 2.7% Asian, 0.1% Native Hawaiian and other Pacific Islander, and 3.4% from two or more races.
The median household income in Kansas was $53,906 in 2019, and the median family income was $68,945. The poverty rate in the state was 11.3%, with 15.3% of children under the age of 18 living in poverty. The largest cities in Kansas are Wichita, Kansas City, Topeka, and Olathe.
Common Questions
What is Per Capita Income in Kansas?
Per Capita income in Kansas is $24,413.
What is the Median Family Income in Kansas?
Median Family Income in Kansas is $73,750.
What is the Median Household income in Kansas?
Median Household Income in Kansas is $40,833.
What is Inequality or Gini Index in Kansas?
Inequality or Gini Index in Kansas is 0.41.
What is the Total Population of Kansas?
Total Population of Kansas is 109.
What is the Total Male Population of Kansas?
Total Male Population of Kansas is 52.
What is the Total Female Population of Kansas?
Total Female Population of Kansas is 57.
What is the Ratio of Males per 100 Females in Kansas?
There are 91.23 Males per 100 Females in Kansas.
What is the Ratio of Females per 100 Males in Kansas?
There are 109.62 Females per 100 Males in Kansas.
What is the Median Population Age in Kansas?
Median Population Age in Kansas is 59.9 Years.
What is the Average Family Size in Kansas
Average Family Size in Kansas is 2.6 People.
What is the Average Household Size in Kansas
Average Household Size in Kansas is 1.9 People.
How Large is the Labor Force in Kansas?
There are 46 People in the Labor Forcein in Kansas.
What is the Percentage of People in the Labor Force in Kansas?
45.1% of People are in the Labor Force in Kansas.