Benton, AL Map & Demographics
Benton Map
Benton Overview
$42,704
PER CAPITA INCOME
$89,000
AVG FAMILY INCOME
$44,583
AVG HOUSEHOLD INCOME
0.21
INEQUALITY / GINI INDEX
27
TOTAL POPULATION
18
MALE POPULATION
9
FEMALE POPULATION
200.00
MALES / 100 FEMALES
50.00
FEMALES / 100 MALES
61.2
MEDIAN AGE
2.1
AVG FAMILY SIZE
1.5
AVG HOUSEHOLD SIZE
17
LABOR FORCE [ PEOPLE ]
63.0%
PERCENT IN LABOR FORCE
Benton Area Codes
Income in Benton
Income Overview in Benton
Per Capita Income in Benton is $42,704, while median incomes of families and households are $89,000 and $44,583 respectively.
| Characteristic | Number | Measure |
| Per Capita Income | 27 | $42,704 |
| Median Family Income | 8 | $89,000 |
| Mean Family Income | 8 | $90,188 |
| Median Household Income | 18 | $44,583 |
| Mean Household Income | 18 | $64,056 |
| Income Deficit | 8 | $0 |
| Wage / Income Gap (%) | 27 | 0.00% |
| Wage / Income Gap ($) | 27 | 100.00¢ per $1 |
| Gini / Inequality Index | 27 | 0.21 |
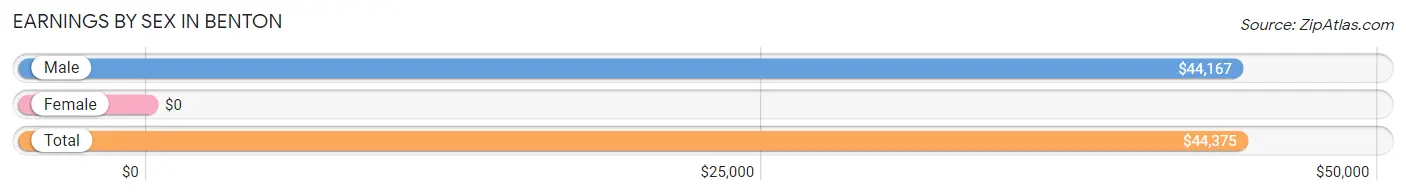
Earnings by Sex in Benton
| Sex | Number | Average Earnings |
| Male | 16 (94.1%) | $44,167 |
| Female | 1 (5.9%) | $0 |
| Total | 17 (100.0%) | $44,375 |
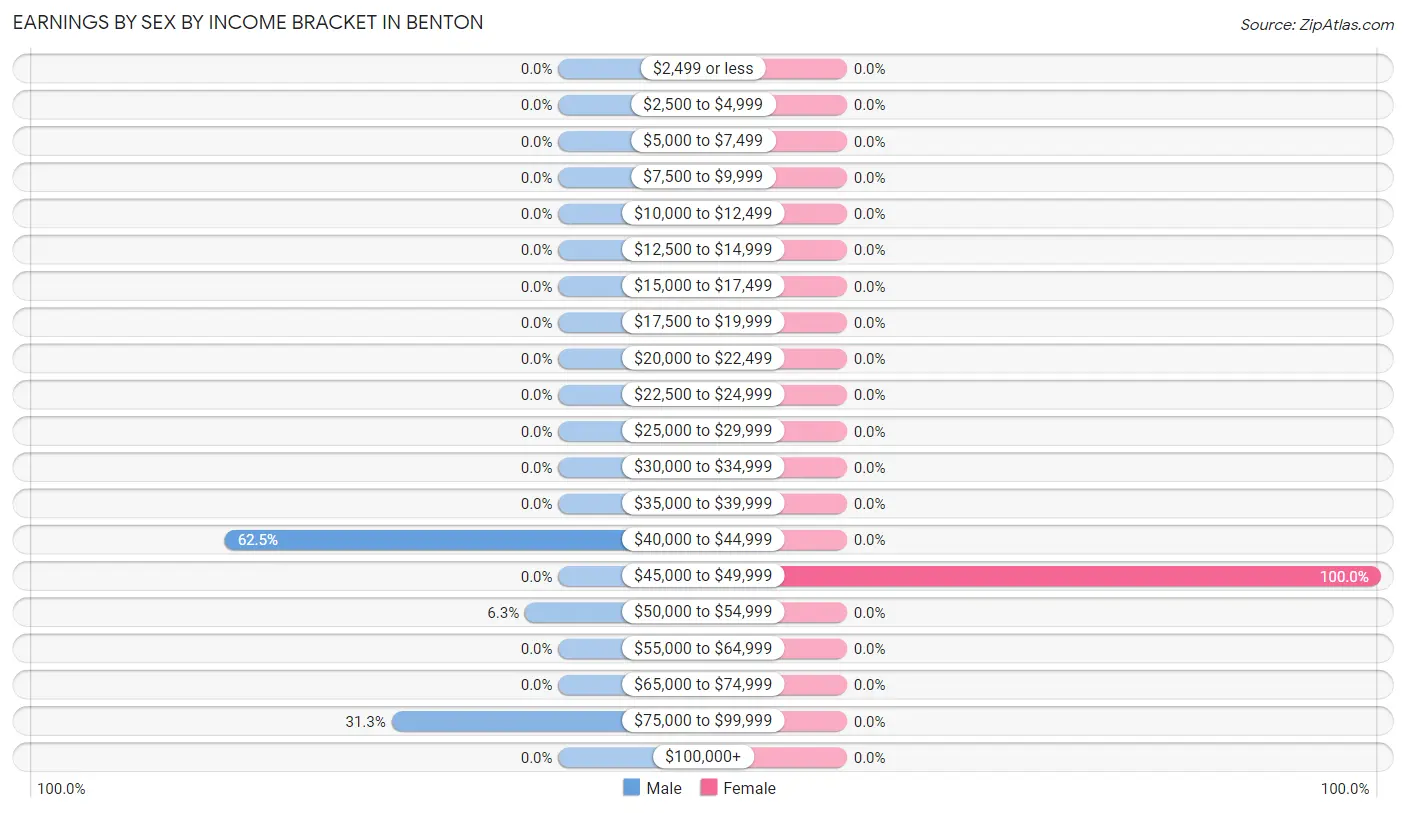
Earnings by Sex by Income Bracket in Benton
The most common earnings brackets in Benton are $40,000 to $44,999 for men (10 | 62.5%) and $45,000 to $49,999 for women (1 | 100.0%).
| Income | Male | Female |
| $2,499 or less | 0 (0.0%) | 0 (0.0%) |
| $2,500 to $4,999 | 0 (0.0%) | 0 (0.0%) |
| $5,000 to $7,499 | 0 (0.0%) | 0 (0.0%) |
| $7,500 to $9,999 | 0 (0.0%) | 0 (0.0%) |
| $10,000 to $12,499 | 0 (0.0%) | 0 (0.0%) |
| $12,500 to $14,999 | 0 (0.0%) | 0 (0.0%) |
| $15,000 to $17,499 | 0 (0.0%) | 0 (0.0%) |
| $17,500 to $19,999 | 0 (0.0%) | 0 (0.0%) |
| $20,000 to $22,499 | 0 (0.0%) | 0 (0.0%) |
| $22,500 to $24,999 | 0 (0.0%) | 0 (0.0%) |
| $25,000 to $29,999 | 0 (0.0%) | 0 (0.0%) |
| $30,000 to $34,999 | 0 (0.0%) | 0 (0.0%) |
| $35,000 to $39,999 | 0 (0.0%) | 0 (0.0%) |
| $40,000 to $44,999 | 10 (62.5%) | 0 (0.0%) |
| $45,000 to $49,999 | 0 (0.0%) | 1 (100.0%) |
| $50,000 to $54,999 | 1 (6.2%) | 0 (0.0%) |
| $55,000 to $64,999 | 0 (0.0%) | 0 (0.0%) |
| $65,000 to $74,999 | 0 (0.0%) | 0 (0.0%) |
| $75,000 to $99,999 | 5 (31.2%) | 0 (0.0%) |
| $100,000+ | 0 (0.0%) | 0 (0.0%) |
| Total | 16 (100.0%) | 1 (100.0%) |
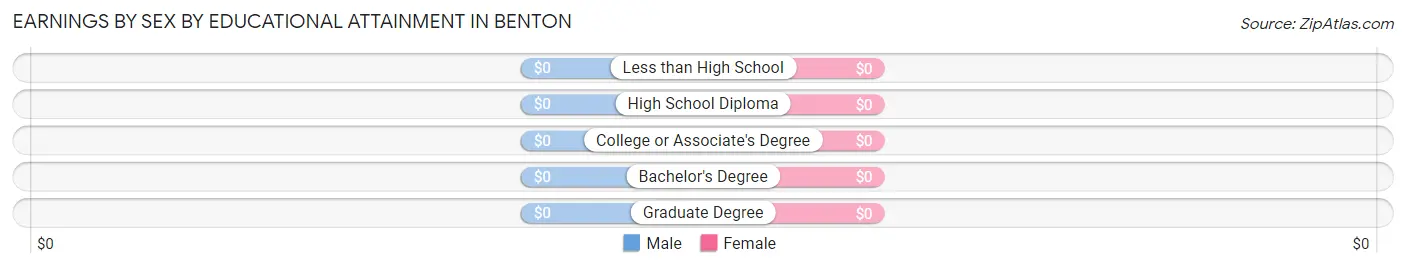
Earnings by Sex by Educational Attainment in Benton
| Educational Attainment | Male Income | Female Income |
| Less than High School | - | - |
| High School Diploma | - | - |
| College or Associate's Degree | - | - |
| Bachelor's Degree | - | - |
| Graduate Degree | - | - |
| Total | $44,167 | $0 |
Family Income in Benton
Family Income Brackets in Benton
According to the Benton family income data, there are 5 families falling into the $75,000 to $99,999 income range, which is the most common income bracket and makes up 62.5% of all families.
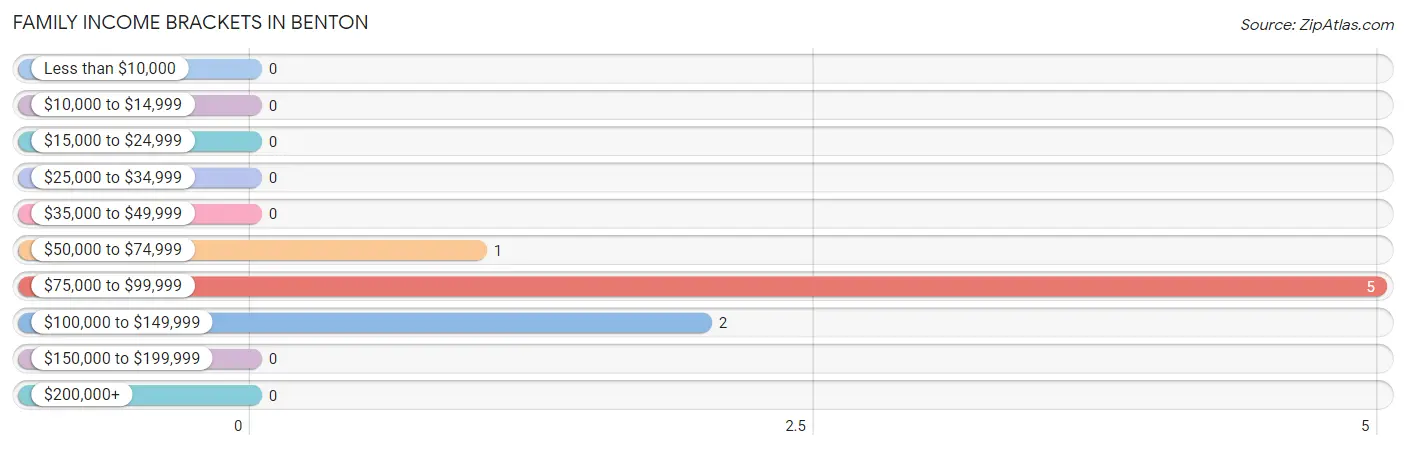
| Income Bracket | # Families | % Families |
| Less than $10,000 | 0 | 0.0% |
| $10,000 to $14,999 | 0 | 0.0% |
| $15,000 to $24,999 | 0 | 0.0% |
| $25,000 to $34,999 | 0 | 0.0% |
| $35,000 to $49,999 | 0 | 0.0% |
| $50,000 to $74,999 | 1 | 12.5% |
| $75,000 to $99,999 | 5 | 62.5% |
| $100,000 to $149,999 | 2 | 25.0% |
| $150,000 to $199,999 | 0 | 0.0% |
| $200,000+ | 0 | 0.0% |
Family Income by Famaliy Size in Benton
2-person families (8 | 100.0%) account for the highest median family income in Benton with $89,000 per family, while 2-person families (8 | 100.0%) have the highest median income of $44,500 per family member.
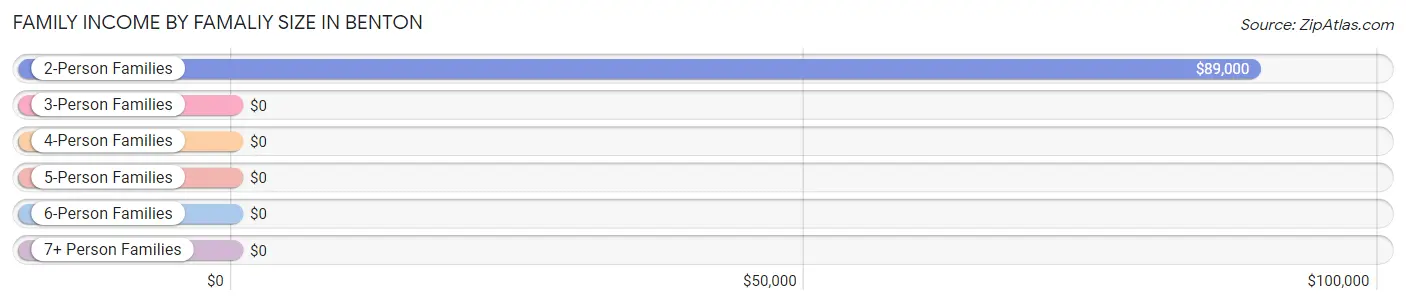
| Income Bracket | # Families | Median Income |
| 2-Person Families | 8 (100.0%) | $89,000 |
| 3-Person Families | 0 (0.0%) | $0 |
| 4-Person Families | 0 (0.0%) | $0 |
| 5-Person Families | 0 (0.0%) | $0 |
| 6-Person Families | 0 (0.0%) | $0 |
| 7+ Person Families | 0 (0.0%) | $0 |
| Total | 8 (100.0%) | $89,000 |
Family Income by Number of Earners in Benton
| Number of Earners | # Families | Median Income |
| No Earners | 2 (25.0%) | $0 |
| 1 Earner | 5 (62.5%) | $0 |
| 2 Earners | 1 (12.5%) | $0 |
| 3+ Earners | 0 (0.0%) | $0 |
| Total | 8 (100.0%) | $89,000 |
Household Income in Benton
Household Income Brackets in Benton
With 10 households falling in the category, the $35,000 to $49,999 income range is the most frequent in Benton, accounting for 55.6% of all households.
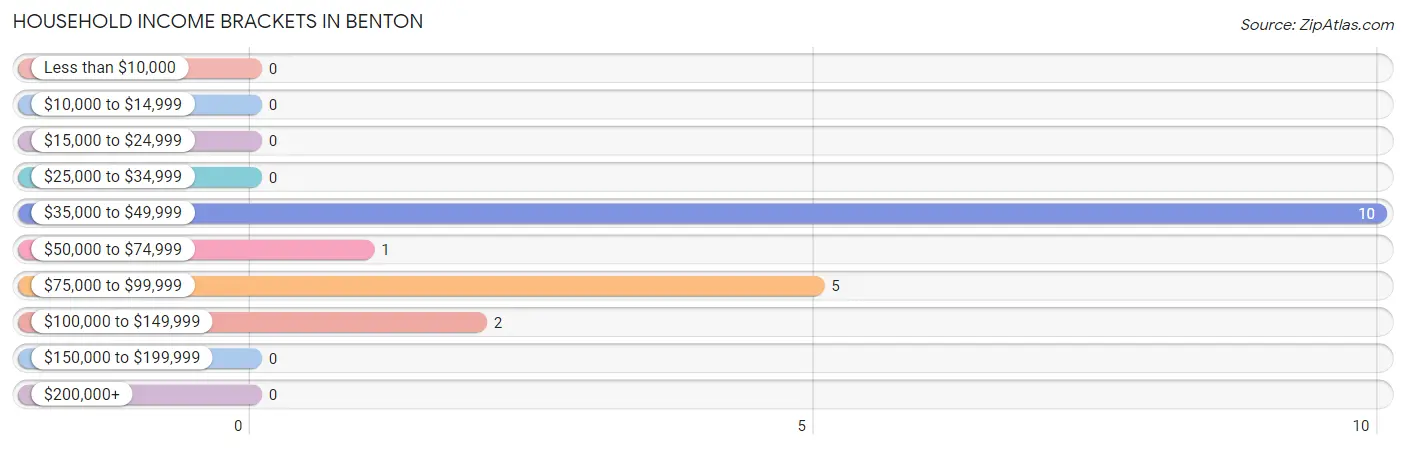
| Income Bracket | # Households | % Households |
| Less than $10,000 | 0 | 0.0% |
| $10,000 to $14,999 | 0 | 0.0% |
| $15,000 to $24,999 | 0 | 0.0% |
| $25,000 to $34,999 | 0 | 0.0% |
| $35,000 to $49,999 | 10 | 55.6% |
| $50,000 to $74,999 | 1 | 5.6% |
| $75,000 to $99,999 | 5 | 27.8% |
| $100,000 to $149,999 | 2 | 11.1% |
| $150,000 to $199,999 | 0 | 0.0% |
| $200,000+ | 0 | 0.0% |
Household Income by Householder Age in Benton
The median household income in Benton is $44,583, with the highest median household income of $44,375 found in the 45 to 64 years age bracket for the primary householder. A total of 17 households (94.4%) fall into this category.
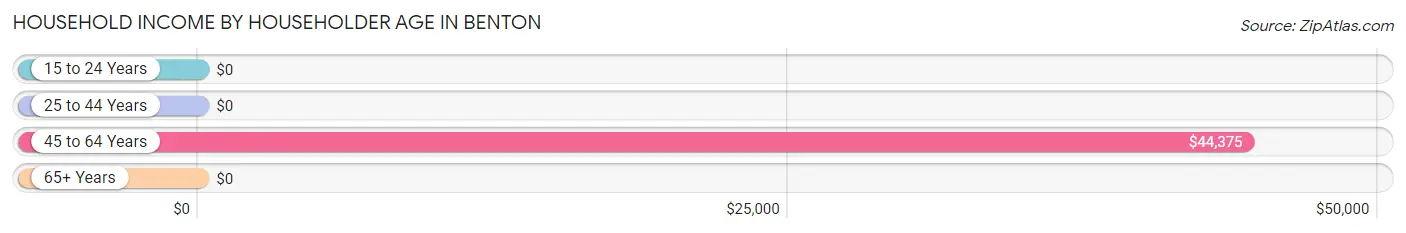
| Income Bracket | # Households | Median Income |
| 15 to 24 Years | 0 (0.0%) | $0 |
| 25 to 44 Years | 0 (0.0%) | $0 |
| 45 to 64 Years | 17 (94.4%) | $44,375 |
| 65+ Years | 1 (5.6%) | $0 |
| Total | 18 (100.0%) | $44,583 |
Poverty in Benton
Income Below Poverty by Sex and Age in Benton
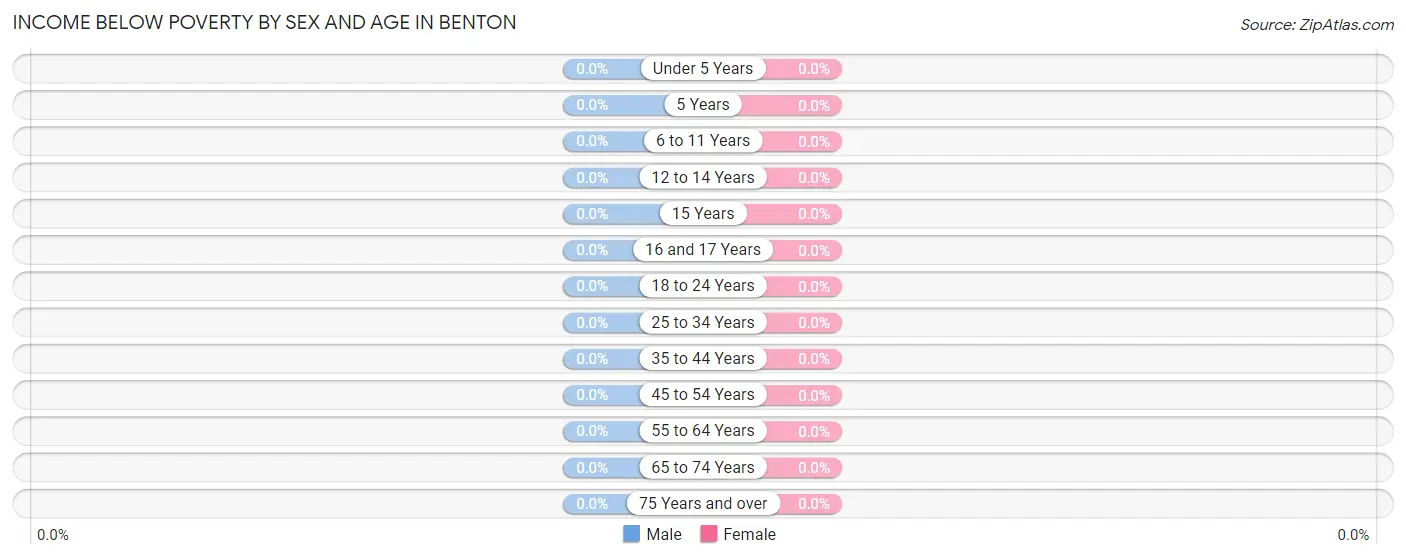
| Age Bracket | Male | Female |
| Under 5 Years | 0 (0.0%) | 0 (0.0%) |
| 5 Years | 0 (0.0%) | 0 (0.0%) |
| 6 to 11 Years | 0 (0.0%) | 0 (0.0%) |
| 12 to 14 Years | 0 (0.0%) | 0 (0.0%) |
| 15 Years | 0 (0.0%) | 0 (0.0%) |
| 16 and 17 Years | 0 (0.0%) | 0 (0.0%) |
| 18 to 24 Years | 0 (0.0%) | 0 (0.0%) |
| 25 to 34 Years | 0 (0.0%) | 0 (0.0%) |
| 35 to 44 Years | 0 (0.0%) | 0 (0.0%) |
| 45 to 54 Years | 0 (0.0%) | 0 (0.0%) |
| 55 to 64 Years | 0 (0.0%) | 0 (0.0%) |
| 65 to 74 Years | 0 (0.0%) | 0 (0.0%) |
| 75 Years and over | 0 (0.0%) | 0 (0.0%) |
| Total | 0 (0.0%) | 0 (0.0%) |
Income Above Poverty by Sex and Age in Benton
According to the poverty statistics in Benton, males aged 55 to 64 years and females aged 55 to 64 years are the age groups that are most secure financially, with 100.0% of males and 100.0% of females in these age groups living above the poverty line.
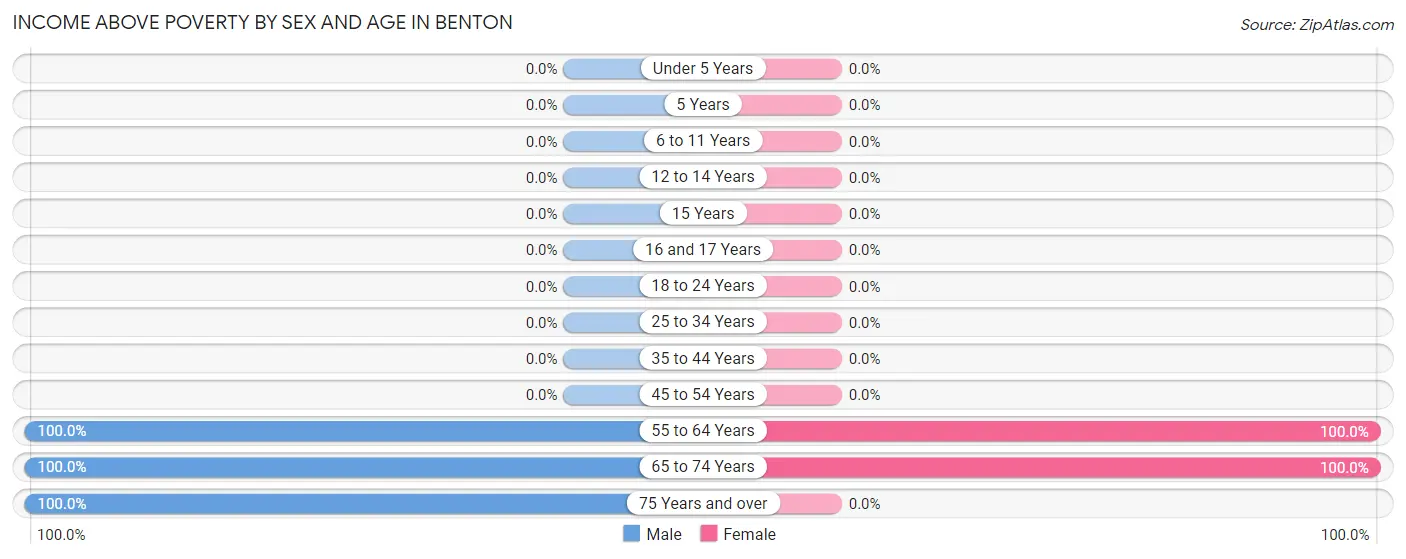
| Age Bracket | Male | Female |
| Under 5 Years | 0 (0.0%) | 0 (0.0%) |
| 5 Years | 0 (0.0%) | 0 (0.0%) |
| 6 to 11 Years | 0 (0.0%) | 0 (0.0%) |
| 12 to 14 Years | 0 (0.0%) | 0 (0.0%) |
| 15 Years | 0 (0.0%) | 0 (0.0%) |
| 16 and 17 Years | 0 (0.0%) | 0 (0.0%) |
| 18 to 24 Years | 0 (0.0%) | 0 (0.0%) |
| 25 to 34 Years | 0 (0.0%) | 0 (0.0%) |
| 35 to 44 Years | 0 (0.0%) | 0 (0.0%) |
| 45 to 54 Years | 0 (0.0%) | 0 (0.0%) |
| 55 to 64 Years | 16 (100.0%) | 8 (100.0%) |
| 65 to 74 Years | 1 (100.0%) | 1 (100.0%) |
| 75 Years and over | 1 (100.0%) | 0 (0.0%) |
| Total | 18 (100.0%) | 9 (100.0%) |
Income Below Poverty Among Married-Couple Families in Benton
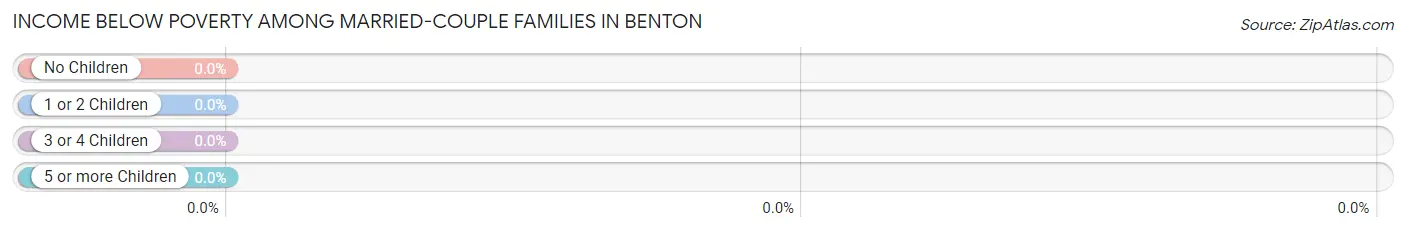
| Children | Above Poverty | Below Poverty |
| No Children | 8 (100.0%) | 0 (0.0%) |
| 1 or 2 Children | 0 (0.0%) | 0 (0.0%) |
| 3 or 4 Children | 0 (0.0%) | 0 (0.0%) |
| 5 or more Children | 0 (0.0%) | 0 (0.0%) |
| Total | 8 (100.0%) | 0 (0.0%) |
Income Below Poverty Among Single-Parent Households in Benton
| Children | Single Father | Single Mother |
| No Children | 0 (0.0%) | 0 (0.0%) |
| 1 or 2 Children | 0 (0.0%) | 0 (0.0%) |
| 3 or 4 Children | 0 (0.0%) | 0 (0.0%) |
| 5 or more Children | 0 (0.0%) | 0 (0.0%) |
| Total | 0 (0.0%) | 0 (0.0%) |
Income Below Poverty Among Married-Couple vs Single-Parent Households in Benton
| Children | Married-Couple Families | Single-Parent Households |
| No Children | 0 (0.0%) | 0 (0.0%) |
| 1 or 2 Children | 0 (0.0%) | 0 (0.0%) |
| 3 or 4 Children | 0 (0.0%) | 0 (0.0%) |
| 5 or more Children | 0 (0.0%) | 0 (0.0%) |
| Total | 0 (0.0%) | 0 (0.0%) |
Race in Benton
The most populous races in Benton are White / Caucasian (16 | 59.3%), and Two or more Races (11 | 40.7%).
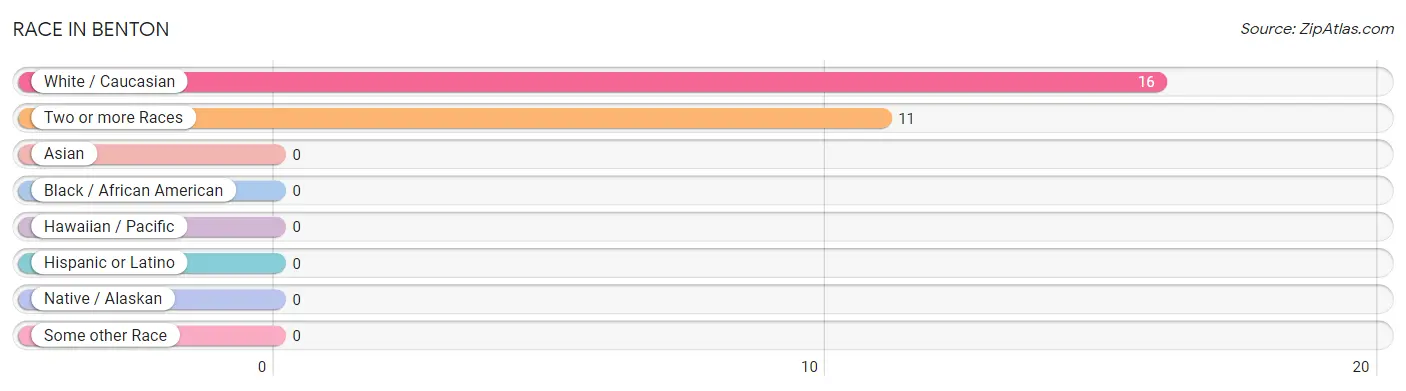
| Race | # Population | % Population |
| Asian | 0 | 0.0% |
| Black / African American | 0 | 0.0% |
| Hawaiian / Pacific | 0 | 0.0% |
| Hispanic or Latino | 0 | 0.0% |
| Native / Alaskan | 0 | 0.0% |
| White / Caucasian | 16 | 59.3% |
| Two or more Races | 11 | 40.7% |
| Some other Race | 0 | 0.0% |
| Total | 27 | 100.0% |
Ancestry in Benton
The most populous ancestries reported in Benton are Irish (11 | 40.7%), American (6 | 22.2%), European (1 | 3.7%), German (1 | 3.7%), and Italian (1 | 3.7%), together accounting for 74.1% of all Benton residents.
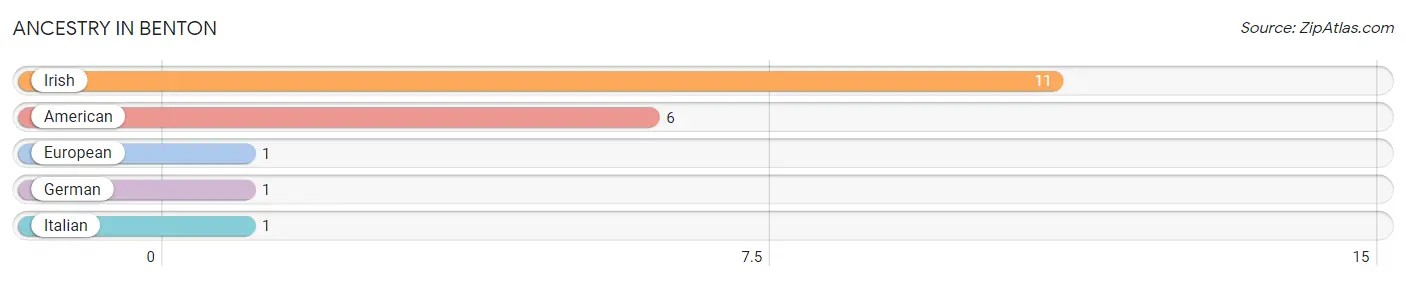
| Ancestry | # Population | % Population |
| American | 6 | 22.2% |
| European | 1 | 3.7% |
| German | 1 | 3.7% |
| Irish | 11 | 40.7% |
| Italian | 1 | 3.7% | View All 5 Rows |
Immigrants in Benton

| Immigration Origin | # Population | % Population | View All 0 Rows |
Sex and Age in Benton
Sex and Age in Benton
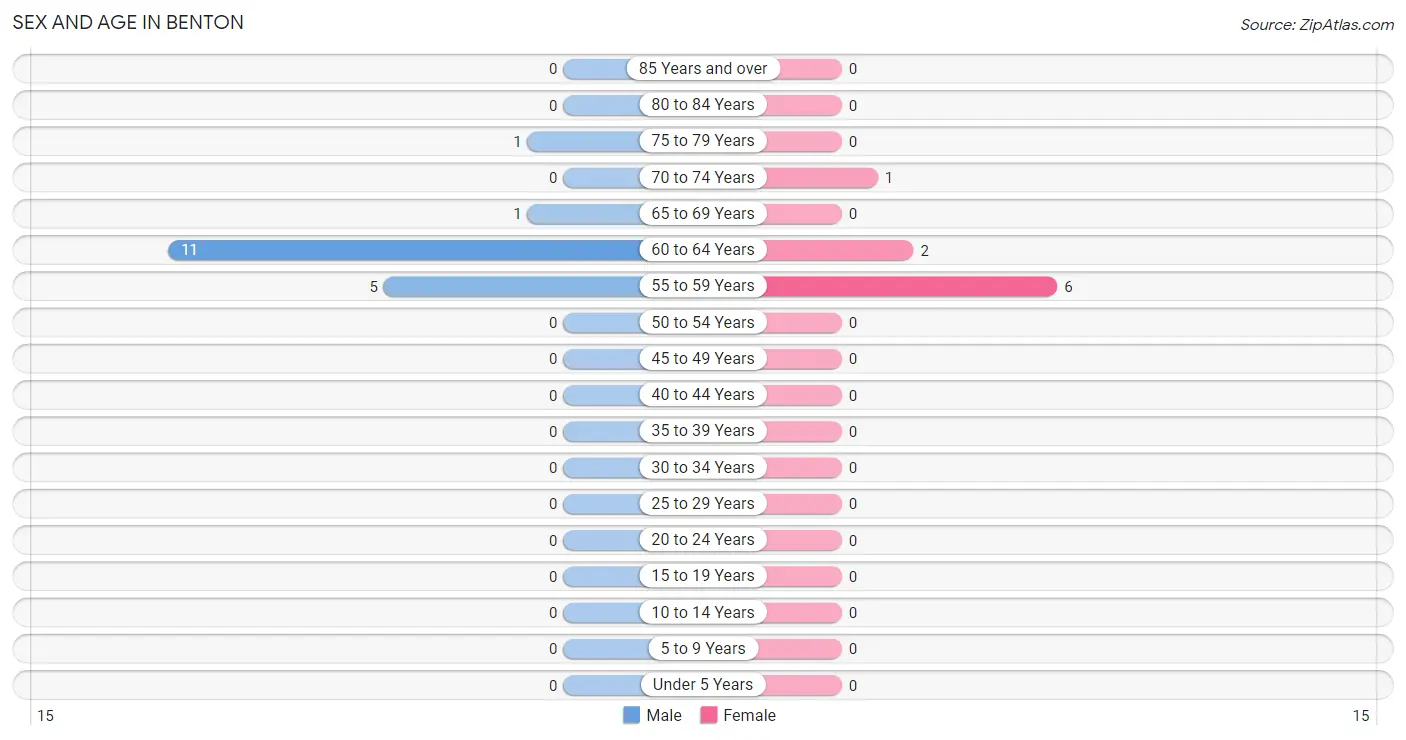
The most populous age groups in Benton are 60 to 64 Years (11 | 61.1%) for men and 55 to 59 Years (6 | 66.7%) for women.
| Age Bracket | Male | Female |
| Under 5 Years | 0 (0.0%) | 0 (0.0%) |
| 5 to 9 Years | 0 (0.0%) | 0 (0.0%) |
| 10 to 14 Years | 0 (0.0%) | 0 (0.0%) |
| 15 to 19 Years | 0 (0.0%) | 0 (0.0%) |
| 20 to 24 Years | 0 (0.0%) | 0 (0.0%) |
| 25 to 29 Years | 0 (0.0%) | 0 (0.0%) |
| 30 to 34 Years | 0 (0.0%) | 0 (0.0%) |
| 35 to 39 Years | 0 (0.0%) | 0 (0.0%) |
| 40 to 44 Years | 0 (0.0%) | 0 (0.0%) |
| 45 to 49 Years | 0 (0.0%) | 0 (0.0%) |
| 50 to 54 Years | 0 (0.0%) | 0 (0.0%) |
| 55 to 59 Years | 5 (27.8%) | 6 (66.7%) |
| 60 to 64 Years | 11 (61.1%) | 2 (22.2%) |
| 65 to 69 Years | 1 (5.6%) | 0 (0.0%) |
| 70 to 74 Years | 0 (0.0%) | 1 (11.1%) |
| 75 to 79 Years | 1 (5.6%) | 0 (0.0%) |
| 80 to 84 Years | 0 (0.0%) | 0 (0.0%) |
| 85 Years and over | 0 (0.0%) | 0 (0.0%) |
| Total | 18 (100.0%) | 9 (100.0%) |
Families and Households in Benton
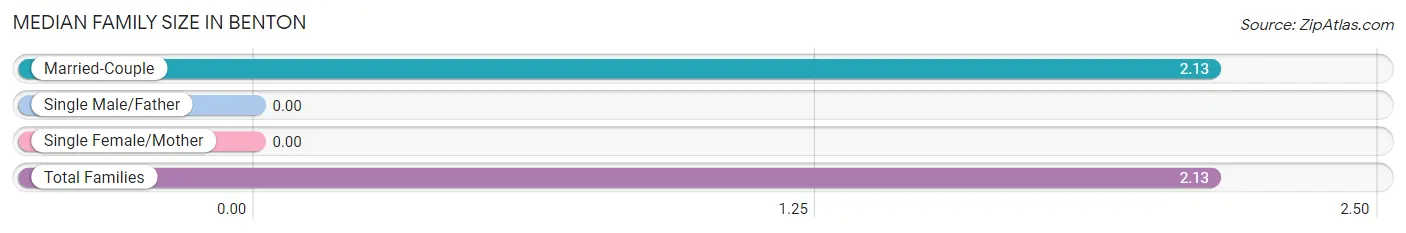
Median Family Size in Benton
| Family Type | # Families | Family Size |
| Married-Couple | 8 (100.0%) | 2.13 |
| Single Male/Father | 0 (0.0%) | - |
| Single Female/Mother | 0 (0.0%) | - |
| Total Families | 8 (100.0%) | 2.13 |
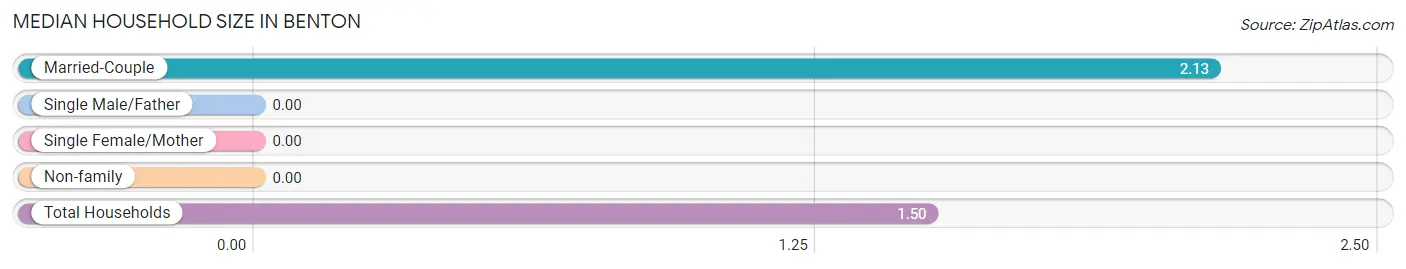
Median Household Size in Benton
| Household Type | # Households | Household Size |
| Married-Couple | 8 (44.4%) | 2.13 |
| Single Male/Father | 0 (0.0%) | - |
| Single Female/Mother | 0 (0.0%) | - |
| Non-family | 10 (55.6%) | - |
| Total Households | 18 (100.0%) | 1.50 |
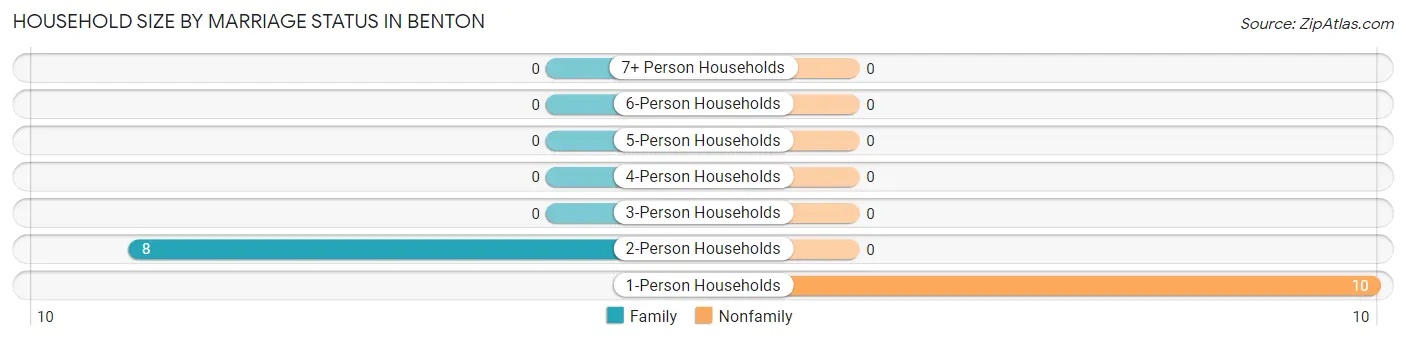
Household Size by Marriage Status in Benton
Out of a total of 18 households in Benton, 8 (44.4%) are family households, while 10 (55.6%) are nonfamily households. The most numerous type of family households are 2-person households, comprising 8, and the most common type of nonfamily households are 1-person households, comprising 10.
| Household Size | Family Households | Nonfamily Households |
| 1-Person Households | - | 10 (55.6%) |
| 2-Person Households | 8 (44.4%) | 0 (0.0%) |
| 3-Person Households | 0 (0.0%) | 0 (0.0%) |
| 4-Person Households | 0 (0.0%) | 0 (0.0%) |
| 5-Person Households | 0 (0.0%) | 0 (0.0%) |
| 6-Person Households | 0 (0.0%) | 0 (0.0%) |
| 7+ Person Households | 0 (0.0%) | 0 (0.0%) |
| Total | 8 (44.4%) | 10 (55.6%) |
Female Fertility in Benton
Fertility by Age in Benton
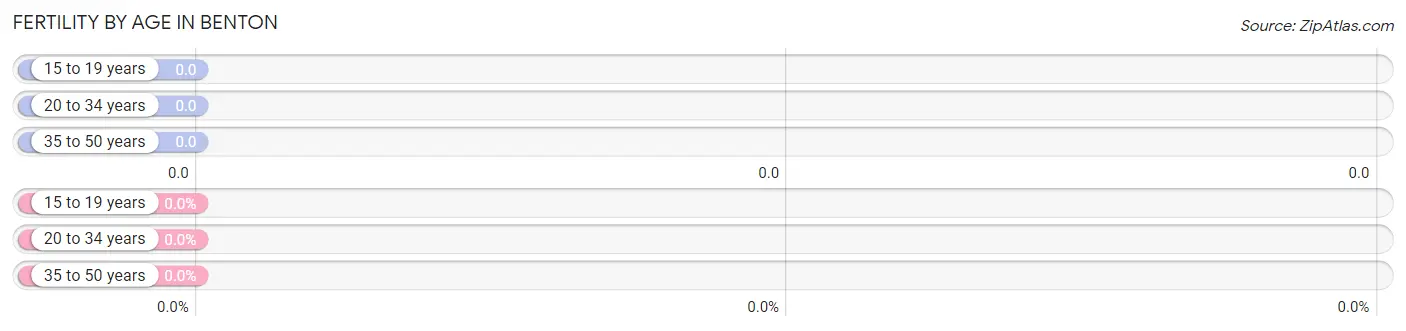
| Age Bracket | Women with Births | Births / 1,000 Women |
| 15 to 19 years | 0 (0.0%) | 0.0 |
| 20 to 34 years | 0 (0.0%) | 0.0 |
| 35 to 50 years | 0 (0.0%) | 0.0 |
| Total | 0 (0.0%) | 0.0 |
Fertility by Age by Marriage Status in Benton
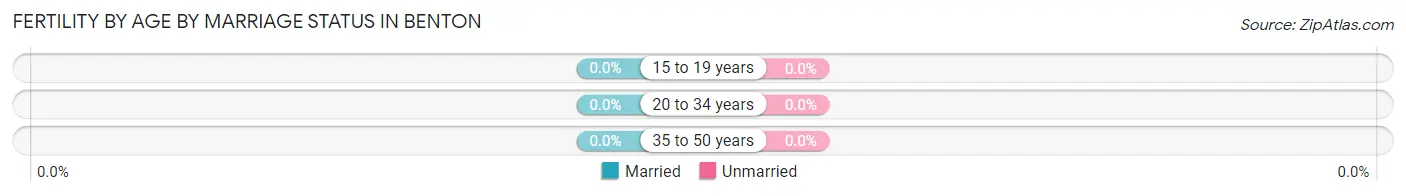
| Age Bracket | Married | Unmarried |
| 15 to 19 years | 0 (0.0%) | 0 (0.0%) |
| 20 to 34 years | 0 (0.0%) | 0 (0.0%) |
| 35 to 50 years | 0 (0.0%) | 0 (0.0%) |
| Total | 0 (0.0%) | 0 (0.0%) |
Fertility by Education in Benton
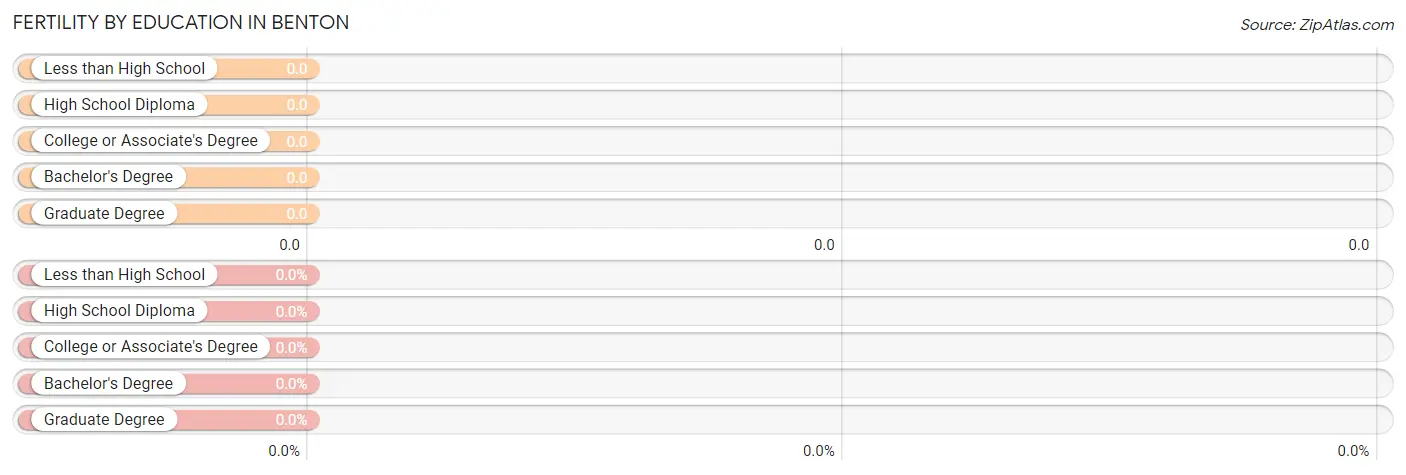
| Educational Attainment | Women with Births | Births / 1,000 Women |
| Less than High School | 0 (0.0%) | 0.0 |
| High School Diploma | 0 (0.0%) | 0.0 |
| College or Associate's Degree | 0 (0.0%) | 0.0 |
| Bachelor's Degree | 0 (0.0%) | 0.0 |
| Graduate Degree | 0 (0.0%) | 0.0 |
| Total | 0 (0.0%) | 0.0 |
Fertility by Education by Marriage Status in Benton
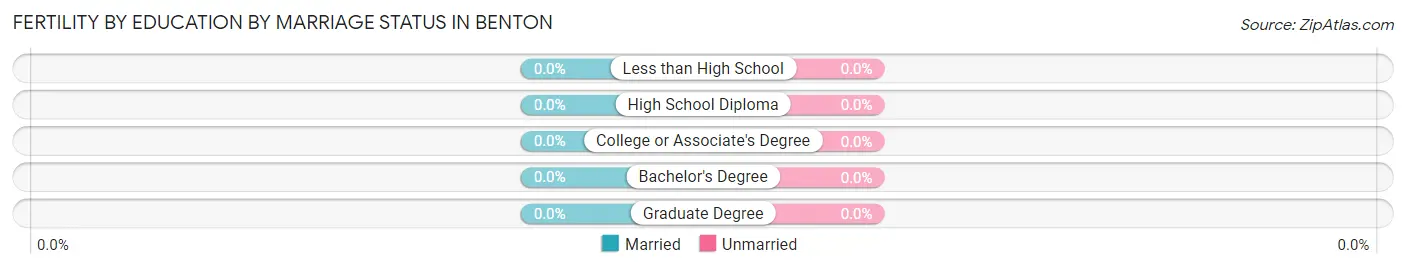
| Educational Attainment | Married | Unmarried |
| Less than High School | 0 (0.0%) | 0 (0.0%) |
| High School Diploma | 0 (0.0%) | 0 (0.0%) |
| College or Associate's Degree | 0 (0.0%) | 0 (0.0%) |
| Bachelor's Degree | 0 (0.0%) | 0 (0.0%) |
| Graduate Degree | 0 (0.0%) | 0 (0.0%) |
| Total | 0 (0.0%) | 0 (0.0%) |
Employment Characteristics in Benton
Employment by Class of Employer in Benton
Among the 17 employed individuals in Benton, private company employees (16 | 94.1%), and federal government employees (1 | 5.9%) make up the most common classes of employment.
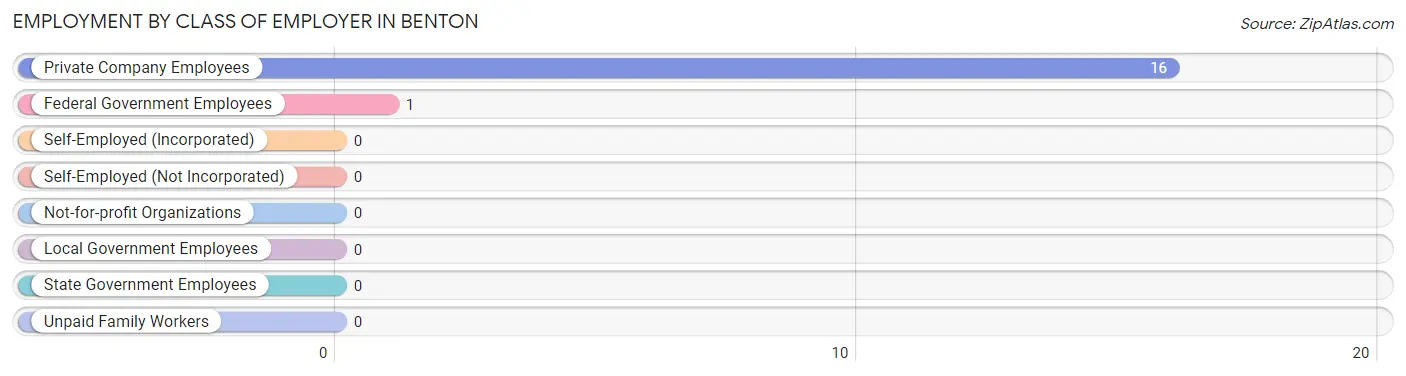
| Employer Class | # Employees | % Employees |
| Private Company Employees | 16 | 94.1% |
| Self-Employed (Incorporated) | 0 | 0.0% |
| Self-Employed (Not Incorporated) | 0 | 0.0% |
| Not-for-profit Organizations | 0 | 0.0% |
| Local Government Employees | 0 | 0.0% |
| State Government Employees | 0 | 0.0% |
| Federal Government Employees | 1 | 5.9% |
| Unpaid Family Workers | 0 | 0.0% |
| Total | 17 | 100.0% |
Employment Status by Age in Benton
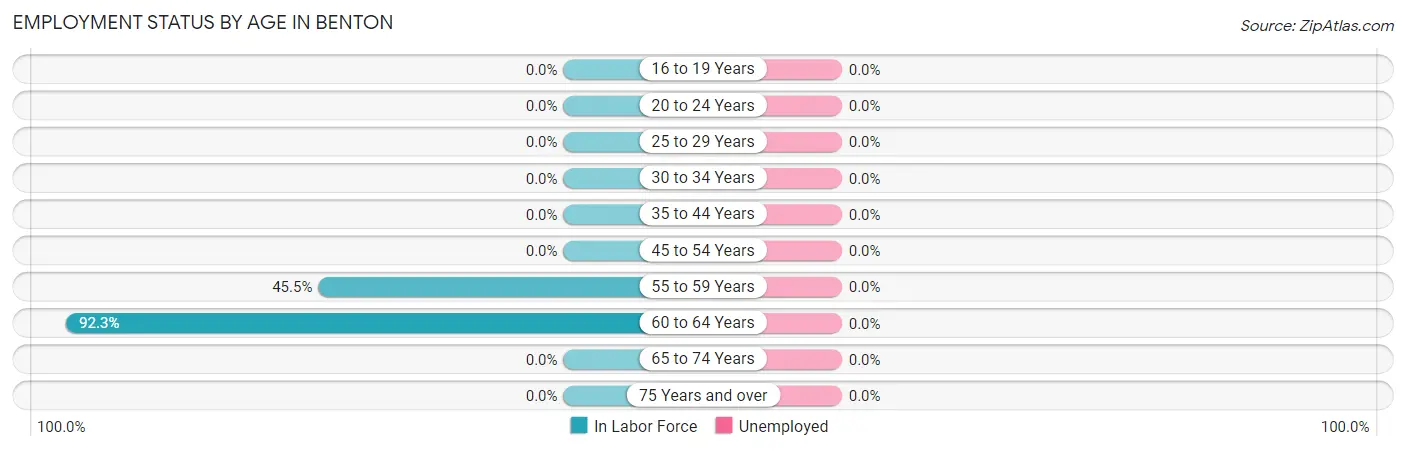
| Age Bracket | In Labor Force | Unemployed |
| 16 to 19 Years | 0 (0.0%) | 0 (0.0%) |
| 20 to 24 Years | 0 (0.0%) | 0 (0.0%) |
| 25 to 29 Years | 0 (0.0%) | 0 (0.0%) |
| 30 to 34 Years | 0 (0.0%) | 0 (0.0%) |
| 35 to 44 Years | 0 (0.0%) | 0 (0.0%) |
| 45 to 54 Years | 0 (0.0%) | 0 (0.0%) |
| 55 to 59 Years | 5 (45.5%) | 0 (0.0%) |
| 60 to 64 Years | 12 (92.3%) | 0 (0.0%) |
| 65 to 74 Years | 0 (0.0%) | 0 (0.0%) |
| 75 Years and over | 0 (0.0%) | 0 (0.0%) |
| Total | 17 (63.0%) | 0 (0.0%) |
Employment Status by Educational Attainment in Benton
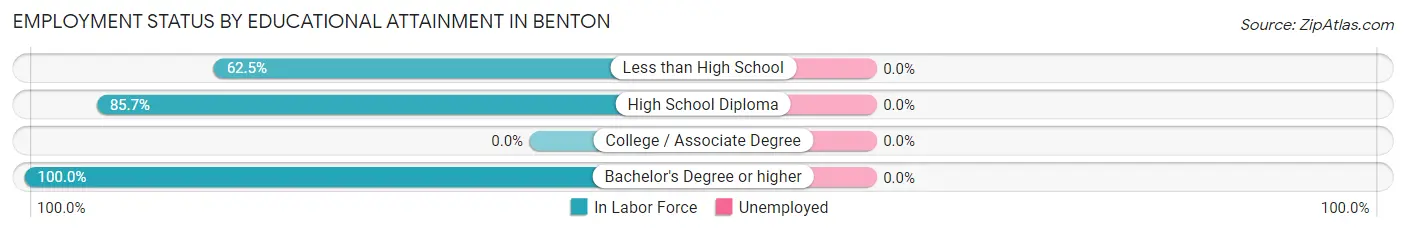
| Educational Attainment | In Labor Force | Unemployed |
| Less than High School | 10 (62.5%) | 0 (0.0%) |
| High School Diploma | 6 (85.7%) | 0 (0.0%) |
| College / Associate Degree | 0 (0.0%) | 0 (0.0%) |
| Bachelor's Degree or higher | 1 (100.0%) | 0 (0.0%) |
| Total | 17 (70.8%) | 0 (0.0%) |
Employment Occupations by Sex in Benton
Management, Business, Science and Arts Occupations
The most common Management, Business, Science and Arts occupations in Benton are Business & Financial (1 | 5.9%), Computers, Engineering & Science (1 | 5.9%), and Life, Physical & Social Science (1 | 5.9%).
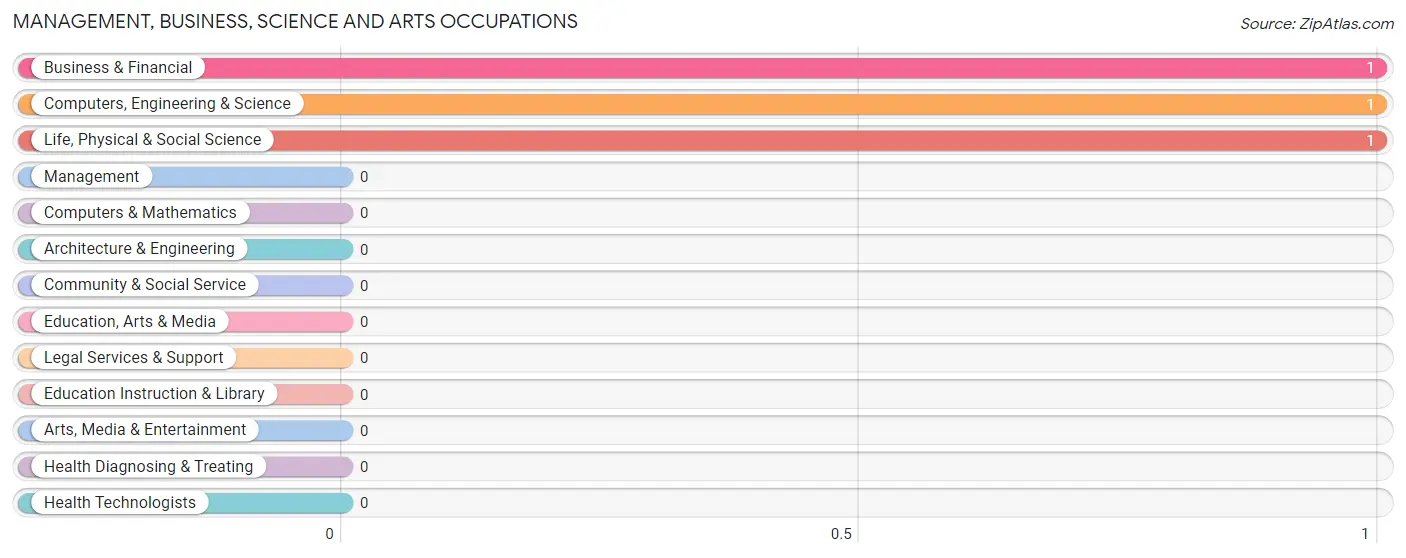
Management, Business, Science and Arts Occupations by Sex
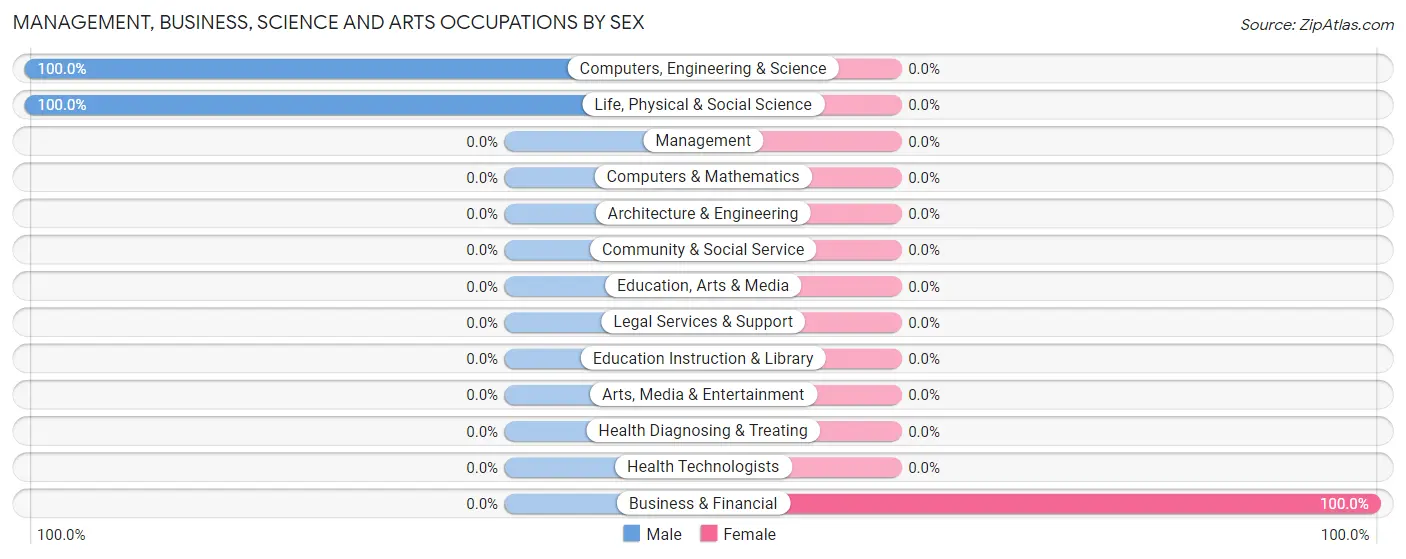
| Occupation | Male | Female |
| Management | 0 (0.0%) | 0 (0.0%) |
| Business & Financial | 0 (0.0%) | 1 (100.0%) |
| Computers, Engineering & Science | 1 (100.0%) | 0 (0.0%) |
| Computers & Mathematics | 0 (0.0%) | 0 (0.0%) |
| Architecture & Engineering | 0 (0.0%) | 0 (0.0%) |
| Life, Physical & Social Science | 1 (100.0%) | 0 (0.0%) |
| Community & Social Service | 0 (0.0%) | 0 (0.0%) |
| Education, Arts & Media | 0 (0.0%) | 0 (0.0%) |
| Legal Services & Support | 0 (0.0%) | 0 (0.0%) |
| Education Instruction & Library | 0 (0.0%) | 0 (0.0%) |
| Arts, Media & Entertainment | 0 (0.0%) | 0 (0.0%) |
| Health Diagnosing & Treating | 0 (0.0%) | 0 (0.0%) |
| Health Technologists | 0 (0.0%) | 0 (0.0%) |
| Total (Category) | 1 (50.0%) | 1 (50.0%) |
| Total (Overall) | 16 (94.1%) | 1 (5.9%) |
Services Occupations
Services Occupations by Sex
| Occupation | Male | Female |
| Healthcare Support | 0 (0.0%) | 0 (0.0%) |
| Security & Protection | 0 (0.0%) | 0 (0.0%) |
| Firefighting & Prevention | 0 (0.0%) | 0 (0.0%) |
| Law Enforcement | 0 (0.0%) | 0 (0.0%) |
| Food Preparation & Serving | 0 (0.0%) | 0 (0.0%) |
| Cleaning & Maintenance | 0 (0.0%) | 0 (0.0%) |
| Personal Care & Service | 0 (0.0%) | 0 (0.0%) |
| Total (Category) | 0 (0.0%) | 0 (0.0%) |
| Total (Overall) | 16 (94.1%) | 1 (5.9%) |
Sales and Office Occupations
Sales and Office Occupations by Sex
| Occupation | Male | Female |
| Sales & Related | 0 (0.0%) | 0 (0.0%) |
| Office & Administration | 0 (0.0%) | 0 (0.0%) |
| Total (Category) | 0 (0.0%) | 0 (0.0%) |
| Total (Overall) | 16 (94.1%) | 1 (5.9%) |
Natural Resources, Construction and Maintenance Occupations
The most common Natural Resources, Construction and Maintenance occupations in Benton are , and Construction & Extraction (10 | 58.8%).
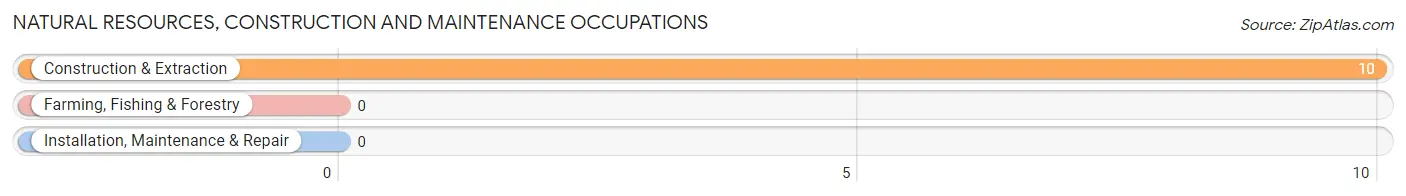
Natural Resources, Construction and Maintenance Occupations by Sex
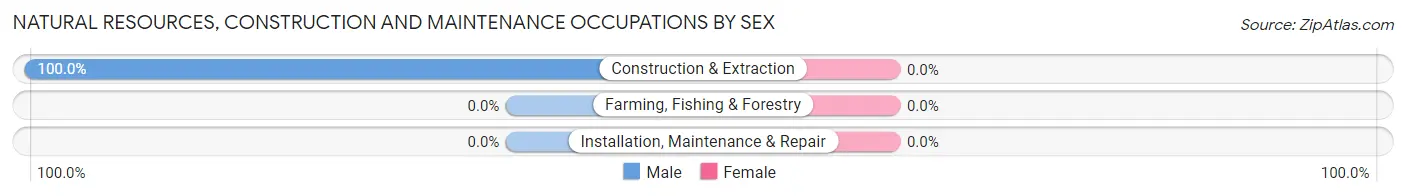
| Occupation | Male | Female |
| Farming, Fishing & Forestry | 0 (0.0%) | 0 (0.0%) |
| Construction & Extraction | 10 (100.0%) | 0 (0.0%) |
| Installation, Maintenance & Repair | 0 (0.0%) | 0 (0.0%) |
| Total (Category) | 10 (100.0%) | 0 (0.0%) |
| Total (Overall) | 16 (94.1%) | 1 (5.9%) |
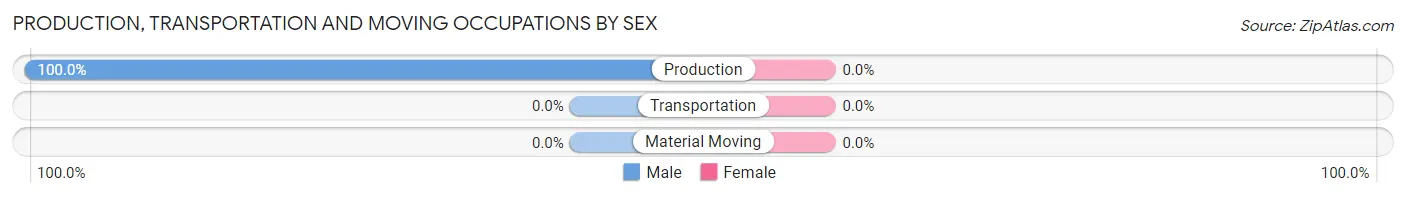
Production, Transportation and Moving Occupations
The most common Production, Transportation and Moving occupations in Benton are , and Production (5 | 29.4%).
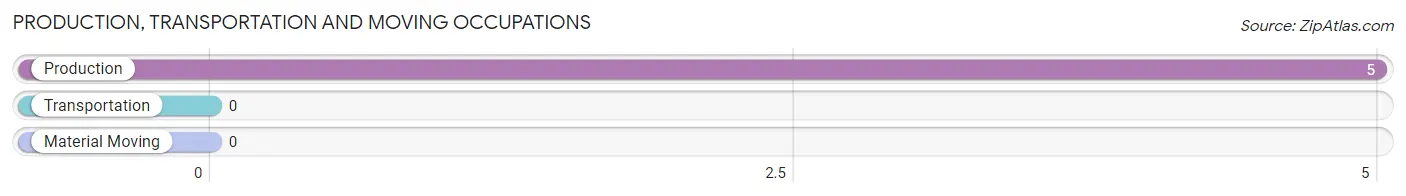
Production, Transportation and Moving Occupations by Sex
| Occupation | Male | Female |
| Production | 5 (100.0%) | 0 (0.0%) |
| Transportation | 0 (0.0%) | 0 (0.0%) |
| Material Moving | 0 (0.0%) | 0 (0.0%) |
| Total (Category) | 5 (100.0%) | 0 (0.0%) |
| Total (Overall) | 16 (94.1%) | 1 (5.9%) |
Employment Industries by Sex in Benton
Employment Industries in Benton
The major employment industries in Benton include Construction (12 | 70.6%), and Manufacturing (5 | 29.4%).
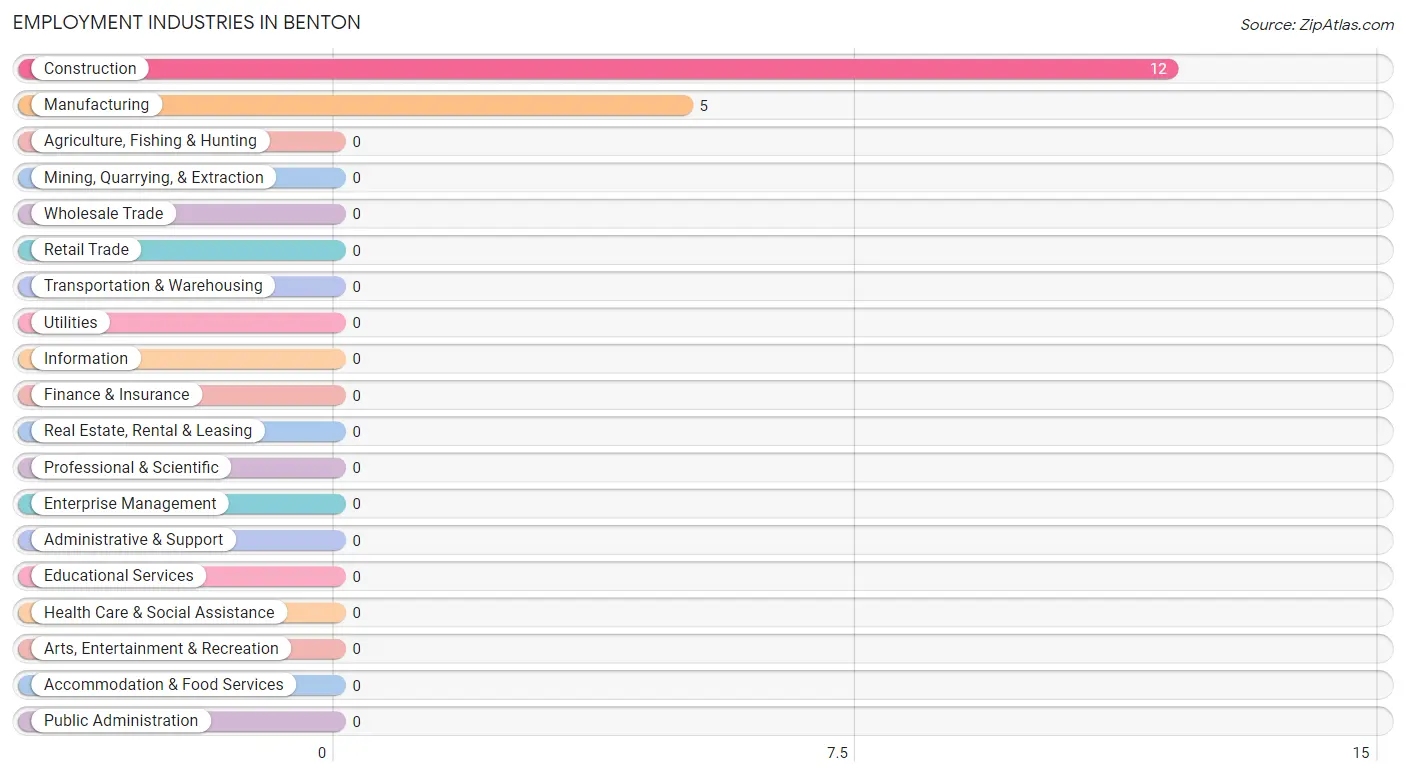
Employment Industries by Sex in Benton
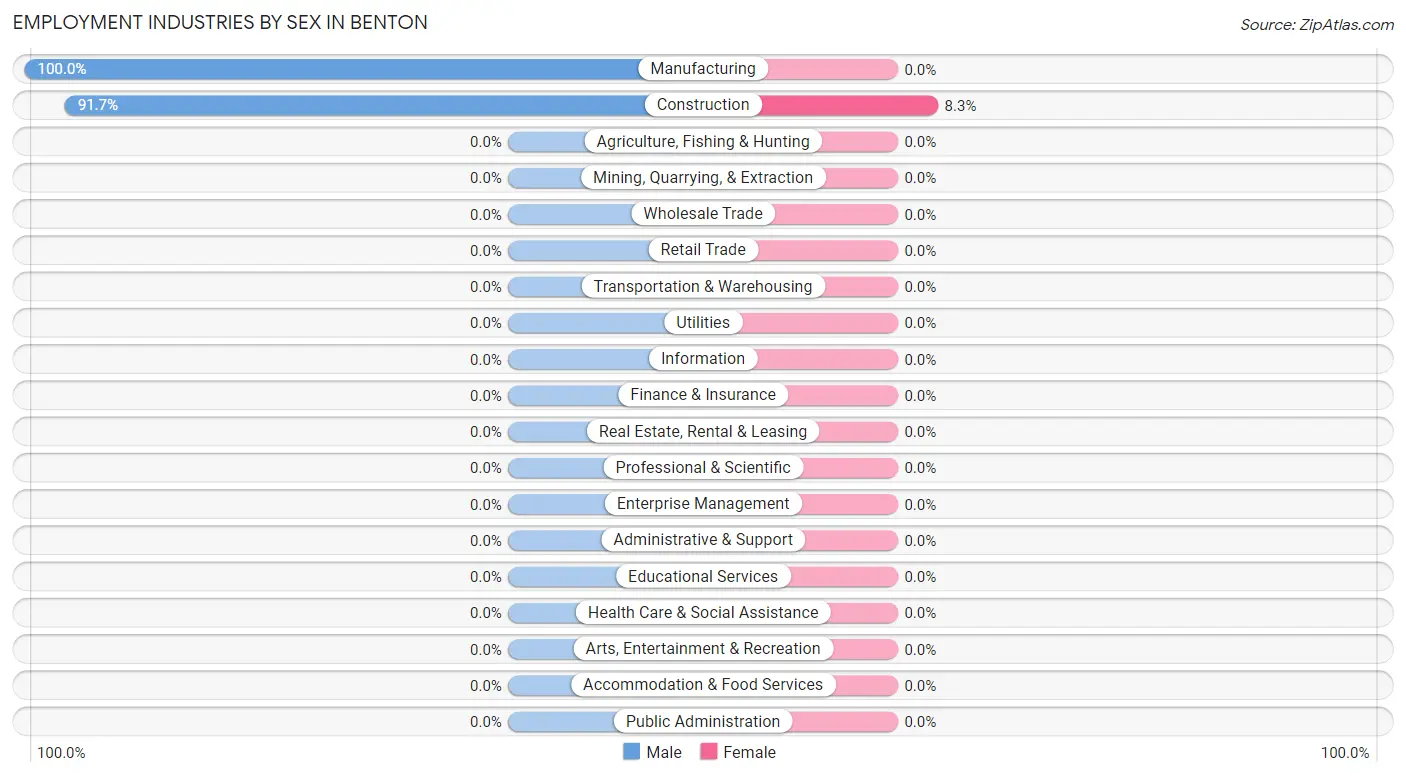
| Industry | Male | Female |
| Agriculture, Fishing & Hunting | 0 (0.0%) | 0 (0.0%) |
| Mining, Quarrying, & Extraction | 0 (0.0%) | 0 (0.0%) |
| Construction | 11 (91.7%) | 1 (8.3%) |
| Manufacturing | 5 (100.0%) | 0 (0.0%) |
| Wholesale Trade | 0 (0.0%) | 0 (0.0%) |
| Retail Trade | 0 (0.0%) | 0 (0.0%) |
| Transportation & Warehousing | 0 (0.0%) | 0 (0.0%) |
| Utilities | 0 (0.0%) | 0 (0.0%) |
| Information | 0 (0.0%) | 0 (0.0%) |
| Finance & Insurance | 0 (0.0%) | 0 (0.0%) |
| Real Estate, Rental & Leasing | 0 (0.0%) | 0 (0.0%) |
| Professional & Scientific | 0 (0.0%) | 0 (0.0%) |
| Enterprise Management | 0 (0.0%) | 0 (0.0%) |
| Administrative & Support | 0 (0.0%) | 0 (0.0%) |
| Educational Services | 0 (0.0%) | 0 (0.0%) |
| Health Care & Social Assistance | 0 (0.0%) | 0 (0.0%) |
| Arts, Entertainment & Recreation | 0 (0.0%) | 0 (0.0%) |
| Accommodation & Food Services | 0 (0.0%) | 0 (0.0%) |
| Public Administration | 0 (0.0%) | 0 (0.0%) |
| Total | 16 (94.1%) | 1 (5.9%) |
Education in Benton
School Enrollment in Benton
| School Level | # Students | % Students |
| Nursery / Preschool | 0 | 0.0% |
| Kindergarten | 0 | 0.0% |
| Elementary School | 0 | 0.0% |
| Middle School | 0 | 0.0% |
| High School | 0 | 0.0% |
| College / Undergraduate | 0 | 0.0% |
| Graduate / Professional | 0 | 0.0% |
| Total | 0 | 0.0% |
School Enrollment by Age by Funding Source in Benton
| Age Bracket | Public School | Private School |
| 3 to 4 Year Olds | 0 (0.0%) | 0 (0.0%) |
| 5 to 9 Year Old | 0 (0.0%) | 0 (0.0%) |
| 10 to 14 Year Olds | 0 (0.0%) | 0 (0.0%) |
| 15 to 17 Year Olds | 0 (0.0%) | 0 (0.0%) |
| 18 to 19 Year Olds | 0 (0.0%) | 0 (0.0%) |
| 20 to 24 Year Olds | 0 (0.0%) | 0 (0.0%) |
| 25 to 34 Year Olds | 0 (0.0%) | 0 (0.0%) |
| 35 Years and over | 0 (0.0%) | 0 (0.0%) |
| Total | 0 (0.0%) | 0 (0.0%) |
Educational Attainment by Field of Study in Benton
Science & technology (2 | 50.0%), and education (2 | 50.0%) are the most common fields of study among 4 individuals in Benton who have obtained a bachelor's degree or higher.
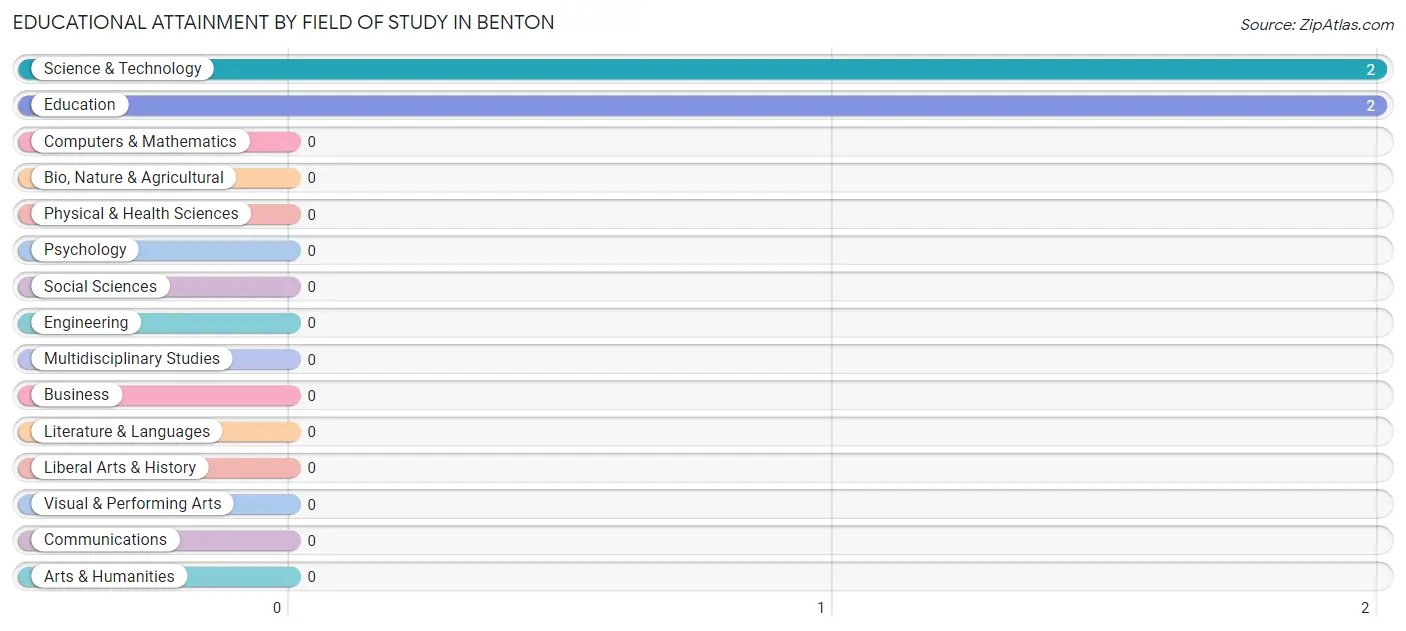
| Field of Study | # Graduates | % Graduates |
| Computers & Mathematics | 0 | 0.0% |
| Bio, Nature & Agricultural | 0 | 0.0% |
| Physical & Health Sciences | 0 | 0.0% |
| Psychology | 0 | 0.0% |
| Social Sciences | 0 | 0.0% |
| Engineering | 0 | 0.0% |
| Multidisciplinary Studies | 0 | 0.0% |
| Science & Technology | 2 | 50.0% |
| Business | 0 | 0.0% |
| Education | 2 | 50.0% |
| Literature & Languages | 0 | 0.0% |
| Liberal Arts & History | 0 | 0.0% |
| Visual & Performing Arts | 0 | 0.0% |
| Communications | 0 | 0.0% |
| Arts & Humanities | 0 | 0.0% |
| Total | 4 | 100.0% |
Transportation & Commute in Benton
Vehicle Availability by Sex in Benton
The most prevalent vehicle ownership categories in Benton are males with 1 vehicle (10, accounting for 62.5%) and females with 1 vehicle (0, making up 1,000.0%).
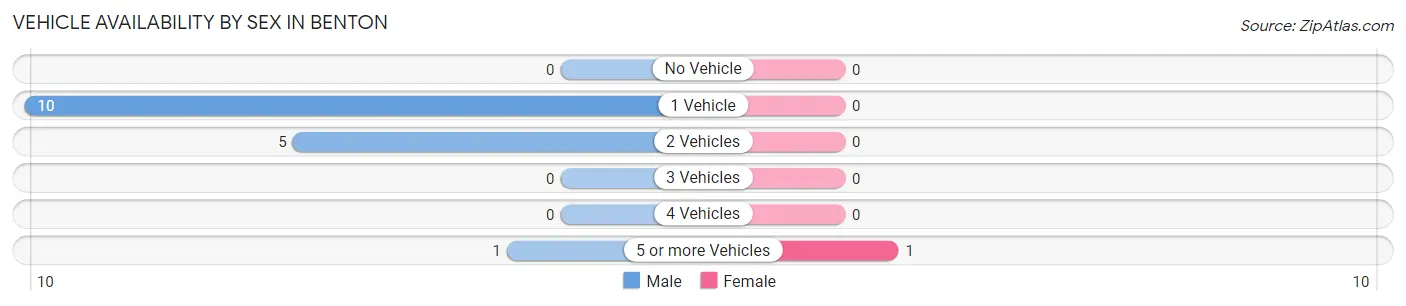
| Vehicles Available | Male | Female |
| No Vehicle | 0 (0.0%) | 0 (0.0%) |
| 1 Vehicle | 10 (62.5%) | 0 (0.0%) |
| 2 Vehicles | 5 (31.2%) | 0 (0.0%) |
| 3 Vehicles | 0 (0.0%) | 0 (0.0%) |
| 4 Vehicles | 0 (0.0%) | 0 (0.0%) |
| 5 or more Vehicles | 1 (6.2%) | 1 (100.0%) |
| Total | 16 (100.0%) | 1 (100.0%) |
Commute Time in Benton
The most frequently occuring commute durations in Benton are 90 or more minutes (6 commuters, 35.3%), 20 to 24 minutes (5 commuters, 29.4%), and 60 to 89 minutes (4 commuters, 23.5%).
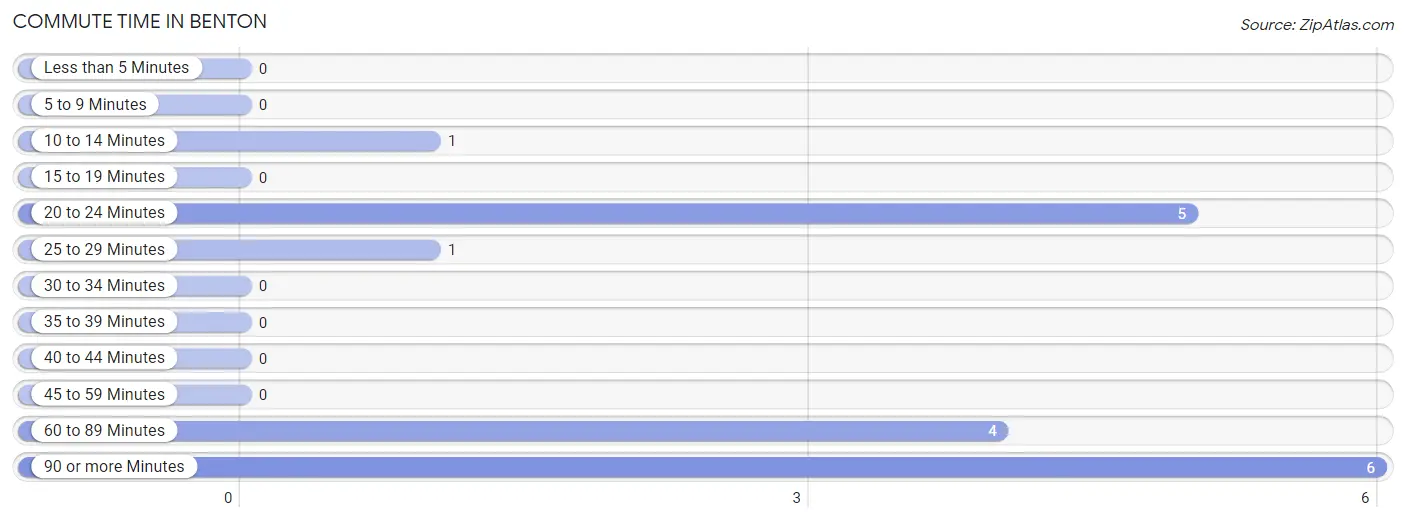
| Commute Time | # Commuters | % Commuters |
| Less than 5 Minutes | 0 | 0.0% |
| 5 to 9 Minutes | 0 | 0.0% |
| 10 to 14 Minutes | 1 | 5.9% |
| 15 to 19 Minutes | 0 | 0.0% |
| 20 to 24 Minutes | 5 | 29.4% |
| 25 to 29 Minutes | 1 | 5.9% |
| 30 to 34 Minutes | 0 | 0.0% |
| 35 to 39 Minutes | 0 | 0.0% |
| 40 to 44 Minutes | 0 | 0.0% |
| 45 to 59 Minutes | 0 | 0.0% |
| 60 to 89 Minutes | 4 | 23.5% |
| 90 or more Minutes | 6 | 35.3% |
Commute Time by Sex in Benton
The most common commute times in Benton are 90 or more minutes (6 commuters, 37.5%) for males and 10 to 14 minutes (1 commuters, 100.0%) for females.
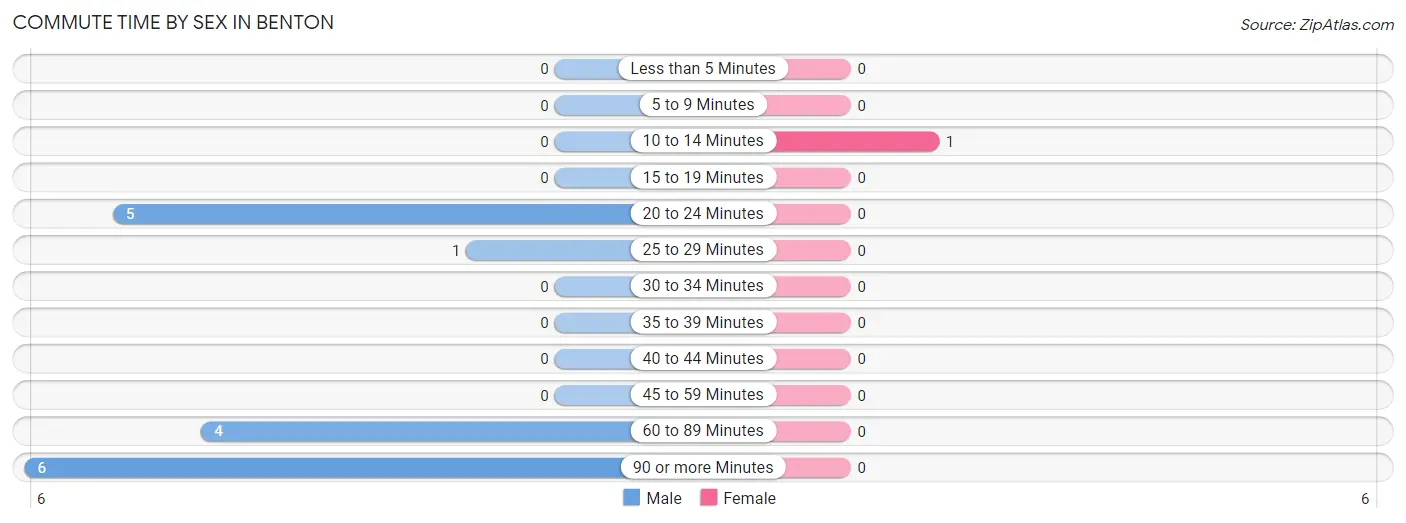
| Commute Time | Male | Female |
| Less than 5 Minutes | 0 (0.0%) | 0 (0.0%) |
| 5 to 9 Minutes | 0 (0.0%) | 0 (0.0%) |
| 10 to 14 Minutes | 0 (0.0%) | 1 (100.0%) |
| 15 to 19 Minutes | 0 (0.0%) | 0 (0.0%) |
| 20 to 24 Minutes | 5 (31.2%) | 0 (0.0%) |
| 25 to 29 Minutes | 1 (6.2%) | 0 (0.0%) |
| 30 to 34 Minutes | 0 (0.0%) | 0 (0.0%) |
| 35 to 39 Minutes | 0 (0.0%) | 0 (0.0%) |
| 40 to 44 Minutes | 0 (0.0%) | 0 (0.0%) |
| 45 to 59 Minutes | 0 (0.0%) | 0 (0.0%) |
| 60 to 89 Minutes | 4 (25.0%) | 0 (0.0%) |
| 90 or more Minutes | 6 (37.5%) | 0 (0.0%) |
Time of Departure to Work by Sex in Benton
The most frequent times of departure to work in Benton are 5:00 AM to 5:29 AM (10, 62.5%) for males and 6:00 AM to 6:29 AM (1, 100.0%) for females.
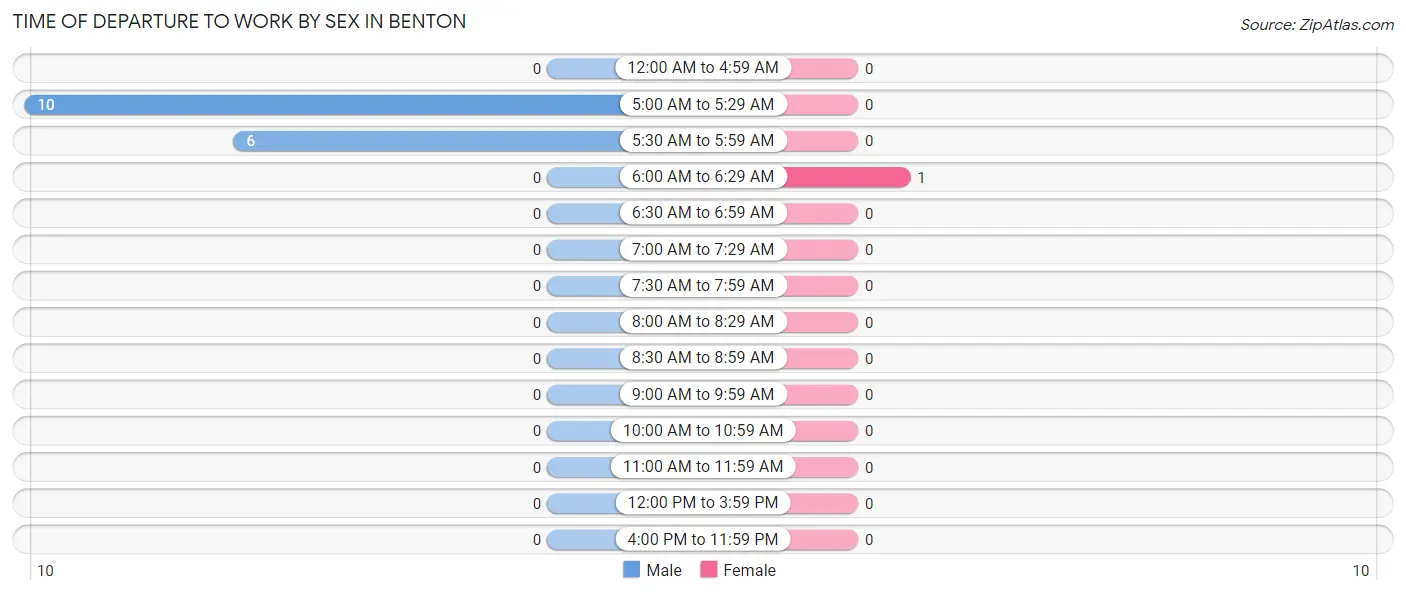
| Time of Departure | Male | Female |
| 12:00 AM to 4:59 AM | 0 (0.0%) | 0 (0.0%) |
| 5:00 AM to 5:29 AM | 10 (62.5%) | 0 (0.0%) |
| 5:30 AM to 5:59 AM | 6 (37.5%) | 0 (0.0%) |
| 6:00 AM to 6:29 AM | 0 (0.0%) | 1 (100.0%) |
| 6:30 AM to 6:59 AM | 0 (0.0%) | 0 (0.0%) |
| 7:00 AM to 7:29 AM | 0 (0.0%) | 0 (0.0%) |
| 7:30 AM to 7:59 AM | 0 (0.0%) | 0 (0.0%) |
| 8:00 AM to 8:29 AM | 0 (0.0%) | 0 (0.0%) |
| 8:30 AM to 8:59 AM | 0 (0.0%) | 0 (0.0%) |
| 9:00 AM to 9:59 AM | 0 (0.0%) | 0 (0.0%) |
| 10:00 AM to 10:59 AM | 0 (0.0%) | 0 (0.0%) |
| 11:00 AM to 11:59 AM | 0 (0.0%) | 0 (0.0%) |
| 12:00 PM to 3:59 PM | 0 (0.0%) | 0 (0.0%) |
| 4:00 PM to 11:59 PM | 0 (0.0%) | 0 (0.0%) |
| Total | 16 (100.0%) | 1 (100.0%) |
Housing Occupancy in Benton
Occupancy by Ownership in Benton
Of the total 18 dwellings in Benton, owner-occupied units account for 18 (100.0%), while renter-occupied units make up 0 (0.0%).
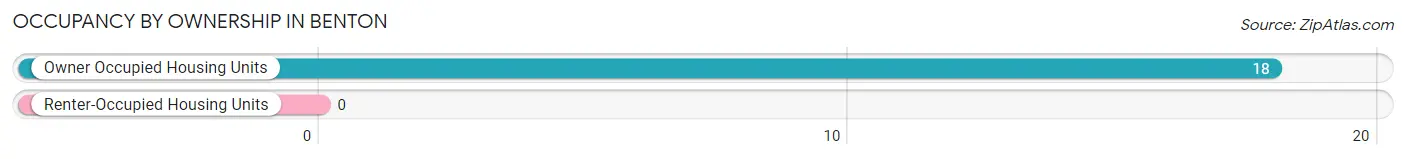
| Occupancy | # Housing Units | % Housing Units |
| Owner Occupied Housing Units | 18 | 100.0% |
| Renter-Occupied Housing Units | 0 | 0.0% |
| Total Occupied Housing Units | 18 | 100.0% |
Occupancy by Household Size in Benton
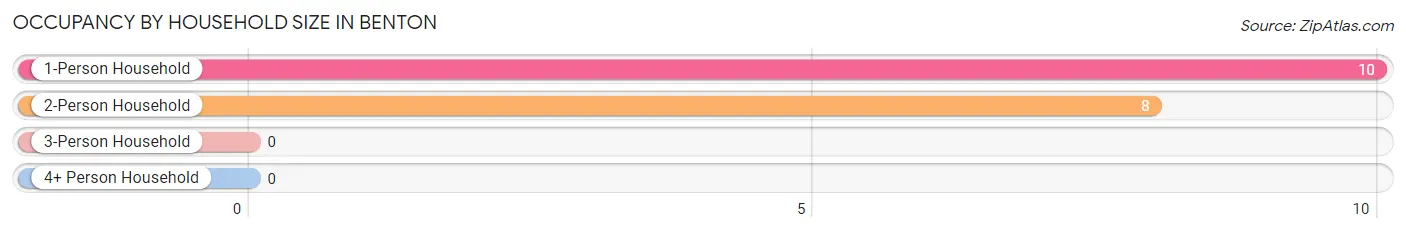
| Household Size | # Housing Units | % Housing Units |
| 1-Person Household | 10 | 55.6% |
| 2-Person Household | 8 | 44.4% |
| 3-Person Household | 0 | 0.0% |
| 4+ Person Household | 0 | 0.0% |
| Total Housing Units | 18 | 100.0% |
Occupancy by Ownership by Household Size in Benton
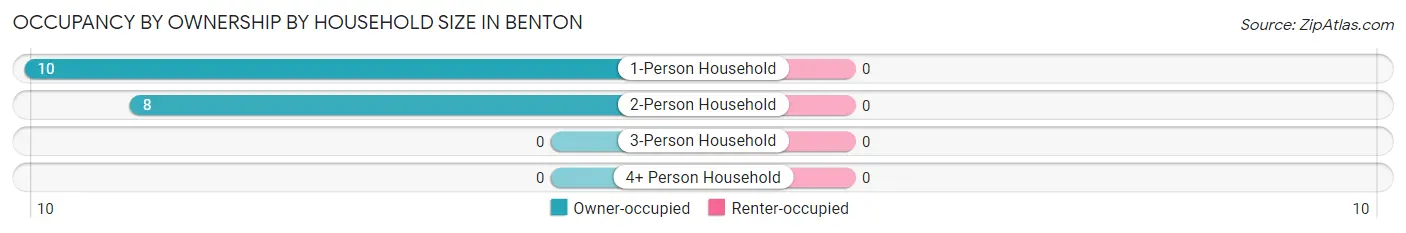
| Household Size | Owner-occupied | Renter-occupied |
| 1-Person Household | 10 (100.0%) | 0 (0.0%) |
| 2-Person Household | 8 (100.0%) | 0 (0.0%) |
| 3-Person Household | 0 (0.0%) | 0 (0.0%) |
| 4+ Person Household | 0 (0.0%) | 0 (0.0%) |
| Total Housing Units | 18 (100.0%) | 0 (0.0%) |
Occupancy by Educational Attainment in Benton
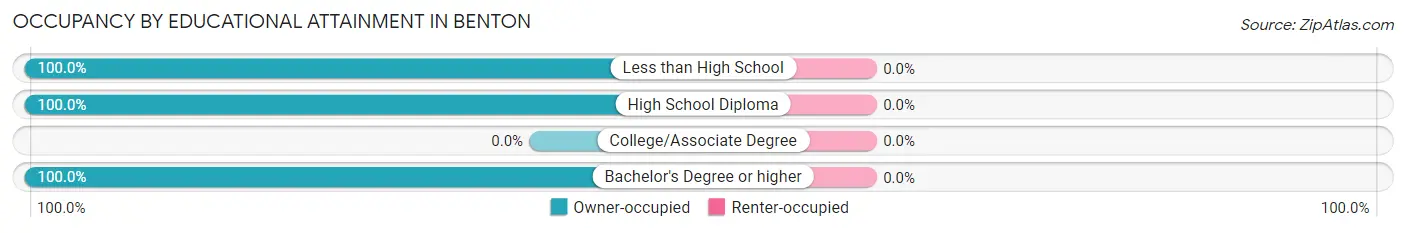
| Household Size | Owner-occupied | Renter-occupied |
| Less than High School | 10 (100.0%) | 0 (0.0%) |
| High School Diploma | 7 (100.0%) | 0 (0.0%) |
| College/Associate Degree | 0 (0.0%) | 0 (0.0%) |
| Bachelor's Degree or higher | 1 (100.0%) | 0 (0.0%) |
Occupancy by Age of Householder in Benton
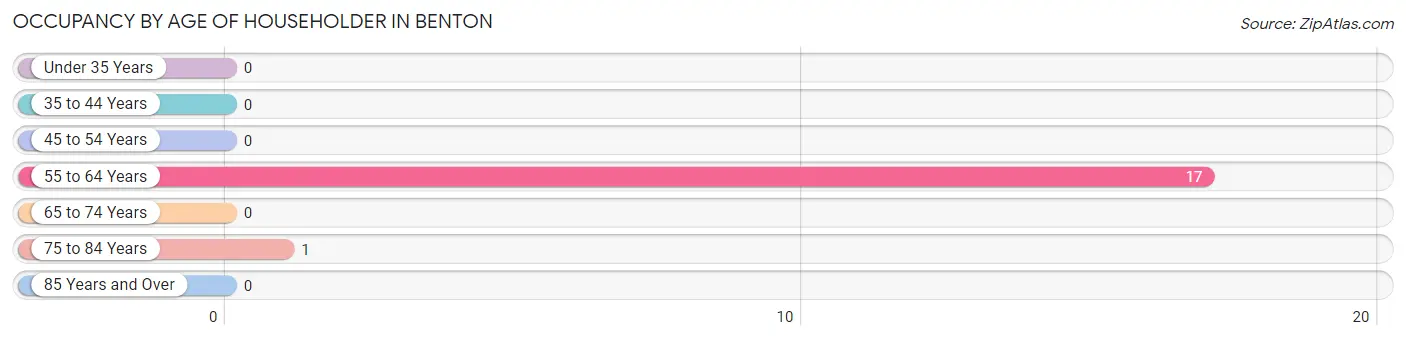
| Age Bracket | # Households | % Households |
| Under 35 Years | 0 | 0.0% |
| 35 to 44 Years | 0 | 0.0% |
| 45 to 54 Years | 0 | 0.0% |
| 55 to 64 Years | 17 | 94.4% |
| 65 to 74 Years | 0 | 0.0% |
| 75 to 84 Years | 1 | 5.6% |
| 85 Years and Over | 0 | 0.0% |
| Total | 18 | 100.0% |
Housing Finances in Benton
Median Income by Occupancy in Benton
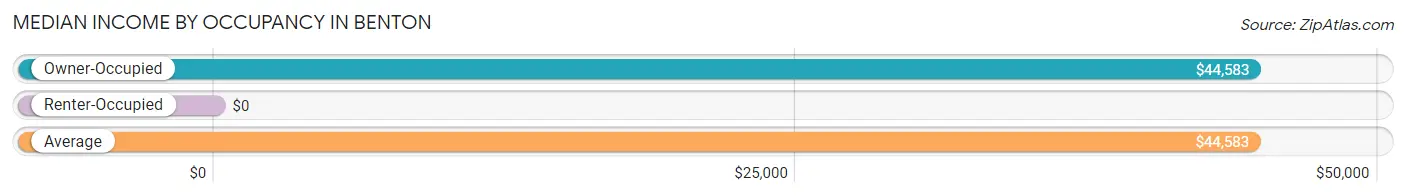
| Occupancy Type | # Households | Median Income |
| Owner-Occupied | 18 (100.0%) | $44,583 |
| Renter-Occupied | 0 (0.0%) | $0 |
| Average | 18 (100.0%) | $44,583 |
Occupancy by Householder Income Bracket in Benton
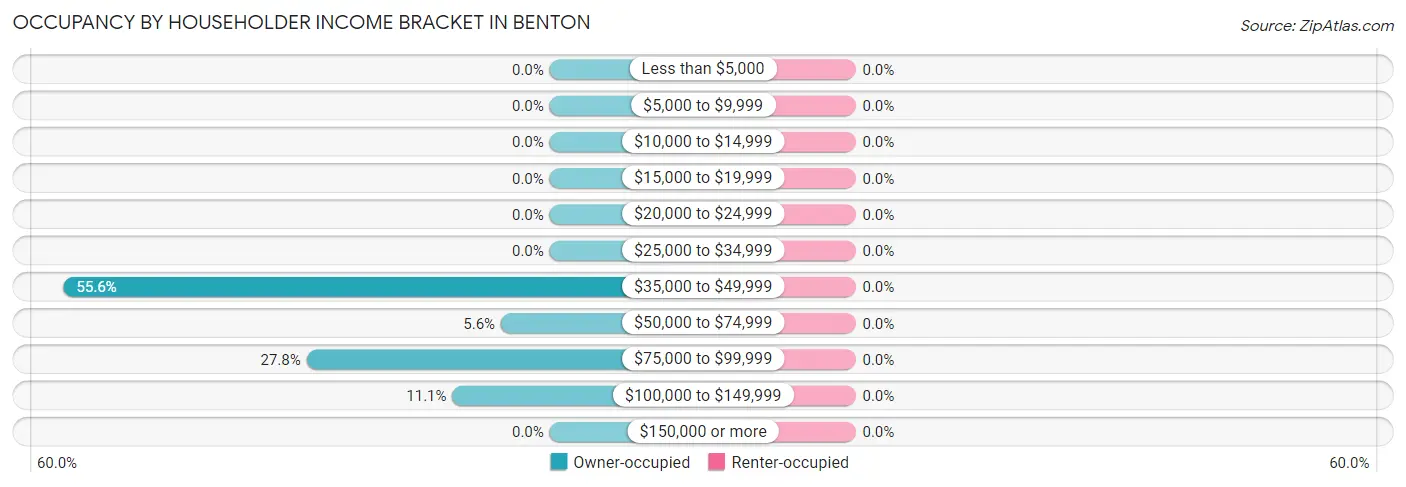
| Income Bracket | Owner-occupied | Renter-occupied |
| Less than $5,000 | 0 (0.0%) | 0 (0.0%) |
| $5,000 to $9,999 | 0 (0.0%) | 0 (0.0%) |
| $10,000 to $14,999 | 0 (0.0%) | 0 (0.0%) |
| $15,000 to $19,999 | 0 (0.0%) | 0 (0.0%) |
| $20,000 to $24,999 | 0 (0.0%) | 0 (0.0%) |
| $25,000 to $34,999 | 0 (0.0%) | 0 (0.0%) |
| $35,000 to $49,999 | 10 (55.6%) | 0 (0.0%) |
| $50,000 to $74,999 | 1 (5.6%) | 0 (0.0%) |
| $75,000 to $99,999 | 5 (27.8%) | 0 (0.0%) |
| $100,000 to $149,999 | 2 (11.1%) | 0 (0.0%) |
| $150,000 or more | 0 (0.0%) | 0 (0.0%) |
| Total | 18 (100.0%) | 0 (0.0%) |
Monthly Housing Cost Tiers in Benton
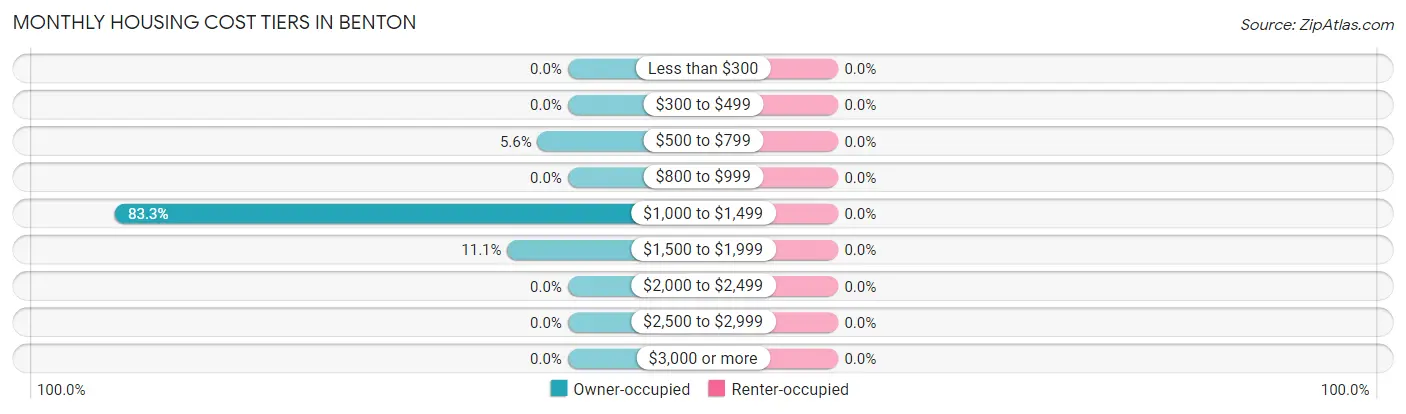
| Monthly Cost | Owner-occupied | Renter-occupied |
| Less than $300 | 0 (0.0%) | 0 (0.0%) |
| $300 to $499 | 0 (0.0%) | 0 (0.0%) |
| $500 to $799 | 1 (5.6%) | 0 (0.0%) |
| $800 to $999 | 0 (0.0%) | 0 (0.0%) |
| $1,000 to $1,499 | 15 (83.3%) | 0 (0.0%) |
| $1,500 to $1,999 | 2 (11.1%) | 0 (0.0%) |
| $2,000 to $2,499 | 0 (0.0%) | 0 (0.0%) |
| $2,500 to $2,999 | 0 (0.0%) | 0 (0.0%) |
| $3,000 or more | 0 (0.0%) | 0 (0.0%) |
| Total | 18 (100.0%) | 0 (0.0%) |
Physical Housing Characteristics in Benton
Housing Structures in Benton
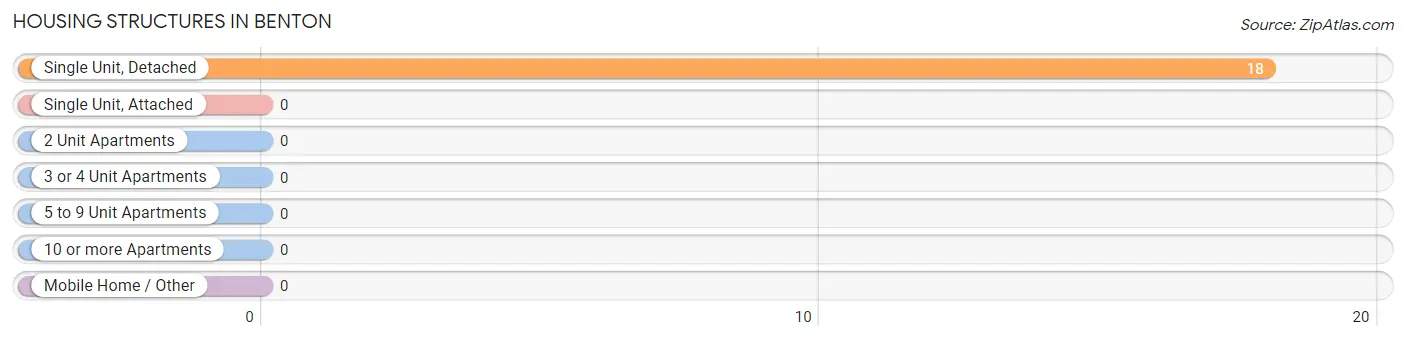
| Structure Type | # Housing Units | % Housing Units |
| Single Unit, Detached | 18 | 100.0% |
| Single Unit, Attached | 0 | 0.0% |
| 2 Unit Apartments | 0 | 0.0% |
| 3 or 4 Unit Apartments | 0 | 0.0% |
| 5 to 9 Unit Apartments | 0 | 0.0% |
| 10 or more Apartments | 0 | 0.0% |
| Mobile Home / Other | 0 | 0.0% |
| Total | 18 | 100.0% |
Housing Structures by Occupancy in Benton
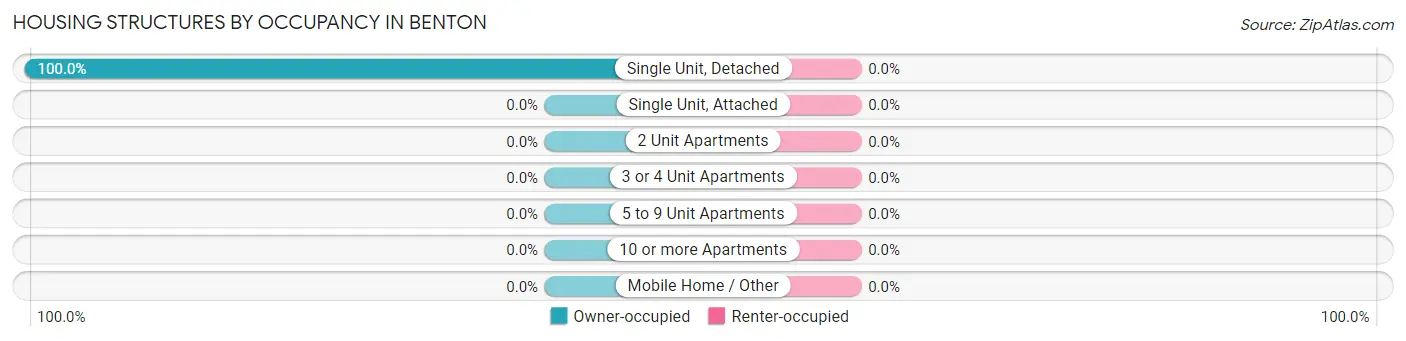
| Structure Type | Owner-occupied | Renter-occupied |
| Single Unit, Detached | 18 (100.0%) | 0 (0.0%) |
| Single Unit, Attached | 0 (0.0%) | 0 (0.0%) |
| 2 Unit Apartments | 0 (0.0%) | 0 (0.0%) |
| 3 or 4 Unit Apartments | 0 (0.0%) | 0 (0.0%) |
| 5 to 9 Unit Apartments | 0 (0.0%) | 0 (0.0%) |
| 10 or more Apartments | 0 (0.0%) | 0 (0.0%) |
| Mobile Home / Other | 0 (0.0%) | 0 (0.0%) |
| Total | 18 (100.0%) | 0 (0.0%) |
Housing Structures by Number of Rooms in Benton
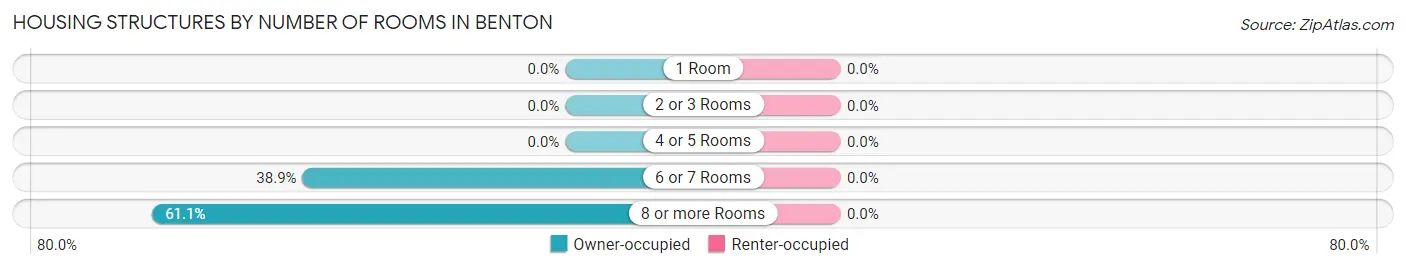
| Number of Rooms | Owner-occupied | Renter-occupied |
| 1 Room | 0 (0.0%) | 0 (0.0%) |
| 2 or 3 Rooms | 0 (0.0%) | 0 (0.0%) |
| 4 or 5 Rooms | 0 (0.0%) | 0 (0.0%) |
| 6 or 7 Rooms | 7 (38.9%) | 0 (0.0%) |
| 8 or more Rooms | 11 (61.1%) | 0 (0.0%) |
| Total | 18 (100.0%) | 0 (0.0%) |
Housing Structure by Heating Type in Benton
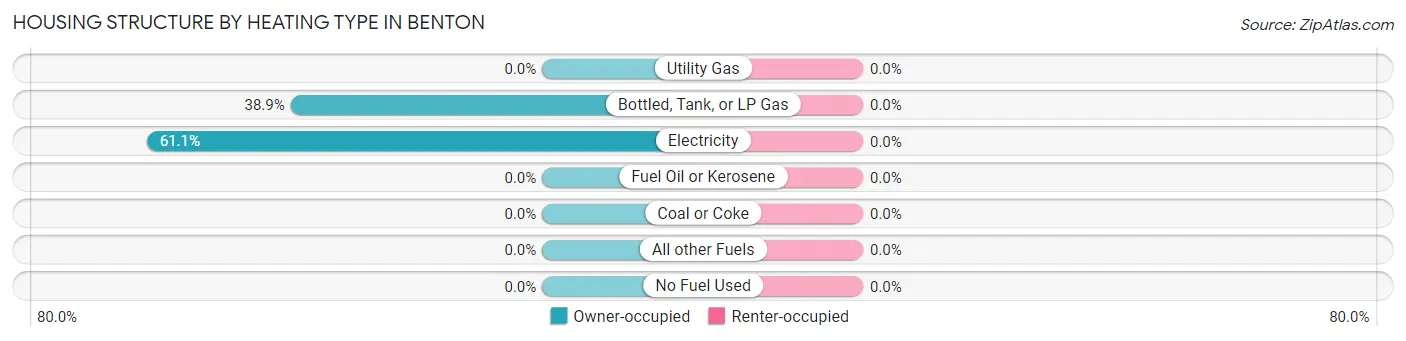
| Heating Type | Owner-occupied | Renter-occupied |
| Utility Gas | 0 (0.0%) | 0 (0.0%) |
| Bottled, Tank, or LP Gas | 7 (38.9%) | 0 (0.0%) |
| Electricity | 11 (61.1%) | 0 (0.0%) |
| Fuel Oil or Kerosene | 0 (0.0%) | 0 (0.0%) |
| Coal or Coke | 0 (0.0%) | 0 (0.0%) |
| All other Fuels | 0 (0.0%) | 0 (0.0%) |
| No Fuel Used | 0 (0.0%) | 0 (0.0%) |
| Total | 18 (100.0%) | 0 (0.0%) |
Household Vehicle Usage in Benton
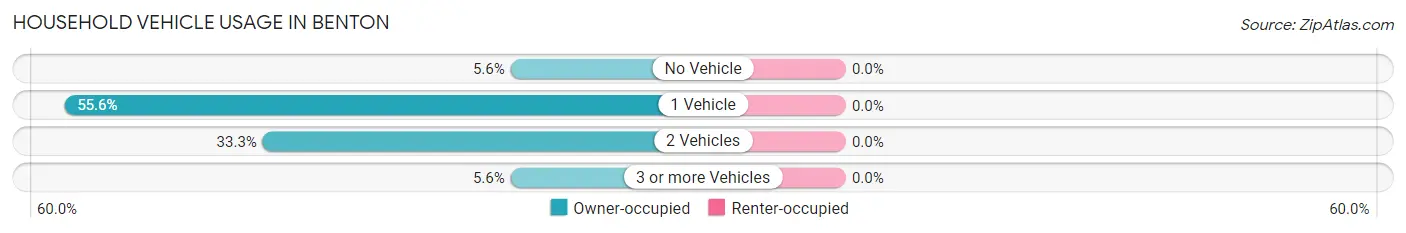
| Vehicles per Household | Owner-occupied | Renter-occupied |
| No Vehicle | 1 (5.6%) | 0 (0.0%) |
| 1 Vehicle | 10 (55.6%) | 0 (0.0%) |
| 2 Vehicles | 6 (33.3%) | 0 (0.0%) |
| 3 or more Vehicles | 1 (5.6%) | 0 (0.0%) |
| Total | 18 (100.0%) | 0 (0.0%) |
Real Estate & Mortgages in Benton
Real Estate and Mortgage Overview in Benton
| Characteristic | Without Mortgage | With Mortgage |
| Housing Units | 1 | 17 |
| Median Property Value | - | - |
| Median Household Income | - | - |
| Monthly Housing Costs | - | - |
| Real Estate Taxes | - | - |
Property Value by Mortgage Status in Benton
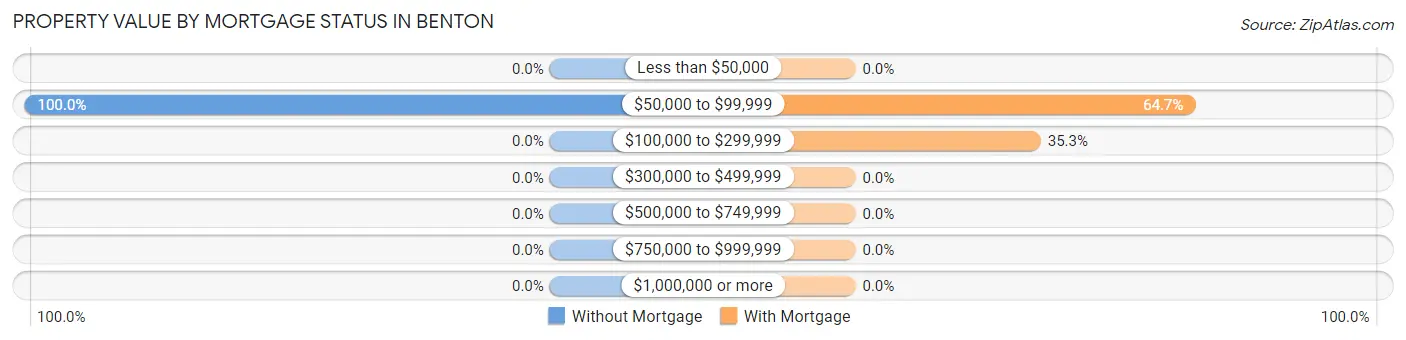
| Property Value | Without Mortgage | With Mortgage |
| Less than $50,000 | 0 (0.0%) | 0 (0.0%) |
| $50,000 to $99,999 | 1 (100.0%) | 11 (64.7%) |
| $100,000 to $299,999 | 0 (0.0%) | 6 (35.3%) |
| $300,000 to $499,999 | 0 (0.0%) | 0 (0.0%) |
| $500,000 to $749,999 | 0 (0.0%) | 0 (0.0%) |
| $750,000 to $999,999 | 0 (0.0%) | 0 (0.0%) |
| $1,000,000 or more | 0 (0.0%) | 0 (0.0%) |
| Total | 1 (100.0%) | 17 (100.0%) |
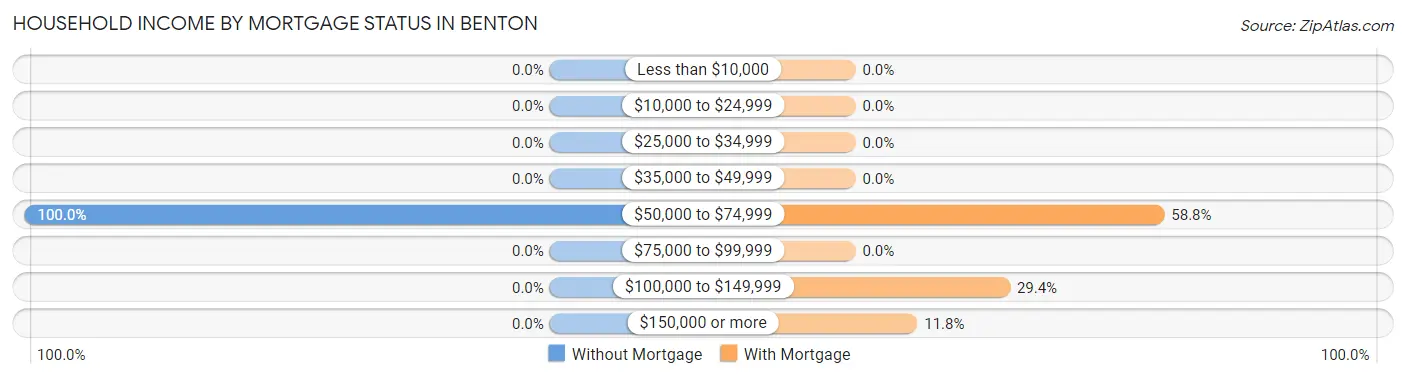
Household Income by Mortgage Status in Benton
| Household Income | Without Mortgage | With Mortgage |
| Less than $10,000 | 0 (0.0%) | 0 (0.0%) |
| $10,000 to $24,999 | 0 (0.0%) | 0 (0.0%) |
| $25,000 to $34,999 | 0 (0.0%) | 0 (0.0%) |
| $35,000 to $49,999 | 0 (0.0%) | 0 (0.0%) |
| $50,000 to $74,999 | 1 (100.0%) | 10 (58.8%) |
| $75,000 to $99,999 | 0 (0.0%) | 0 (0.0%) |
| $100,000 to $149,999 | 0 (0.0%) | 5 (29.4%) |
| $150,000 or more | 0 (0.0%) | 2 (11.8%) |
| Total | 1 (100.0%) | 17 (100.0%) |
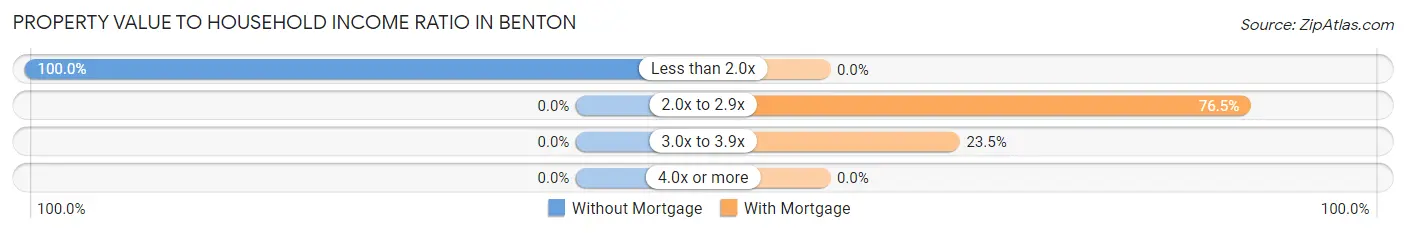
Property Value to Household Income Ratio in Benton
| Value-to-Income Ratio | Without Mortgage | With Mortgage |
| Less than 2.0x | 1 (100.0%) | 0 (0.0%) |
| 2.0x to 2.9x | 0 (0.0%) | 13 (76.5%) |
| 3.0x to 3.9x | 0 (0.0%) | 4 (23.5%) |
| 4.0x or more | 0 (0.0%) | 0 (0.0%) |
| Total | 1 (100.0%) | 17 (100.0%) |
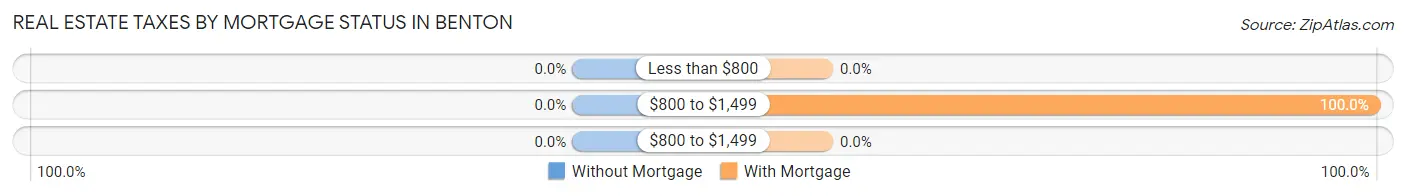
Real Estate Taxes by Mortgage Status in Benton
| Property Taxes | Without Mortgage | With Mortgage |
| Less than $800 | 0 (0.0%) | 0 (0.0%) |
| $800 to $1,499 | 0 (0.0%) | 17 (100.0%) |
| $800 to $1,499 | 0 (0.0%) | 0 (0.0%) |
| Total | 1 (100.0%) | 17 (100.0%) |
Health & Disability in Benton
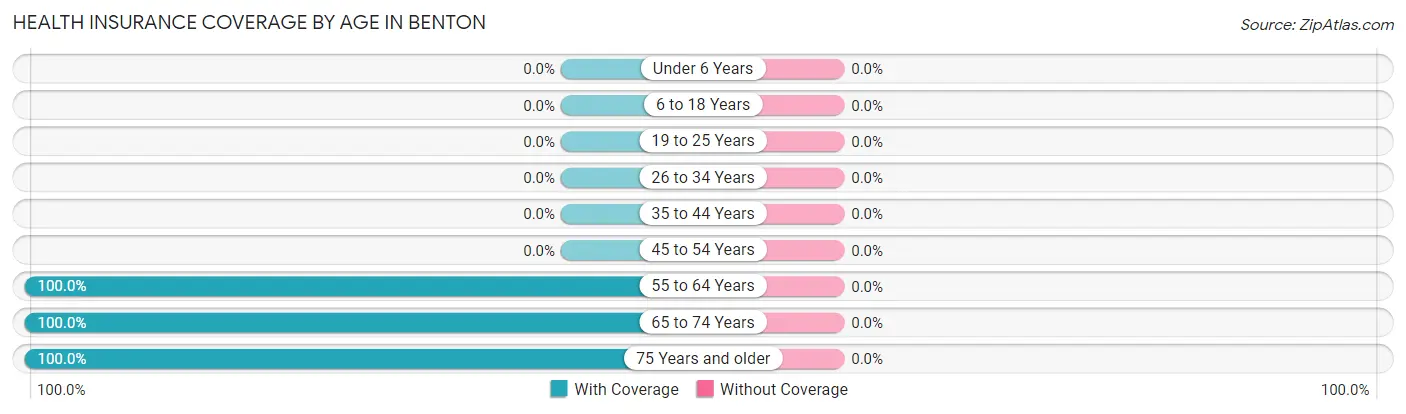
Health Insurance Coverage by Age in Benton
| Age Bracket | With Coverage | Without Coverage |
| Under 6 Years | 0 (0.0%) | 0 (0.0%) |
| 6 to 18 Years | 0 (0.0%) | 0 (0.0%) |
| 19 to 25 Years | 0 (0.0%) | 0 (0.0%) |
| 26 to 34 Years | 0 (0.0%) | 0 (0.0%) |
| 35 to 44 Years | 0 (0.0%) | 0 (0.0%) |
| 45 to 54 Years | 0 (0.0%) | 0 (0.0%) |
| 55 to 64 Years | 24 (100.0%) | 0 (0.0%) |
| 65 to 74 Years | 2 (100.0%) | 0 (0.0%) |
| 75 Years and older | 1 (100.0%) | 0 (0.0%) |
| Total | 27 (100.0%) | 0 (0.0%) |
Health Insurance Coverage by Citizenship Status in Benton
| Citizenship Status | With Coverage | Without Coverage |
| Native Born | 0 (0.0%) | 0 (0.0%) |
| Foreign Born, Citizen | 0 (0.0%) | 0 (0.0%) |
| Foreign Born, not a Citizen | 0 (0.0%) | 0 (0.0%) |
Health Insurance Coverage by Household Income in Benton
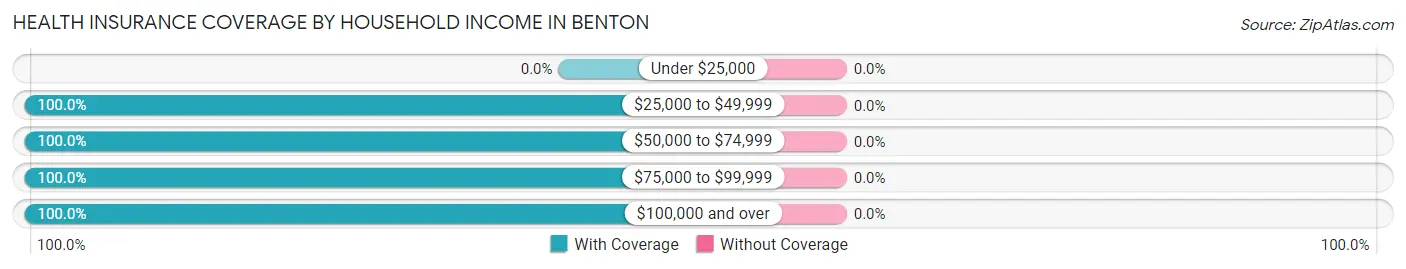
| Household Income | With Coverage | Without Coverage |
| Under $25,000 | 0 (0.0%) | 0 (0.0%) |
| $25,000 to $49,999 | 10 (100.0%) | 0 (0.0%) |
| $50,000 to $74,999 | 2 (100.0%) | 0 (0.0%) |
| $75,000 to $99,999 | 11 (100.0%) | 0 (0.0%) |
| $100,000 and over | 4 (100.0%) | 0 (0.0%) |
Public vs Private Health Insurance Coverage by Age in Benton
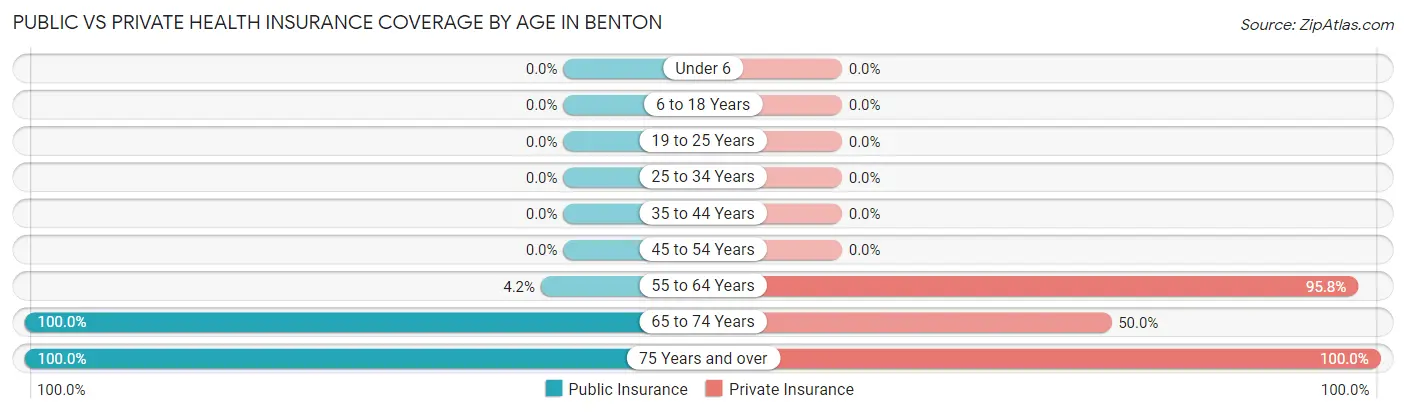
| Age Bracket | Public Insurance | Private Insurance |
| Under 6 | 0 (0.0%) | 0 (0.0%) |
| 6 to 18 Years | 0 (0.0%) | 0 (0.0%) |
| 19 to 25 Years | 0 (0.0%) | 0 (0.0%) |
| 25 to 34 Years | 0 (0.0%) | 0 (0.0%) |
| 35 to 44 Years | 0 (0.0%) | 0 (0.0%) |
| 45 to 54 Years | 0 (0.0%) | 0 (0.0%) |
| 55 to 64 Years | 1 (4.2%) | 23 (95.8%) |
| 65 to 74 Years | 2 (100.0%) | 1 (50.0%) |
| 75 Years and over | 1 (100.0%) | 1 (100.0%) |
| Total | 4 (14.8%) | 25 (92.6%) |
Disability Status by Sex by Age in Benton
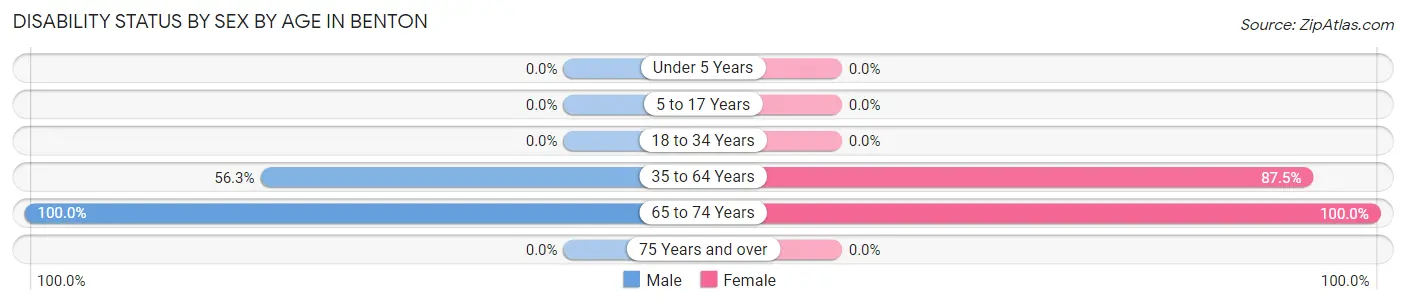
| Age Bracket | Male | Female |
| Under 5 Years | 0 (0.0%) | 0 (0.0%) |
| 5 to 17 Years | 0 (0.0%) | 0 (0.0%) |
| 18 to 34 Years | 0 (0.0%) | 0 (0.0%) |
| 35 to 64 Years | 9 (56.2%) | 7 (87.5%) |
| 65 to 74 Years | 1 (100.0%) | 1 (100.0%) |
| 75 Years and over | 0 (0.0%) | 0 (0.0%) |
Disability Class by Sex by Age in Benton
Disability Class: Hearing Difficulty
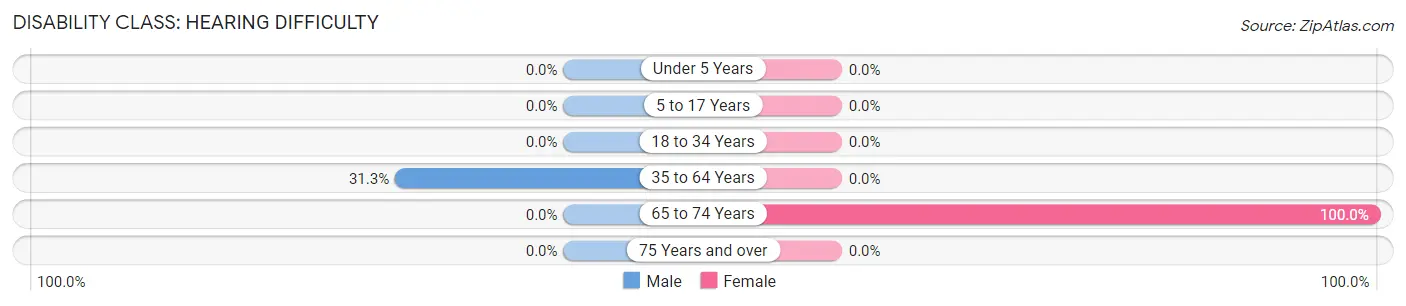
| Age Bracket | Male | Female |
| Under 5 Years | 0 (0.0%) | 0 (0.0%) |
| 5 to 17 Years | 0 (0.0%) | 0 (0.0%) |
| 18 to 34 Years | 0 (0.0%) | 0 (0.0%) |
| 35 to 64 Years | 5 (31.2%) | 0 (0.0%) |
| 65 to 74 Years | 0 (0.0%) | 1 (100.0%) |
| 75 Years and over | 0 (0.0%) | 0 (0.0%) |
Disability Class: Vision Difficulty
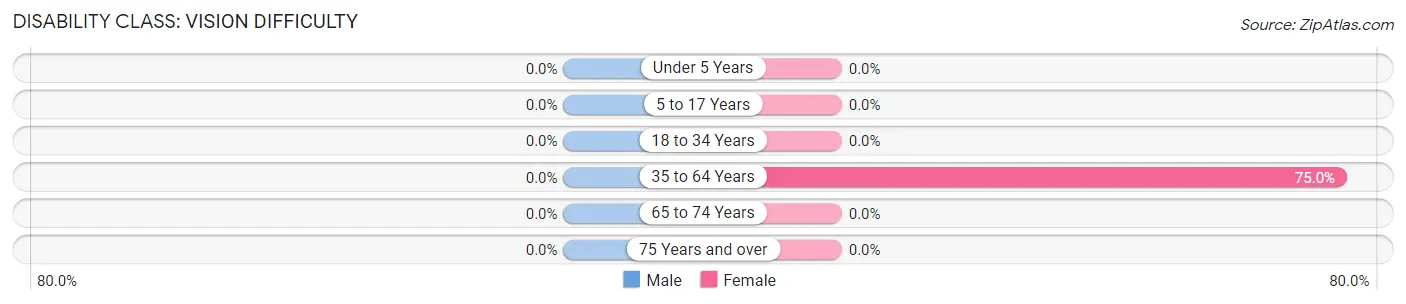
| Age Bracket | Male | Female |
| Under 5 Years | 0 (0.0%) | 0 (0.0%) |
| 5 to 17 Years | 0 (0.0%) | 0 (0.0%) |
| 18 to 34 Years | 0 (0.0%) | 0 (0.0%) |
| 35 to 64 Years | 0 (0.0%) | 6 (75.0%) |
| 65 to 74 Years | 0 (0.0%) | 0 (0.0%) |
| 75 Years and over | 0 (0.0%) | 0 (0.0%) |
Disability Class: Cognitive Difficulty
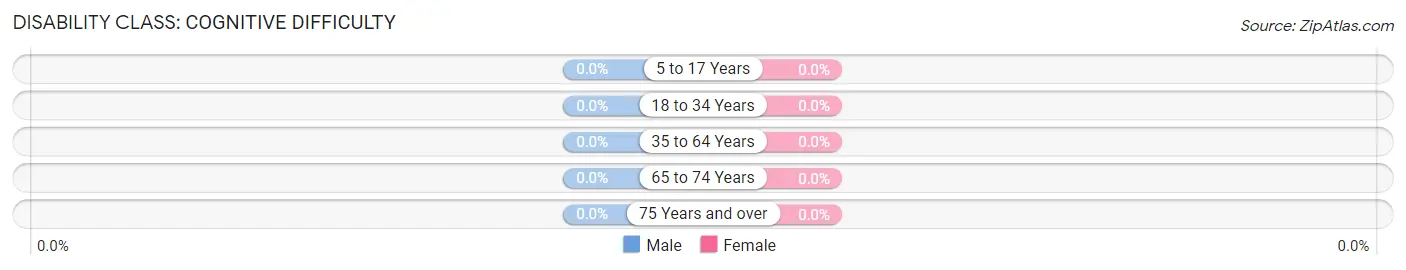
| Age Bracket | Male | Female |
| 5 to 17 Years | 0 (0.0%) | 0 (0.0%) |
| 18 to 34 Years | 0 (0.0%) | 0 (0.0%) |
| 35 to 64 Years | 0 (0.0%) | 0 (0.0%) |
| 65 to 74 Years | 0 (0.0%) | 0 (0.0%) |
| 75 Years and over | 0 (0.0%) | 0 (0.0%) |
Disability Class: Ambulatory Difficulty
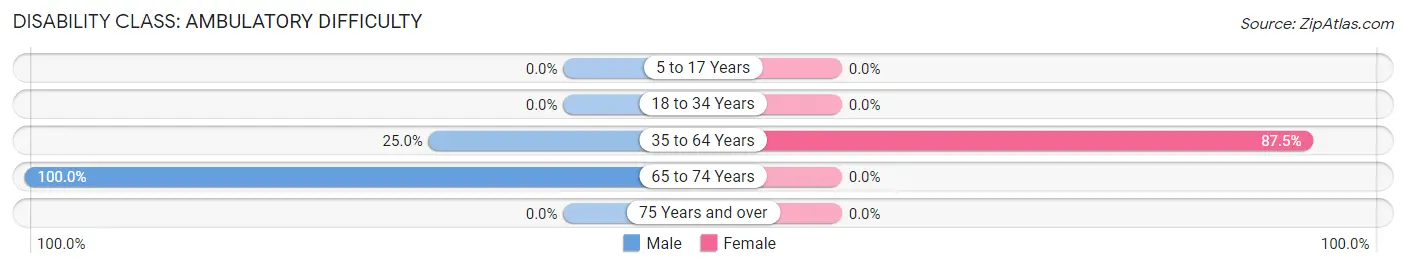
| Age Bracket | Male | Female |
| 5 to 17 Years | 0 (0.0%) | 0 (0.0%) |
| 18 to 34 Years | 0 (0.0%) | 0 (0.0%) |
| 35 to 64 Years | 4 (25.0%) | 7 (87.5%) |
| 65 to 74 Years | 1 (100.0%) | 0 (0.0%) |
| 75 Years and over | 0 (0.0%) | 0 (0.0%) |
Disability Class: Self-Care Difficulty
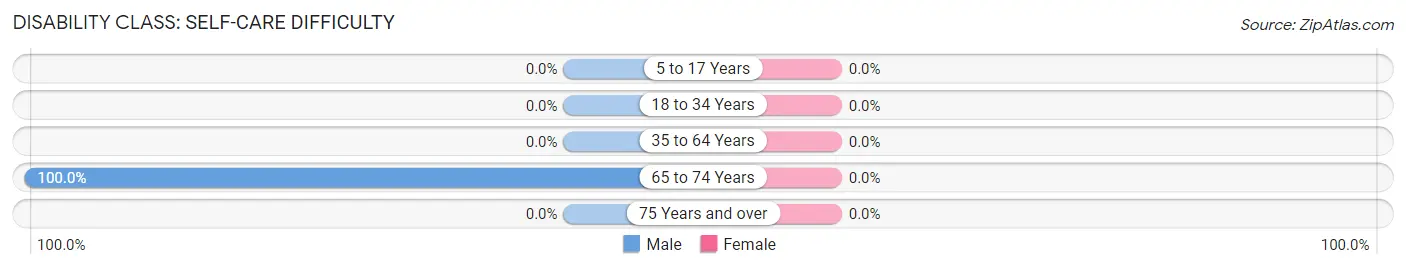
| Age Bracket | Male | Female |
| 5 to 17 Years | 0 (0.0%) | 0 (0.0%) |
| 18 to 34 Years | 0 (0.0%) | 0 (0.0%) |
| 35 to 64 Years | 0 (0.0%) | 0 (0.0%) |
| 65 to 74 Years | 1 (100.0%) | 0 (0.0%) |
| 75 Years and over | 0 (0.0%) | 0 (0.0%) |
Technology Access in Benton
Computing Device Access in Benton
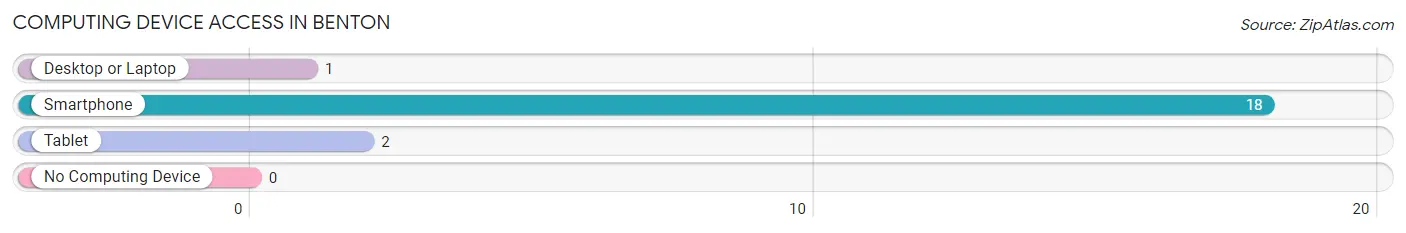
| Device Type | # Households | % Households |
| Desktop or Laptop | 1 | 5.6% |
| Smartphone | 18 | 100.0% |
| Tablet | 2 | 11.1% |
| No Computing Device | 0 | 0.0% |
| Total | 18 | 100.0% |
Internet Access in Benton
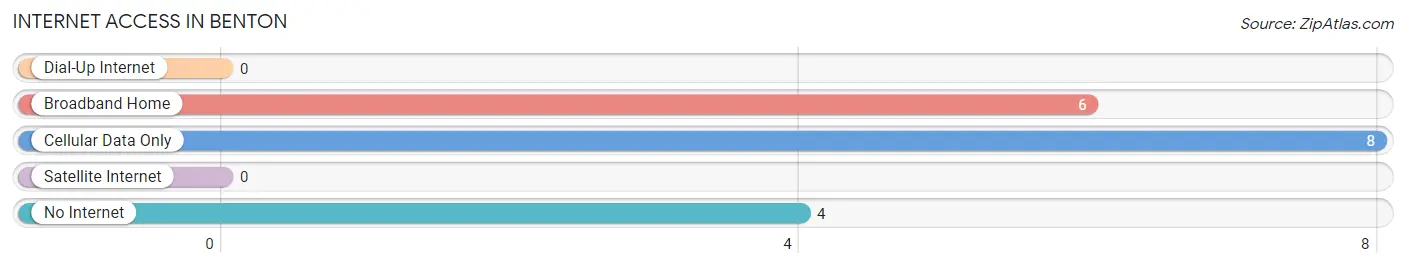
| Internet Type | # Households | % Households |
| Dial-Up Internet | 0 | 0.0% |
| Broadband Home | 6 | 33.3% |
| Cellular Data Only | 8 | 44.4% |
| Satellite Internet | 0 | 0.0% |
| No Internet | 4 | 22.2% |
| Total | 18 | 100.0% |
Benton Summary
Benton is a small town located in the northwest corner of Alabama, in the foothills of the Appalachian Mountains. It is situated in the county of Marshall, and is part of the Huntsville-Decatur Combined Statistical Area. The town has a population of approximately 1,500 people, and is known for its rural charm and friendly atmosphere.
History
Benton was founded in 1836 by a group of settlers from Tennessee. The town was named after Thomas Hart Benton, a prominent politician from the state of Missouri. The town was originally a farming community, and the main crops grown were cotton, corn, and tobacco. In the late 19th century, the town began to grow and develop, and by the early 20th century, it had become a thriving commercial center.
In the 1950s, the town experienced a period of rapid growth, as many people moved to the area to take advantage of the booming economy. This growth was largely due to the presence of the nearby Redstone Arsenal, which provided many jobs for the local population.
Geography
Benton is located in the northwest corner of Alabama, in the foothills of the Appalachian Mountains. The town is situated in the county of Marshall, and is part of the Huntsville-Decatur Combined Statistical Area. The town is located at the intersection of US Highway 431 and Alabama Highway 79.
The town is situated on a plateau, and is surrounded by rolling hills and forests. The town is located near the Tennessee River, and is approximately 30 miles from the city of Huntsville.
Economy
The economy of Benton is largely based on agriculture and manufacturing. The town is home to several large farms, which produce a variety of crops, including cotton, corn, and tobacco. The town is also home to several manufacturing plants, which produce a variety of products, including furniture, clothing, and automotive parts.
The town is also home to several small businesses, including restaurants, retail stores, and service providers. The town is also home to several educational institutions, including a community college and a technical school.
Demographics
As of the 2010 census, the population of Benton was 1,500 people. The racial makeup of the town was 95.3% White, 1.7% African American, 0.7% Native American, 0.3% Asian, and 1.7% from other races. The median household income was $35,000, and the median family income was $41,000.
The town is home to a variety of religious denominations, including Baptist, Methodist, and Presbyterian. The town is also home to a variety of cultural and recreational activities, including festivals, fairs, and sporting events.
Conclusion
Benton is a small town located in the northwest corner of Alabama, in the foothills of the Appalachian Mountains. The town has a population of approximately 1,500 people, and is known for its rural charm and friendly atmosphere. The economy of the town is largely based on agriculture and manufacturing, and the town is home to several small businesses, educational institutions, and cultural and recreational activities. The town is also home to a variety of religious denominations, and the racial makeup of the town is predominantly White.
Common Questions
What is Per Capita Income in Benton?
Per Capita income in Benton is $42,704.
What is the Median Family Income in Benton?
Median Family Income in Benton is $89,000.
What is the Median Household income in Benton?
Median Household Income in Benton is $44,583.
What is Inequality or Gini Index in Benton?
Inequality or Gini Index in Benton is 0.21.
What is the Total Population of Benton?
Total Population of Benton is 27.
What is the Total Male Population of Benton?
Total Male Population of Benton is 18.
What is the Total Female Population of Benton?
Total Female Population of Benton is 9.
What is the Ratio of Males per 100 Females in Benton?
There are 200.00 Males per 100 Females in Benton.
What is the Ratio of Females per 100 Males in Benton?
There are 50.00 Females per 100 Males in Benton.
What is the Median Population Age in Benton?
Median Population Age in Benton is 61.2 Years.
What is the Average Family Size in Benton
Average Family Size in Benton is 2.1 People.
What is the Average Household Size in Benton
Average Household Size in Benton is 1.5 People.
How Large is the Labor Force in Benton?
There are 17 People in the Labor Forcein in Benton.
What is the Percentage of People in the Labor Force in Benton?
63.0% of People are in the Labor Force in Benton.