Zip Codes with the Highest Percentage of Population Employed in Arts, Media & Entertainment in Alabama
RELATED REPORTS & OPTIONS
Arts, Media & Entertainment
Alabama
Compare Zip Codes
Map of Zip Codes with the Highest Percentage of Population Employed in Arts, Media & Entertainment in Alabama
0.0%
80.0%
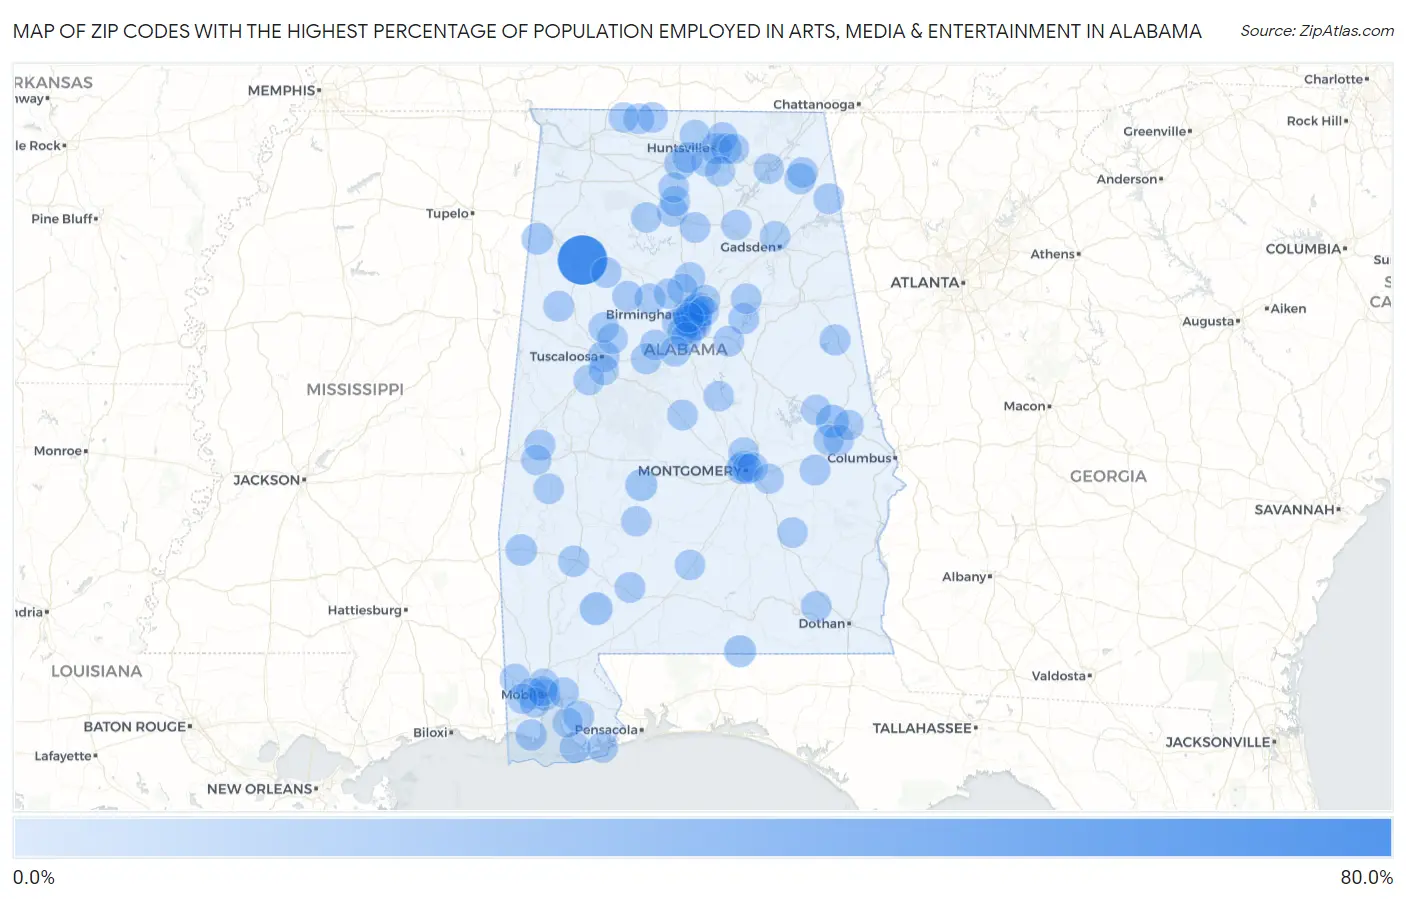
Zip Codes with the Highest Percentage of Population Employed in Arts, Media & Entertainment in Alabama
| Zip Code | % Employed | vs State | vs National | |
| 1. | 35559 | 73.3% | 1.3%(+72.1)#1 | 2.1%(+71.3)#4 |
| 2. | 36879 | 11.4% | 1.3%(+10.1)#2 | 2.1%(+9.33)#292 |
| 3. | 36480 | 10.9% | 1.3%(+9.61)#3 | 2.1%(+8.81)#316 |
| 4. | 36767 | 7.4% | 1.3%(+6.13)#4 | 2.1%(+5.33)#674 |
| 5. | 36455 | 7.1% | 1.3%(+5.89)#5 | 2.1%(+5.08)#723 |
| 6. | 35552 | 6.7% | 1.3%(+5.49)#6 | 2.1%(+4.68)#819 |
| 7. | 35487 | 6.2% | 1.3%(+4.90)#7 | 2.1%(+4.09)#987 |
| 8. | 36919 | 6.1% | 1.3%(+4.81)#8 | 2.1%(+4.00)#1,010 |
| 9. | 35649 | 5.7% | 1.3%(+4.46)#9 | 2.1%(+3.65)#1,154 |
| 10. | 36451 | 5.3% | 1.3%(+4.05)#10 | 2.1%(+3.24)#1,348 |
| 11. | 36523 | 5.3% | 1.3%(+4.03)#11 | 2.1%(+3.23)#1,355 |
| 12. | 35986 | 4.8% | 1.3%(+3.59)#12 | 2.1%(+2.79)#1,583 |
| 13. | 35229 | 4.7% | 1.3%(+3.48)#13 | 2.1%(+2.68)#1,669 |
| 14. | 35203 | 4.7% | 1.3%(+3.47)#14 | 2.1%(+2.66)#1,677 |
| 15. | 36576 | 4.6% | 1.3%(+3.31)#15 | 2.1%(+2.51)#1,804 |
| 16. | 35801 | 4.3% | 1.3%(+3.01)#16 | 2.1%(+2.20)#2,078 |
| 17. | 36278 | 4.2% | 1.3%(+2.93)#17 | 2.1%(+2.12)#2,157 |
| 18. | 35741 | 4.1% | 1.3%(+2.86)#18 | 2.1%(+2.05)#2,238 |
| 19. | 36542 | 4.0% | 1.3%(+2.77)#19 | 2.1%(+1.96)#2,343 |
| 20. | 35811 | 3.9% | 1.3%(+2.65)#20 | 2.1%(+1.85)#2,486 |
| 21. | 35223 | 3.8% | 1.3%(+2.58)#21 | 2.1%(+1.78)#2,568 |
| 22. | 35222 | 3.8% | 1.3%(+2.56)#22 | 2.1%(+1.76)#2,602 |
| 23. | 36104 | 3.8% | 1.3%(+2.55)#23 | 2.1%(+1.74)#2,618 |
| 24. | 35054 | 3.8% | 1.3%(+2.55)#24 | 2.1%(+1.74)#2,621 |
| 25. | 35209 | 3.8% | 1.3%(+2.49)#25 | 2.1%(+1.69)#2,687 |
| 26. | 36083 | 3.7% | 1.3%(+2.49)#26 | 2.1%(+1.69)#2,699 |
| 27. | 35188 | 3.7% | 1.3%(+2.42)#27 | 2.1%(+1.62)#2,799 |
| 28. | 35179 | 3.7% | 1.3%(+2.41)#28 | 2.1%(+1.61)#2,807 |
| 29. | 35213 | 3.6% | 1.3%(+2.36)#29 | 2.1%(+1.56)#2,881 |
| 30. | 35470 | 3.6% | 1.3%(+2.35)#30 | 2.1%(+1.55)#2,901 |
| 31. | 35078 | 3.6% | 1.3%(+2.33)#31 | 2.1%(+1.53)#2,926 |
| 32. | 35973 | 3.6% | 1.3%(+2.32)#32 | 2.1%(+1.52)#2,940 |
| 33. | 35574 | 3.4% | 1.3%(+2.16)#33 | 2.1%(+1.35)#3,211 |
| 34. | 36750 | 3.3% | 1.3%(+2.05)#34 | 2.1%(+1.25)#3,411 |
| 35. | 36362 | 3.3% | 1.3%(+2.02)#35 | 2.1%(+1.22)#3,460 |
| 36. | 35988 | 3.2% | 1.3%(+1.93)#36 | 2.1%(+1.12)#3,648 |
| 37. | 36460 | 3.2% | 1.3%(+1.90)#37 | 2.1%(+1.10)#3,716 |
| 38. | 36604 | 3.1% | 1.3%(+1.87)#38 | 2.1%(+1.07)#3,777 |
| 39. | 36113 | 3.1% | 1.3%(+1.84)#39 | 2.1%(+1.04)#3,852 |
| 40. | 35221 | 3.0% | 1.3%(+1.74)#40 | 2.1%(+0.934)#4,092 |
| 41. | 35130 | 3.0% | 1.3%(+1.74)#41 | 2.1%(+0.933)#4,094 |
| 42. | 36561 | 2.9% | 1.3%(+1.69)#42 | 2.1%(+0.888)#4,210 |
| 43. | 35216 | 2.9% | 1.3%(+1.68)#43 | 2.1%(+0.881)#4,222 |
| 44. | 35579 | 2.9% | 1.3%(+1.64)#44 | 2.1%(+0.835)#4,359 |
| 45. | 35243 | 2.9% | 1.3%(+1.64)#45 | 2.1%(+0.834)#4,362 |
| 46. | 35055 | 2.8% | 1.3%(+1.56)#46 | 2.1%(+0.758)#4,564 |
| 47. | 35610 | 2.8% | 1.3%(+1.55)#47 | 2.1%(+0.743)#4,605 |
| 48. | 35549 | 2.8% | 1.3%(+1.54)#48 | 2.1%(+0.736)#4,624 |
| 49. | 35091 | 2.8% | 1.3%(+1.52)#49 | 2.1%(+0.717)#4,668 |
| 50. | 35808 | 2.7% | 1.3%(+1.48)#50 | 2.1%(+0.679)#4,788 |
| 51. | 35463 | 2.7% | 1.3%(+1.47)#51 | 2.1%(+0.662)#4,844 |
| 52. | 35647 | 2.7% | 1.3%(+1.46)#52 | 2.1%(+0.660)#4,849 |
| 53. | 35125 | 2.6% | 1.3%(+1.37)#53 | 2.1%(+0.567)#5,146 |
| 54. | 35756 | 2.6% | 1.3%(+1.35)#54 | 2.1%(+0.545)#5,210 |
| 55. | 35111 | 2.5% | 1.3%(+1.26)#55 | 2.1%(+0.455)#5,505 |
| 56. | 36081 | 2.5% | 1.3%(+1.22)#56 | 2.1%(+0.414)#5,632 |
| 57. | 36849 | 2.5% | 1.3%(+1.21)#57 | 2.1%(+0.402)#5,671 |
| 58. | 35212 | 2.5% | 1.3%(+1.19)#58 | 2.1%(+0.391)#5,728 |
| 59. | 35405 | 2.4% | 1.3%(+1.16)#59 | 2.1%(+0.360)#5,860 |
| 60. | 36925 | 2.4% | 1.3%(+1.16)#60 | 2.1%(+0.356)#5,876 |
| 61. | 35226 | 2.4% | 1.3%(+1.14)#61 | 2.1%(+0.340)#5,933 |
| 62. | 35406 | 2.4% | 1.3%(+1.14)#62 | 2.1%(+0.338)#5,943 |
| 63. | 35206 | 2.3% | 1.3%(+1.08)#63 | 2.1%(+0.277)#6,192 |
| 64. | 35244 | 2.3% | 1.3%(+1.07)#64 | 2.1%(+0.270)#6,237 |
| 65. | 35748 | 2.3% | 1.3%(+1.07)#65 | 2.1%(+0.265)#6,263 |
| 66. | 36688 | 2.3% | 1.3%(+1.07)#66 | 2.1%(+0.265)#6,264 |
| 67. | 35749 | 2.3% | 1.3%(+1.06)#67 | 2.1%(+0.258)#6,303 |
| 68. | 36916 | 2.3% | 1.3%(+1.03)#68 | 2.1%(+0.222)#6,450 |
| 69. | 35080 | 2.3% | 1.3%(+1.02)#69 | 2.1%(+0.217)#6,468 |
| 70. | 35954 | 2.3% | 1.3%(+0.995)#70 | 2.1%(+0.191)#6,597 |
| 71. | 36033 | 2.2% | 1.3%(+0.991)#71 | 2.1%(+0.188)#6,608 |
| 72. | 35540 | 2.2% | 1.3%(+0.976)#72 | 2.1%(+0.173)#6,670 |
| 73. | 36832 | 2.2% | 1.3%(+0.940)#73 | 2.1%(+0.136)#6,837 |
| 74. | 35475 | 2.1% | 1.3%(+0.890)#74 | 2.1%(+0.086)#7,068 |
| 75. | 36532 | 2.1% | 1.3%(+0.850)#75 | 2.1%(+0.047)#7,233 |
| 76. | 35769 | 2.1% | 1.3%(+0.834)#76 | 2.1%(+0.031)#7,324 |
| 77. | 36020 | 2.1% | 1.3%(+0.802)#77 | 2.1%(-0.001)#7,493 |
| 78. | 35235 | 2.1% | 1.3%(+0.798)#78 | 2.1%(-0.005)#7,515 |
| 79. | 36587 | 2.0% | 1.3%(+0.788)#79 | 2.1%(-0.015)#7,567 |
| 80. | 35622 | 2.0% | 1.3%(+0.779)#80 | 2.1%(-0.025)#7,625 |
| 81. | 35046 | 2.0% | 1.3%(+0.771)#81 | 2.1%(-0.032)#7,656 |
| 82. | 35210 | 2.0% | 1.3%(+0.741)#82 | 2.1%(-0.062)#7,820 |
| 83. | 36109 | 2.0% | 1.3%(+0.713)#83 | 2.1%(-0.090)#7,973 |
| 84. | 35071 | 2.0% | 1.3%(+0.711)#84 | 2.1%(-0.093)#7,984 |
| 85. | 35980 | 2.0% | 1.3%(+0.699)#85 | 2.1%(-0.104)#8,045 |
| 86. | 35205 | 2.0% | 1.3%(+0.698)#86 | 2.1%(-0.105)#8,053 |
| 87. | 36611 | 1.9% | 1.3%(+0.687)#87 | 2.1%(-0.117)#8,112 |
| 88. | 36693 | 1.9% | 1.3%(+0.683)#88 | 2.1%(-0.120)#8,131 |
| 89. | 36726 | 1.9% | 1.3%(+0.677)#89 | 2.1%(-0.127)#8,172 |
| 90. | 36617 | 1.9% | 1.3%(+0.673)#90 | 2.1%(-0.131)#8,195 |
| 91. | 36107 | 1.9% | 1.3%(+0.649)#91 | 2.1%(-0.155)#8,329 |
| 92. | 35640 | 1.9% | 1.3%(+0.639)#92 | 2.1%(-0.164)#8,400 |
| 93. | 36527 | 1.9% | 1.3%(+0.623)#93 | 2.1%(-0.180)#8,498 |
| 94. | 36850 | 1.9% | 1.3%(+0.622)#94 | 2.1%(-0.182)#8,509 |
| 95. | 35073 | 1.9% | 1.3%(+0.602)#95 | 2.1%(-0.201)#8,618 |
| 96. | 36064 | 1.8% | 1.3%(+0.589)#96 | 2.1%(-0.214)#8,685 |
| 97. | 36801 | 1.8% | 1.3%(+0.585)#97 | 2.1%(-0.218)#8,707 |
| 98. | 35648 | 1.8% | 1.3%(+0.576)#98 | 2.1%(-0.227)#8,773 |
| 99. | 35803 | 1.8% | 1.3%(+0.545)#99 | 2.1%(-0.258)#8,961 |
| 100. | 36608 | 1.8% | 1.3%(+0.529)#100 | 2.1%(-0.274)#9,055 |
Common Questions
What are the Top 10 Zip Codes with the Highest Percentage of Population Employed in Arts, Media & Entertainment in Alabama?
Top 10 Zip Codes with the Highest Percentage of Population Employed in Arts, Media & Entertainment in Alabama are:
What zip code has the Highest Percentage of Population Employed in Arts, Media & Entertainment in Alabama?
35559 has the Highest Percentage of Population Employed in Arts, Media & Entertainment in Alabama with 73.3%.
What is the Percentage of Population Employed in Arts, Media & Entertainment in the State of Alabama?
Percentage of Population Employed in Arts, Media & Entertainment in Alabama is 1.3%.
What is the Percentage of Population Employed in Arts, Media & Entertainment in the United States?
Percentage of Population Employed in Arts, Media & Entertainment in the United States is 2.1%.