Zip Codes with the Highest Percentage of Population with a Degree in Computers and Mathematics in Washington
RELATED REPORTS & OPTIONS
Computers and Mathematics
Washington
Compare Zip Codes
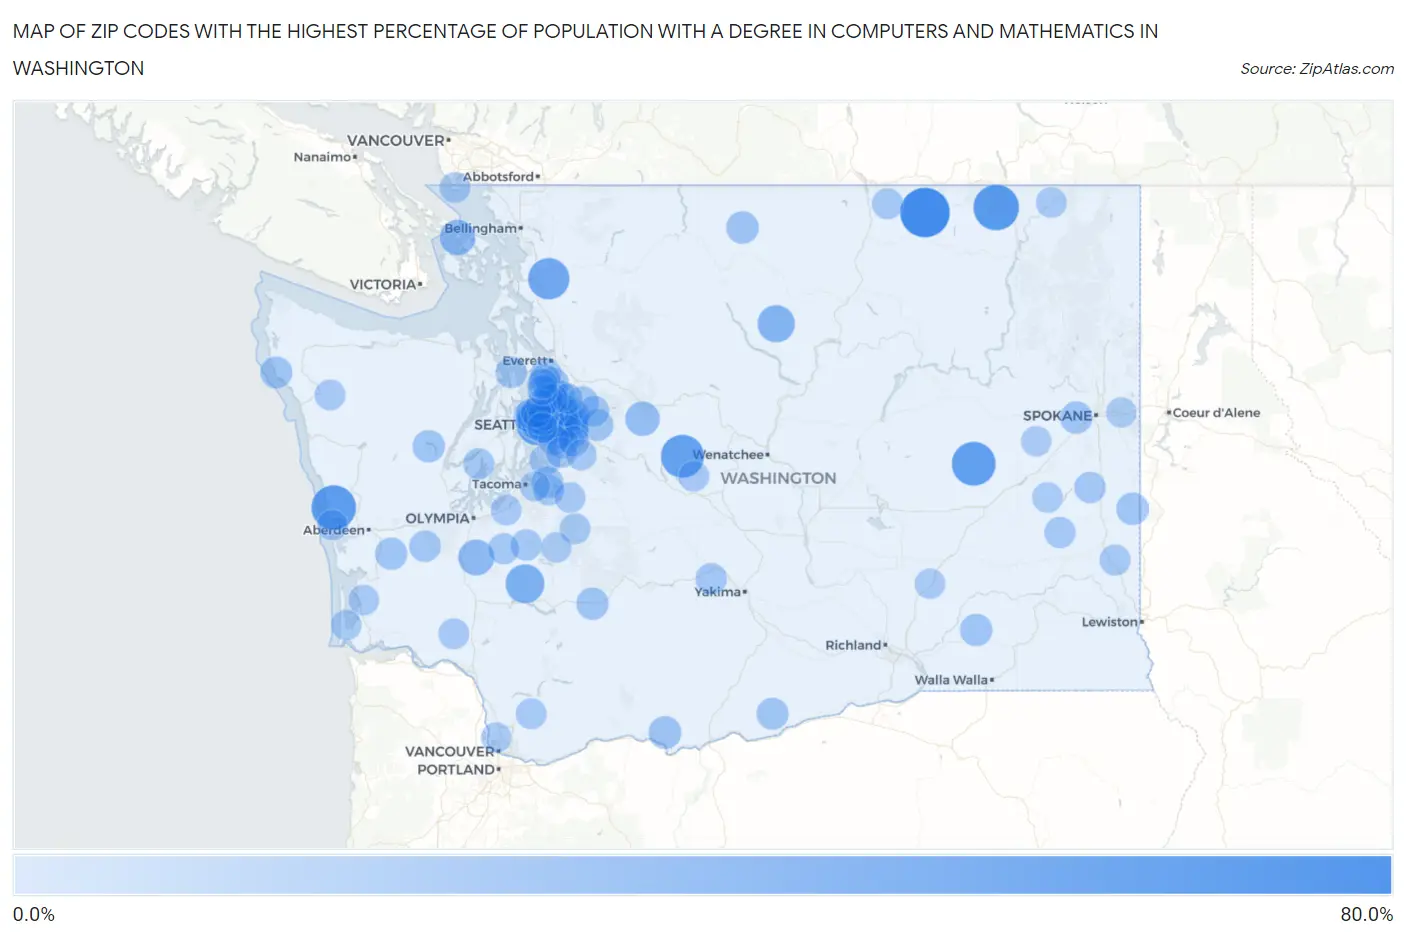
Map of Zip Codes with the Highest Percentage of Population with a Degree in Computers and Mathematics in Washington
0.0%
80.0%
Zip Codes with the Highest Percentage of Population with a Degree in Computers and Mathematics in Washington
| Zip Code | % Graduates | vs State | vs National | |
| 1. | 98859 | 68.8% | 7.0%(+61.8)#1 | 4.9%(+63.9)#39 |
| 2. | 99160 | 55.6% | 7.0%(+48.6)#2 | 4.9%(+50.7)#61 |
| 3. | 98535 | 52.4% | 7.0%(+45.5)#3 | 4.9%(+47.5)#68 |
| 4. | 99144 | 50.0% | 7.0%(+43.0)#4 | 4.9%(+45.1)#90 |
| 5. | 98940 | 47.4% | 7.0%(+40.5)#5 | 4.9%(+42.5)#96 |
| 6. | 98164 | 46.8% | 7.0%(+39.8)#6 | 4.9%(+41.9)#100 |
| 7. | 98235 | 41.9% | 7.0%(+35.0)#7 | 4.9%(+37.0)#124 |
| 8. | 98533 | 34.0% | 7.0%(+27.0)#8 | 4.9%(+29.1)#178 |
| 9. | 98814 | 28.9% | 7.0%(+22.0)#9 | 4.9%(+24.1)#239 |
| 10. | 98530 | 25.0% | 7.0%(+18.0)#10 | 4.9%(+20.1)#299 |
| 11. | 98297 | 23.1% | 7.0%(+16.1)#11 | 4.9%(+18.2)#361 |
| 12. | 98007 | 23.1% | 7.0%(+16.1)#12 | 4.9%(+18.2)#362 |
| 13. | 98052 | 21.8% | 7.0%(+14.8)#13 | 4.9%(+16.9)#399 |
| 14. | 98288 | 20.0% | 7.0%(+13.0)#14 | 4.9%(+15.1)#470 |
| 15. | 98121 | 17.4% | 7.0%(+10.4)#15 | 4.9%(+12.5)#596 |
| 16. | 98101 | 17.3% | 7.0%(+10.4)#16 | 4.9%(+12.4)#604 |
| 17. | 98005 | 15.6% | 7.0%(+8.64)#17 | 4.9%(+10.7)#739 |
| 18. | 98004 | 15.5% | 7.0%(+8.49)#18 | 4.9%(+10.6)#746 |
| 19. | 98109 | 15.3% | 7.0%(+8.33)#19 | 4.9%(+10.4)#763 |
| 20. | 98008 | 15.2% | 7.0%(+8.19)#20 | 4.9%(+10.3)#772 |
| 21. | 98635 | 14.9% | 7.0%(+7.95)#21 | 4.9%(+10.0)#798 |
| 22. | 98012 | 14.7% | 7.0%(+7.71)#22 | 4.9%(+9.77)#824 |
| 23. | 98074 | 14.6% | 7.0%(+7.64)#23 | 4.9%(+9.71)#832 |
| 24. | 98029 | 14.5% | 7.0%(+7.58)#24 | 4.9%(+9.65)#840 |
| 25. | 98833 | 14.3% | 7.0%(+7.32)#25 | 4.9%(+9.39)#883 |
| 26. | 98006 | 14.1% | 7.0%(+7.11)#26 | 4.9%(+9.18)#899 |
| 27. | 99128 | 14.0% | 7.0%(+6.99)#27 | 4.9%(+9.06)#914 |
| 28. | 98075 | 13.8% | 7.0%(+6.84)#28 | 4.9%(+8.91)#927 |
| 29. | 99348 | 13.8% | 7.0%(+6.83)#29 | 4.9%(+8.90)#928 |
| 30. | 98548 | 13.7% | 7.0%(+6.78)#30 | 4.9%(+8.85)#939 |
| 31. | 99001 | 13.7% | 7.0%(+6.72)#31 | 4.9%(+8.79)#947 |
| 32. | 98019 | 13.6% | 7.0%(+6.64)#32 | 4.9%(+8.71)#960 |
| 33. | 98377 | 13.6% | 7.0%(+6.61)#33 | 4.9%(+8.68)#966 |
| 34. | 98021 | 13.4% | 7.0%(+6.44)#34 | 4.9%(+8.51)#996 |
| 35. | 98033 | 13.2% | 7.0%(+6.25)#35 | 4.9%(+8.32)#1,018 |
| 36. | 98053 | 13.2% | 7.0%(+6.19)#36 | 4.9%(+8.26)#1,032 |
| 37. | 98537 | 13.0% | 7.0%(+6.01)#37 | 4.9%(+8.08)#1,061 |
| 38. | 98122 | 12.6% | 7.0%(+5.65)#38 | 4.9%(+7.72)#1,108 |
| 39. | 98350 | 12.5% | 7.0%(+5.54)#39 | 4.9%(+7.61)#1,137 |
| 40. | 99356 | 12.1% | 7.0%(+5.16)#40 | 4.9%(+7.23)#1,198 |
| 41. | 98034 | 11.8% | 7.0%(+4.88)#41 | 4.9%(+6.95)#1,244 |
| 42. | 98065 | 11.7% | 7.0%(+4.74)#42 | 4.9%(+6.81)#1,281 |
| 43. | 98072 | 11.6% | 7.0%(+4.68)#43 | 4.9%(+6.75)#1,298 |
| 44. | 98047 | 11.6% | 7.0%(+4.63)#44 | 4.9%(+6.70)#1,312 |
| 45. | 98568 | 11.3% | 7.0%(+4.35)#45 | 4.9%(+6.42)#1,373 |
| 46. | 98119 | 10.7% | 7.0%(+3.75)#46 | 4.9%(+5.82)#1,527 |
| 47. | 98947 | 10.6% | 7.0%(+3.65)#47 | 4.9%(+5.72)#1,550 |
| 48. | 98059 | 10.6% | 7.0%(+3.61)#48 | 4.9%(+5.67)#1,563 |
| 49. | 99149 | 10.5% | 7.0%(+3.56)#49 | 4.9%(+5.63)#1,581 |
| 50. | 98340 | 10.1% | 7.0%(+3.10)#50 | 4.9%(+5.16)#1,729 |
| 51. | 99125 | 10.0% | 7.0%(+3.04)#51 | 4.9%(+5.11)#1,753 |
| 52. | 98597 | 10.0% | 7.0%(+3.02)#52 | 4.9%(+5.09)#1,767 |
| 53. | 98032 | 10.0% | 7.0%(+2.99)#53 | 4.9%(+5.06)#1,774 |
| 54. | 98204 | 9.9% | 7.0%(+2.98)#54 | 4.9%(+5.05)#1,779 |
| 55. | 98039 | 9.9% | 7.0%(+2.92)#55 | 4.9%(+4.99)#1,798 |
| 56. | 98576 | 9.6% | 7.0%(+2.64)#56 | 4.9%(+4.71)#1,923 |
| 57. | 98844 | 9.5% | 7.0%(+2.50)#57 | 4.9%(+4.57)#1,987 |
| 58. | 99102 | 9.4% | 7.0%(+2.45)#58 | 4.9%(+4.52)#2,013 |
| 59. | 98014 | 9.4% | 7.0%(+2.44)#59 | 4.9%(+4.51)#2,014 |
| 60. | 98040 | 9.3% | 7.0%(+2.36)#60 | 4.9%(+4.43)#2,051 |
| 61. | 98524 | 9.3% | 7.0%(+2.36)#61 | 4.9%(+4.42)#2,056 |
| 62. | 98199 | 9.3% | 7.0%(+2.34)#62 | 4.9%(+4.41)#2,061 |
| 63. | 98104 | 9.3% | 7.0%(+2.31)#63 | 4.9%(+4.38)#2,084 |
| 64. | 98087 | 9.2% | 7.0%(+2.23)#64 | 4.9%(+4.30)#2,118 |
| 65. | 98390 | 9.1% | 7.0%(+2.18)#65 | 4.9%(+4.25)#2,155 |
| 66. | 98056 | 9.1% | 7.0%(+2.11)#66 | 4.9%(+4.18)#2,215 |
| 67. | 98112 | 9.0% | 7.0%(+2.03)#67 | 4.9%(+4.10)#2,256 |
| 68. | 98281 | 9.0% | 7.0%(+2.01)#68 | 4.9%(+4.08)#2,277 |
| 69. | 98011 | 8.9% | 7.0%(+1.97)#69 | 4.9%(+4.03)#2,298 |
| 70. | 98323 | 8.8% | 7.0%(+1.86)#70 | 4.9%(+3.93)#2,356 |
| 71. | 98107 | 8.8% | 7.0%(+1.83)#71 | 4.9%(+3.90)#2,375 |
| 72. | 98331 | 8.8% | 7.0%(+1.80)#72 | 4.9%(+3.87)#2,391 |
| 73. | 98058 | 8.7% | 7.0%(+1.77)#73 | 4.9%(+3.84)#2,404 |
| 74. | 98581 | 8.7% | 7.0%(+1.77)#74 | 4.9%(+3.84)#2,407 |
| 75. | 98922 | 8.7% | 7.0%(+1.70)#75 | 4.9%(+3.77)#2,446 |
| 76. | 98321 | 8.6% | 7.0%(+1.60)#76 | 4.9%(+3.67)#2,500 |
| 77. | 98675 | 8.5% | 7.0%(+1.57)#77 | 4.9%(+3.64)#2,519 |
| 78. | 98102 | 8.5% | 7.0%(+1.56)#78 | 4.9%(+3.63)#2,527 |
| 79. | 99157 | 8.5% | 7.0%(+1.53)#79 | 4.9%(+3.60)#2,539 |
| 80. | 98027 | 8.3% | 7.0%(+1.38)#80 | 4.9%(+3.45)#2,627 |
| 81. | 99017 | 8.3% | 7.0%(+1.37)#81 | 4.9%(+3.44)#2,646 |
| 82. | 98433 | 8.3% | 7.0%(+1.36)#82 | 4.9%(+3.43)#2,654 |
| 83. | 98586 | 8.3% | 7.0%(+1.34)#83 | 4.9%(+3.41)#2,670 |
| 84. | 98569 | 8.3% | 7.0%(+1.30)#84 | 4.9%(+3.37)#2,699 |
| 85. | 98105 | 8.2% | 7.0%(+1.27)#85 | 4.9%(+3.34)#2,719 |
| 86. | 98028 | 8.2% | 7.0%(+1.22)#86 | 4.9%(+3.29)#2,755 |
| 87. | 98038 | 8.2% | 7.0%(+1.21)#87 | 4.9%(+3.28)#2,765 |
| 88. | 98125 | 8.0% | 7.0%(+1.03)#88 | 4.9%(+3.10)#2,907 |
| 89. | 98077 | 8.0% | 7.0%(+1.01)#89 | 4.9%(+3.07)#2,928 |
| 90. | 98103 | 8.0% | 7.0%(+1.00)#90 | 4.9%(+3.07)#2,931 |
| 91. | 98328 | 7.9% | 7.0%(+0.933)#91 | 4.9%(+3.00)#2,984 |
| 92. | 98144 | 7.7% | 7.0%(+0.738)#92 | 4.9%(+2.81)#3,134 |
| 93. | 99326 | 7.6% | 7.0%(+0.610)#93 | 4.9%(+2.68)#3,272 |
| 94. | 98036 | 7.6% | 7.0%(+0.601)#94 | 4.9%(+2.67)#3,280 |
| 95. | 98631 | 7.6% | 7.0%(+0.589)#95 | 4.9%(+2.66)#3,291 |
| 96. | 98037 | 7.5% | 7.0%(+0.490)#96 | 4.9%(+2.56)#3,385 |
| 97. | 99216 | 7.4% | 7.0%(+0.448)#97 | 4.9%(+2.52)#3,417 |
| 98. | 99008 | 7.4% | 7.0%(+0.445)#98 | 4.9%(+2.51)#3,422 |
| 99. | 98685 | 7.4% | 7.0%(+0.391)#99 | 4.9%(+2.46)#3,472 |
| 100. | 98424 | 7.3% | 7.0%(+0.359)#100 | 4.9%(+2.43)#3,503 |
Common Questions
What are the Top 10 Zip Codes with the Highest Percentage of Population with a Degree in Computers and Mathematics in Washington?
Top 10 Zip Codes with the Highest Percentage of Population with a Degree in Computers and Mathematics in Washington are:
What zip code has the Highest Percentage of Population with a Degree in Computers and Mathematics in Washington?
98859 has the Highest Percentage of Population with a Degree in Computers and Mathematics in Washington with 68.8%.
What is the Percentage of Population with a Degree in Computers and Mathematics in the State of Washington?
Percentage of Population with a Degree in Computers and Mathematics in Washington is 7.0%.
What is the Percentage of Population with a Degree in Computers and Mathematics in the United States?
Percentage of Population with a Degree in Computers and Mathematics in the United States is 4.9%.