Zip Codes with the Highest Percentage of Population with a Degree in Computers and Mathematics in Alaska
RELATED REPORTS & OPTIONS
Computers and Mathematics
Alaska
Compare Zip Codes
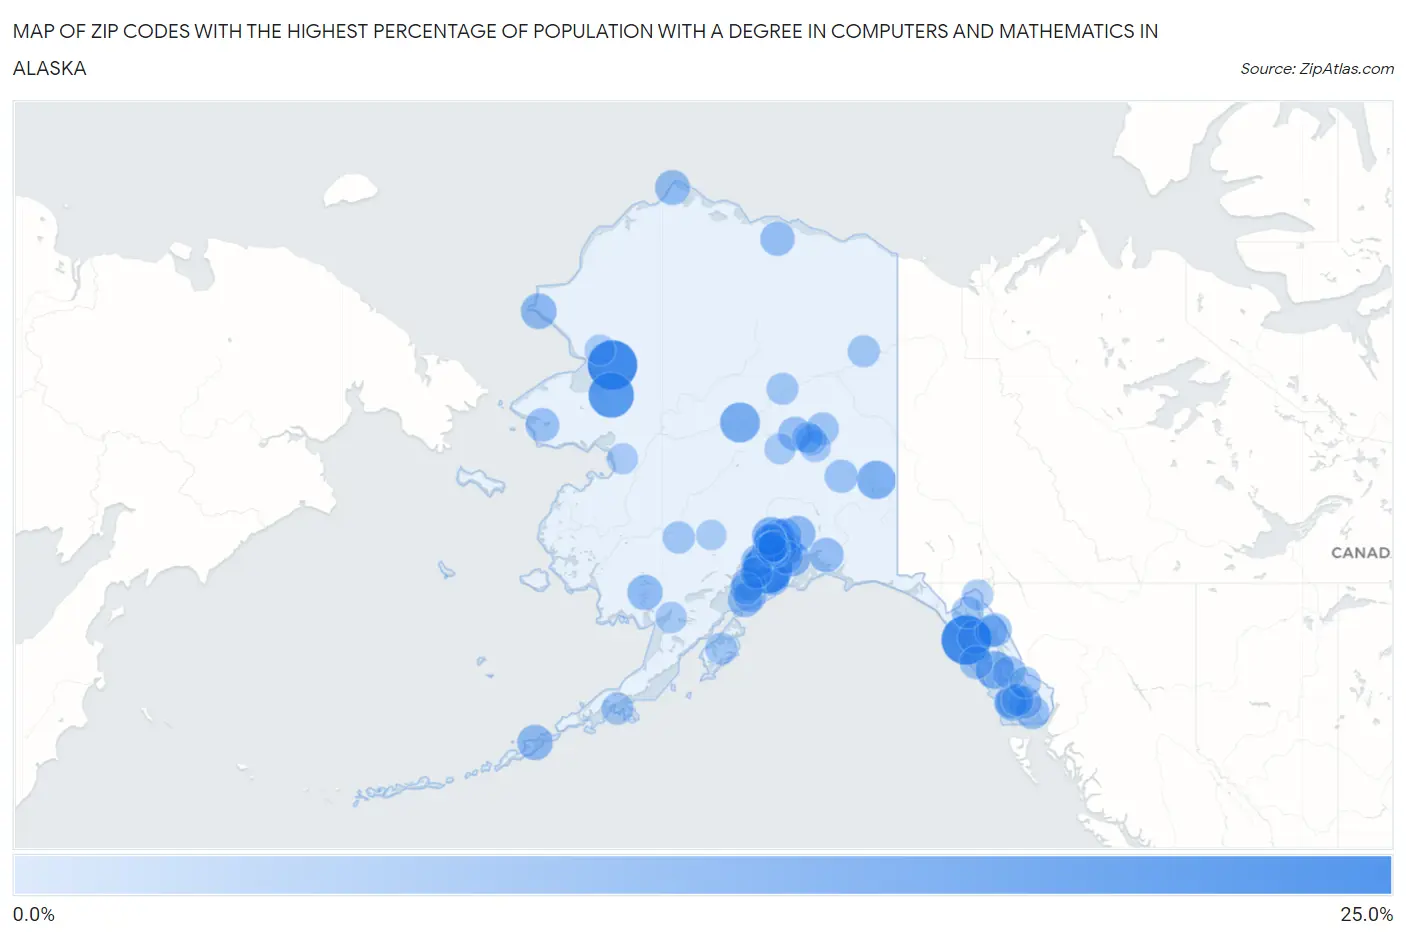
Map of Zip Codes with the Highest Percentage of Population with a Degree in Computers and Mathematics in Alaska
0.0%
25.0%
Zip Codes with the Highest Percentage of Population with a Degree in Computers and Mathematics in Alaska
| Zip Code | % Graduates | vs State | vs National | |
| 1. | 99763 | 21.4% | 3.1%(+18.3)#1 | 4.9%(+16.5)#413 |
| 2. | 99832 | 21.4% | 3.1%(+18.3)#2 | 4.9%(+16.5)#415 |
| 3. | 99572 | 21.1% | 3.1%(+17.9)#3 | 4.9%(+16.2)#428 |
| 4. | 99727 | 16.7% | 3.1%(+13.6)#4 | 4.9%(+11.8)#645 |
| 5. | 99777 | 10.5% | 3.1%(+7.42)#5 | 4.9%(+5.63)#1,580 |
| 6. | 99780 | 9.1% | 3.1%(+5.98)#6 | 4.9%(+4.20)#2,183 |
| 7. | 99694 | 9.0% | 3.1%(+5.88)#7 | 4.9%(+4.09)#2,268 |
| 8. | 99830 | 8.5% | 3.1%(+5.37)#8 | 4.9%(+3.58)#2,558 |
| 9. | 99506 | 7.6% | 3.1%(+4.54)#9 | 4.9%(+2.75)#3,200 |
| 10. | 99567 | 7.3% | 3.1%(+4.17)#10 | 4.9%(+2.38)#3,549 |
| 11. | 99921 | 7.0% | 3.1%(+3.88)#11 | 4.9%(+2.09)#3,854 |
| 12. | 99674 | 6.2% | 3.1%(+3.06)#12 | 4.9%(+1.27)#4,999 |
| 13. | 99766 | 5.9% | 3.1%(+2.78)#13 | 4.9%(+0.988)#5,529 |
| 14. | 99685 | 5.6% | 3.1%(+2.50)#14 | 4.9%(+0.715)#6,048 |
| 15. | 99693 | 5.6% | 3.1%(+2.45)#15 | 4.9%(+0.662)#6,192 |
| 16. | 99576 | 5.4% | 3.1%(+2.34)#16 | 4.9%(+0.550)#6,413 |
| 17. | 99516 | 5.2% | 3.1%(+2.07)#17 | 4.9%(+0.284)#7,027 |
| 18. | 99723 | 5.1% | 3.1%(+1.97)#18 | 4.9%(+0.187)#7,256 |
| 19. | 99504 | 4.7% | 3.1%(+1.58)#19 | 4.9%(-0.212)#8,327 |
| 20. | 99654 | 4.7% | 3.1%(+1.57)#20 | 4.9%(-0.216)#8,342 |
| 21. | 99663 | 4.5% | 3.1%(+1.39)#21 | 4.9%(-0.400)#8,893 |
| 22. | 99686 | 4.5% | 3.1%(+1.38)#22 | 4.9%(-0.408)#8,919 |
| 23. | 99519 | 4.4% | 3.1%(+1.31)#23 | 4.9%(-0.482)#9,155 |
| 24. | 99518 | 4.3% | 3.1%(+1.22)#24 | 4.9%(-0.568)#9,452 |
| 25. | 99515 | 4.3% | 3.1%(+1.19)#25 | 4.9%(-0.597)#9,548 |
| 26. | 99841 | 4.1% | 3.1%(+0.975)#26 | 4.9%(-0.812)#10,214 |
| 27. | 99709 | 4.0% | 3.1%(+0.929)#27 | 4.9%(-0.859)#10,351 |
| 28. | 99577 | 3.8% | 3.1%(+0.718)#28 | 4.9%(-1.07)#11,091 |
| 29. | 99664 | 3.8% | 3.1%(+0.717)#29 | 4.9%(-1.07)#11,095 |
| 30. | 99639 | 3.7% | 3.1%(+0.632)#30 | 4.9%(-1.16)#11,404 |
| 31. | 99926 | 3.7% | 3.1%(+0.597)#31 | 4.9%(-1.19)#11,520 |
| 32. | 99762 | 3.7% | 3.1%(+0.582)#32 | 4.9%(-1.21)#11,584 |
| 33. | 99801 | 3.7% | 3.1%(+0.551)#33 | 4.9%(-1.24)#11,686 |
| 34. | 99835 | 3.3% | 3.1%(+0.210)#34 | 4.9%(-1.58)#12,962 |
| 35. | 99645 | 3.3% | 3.1%(+0.207)#35 | 4.9%(-1.58)#12,975 |
| 36. | 99737 | 3.1% | 3.1%(+0.015)#36 | 4.9%(-1.77)#13,658 |
| 37. | 99587 | 2.9% | 3.1%(-0.173)#37 | 4.9%(-1.96)#14,318 |
| 38. | 99502 | 2.9% | 3.1%(-0.180)#38 | 4.9%(-1.97)#14,338 |
| 39. | 99833 | 2.8% | 3.1%(-0.270)#39 | 4.9%(-2.06)#14,662 |
| 40. | 99508 | 2.7% | 3.1%(-0.369)#40 | 4.9%(-2.16)#15,029 |
| 41. | 99712 | 2.7% | 3.1%(-0.454)#41 | 4.9%(-2.24)#15,339 |
| 42. | 99517 | 2.6% | 3.1%(-0.464)#42 | 4.9%(-2.25)#15,377 |
| 43. | 99603 | 2.6% | 3.1%(-0.502)#43 | 4.9%(-2.29)#15,511 |
| 44. | 99611 | 2.6% | 3.1%(-0.504)#44 | 4.9%(-2.29)#15,522 |
| 45. | 99652 | 2.6% | 3.1%(-0.514)#45 | 4.9%(-2.30)#15,559 |
| 46. | 99556 | 2.3% | 3.1%(-0.828)#46 | 4.9%(-2.62)#16,665 |
| 47. | 99901 | 2.3% | 3.1%(-0.829)#47 | 4.9%(-2.62)#16,666 |
| 48. | 99925 | 2.2% | 3.1%(-0.932)#48 | 4.9%(-2.72)#17,056 |
| 49. | 99824 | 2.1% | 3.1%(-0.967)#49 | 4.9%(-2.75)#17,172 |
| 50. | 99661 | 2.1% | 3.1%(-0.979)#50 | 4.9%(-2.77)#17,212 |
| 51. | 99557 | 2.1% | 3.1%(-0.979)#51 | 4.9%(-2.77)#17,215 |
| 52. | 99507 | 2.1% | 3.1%(-1.05)#52 | 4.9%(-2.83)#17,417 |
| 53. | 99919 | 2.0% | 3.1%(-1.07)#53 | 4.9%(-2.85)#17,483 |
| 54. | 99740 | 2.0% | 3.1%(-1.07)#54 | 4.9%(-2.85)#17,484 |
| 55. | 99615 | 1.9% | 3.1%(-1.24)#55 | 4.9%(-3.03)#18,040 |
| 56. | 99827 | 1.9% | 3.1%(-1.24)#56 | 4.9%(-3.03)#18,046 |
| 57. | 99669 | 1.8% | 3.1%(-1.29)#57 | 4.9%(-3.08)#18,192 |
| 58. | 99701 | 1.8% | 3.1%(-1.31)#58 | 4.9%(-3.10)#18,259 |
| 59. | 99623 | 1.8% | 3.1%(-1.33)#59 | 4.9%(-3.12)#18,321 |
| 60. | 99501 | 1.5% | 3.1%(-1.59)#60 | 4.9%(-3.38)#19,101 |
| 61. | 99714 | 1.5% | 3.1%(-1.64)#61 | 4.9%(-3.43)#19,238 |
| 62. | 99929 | 1.3% | 3.1%(-1.85)#62 | 4.9%(-3.64)#19,855 |
| 63. | 99702 | 1.2% | 3.1%(-1.87)#63 | 4.9%(-3.65)#19,897 |
| 64. | 99633 | 1.1% | 3.1%(-2.03)#64 | 4.9%(-3.82)#20,322 |
| 65. | 99840 | 1.0% | 3.1%(-2.09)#65 | 4.9%(-3.88)#20,480 |
| 66. | 99505 | 1.0% | 3.1%(-2.10)#66 | 4.9%(-3.88)#20,492 |
| 67. | 99760 | 0.98% | 3.1%(-2.13)#67 | 4.9%(-3.91)#20,554 |
| 68. | 99705 | 0.98% | 3.1%(-2.13)#68 | 4.9%(-3.92)#20,565 |
| 69. | 99684 | 0.72% | 3.1%(-2.39)#69 | 4.9%(-4.17)#21,112 |
| 70. | 99752 | 0.55% | 3.1%(-2.56)#70 | 4.9%(-4.34)#21,402 |
| 71. | 99503 | 0.13% | 3.1%(-2.98)#71 | 4.9%(-4.76)#21,792 |
Common Questions
What are the Top 10 Zip Codes with the Highest Percentage of Population with a Degree in Computers and Mathematics in Alaska?
Top 10 Zip Codes with the Highest Percentage of Population with a Degree in Computers and Mathematics in Alaska are:
What zip code has the Highest Percentage of Population with a Degree in Computers and Mathematics in Alaska?
99763 has the Highest Percentage of Population with a Degree in Computers and Mathematics in Alaska with 21.4%.
What is the Percentage of Population with a Degree in Computers and Mathematics in the State of Alaska?
Percentage of Population with a Degree in Computers and Mathematics in Alaska is 3.1%.
What is the Percentage of Population with a Degree in Computers and Mathematics in the United States?
Percentage of Population with a Degree in Computers and Mathematics in the United States is 4.9%.