Zip Codes with the Highest Percentage of Population with a Degree in Computers and Mathematics in Maine
RELATED REPORTS & OPTIONS
Computers and Mathematics
Maine
Compare Zip Codes
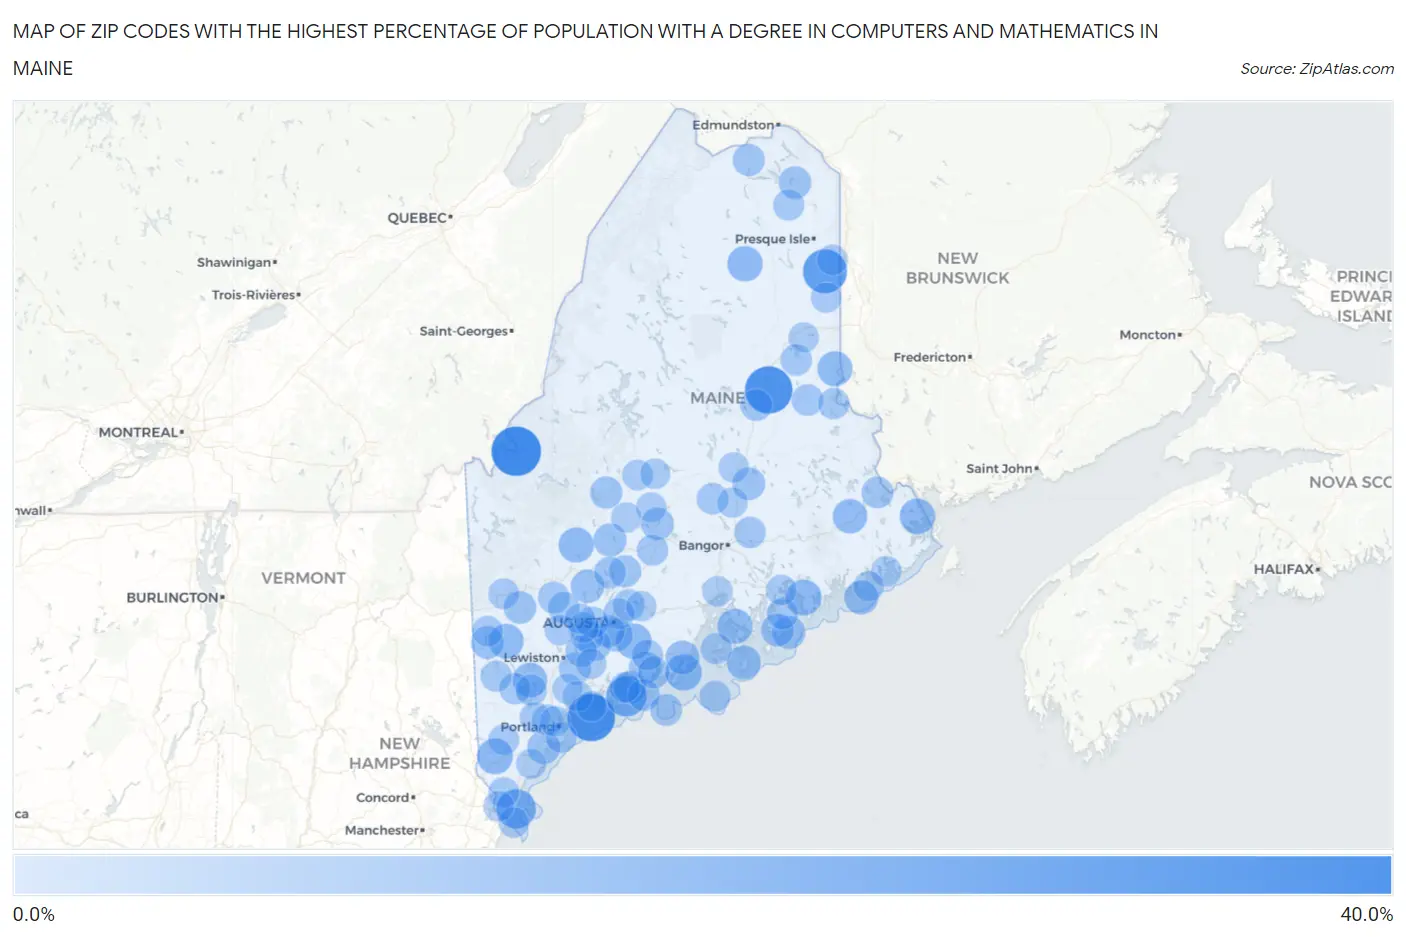
Map of Zip Codes with the Highest Percentage of Population with a Degree in Computers and Mathematics in Maine
0.0%
40.0%
Zip Codes with the Highest Percentage of Population with a Degree in Computers and Mathematics in Maine
| Zip Code | % Graduates | vs State | vs National | |
| 1. | 04936 | 33.3% | 2.9%(+30.4)#1 | 4.9%(+28.4)#186 |
| 2. | 04003 | 30.4% | 2.9%(+27.5)#2 | 4.9%(+25.5)#216 |
| 3. | 04733 | 30.0% | 2.9%(+27.1)#3 | 4.9%(+25.1)#225 |
| 4. | 04734 | 24.7% | 2.9%(+21.8)#4 | 4.9%(+19.8)#309 |
| 5. | 04575 | 19.5% | 2.9%(+16.6)#5 | 4.9%(+14.6)#487 |
| 6. | 03911 | 17.8% | 2.9%(+14.9)#6 | 4.9%(+12.9)#573 |
| 7. | 04859 | 13.1% | 2.9%(+10.2)#7 | 4.9%(+8.24)#1,034 |
| 8. | 04607 | 12.5% | 2.9%(+9.59)#8 | 4.9%(+7.61)#1,127 |
| 9. | 04083 | 12.4% | 2.9%(+9.46)#9 | 4.9%(+7.48)#1,154 |
| 10. | 04667 | 11.9% | 2.9%(+9.02)#10 | 4.9%(+7.04)#1,229 |
| 11. | 04353 | 11.8% | 2.9%(+8.89)#11 | 4.9%(+6.91)#1,255 |
| 12. | 04732 | 11.6% | 2.9%(+8.68)#12 | 4.9%(+6.70)#1,310 |
| 13. | 04650 | 11.4% | 2.9%(+8.46)#13 | 4.9%(+6.48)#1,353 |
| 14. | 04956 | 11.3% | 2.9%(+8.43)#14 | 4.9%(+6.45)#1,364 |
| 15. | 04471 | 11.2% | 2.9%(+8.32)#15 | 4.9%(+6.34)#1,394 |
| 16. | 04088 | 10.9% | 2.9%(+7.95)#16 | 4.9%(+5.97)#1,493 |
| 17. | 04015 | 10.4% | 2.9%(+7.44)#17 | 4.9%(+5.46)#1,625 |
| 18. | 04686 | 10.3% | 2.9%(+7.43)#18 | 4.9%(+5.45)#1,635 |
| 19. | 04645 | 9.7% | 2.9%(+6.76)#19 | 4.9%(+4.78)#1,895 |
| 20. | 04611 | 9.7% | 2.9%(+6.74)#20 | 4.9%(+4.76)#1,902 |
| 21. | 04861 | 9.1% | 2.9%(+6.20)#21 | 4.9%(+4.21)#2,166 |
| 22. | 04360 | 8.7% | 2.9%(+5.83)#22 | 4.9%(+3.85)#2,399 |
| 23. | 04625 | 8.3% | 2.9%(+5.42)#23 | 4.9%(+3.44)#2,649 |
| 24. | 04950 | 8.3% | 2.9%(+5.39)#24 | 4.9%(+3.41)#2,663 |
| 25. | 04064 | 8.2% | 2.9%(+5.32)#25 | 4.9%(+3.34)#2,721 |
| 26. | 04346 | 8.2% | 2.9%(+5.24)#26 | 4.9%(+3.26)#2,784 |
| 27. | 04537 | 8.0% | 2.9%(+5.04)#27 | 4.9%(+3.06)#2,937 |
| 28. | 04051 | 7.9% | 2.9%(+5.01)#28 | 4.9%(+3.03)#2,961 |
| 29. | 04679 | 7.8% | 2.9%(+4.87)#29 | 4.9%(+2.89)#3,079 |
| 30. | 04475 | 7.7% | 2.9%(+4.78)#30 | 4.9%(+2.80)#3,164 |
| 31. | 04219 | 7.5% | 2.9%(+4.56)#31 | 4.9%(+2.57)#3,369 |
| 32. | 04783 | 7.4% | 2.9%(+4.52)#32 | 4.9%(+2.54)#3,402 |
| 33. | 04971 | 7.4% | 2.9%(+4.51)#33 | 4.9%(+2.53)#3,413 |
| 34. | 04920 | 7.0% | 2.9%(+4.10)#34 | 4.9%(+2.12)#3,801 |
| 35. | 04250 | 6.8% | 2.9%(+3.94)#35 | 4.9%(+1.96)#3,987 |
| 36. | 04344 | 6.8% | 2.9%(+3.92)#36 | 4.9%(+1.94)#4,020 |
| 37. | 04781 | 6.8% | 2.9%(+3.88)#37 | 4.9%(+1.90)#4,070 |
| 38. | 04543 | 6.8% | 2.9%(+3.84)#38 | 4.9%(+1.86)#4,129 |
| 39. | 04350 | 6.7% | 2.9%(+3.77)#39 | 4.9%(+1.79)#4,218 |
| 40. | 04554 | 6.6% | 2.9%(+3.71)#40 | 4.9%(+1.73)#4,304 |
| 41. | 04937 | 6.6% | 2.9%(+3.71)#41 | 4.9%(+1.73)#4,311 |
| 42. | 04259 | 6.4% | 2.9%(+3.47)#42 | 4.9%(+1.49)#4,627 |
| 43. | 04852 | 6.4% | 2.9%(+3.47)#43 | 4.9%(+1.49)#4,643 |
| 44. | 04978 | 6.3% | 2.9%(+3.42)#44 | 4.9%(+1.44)#4,707 |
| 45. | 04551 | 6.3% | 2.9%(+3.35)#45 | 4.9%(+1.37)#4,826 |
| 46. | 04694 | 6.2% | 2.9%(+3.30)#46 | 4.9%(+1.32)#4,920 |
| 47. | 04460 | 6.2% | 2.9%(+3.24)#47 | 4.9%(+1.26)#5,015 |
| 48. | 04280 | 6.1% | 2.9%(+3.18)#48 | 4.9%(+1.20)#5,130 |
| 49. | 04221 | 6.1% | 2.9%(+3.18)#49 | 4.9%(+1.20)#5,134 |
| 50. | 04497 | 6.1% | 2.9%(+3.15)#50 | 4.9%(+1.17)#5,198 |
| 51. | 04364 | 6.0% | 2.9%(+3.10)#51 | 4.9%(+1.12)#5,275 |
| 52. | 04410 | 6.0% | 2.9%(+3.10)#52 | 4.9%(+1.12)#5,282 |
| 53. | 04989 | 6.0% | 2.9%(+3.09)#53 | 4.9%(+1.11)#5,297 |
| 54. | 04411 | 5.8% | 2.9%(+2.93)#54 | 4.9%(+0.945)#5,607 |
| 55. | 04253 | 5.8% | 2.9%(+2.87)#55 | 4.9%(+0.888)#5,706 |
| 56. | 04747 | 5.8% | 2.9%(+2.86)#56 | 4.9%(+0.884)#5,717 |
| 57. | 04967 | 5.7% | 2.9%(+2.77)#57 | 4.9%(+0.788)#5,905 |
| 58. | 04853 | 5.5% | 2.9%(+2.61)#58 | 4.9%(+0.634)#6,249 |
| 59. | 04029 | 5.5% | 2.9%(+2.56)#59 | 4.9%(+0.579)#6,361 |
| 60. | 04609 | 5.5% | 2.9%(+2.54)#60 | 4.9%(+0.564)#6,384 |
| 61. | 04022 | 5.4% | 2.9%(+2.53)#61 | 4.9%(+0.553)#6,406 |
| 62. | 04071 | 5.4% | 2.9%(+2.50)#62 | 4.9%(+0.519)#6,480 |
| 63. | 04851 | 5.4% | 2.9%(+2.49)#63 | 4.9%(+0.511)#6,500 |
| 64. | 04330 | 5.4% | 2.9%(+2.47)#64 | 4.9%(+0.488)#6,550 |
| 65. | 04555 | 5.4% | 2.9%(+2.45)#65 | 4.9%(+0.467)#6,605 |
| 66. | 04424 | 5.4% | 2.9%(+2.44)#66 | 4.9%(+0.463)#6,622 |
| 67. | 04766 | 5.3% | 2.9%(+2.35)#67 | 4.9%(+0.369)#6,858 |
| 68. | 04092 | 5.2% | 2.9%(+2.28)#68 | 4.9%(+0.302)#6,998 |
| 69. | 04107 | 5.0% | 2.9%(+2.12)#69 | 4.9%(+0.137)#7,379 |
| 70. | 04237 | 4.9% | 2.9%(+2.00)#70 | 4.9%(+0.024)#7,645 |
| 71. | 04087 | 4.8% | 2.9%(+1.90)#71 | 4.9%(-0.078)#7,941 |
| 72. | 03908 | 4.8% | 2.9%(+1.89)#72 | 4.9%(-0.090)#7,976 |
| 73. | 04758 | 4.8% | 2.9%(+1.87)#73 | 4.9%(-0.107)#8,024 |
| 74. | 04231 | 4.8% | 2.9%(+1.85)#74 | 4.9%(-0.132)#8,100 |
| 75. | 04038 | 4.7% | 2.9%(+1.81)#75 | 4.9%(-0.166)#8,194 |
| 76. | 04265 | 4.7% | 2.9%(+1.81)#76 | 4.9%(-0.170)#8,203 |
| 77. | 04406 | 4.6% | 2.9%(+1.72)#77 | 4.9%(-0.264)#8,487 |
| 78. | 04640 | 4.6% | 2.9%(+1.70)#78 | 4.9%(-0.281)#8,536 |
| 79. | 04282 | 4.6% | 2.9%(+1.68)#79 | 4.9%(-0.298)#8,579 |
| 80. | 03905 | 4.5% | 2.9%(+1.60)#80 | 4.9%(-0.383)#8,837 |
| 81. | 03903 | 4.5% | 2.9%(+1.58)#81 | 4.9%(-0.404)#8,907 |
| 82. | 04655 | 4.4% | 2.9%(+1.51)#82 | 4.9%(-0.469)#9,110 |
| 83. | 04760 | 4.4% | 2.9%(+1.50)#83 | 4.9%(-0.482)#9,161 |
| 84. | 04571 | 4.4% | 2.9%(+1.45)#84 | 4.9%(-0.532)#9,309 |
| 85. | 04981 | 4.3% | 2.9%(+1.40)#85 | 4.9%(-0.582)#9,502 |
| 86. | 04069 | 4.3% | 2.9%(+1.39)#86 | 4.9%(-0.591)#9,528 |
| 87. | 04923 | 4.3% | 2.9%(+1.39)#87 | 4.9%(-0.593)#9,540 |
| 88. | 04032 | 4.3% | 2.9%(+1.38)#88 | 4.9%(-0.599)#9,550 |
| 89. | 04448 | 4.3% | 2.9%(+1.37)#89 | 4.9%(-0.608)#9,572 |
| 90. | 04468 | 4.3% | 2.9%(+1.36)#90 | 4.9%(-0.617)#9,599 |
| 91. | 04103 | 4.3% | 2.9%(+1.35)#91 | 4.9%(-0.627)#9,631 |
| 92. | 04763 | 4.3% | 2.9%(+1.34)#92 | 4.9%(-0.639)#9,669 |
| 93. | 04443 | 4.2% | 2.9%(+1.33)#93 | 4.9%(-0.646)#9,689 |
| 94. | 04287 | 4.2% | 2.9%(+1.31)#94 | 4.9%(-0.667)#9,743 |
| 95. | 04358 | 4.2% | 2.9%(+1.31)#95 | 4.9%(-0.670)#9,758 |
| 96. | 04079 | 4.2% | 2.9%(+1.25)#96 | 4.9%(-0.733)#9,959 |
| 97. | 04284 | 4.2% | 2.9%(+1.24)#97 | 4.9%(-0.738)#9,972 |
| 98. | 04649 | 4.1% | 2.9%(+1.23)#98 | 4.9%(-0.752)#10,016 |
| 99. | 04046 | 4.1% | 2.9%(+1.22)#99 | 4.9%(-0.760)#10,038 |
| 100. | 04912 | 4.1% | 2.9%(+1.20)#100 | 4.9%(-0.784)#10,112 |
Common Questions
What are the Top 10 Zip Codes with the Highest Percentage of Population with a Degree in Computers and Mathematics in Maine?
Top 10 Zip Codes with the Highest Percentage of Population with a Degree in Computers and Mathematics in Maine are:
What zip code has the Highest Percentage of Population with a Degree in Computers and Mathematics in Maine?
04936 has the Highest Percentage of Population with a Degree in Computers and Mathematics in Maine with 33.3%.
What is the Percentage of Population with a Degree in Computers and Mathematics in the State of Maine?
Percentage of Population with a Degree in Computers and Mathematics in Maine is 2.9%.
What is the Percentage of Population with a Degree in Computers and Mathematics in the United States?
Percentage of Population with a Degree in Computers and Mathematics in the United States is 4.9%.