Zip Codes with the Highest Percentage of Population with a Degree in Computers and Mathematics in Rhode Island

RELATED REPORTS & OPTIONS

Computers and Mathematics
Population
Families and Households
Female Fertility
Female Fertility (Unmarried)
Race (Community Size)
Race (Percentage)
Ancestry (Community Size)
AfghanAfricanAlaska NativeAlaskan AthabascanAlbanianAleutAlsatianAmericanApacheArabArapahoArgentineanArmenianAssyrian / Chaldean / SyriacAustralianAustrianBahamianBangladeshiBarbadianBasqueBelgianBelizeanBermudanBhutaneseBlackfeetBolivianBrazilianBritishBritish West IndianBulgarianBurmeseCajunCambodianCanadianCape VerdeanCarpatho RusynCelticCentral AmericanCentral American IndianCherokeeCheyenneChickasawChileanChineseChippewaChoctawColombianColvilleComancheCosta RicanCreeCreekCroatianCrowCubanCypriotCzechCzechoslovakianDanishDelawareDominicanDutchDutch West IndianEastern EuropeanEcuadorianEgyptianEnglishEstonianEthiopianEuropeanFijianFilipinoFinnishFrenchFrench American IndianFrench CanadianGermanGerman RussianGhanaianGreekGuamanian / ChamorroGuatemalanGuyaneseHaitianHmongHonduranHopiHoumaHungarianIcelanderIndian (Asian)IndonesianInupiatIranianIraqiIrishIroquoisIsraeliItalianJamaicanJapaneseJordanianKenyanKiowaKoreanLaotianLatvianLebaneseLiberianLithuanianLumbeeLuxembourgerMacedonianMalaysianMalteseMarshalleseMenomineeMexicanMexican American IndianMongolianMoroccanNative HawaiianNavajoNepaleseNew ZealanderNicaraguanNigerianNorthern EuropeanNorwegianOkinawanOsageOttawaPaiutePakistaniPalestinianPanamanianParaguayanPennsylvania GermanPeruvianPimaPolishPortuguesePotawatomiPuebloPuerto RicanPuget Sound SalishRomanianRussianSalvadoranSamoanScandinavianScotch-IrishScottishSeminoleSenegaleseSerbianShoshoneSierra LeoneanSiouxSlavicSlovakSloveneSomaliSouth AfricanSouth AmericanSouth American IndianSoviet UnionSpaniardSpanishSpanish AmericanSpanish American IndianSri LankanSubsaharan AfricanSudaneseSwedishSwissSyrianTaiwaneseThaiTlingit-HaidaTohono O'OdhamTonganTrinidadian and TobagonianTsimshianTurkishU.S. Virgin IslanderUgandanUkrainianUruguayanUteVenezuelanVietnameseWelshWest IndianYakamaYaquiYugoslavianYumanYup'ikZimbabwean
Ancestry (Percentage)
AfghanAfricanAlaska NativeAlaskan AthabascanAlbanianAleutAlsatianAmericanApacheArabArapahoArgentineanArmenianAssyrian / Chaldean / SyriacAustralianAustrianBahamianBangladeshiBarbadianBasqueBelgianBelizeanBermudanBhutaneseBlackfeetBolivianBrazilianBritishBritish West IndianBulgarianBurmeseCajunCambodianCanadianCape VerdeanCarpatho RusynCelticCentral AmericanCentral American IndianCherokeeCheyenneChickasawChileanChineseChippewaChoctawColombianColvilleComancheCosta RicanCreeCreekCroatianCrowCubanCypriotCzechCzechoslovakianDanishDelawareDominicanDutchDutch West IndianEastern EuropeanEcuadorianEgyptianEnglishEstonianEthiopianEuropeanFijianFilipinoFinnishFrenchFrench American IndianFrench CanadianGermanGerman RussianGhanaianGreekGuamanian / ChamorroGuatemalanGuyaneseHaitianHmongHonduranHopiHoumaHungarianIcelanderIndian (Asian)IndonesianInupiatIranianIraqiIrishIroquoisIsraeliItalianJamaicanJapaneseJordanianKenyanKiowaKoreanLaotianLatvianLebaneseLiberianLithuanianLumbeeLuxembourgerMacedonianMalaysianMalteseMarshalleseMenomineeMexicanMexican American IndianMongolianMoroccanNative HawaiianNavajoNepaleseNew ZealanderNicaraguanNigerianNorthern EuropeanNorwegianOkinawanOsageOttawaPaiutePakistaniPalestinianPanamanianParaguayanPennsylvania GermanPeruvianPimaPolishPortuguesePotawatomiPuebloPuerto RicanPuget Sound SalishRomanianRussianSalvadoranSamoanScandinavianScotch-IrishScottishSeminoleSenegaleseSerbianShoshoneSierra LeoneanSiouxSlavicSlovakSloveneSomaliSouth AfricanSouth AmericanSouth American IndianSoviet UnionSpaniardSpanishSpanish AmericanSpanish American IndianSri LankanSubsaharan AfricanSudaneseSwedishSwissSyrianTaiwaneseThaiTlingit-HaidaTohono O'OdhamTonganTrinidadian and TobagonianTsimshianTurkishU.S. Virgin IslanderUgandanUkrainianUruguayanUteVenezuelanVietnameseWelshWest IndianYakamaYaquiYugoslavianYumanYup'ikZimbabwean
Immigrant Origin (Total)
AfghanistanAfricaAlbaniaArgentinaArmeniaAsiaAustraliaAustriaAzoresBahamasBangladeshBarbadosBelarusBelgiumBelizeBoliviaBosnia and HerzegovinaBrazilBulgariaBurma / MyanmarCabo VerdeCambodiaCameroonCanadaCaribbeanCentral AmericaChileChinaColombiaCongoCosta RicaCroatiaCubaCzechoslovakiaDenmarkDominicaDominican RepublicEastern AfricaEastern AsiaEastern EuropeEcuadorEgyptEl SalvadorEnglandEritreaEthiopiaEuropeFijiFranceGermanyGhanaGreeceGrenadaGuatemalaGuyanaHaitiHondurasHong KongHungaryIndiaIndonesiaIranIraqIrelandIsraelItalyJamaicaJapanJordanKazakhstanKenyaKoreaKuwaitLaosLatin AmericaLatviaLebanonLiberiaLithuaniaMalaysiaMexicoMicronesiaMiddle AfricaMoldovaMoroccoNepalNetherlandsNicaraguaNigeriaNorth MacedoniaNorthern AfricaNorthern EuropeNorwayOceaniaPakistanPanamaPeruPhilippinesPolandPortugalRomaniaRussiaSaudi ArabiaScotlandSenegalSerbiaSierra LeoneSingaporeSomaliaSouth AfricaSouth AmericaSouth Central AsiaSouth Eastern AsiaSouthern EuropeSpainSri LankaSt. Vincent and the GrenadinesSudanSwedenSwitzerlandSyriaTaiwanThailandTrinidad and TobagoTurkeyUgandaUkraineUruguayUzbekistanVenezuelaVietnamWest IndiesWestern AfricaWestern AsiaWestern EuropeYemenZaireZimbabwe
Immigrant Origin (Percentage)
AfghanistanAfricaAlbaniaArgentinaArmeniaAsiaAustraliaAustriaAzoresBahamasBangladeshBarbadosBelarusBelgiumBelizeBoliviaBosnia and HerzegovinaBrazilBulgariaBurma / MyanmarCabo VerdeCambodiaCameroonCanadaCaribbeanCentral AmericaChileChinaColombiaCongoCosta RicaCroatiaCubaCzechoslovakiaDenmarkDominicaDominican RepublicEastern AfricaEastern AsiaEastern EuropeEcuadorEgyptEl SalvadorEnglandEritreaEthiopiaEuropeFijiFranceGermanyGhanaGreeceGrenadaGuatemalaGuyanaHaitiHondurasHong KongHungaryIndiaIndonesiaIranIraqIrelandIsraelItalyJamaicaJapanJordanKazakhstanKenyaKoreaKuwaitLaosLatin AmericaLatviaLebanonLiberiaLithuaniaMalaysiaMexicoMicronesiaMiddle AfricaMoldovaMoroccoNepalNetherlandsNicaraguaNigeriaNorth MacedoniaNorthern AfricaNorthern EuropeNorwayOceaniaPakistanPanamaPeruPhilippinesPolandPortugalRomaniaRussiaSaudi ArabiaScotlandSenegalSerbiaSierra LeoneSingaporeSomaliaSouth AfricaSouth AmericaSouth Central AsiaSouth Eastern AsiaSouthern EuropeSpainSri LankaSt. Vincent and the GrenadinesSudanSwedenSwitzerlandSyriaTaiwanThailandTrinidad and TobagoTurkeyUgandaUkraineUruguayUzbekistanVenezuelaVietnamWest IndiesWestern AfricaWestern AsiaWestern EuropeYemenZaireZimbabwe
Income
Income (Families)
Income (Households)
Poverty
Poverty (Families)
Unemployment
Employment Occupations
Employment Industries
Employer Class
Commute Time
Commute Means
School Enrollment
Education by Degree Field
Occupancy
Finances
Physical Characteristics
Rhode Island
Compare Zip Codes
Comparison Subject

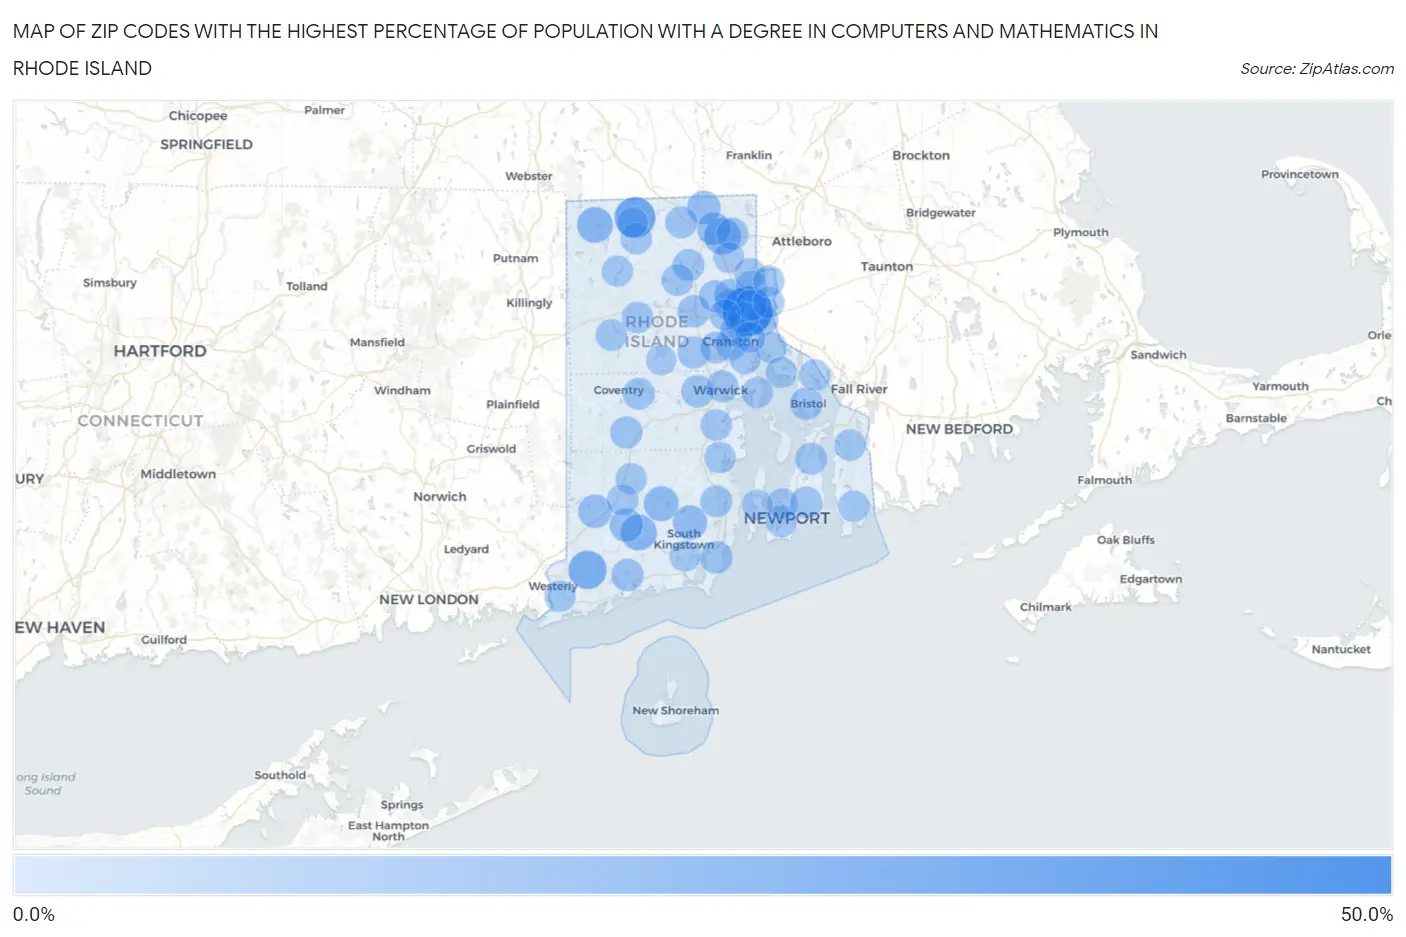
Map of Zip Codes with the Highest Percentage of Population with a Degree in Computers and Mathematics in Rhode Island

0.0%
50.0%
Zip Codes with the Highest Percentage of Population with a Degree in Computers and Mathematics in Rhode Island Map

Zip Codes with the Highest Percentage of Population with a Degree in Computers and Mathematics in Rhode Island

Zip Code % Graduates vs State vs National
1.0291250.0%3.9%(+46.1)#14.9%(+45.1)#75
2.0282626.9%3.9%(+23.1)#24.9%(+22.0)#269
3.0280820.4%3.9%(+16.5)#34.9%(+15.5)#448
4.0280216.3%3.9%(+12.5)#44.9%(+11.4)#675
5.0287514.4%3.9%(+10.6)#54.9%(+9.54)#850
6.0285914.2%3.9%(+10.4)#64.9%(+9.35)#887
7.0289211.8%3.9%(+7.95)#74.9%(+6.92)#1,253
8.0288110.4%3.9%(+6.58)#84.9%(+5.55)#1,603
9.028328.6%3.9%(+4.77)#94.9%(+3.74)#2,458
10.028958.3%3.9%(+4.42)#104.9%(+3.39)#2,686
11.028128.2%3.9%(+4.37)#114.9%(+3.34)#2,727
12.028387.6%3.9%(+3.77)#124.9%(+2.74)#3,215
13.028936.0%3.9%(+2.10)#134.9%(+1.07)#5,354
14.028826.0%3.9%(+2.10)#144.9%(+1.07)#5,357
15.028095.9%3.9%(+2.01)#154.9%(+0.976)#5,548
16.028135.7%3.9%(+1.84)#164.9%(+0.807)#5,871
17.029195.7%3.9%(+1.80)#174.9%(+0.773)#5,946
18.029215.5%3.9%(+1.61)#184.9%(+0.576)#6,368
19.028175.3%3.9%(+1.40)#194.9%(+0.372)#6,837
20.029105.3%3.9%(+1.39)#204.9%(+0.360)#6,874
21.029075.2%3.9%(+1.30)#214.9%(+0.273)#7,054
22.029114.7%3.9%(+0.807)#224.9%(-0.224)#8,365
23.028424.6%3.9%(+0.698)#234.9%(-0.333)#8,671
24.029174.5%3.9%(+0.668)#244.9%(-0.363)#8,775
25.028964.5%3.9%(+0.649)#254.9%(-0.382)#8,835
26.028744.5%3.9%(+0.640)#264.9%(-0.391)#8,866
27.029084.4%3.9%(+0.572)#274.9%(-0.459)#9,076
28.028714.4%3.9%(+0.569)#284.9%(-0.462)#9,086
29.029204.3%3.9%(+0.432)#294.9%(-0.599)#9,551
30.028644.3%3.9%(+0.414)#304.9%(-0.616)#9,598
31.028864.3%3.9%(+0.412)#314.9%(-0.618)#9,604
32.029044.1%3.9%(+0.267)#324.9%(-0.764)#10,054
33.028164.1%3.9%(+0.252)#334.9%(-0.779)#10,091
34.028284.1%3.9%(+0.231)#344.9%(-0.800)#10,155
35.028253.6%3.9%(-0.226)#354.9%(-1.26)#11,748
36.028373.6%3.9%(-0.281)#364.9%(-1.31)#11,960
37.028183.4%3.9%(-0.414)#374.9%(-1.44)#12,477
38.028603.3%3.9%(-0.611)#384.9%(-1.64)#13,181
39.028393.2%3.9%(-0.629)#394.9%(-1.66)#13,246
40.028523.2%3.9%(-0.651)#404.9%(-1.68)#13,337
41.028573.1%3.9%(-0.744)#414.9%(-1.77)#13,663
42.028783.1%3.9%(-0.745)#424.9%(-1.78)#13,667
43.029143.1%3.9%(-0.799)#434.9%(-1.83)#13,858
44.028913.0%3.9%(-0.834)#444.9%(-1.87)#14,004
45.029032.9%3.9%(-1.01)#454.9%(-2.04)#14,601
46.029062.8%3.9%(-1.02)#464.9%(-2.05)#14,630
47.029162.8%3.9%(-1.03)#474.9%(-2.06)#14,693
48.028222.8%3.9%(-1.05)#484.9%(-2.08)#14,723
49.028852.8%3.9%(-1.05)#494.9%(-2.08)#14,747
50.028632.7%3.9%(-1.19)#504.9%(-2.22)#15,265
51.028982.7%3.9%(-1.19)#514.9%(-2.22)#15,274
52.028142.6%3.9%(-1.23)#524.9%(-2.26)#15,400
53.028612.6%3.9%(-1.29)#534.9%(-2.32)#15,629
54.029152.4%3.9%(-1.46)#544.9%(-2.49)#16,267
55.028402.4%3.9%(-1.49)#554.9%(-2.53)#16,372
56.028062.4%3.9%(-1.51)#564.9%(-2.54)#16,419
57.028882.3%3.9%(-1.53)#574.9%(-2.57)#16,494
58.029092.2%3.9%(-1.63)#584.9%(-2.66)#16,824
59.028892.1%3.9%(-1.72)#594.9%(-2.75)#17,148
60.028411.7%3.9%(-2.20)#604.9%(-3.23)#18,645
61.028791.6%3.9%(-2.22)#614.9%(-3.25)#18,713
62.028351.4%3.9%(-2.44)#624.9%(-3.47)#19,338
63.028651.2%3.9%(-2.62)#634.9%(-3.65)#19,878
64.028301.2%3.9%(-2.70)#644.9%(-3.73)#20,092
65.029050.95%3.9%(-2.91)#654.9%(-3.94)#20,613
66.028310.63%3.9%(-3.23)#664.9%(-4.26)#21,253

Common Questions

What are the Top 10 Zip Codes with the Highest Percentage of Population with a Degree in Computers and Mathematics in Rhode Island?
Top 10 Zip Codes with the Highest Percentage of Population with a Degree in Computers and Mathematics in Rhode Island are:
#1
50.0%
#2
26.9%
#3
20.4%
#4
16.3%
#5
14.4%
#6
14.2%
#7
11.8%
#8
10.4%
#9
8.6%
#10
8.3%
What zip code has the Highest Percentage of Population with a Degree in Computers and Mathematics in Rhode Island?
02912 has the Highest Percentage of Population with a Degree in Computers and Mathematics in Rhode Island with 50.0%.
What is the Percentage of Population with a Degree in Computers and Mathematics in the State of Rhode Island?
Percentage of Population with a Degree in Computers and Mathematics in Rhode Island is 3.9%.
What is the Percentage of Population with a Degree in Computers and Mathematics in the United States?
Percentage of Population with a Degree in Computers and Mathematics in the United States is 4.9%.