Zip Codes with the Highest Percentage of Population with a Degree in Computers and Mathematics in Oklahoma
RELATED REPORTS & OPTIONS
Computers and Mathematics
Oklahoma
Compare Zip Codes
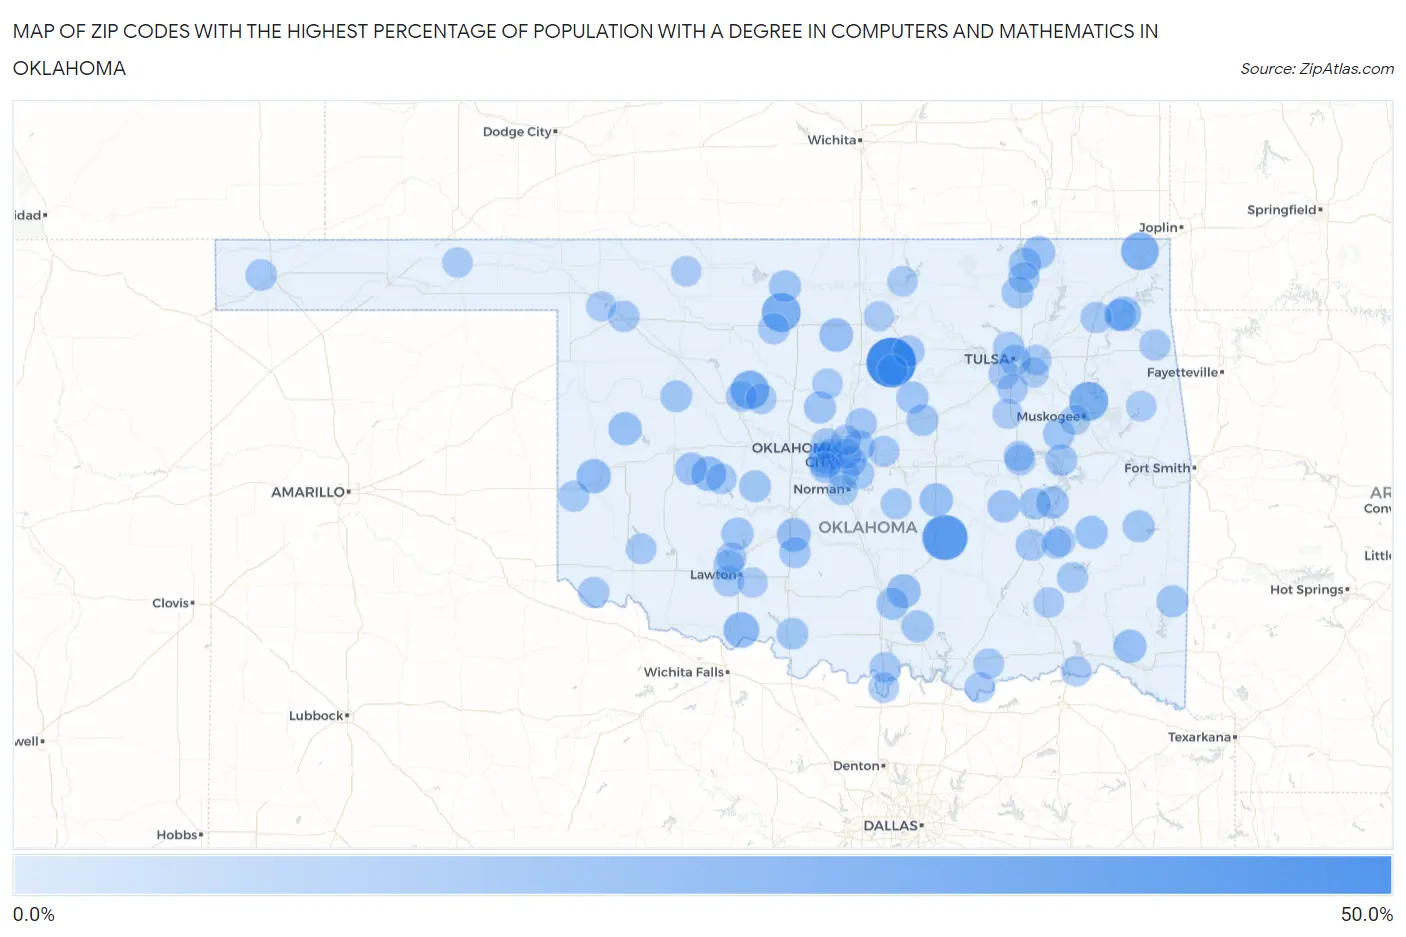
Map of Zip Codes with the Highest Percentage of Population with a Degree in Computers and Mathematics in Oklahoma
0.0%
50.0%
Zip Codes with the Highest Percentage of Population with a Degree in Computers and Mathematics in Oklahoma
| Zip Code | % Graduates | vs State | vs National | |
| 1. | 74077 | 50.0% | 3.4%(+46.6)#1 | 4.9%(+45.1)#77 |
| 2. | 74844 | 39.5% | 3.4%(+36.1)#2 | 4.9%(+34.6)#139 |
| 3. | 74446 | 25.0% | 3.4%(+21.6)#3 | 4.9%(+20.1)#300 |
| 4. | 73727 | 25.0% | 3.4%(+21.6)#4 | 4.9%(+20.1)#305 |
| 5. | 73744 | 23.8% | 3.4%(+20.4)#5 | 4.9%(+18.9)#339 |
| 6. | 74358 | 22.2% | 3.4%(+18.8)#6 | 4.9%(+17.3)#386 |
| 7. | 73562 | 17.5% | 3.4%(+14.1)#7 | 4.9%(+12.6)#586 |
| 8. | 74340 | 15.0% | 3.4%(+11.6)#8 | 4.9%(+10.1)#791 |
| 9. | 73021 | 14.9% | 3.4%(+11.5)#9 | 4.9%(+10.0)#795 |
| 10. | 73662 | 14.5% | 3.4%(+11.1)#10 | 4.9%(+9.61)#843 |
| 11. | 73086 | 13.5% | 3.4%(+10.0)#11 | 4.9%(+8.59)#983 |
| 12. | 73730 | 12.9% | 3.4%(+9.46)#12 | 4.9%(+8.01)#1,066 |
| 13. | 73067 | 12.9% | 3.4%(+9.41)#13 | 4.9%(+7.96)#1,070 |
| 14. | 73179 | 12.6% | 3.4%(+9.18)#14 | 4.9%(+7.73)#1,106 |
| 15. | 74830 | 12.5% | 3.4%(+9.05)#15 | 4.9%(+7.61)#1,143 |
| 16. | 73650 | 12.1% | 3.4%(+8.65)#16 | 4.9%(+7.20)#1,200 |
| 17. | 74766 | 11.9% | 3.4%(+8.49)#17 | 4.9%(+7.05)#1,223 |
| 18. | 74578 | 11.2% | 3.4%(+7.79)#18 | 4.9%(+6.34)#1,395 |
| 19. | 74083 | 10.9% | 3.4%(+7.46)#19 | 4.9%(+6.02)#1,477 |
| 20. | 74029 | 10.9% | 3.4%(+7.41)#20 | 4.9%(+5.96)#1,494 |
| 21. | 73128 | 10.6% | 3.4%(+7.14)#21 | 4.9%(+5.70)#1,558 |
| 22. | 73024 | 10.5% | 3.4%(+7.03)#22 | 4.9%(+5.58)#1,592 |
| 23. | 74430 | 10.3% | 3.4%(+6.88)#23 | 4.9%(+5.43)#1,644 |
| 24. | 74850 | 10.0% | 3.4%(+6.55)#24 | 4.9%(+5.11)#1,759 |
| 25. | 73006 | 9.7% | 3.4%(+6.28)#25 | 4.9%(+4.83)#1,872 |
| 26. | 73761 | 9.3% | 3.4%(+5.81)#26 | 4.9%(+4.37)#2,091 |
| 27. | 73016 | 9.3% | 3.4%(+5.81)#27 | 4.9%(+4.36)#2,094 |
| 28. | 74824 | 9.2% | 3.4%(+5.74)#28 | 4.9%(+4.29)#2,124 |
| 29. | 73447 | 9.1% | 3.4%(+5.64)#29 | 4.9%(+4.20)#2,188 |
| 30. | 74963 | 9.1% | 3.4%(+5.64)#30 | 4.9%(+4.20)#2,194 |
| 31. | 73032 | 9.1% | 3.4%(+5.64)#31 | 4.9%(+4.20)#2,202 |
| 32. | 74935 | 9.1% | 3.4%(+5.64)#32 | 4.9%(+4.20)#2,203 |
| 33. | 74350 | 9.0% | 3.4%(+5.54)#33 | 4.9%(+4.09)#2,262 |
| 34. | 74051 | 8.8% | 3.4%(+5.40)#34 | 4.9%(+3.95)#2,340 |
| 35. | 73042 | 8.8% | 3.4%(+5.38)#35 | 4.9%(+3.93)#2,355 |
| 36. | 74026 | 8.8% | 3.4%(+5.33)#36 | 4.9%(+3.88)#2,388 |
| 37. | 73659 | 8.6% | 3.4%(+5.17)#37 | 4.9%(+3.73)#2,463 |
| 38. | 73084 | 8.5% | 3.4%(+5.09)#38 | 4.9%(+3.64)#2,521 |
| 39. | 74442 | 8.5% | 3.4%(+5.03)#39 | 4.9%(+3.58)#2,556 |
| 40. | 74468 | 8.3% | 3.4%(+4.89)#40 | 4.9%(+3.44)#2,641 |
| 41. | 74426 | 8.3% | 3.4%(+4.87)#41 | 4.9%(+3.43)#2,656 |
| 42. | 73573 | 8.3% | 3.4%(+4.84)#42 | 4.9%(+3.39)#2,683 |
| 43. | 74032 | 8.1% | 3.4%(+4.65)#43 | 4.9%(+3.20)#2,825 |
| 44. | 74330 | 8.0% | 3.4%(+4.59)#44 | 4.9%(+3.14)#2,871 |
| 45. | 73933 | 8.0% | 3.4%(+4.57)#45 | 4.9%(+3.13)#2,881 |
| 46. | 74565 | 7.9% | 3.4%(+4.49)#46 | 4.9%(+3.04)#2,953 |
| 47. | 73801 | 7.9% | 3.4%(+4.45)#47 | 4.9%(+3.00)#2,983 |
| 48. | 74126 | 7.9% | 3.4%(+4.41)#48 | 4.9%(+2.96)#3,020 |
| 49. | 74006 | 7.5% | 3.4%(+4.07)#49 | 4.9%(+2.63)#3,317 |
| 50. | 73007 | 7.4% | 3.4%(+4.00)#50 | 4.9%(+2.55)#3,391 |
| 51. | 73754 | 7.4% | 3.4%(+3.94)#51 | 4.9%(+2.49)#3,452 |
| 52. | 73082 | 7.3% | 3.4%(+3.88)#52 | 4.9%(+2.43)#3,492 |
| 53. | 73537 | 7.2% | 3.4%(+3.80)#53 | 4.9%(+2.35)#3,575 |
| 54. | 74338 | 7.2% | 3.4%(+3.79)#54 | 4.9%(+2.35)#3,581 |
| 55. | 73645 | 7.1% | 3.4%(+3.64)#55 | 4.9%(+2.19)#3,740 |
| 56. | 73107 | 7.0% | 3.4%(+3.60)#56 | 4.9%(+2.15)#3,776 |
| 57. | 73165 | 7.0% | 3.4%(+3.59)#57 | 4.9%(+2.15)#3,780 |
| 58. | 74120 | 7.0% | 3.4%(+3.58)#58 | 4.9%(+2.13)#3,789 |
| 59. | 73505 | 6.9% | 3.4%(+3.47)#59 | 4.9%(+2.02)#3,928 |
| 60. | 74852 | 6.8% | 3.4%(+3.39)#60 | 4.9%(+1.94)#4,009 |
| 61. | 74536 | 6.8% | 3.4%(+3.36)#61 | 4.9%(+1.91)#4,064 |
| 62. | 73448 | 6.6% | 3.4%(+3.11)#62 | 4.9%(+1.66)#4,376 |
| 63. | 73132 | 6.5% | 3.4%(+3.08)#63 | 4.9%(+1.63)#4,421 |
| 64. | 73503 | 6.5% | 3.4%(+3.07)#64 | 4.9%(+1.63)#4,425 |
| 65. | 73160 | 6.5% | 3.4%(+3.07)#65 | 4.9%(+1.63)#4,440 |
| 66. | 73045 | 6.5% | 3.4%(+3.05)#66 | 4.9%(+1.60)#4,481 |
| 67. | 73772 | 6.5% | 3.4%(+3.05)#67 | 4.9%(+1.60)#4,482 |
| 68. | 73033 | 6.5% | 3.4%(+3.00)#68 | 4.9%(+1.56)#4,525 |
| 69. | 73526 | 6.4% | 3.4%(+2.97)#69 | 4.9%(+1.52)#4,580 |
| 70. | 73459 | 6.4% | 3.4%(+2.96)#70 | 4.9%(+1.52)#4,588 |
| 71. | 73145 | 6.4% | 3.4%(+2.92)#71 | 4.9%(+1.48)#4,661 |
| 72. | 74741 | 6.4% | 3.4%(+2.91)#72 | 4.9%(+1.46)#4,679 |
| 73. | 73764 | 6.2% | 3.4%(+2.80)#73 | 4.9%(+1.36)#4,863 |
| 74. | 74437 | 6.2% | 3.4%(+2.73)#74 | 4.9%(+1.29)#4,977 |
| 75. | 73028 | 6.1% | 3.4%(+2.69)#75 | 4.9%(+1.24)#5,055 |
| 76. | 73117 | 6.0% | 3.4%(+2.59)#76 | 4.9%(+1.14)#5,232 |
| 77. | 74131 | 6.0% | 3.4%(+2.55)#77 | 4.9%(+1.11)#5,298 |
| 78. | 73131 | 6.0% | 3.4%(+2.53)#78 | 4.9%(+1.08)#5,344 |
| 79. | 73169 | 5.9% | 3.4%(+2.50)#79 | 4.9%(+1.05)#5,390 |
| 80. | 74033 | 5.9% | 3.4%(+2.46)#80 | 4.9%(+1.01)#5,464 |
| 81. | 73507 | 5.9% | 3.4%(+2.44)#81 | 4.9%(+0.996)#5,507 |
| 82. | 74557 | 5.9% | 3.4%(+2.44)#82 | 4.9%(+0.988)#5,528 |
| 83. | 74738 | 5.9% | 3.4%(+2.44)#83 | 4.9%(+0.988)#5,532 |
| 84. | 74546 | 5.8% | 3.4%(+2.32)#84 | 4.9%(+0.875)#5,737 |
| 85. | 74726 | 5.8% | 3.4%(+2.31)#85 | 4.9%(+0.865)#5,757 |
| 86. | 73950 | 5.7% | 3.4%(+2.27)#86 | 4.9%(+0.820)#5,843 |
| 87. | 74108 | 5.6% | 3.4%(+2.16)#87 | 4.9%(+0.709)#6,061 |
| 88. | 74471 | 5.6% | 3.4%(+2.11)#88 | 4.9%(+0.662)#6,181 |
| 89. | 74431 | 5.6% | 3.4%(+2.11)#89 | 4.9%(+0.662)#6,186 |
| 90. | 74012 | 5.5% | 3.4%(+2.03)#90 | 4.9%(+0.587)#6,346 |
| 91. | 73072 | 5.4% | 3.4%(+1.98)#91 | 4.9%(+0.536)#6,444 |
| 92. | 73501 | 5.4% | 3.4%(+1.93)#92 | 4.9%(+0.481)#6,566 |
| 93. | 74604 | 5.4% | 3.4%(+1.92)#93 | 4.9%(+0.474)#6,587 |
| 94. | 74074 | 5.3% | 3.4%(+1.90)#94 | 4.9%(+0.449)#6,657 |
| 95. | 73717 | 5.3% | 3.4%(+1.82)#95 | 4.9%(+0.372)#6,835 |
| 96. | 74547 | 5.2% | 3.4%(+1.71)#96 | 4.9%(+0.264)#7,074 |
| 97. | 74651 | 5.1% | 3.4%(+1.66)#97 | 4.9%(+0.208)#7,204 |
| 98. | 74401 | 5.1% | 3.4%(+1.63)#98 | 4.9%(+0.184)#7,261 |
| 99. | 74421 | 5.1% | 3.4%(+1.62)#99 | 4.9%(+0.177)#7,276 |
| 100. | 73841 | 5.1% | 3.4%(+1.60)#100 | 4.9%(+0.157)#7,330 |
Common Questions
What are the Top 10 Zip Codes with the Highest Percentage of Population with a Degree in Computers and Mathematics in Oklahoma?
Top 10 Zip Codes with the Highest Percentage of Population with a Degree in Computers and Mathematics in Oklahoma are:
What zip code has the Highest Percentage of Population with a Degree in Computers and Mathematics in Oklahoma?
74077 has the Highest Percentage of Population with a Degree in Computers and Mathematics in Oklahoma with 50.0%.
What is the Percentage of Population with a Degree in Computers and Mathematics in the State of Oklahoma?
Percentage of Population with a Degree in Computers and Mathematics in Oklahoma is 3.4%.
What is the Percentage of Population with a Degree in Computers and Mathematics in the United States?
Percentage of Population with a Degree in Computers and Mathematics in the United States is 4.9%.