Zip Codes with the Highest Percentage of Population with a Degree in Computers and Mathematics in Illinois
RELATED REPORTS & OPTIONS
Computers and Mathematics
Illinois
Compare Zip Codes
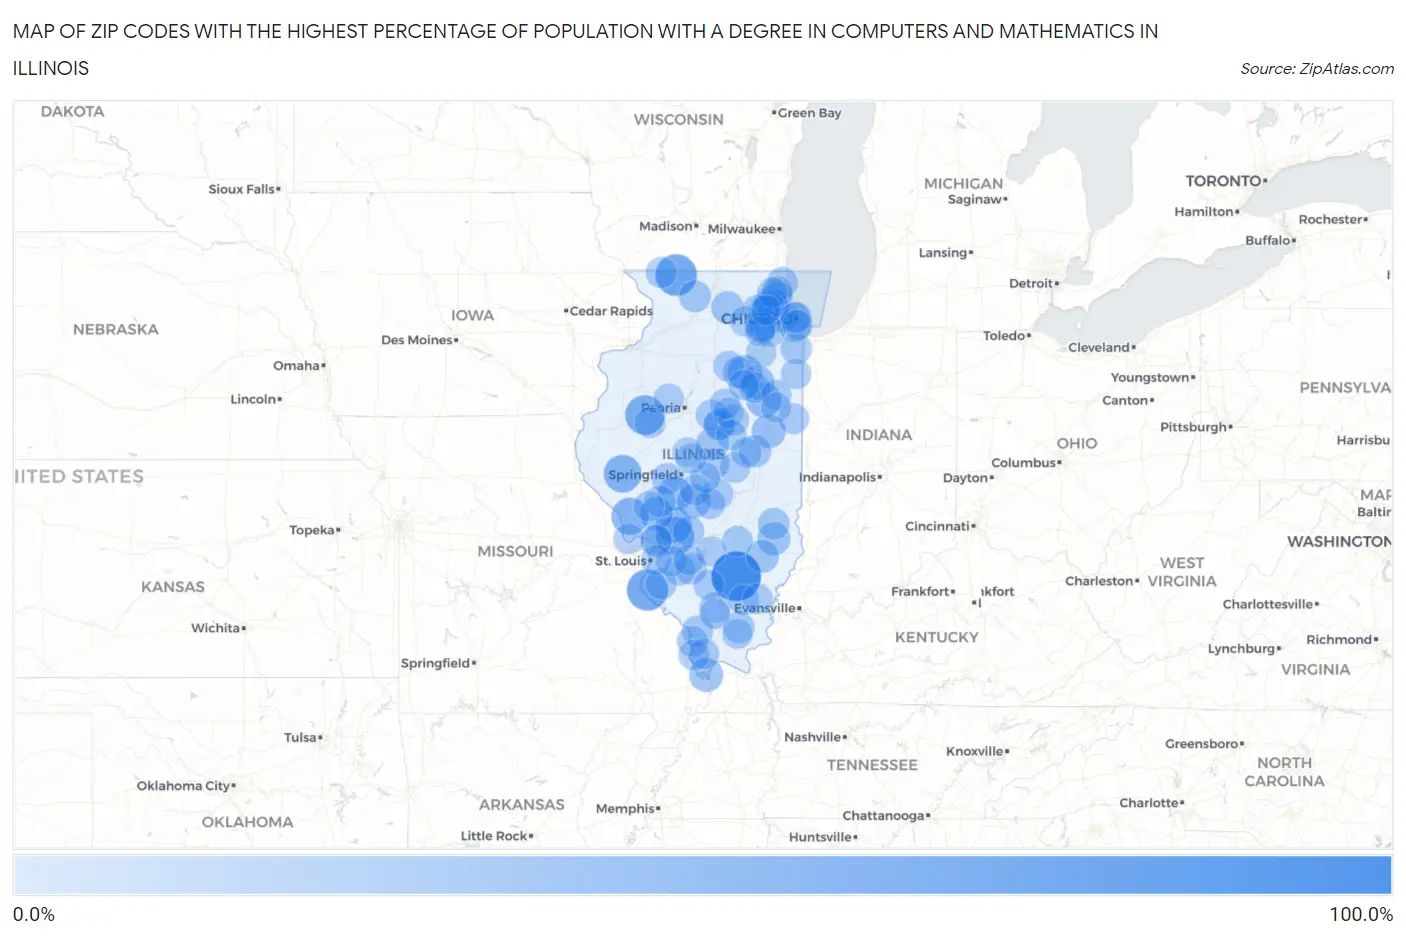
Map of Zip Codes with the Highest Percentage of Population with a Degree in Computers and Mathematics in Illinois
0.0%
100.0%
Zip Codes with the Highest Percentage of Population with a Degree in Computers and Mathematics in Illinois
| Zip Code | % Graduates | vs State | vs National | |
| 1. | 62851 | 82.4% | 5.1%(+77.3)#1 | 4.9%(+77.5)#26 |
| 2. | 61050 | 51.0% | 5.1%(+45.9)#2 | 4.9%(+46.1)#73 |
| 3. | 62256 | 50.0% | 5.1%(+44.9)#3 | 4.9%(+45.1)#89 |
| 4. | 61431 | 43.8% | 5.1%(+38.7)#4 | 4.9%(+38.9)#113 |
| 5. | 62058 | 38.8% | 5.1%(+33.7)#5 | 4.9%(+33.9)#144 |
| 6. | 62323 | 36.1% | 5.1%(+31.1)#6 | 4.9%(+31.2)#158 |
| 7. | 62027 | 34.4% | 5.1%(+29.3)#7 | 4.9%(+29.5)#174 |
| 8. | 62023 | 29.4% | 5.1%(+24.4)#8 | 4.9%(+24.5)#236 |
| 9. | 60959 | 26.0% | 5.1%(+20.9)#9 | 4.9%(+21.1)#285 |
| 10. | 60437 | 25.0% | 5.1%(+19.9)#10 | 4.9%(+20.1)#307 |
| 11. | 62689 | 24.1% | 5.1%(+19.1)#11 | 4.9%(+19.2)#323 |
| 12. | 62914 | 22.1% | 5.1%(+17.0)#12 | 4.9%(+17.2)#390 |
| 13. | 60920 | 21.7% | 5.1%(+16.7)#13 | 4.9%(+16.8)#402 |
| 14. | 60949 | 21.6% | 5.1%(+16.6)#14 | 4.9%(+16.7)#407 |
| 15. | 62546 | 21.6% | 5.1%(+16.5)#15 | 4.9%(+16.7)#408 |
| 16. | 62630 | 20.0% | 5.1%(+14.9)#16 | 4.9%(+15.1)#463 |
| 17. | 62459 | 18.4% | 5.1%(+13.4)#17 | 4.9%(+13.5)#542 |
| 18. | 62868 | 17.9% | 5.1%(+12.8)#18 | 4.9%(+13.0)#567 |
| 19. | 61778 | 17.5% | 5.1%(+12.4)#19 | 4.9%(+12.6)#590 |
| 20. | 60111 | 17.2% | 5.1%(+12.2)#20 | 4.9%(+12.3)#614 |
| 21. | 61815 | 16.7% | 5.1%(+11.6)#21 | 4.9%(+11.8)#651 |
| 22. | 60195 | 16.7% | 5.1%(+11.6)#22 | 4.9%(+11.8)#656 |
| 23. | 61047 | 15.4% | 5.1%(+10.3)#23 | 4.9%(+10.5)#760 |
| 24. | 60470 | 14.3% | 5.1%(+9.23)#24 | 4.9%(+9.39)#872 |
| 25. | 62481 | 14.3% | 5.1%(+9.23)#25 | 4.9%(+9.39)#875 |
| 26. | 60621 | 13.2% | 5.1%(+8.13)#26 | 4.9%(+8.29)#1,023 |
| 27. | 62917 | 13.1% | 5.1%(+8.03)#27 | 4.9%(+8.19)#1,041 |
| 28. | 62510 | 12.7% | 5.1%(+7.64)#28 | 4.9%(+7.80)#1,092 |
| 29. | 62670 | 12.7% | 5.1%(+7.64)#29 | 4.9%(+7.80)#1,094 |
| 30. | 60173 | 12.6% | 5.1%(+7.57)#30 | 4.9%(+7.74)#1,104 |
| 31. | 61704 | 12.5% | 5.1%(+7.46)#31 | 4.9%(+7.62)#1,125 |
| 32. | 62975 | 12.5% | 5.1%(+7.44)#32 | 4.9%(+7.61)#1,144 |
| 33. | 60475 | 12.4% | 5.1%(+7.35)#33 | 4.9%(+7.51)#1,151 |
| 34. | 60165 | 12.4% | 5.1%(+7.31)#34 | 4.9%(+7.48)#1,153 |
| 35. | 62024 | 12.2% | 5.1%(+7.14)#35 | 4.9%(+7.31)#1,183 |
| 36. | 62674 | 12.2% | 5.1%(+7.14)#36 | 4.9%(+7.30)#1,184 |
| 37. | 62218 | 12.0% | 5.1%(+6.97)#37 | 4.9%(+7.13)#1,210 |
| 38. | 62265 | 12.0% | 5.1%(+6.95)#38 | 4.9%(+7.12)#1,213 |
| 39. | 62573 | 11.8% | 5.1%(+6.77)#39 | 4.9%(+6.93)#1,250 |
| 40. | 62077 | 11.8% | 5.1%(+6.71)#40 | 4.9%(+6.87)#1,270 |
| 41. | 62998 | 11.7% | 5.1%(+6.61)#41 | 4.9%(+6.77)#1,291 |
| 42. | 60143 | 11.6% | 5.1%(+6.52)#42 | 4.9%(+6.68)#1,315 |
| 43. | 62018 | 11.4% | 5.1%(+6.37)#43 | 4.9%(+6.53)#1,340 |
| 44. | 60563 | 11.3% | 5.1%(+6.25)#44 | 4.9%(+6.41)#1,377 |
| 45. | 60085 | 11.3% | 5.1%(+6.24)#45 | 4.9%(+6.40)#1,380 |
| 46. | 60089 | 11.3% | 5.1%(+6.24)#46 | 4.9%(+6.40)#1,381 |
| 47. | 62426 | 11.1% | 5.1%(+6.05)#47 | 4.9%(+6.22)#1,424 |
| 48. | 60934 | 11.1% | 5.1%(+6.05)#48 | 4.9%(+6.22)#1,431 |
| 49. | 60601 | 11.0% | 5.1%(+5.99)#49 | 4.9%(+6.15)#1,442 |
| 50. | 61725 | 11.0% | 5.1%(+5.96)#50 | 4.9%(+6.12)#1,451 |
| 51. | 61087 | 10.9% | 5.1%(+5.85)#51 | 4.9%(+6.02)#1,476 |
| 52. | 61705 | 10.9% | 5.1%(+5.83)#52 | 4.9%(+5.99)#1,486 |
| 53. | 62248 | 10.8% | 5.1%(+5.71)#53 | 4.9%(+5.88)#1,509 |
| 54. | 62540 | 10.7% | 5.1%(+5.61)#54 | 4.9%(+5.77)#1,534 |
| 55. | 61325 | 10.6% | 5.1%(+5.50)#55 | 4.9%(+5.66)#1,566 |
| 56. | 61818 | 10.5% | 5.1%(+5.47)#56 | 4.9%(+5.63)#1,576 |
| 57. | 62822 | 10.5% | 5.1%(+5.45)#57 | 4.9%(+5.61)#1,585 |
| 58. | 62808 | 10.4% | 5.1%(+5.34)#58 | 4.9%(+5.50)#1,615 |
| 59. | 60661 | 10.3% | 5.1%(+5.28)#59 | 4.9%(+5.45)#1,636 |
| 60. | 61427 | 10.3% | 5.1%(+5.28)#60 | 4.9%(+5.44)#1,638 |
| 61. | 60061 | 10.2% | 5.1%(+5.11)#61 | 4.9%(+5.27)#1,701 |
| 62. | 62557 | 10.0% | 5.1%(+4.97)#62 | 4.9%(+5.13)#1,742 |
| 63. | 62957 | 10.0% | 5.1%(+4.94)#63 | 4.9%(+5.11)#1,752 |
| 64. | 60973 | 10.0% | 5.1%(+4.94)#64 | 4.9%(+5.11)#1,757 |
| 65. | 61730 | 10.0% | 5.1%(+4.94)#65 | 4.9%(+5.11)#1,758 |
| 66. | 62961 | 10.0% | 5.1%(+4.94)#66 | 4.9%(+5.11)#1,765 |
| 67. | 60502 | 9.8% | 5.1%(+4.77)#67 | 4.9%(+4.94)#1,822 |
| 68. | 60103 | 9.8% | 5.1%(+4.77)#68 | 4.9%(+4.94)#1,823 |
| 69. | 62859 | 9.8% | 5.1%(+4.75)#69 | 4.9%(+4.92)#1,833 |
| 70. | 62036 | 9.6% | 5.1%(+4.51)#70 | 4.9%(+4.67)#1,937 |
| 71. | 62254 | 9.6% | 5.1%(+4.50)#71 | 4.9%(+4.66)#1,939 |
| 72. | 60194 | 9.5% | 5.1%(+4.45)#72 | 4.9%(+4.61)#1,963 |
| 73. | 60911 | 9.4% | 5.1%(+4.36)#73 | 4.9%(+4.52)#2,012 |
| 74. | 60177 | 9.4% | 5.1%(+4.34)#74 | 4.9%(+4.50)#2,019 |
| 75. | 62999 | 9.3% | 5.1%(+4.29)#75 | 4.9%(+4.45)#2,039 |
| 76. | 62230 | 9.3% | 5.1%(+4.25)#76 | 4.9%(+4.41)#2,063 |
| 77. | 62204 | 9.2% | 5.1%(+4.12)#77 | 4.9%(+4.28)#2,127 |
| 78. | 62547 | 9.1% | 5.1%(+4.03)#78 | 4.9%(+4.20)#2,191 |
| 79. | 60144 | 9.1% | 5.1%(+4.03)#79 | 4.9%(+4.20)#2,207 |
| 80. | 61744 | 9.0% | 5.1%(+3.98)#80 | 4.9%(+4.14)#2,229 |
| 81. | 61753 | 9.0% | 5.1%(+3.97)#81 | 4.9%(+4.13)#2,238 |
| 82. | 62634 | 9.0% | 5.1%(+3.96)#82 | 4.9%(+4.13)#2,242 |
| 83. | 60440 | 9.0% | 5.1%(+3.92)#83 | 4.9%(+4.09)#2,270 |
| 84. | 62835 | 9.0% | 5.1%(+3.92)#84 | 4.9%(+4.08)#2,275 |
| 85. | 61752 | 8.9% | 5.1%(+3.89)#85 | 4.9%(+4.05)#2,290 |
| 86. | 60954 | 8.9% | 5.1%(+3.88)#86 | 4.9%(+4.04)#2,295 |
| 87. | 60410 | 8.9% | 5.1%(+3.85)#87 | 4.9%(+4.02)#2,308 |
| 88. | 61884 | 8.9% | 5.1%(+3.83)#88 | 4.9%(+3.99)#2,322 |
| 89. | 61517 | 8.9% | 5.1%(+3.81)#89 | 4.9%(+3.97)#2,327 |
| 90. | 60637 | 8.9% | 5.1%(+3.80)#90 | 4.9%(+3.96)#2,331 |
| 91. | 60504 | 8.8% | 5.1%(+3.79)#91 | 4.9%(+3.95)#2,338 |
| 92. | 62987 | 8.8% | 5.1%(+3.77)#92 | 4.9%(+3.93)#2,353 |
| 93. | 62875 | 8.8% | 5.1%(+3.77)#93 | 4.9%(+3.93)#2,354 |
| 94. | 60503 | 8.8% | 5.1%(+3.73)#94 | 4.9%(+3.90)#2,376 |
| 95. | 62666 | 8.7% | 5.1%(+3.64)#95 | 4.9%(+3.80)#2,424 |
| 96. | 62044 | 8.7% | 5.1%(+3.63)#96 | 4.9%(+3.79)#2,433 |
| 97. | 60047 | 8.6% | 5.1%(+3.55)#97 | 4.9%(+3.71)#2,470 |
| 98. | 60133 | 8.6% | 5.1%(+3.53)#98 | 4.9%(+3.70)#2,485 |
| 99. | 60460 | 8.6% | 5.1%(+3.53)#99 | 4.9%(+3.69)#2,487 |
| 100. | 60955 | 8.6% | 5.1%(+3.51)#100 | 4.9%(+3.68)#2,494 |
Common Questions
What are the Top 10 Zip Codes with the Highest Percentage of Population with a Degree in Computers and Mathematics in Illinois?
Top 10 Zip Codes with the Highest Percentage of Population with a Degree in Computers and Mathematics in Illinois are:
What zip code has the Highest Percentage of Population with a Degree in Computers and Mathematics in Illinois?
62851 has the Highest Percentage of Population with a Degree in Computers and Mathematics in Illinois with 82.4%.
What is the Percentage of Population with a Degree in Computers and Mathematics in the State of Illinois?
Percentage of Population with a Degree in Computers and Mathematics in Illinois is 5.1%.
What is the Percentage of Population with a Degree in Computers and Mathematics in the United States?
Percentage of Population with a Degree in Computers and Mathematics in the United States is 4.9%.