Zip Codes with the Highest Percentage of Population with a Degree in Computers and Mathematics in Oregon
RELATED REPORTS & OPTIONS
Computers and Mathematics
Oregon
Compare Zip Codes
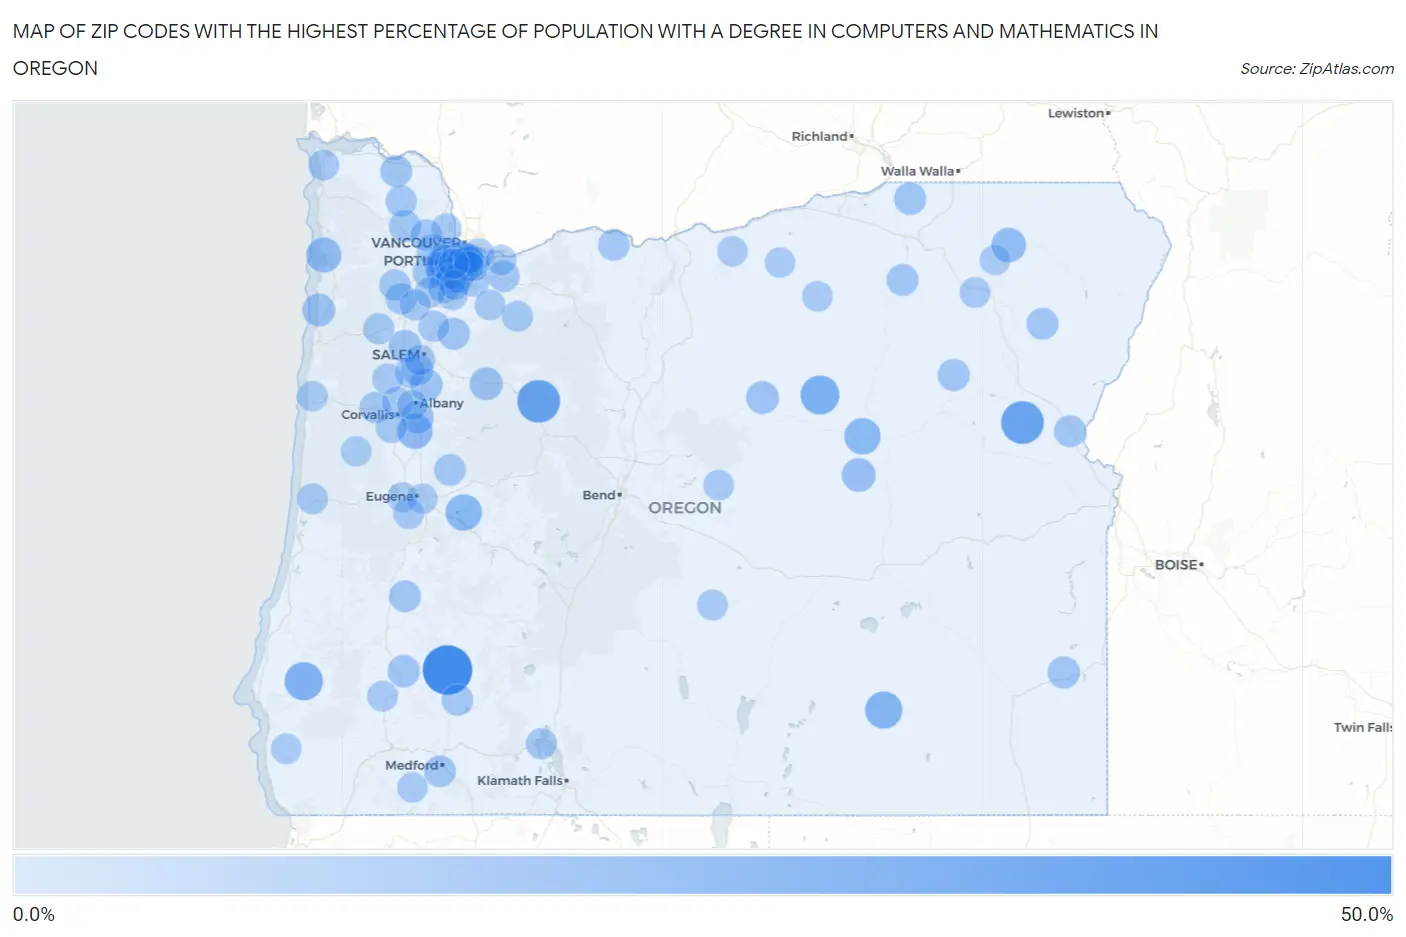
Map of Zip Codes with the Highest Percentage of Population with a Degree in Computers and Mathematics in Oregon
0.0%
50.0%
Zip Codes with the Highest Percentage of Population with a Degree in Computers and Mathematics in Oregon
| Zip Code | % Graduates | vs State | vs National | |
| 1. | 97484 | 50.0% | 3.9%(+46.1)#1 | 4.9%(+45.1)#83 |
| 2. | 97350 | 33.3% | 3.9%(+29.5)#2 | 4.9%(+28.4)#188 |
| 3. | 97819 | 33.3% | 3.9%(+29.5)#3 | 4.9%(+28.4)#193 |
| 4. | 97848 | 24.0% | 3.9%(+20.1)#4 | 4.9%(+19.1)#330 |
| 5. | 97466 | 22.5% | 3.9%(+18.6)#5 | 4.9%(+17.6)#377 |
| 6. | 97736 | 20.0% | 3.9%(+16.1)#6 | 4.9%(+15.1)#473 |
| 7. | 97438 | 18.1% | 3.9%(+14.3)#7 | 4.9%(+13.2)#560 |
| 8. | 97865 | 17.9% | 3.9%(+14.1)#8 | 4.9%(+13.0)#566 |
| 9. | 97377 | 15.6% | 3.9%(+11.7)#9 | 4.9%(+10.7)#740 |
| 10. | 97118 | 14.8% | 3.9%(+10.9)#10 | 4.9%(+9.92)#807 |
| 11. | 97827 | 13.6% | 3.9%(+9.77)#11 | 4.9%(+8.74)#951 |
| 12. | 97820 | 11.8% | 3.9%(+7.97)#12 | 4.9%(+6.94)#1,248 |
| 13. | 97360 | 10.1% | 3.9%(+6.24)#13 | 4.9%(+5.21)#1,713 |
| 14. | 97750 | 9.8% | 3.9%(+5.89)#14 | 4.9%(+4.86)#1,855 |
| 15. | 97371 | 9.7% | 3.9%(+5.81)#15 | 4.9%(+4.78)#1,893 |
| 16. | 97135 | 9.6% | 3.9%(+5.70)#16 | 4.9%(+4.67)#1,936 |
| 17. | 97389 | 9.2% | 3.9%(+5.29)#17 | 4.9%(+4.26)#2,145 |
| 18. | 97229 | 9.1% | 3.9%(+5.28)#18 | 4.9%(+4.25)#2,153 |
| 19. | 97352 | 9.1% | 3.9%(+5.24)#19 | 4.9%(+4.21)#2,167 |
| 20. | 97417 | 8.5% | 3.9%(+4.61)#20 | 4.9%(+3.58)#2,555 |
| 21. | 97006 | 8.4% | 3.9%(+4.54)#21 | 4.9%(+3.51)#2,596 |
| 22. | 97835 | 8.3% | 3.9%(+4.47)#22 | 4.9%(+3.44)#2,640 |
| 23. | 97910 | 8.2% | 3.9%(+4.35)#23 | 4.9%(+3.33)#2,737 |
| 24. | 97877 | 8.2% | 3.9%(+4.30)#24 | 4.9%(+3.27)#2,777 |
| 25. | 97003 | 7.9% | 3.9%(+4.04)#25 | 4.9%(+3.01)#2,980 |
| 26. | 97362 | 7.9% | 3.9%(+3.99)#26 | 4.9%(+2.96)#3,023 |
| 27. | 97109 | 7.7% | 3.9%(+3.83)#27 | 4.9%(+2.80)#3,163 |
| 28. | 97016 | 7.6% | 3.9%(+3.72)#28 | 4.9%(+2.69)#3,261 |
| 29. | 97868 | 7.5% | 3.9%(+3.63)#29 | 4.9%(+2.61)#3,340 |
| 30. | 97007 | 7.5% | 3.9%(+3.62)#30 | 4.9%(+2.59)#3,354 |
| 31. | 97907 | 7.5% | 3.9%(+3.60)#31 | 4.9%(+2.57)#3,375 |
| 32. | 97205 | 7.4% | 3.9%(+3.57)#32 | 4.9%(+2.54)#3,405 |
| 33. | 97501 | 7.3% | 3.9%(+3.43)#33 | 4.9%(+2.40)#3,530 |
| 34. | 97078 | 7.3% | 3.9%(+3.42)#34 | 4.9%(+2.39)#3,541 |
| 35. | 97479 | 7.3% | 3.9%(+3.42)#35 | 4.9%(+2.39)#3,542 |
| 36. | 97123 | 7.3% | 3.9%(+3.40)#36 | 4.9%(+2.37)#3,562 |
| 37. | 97883 | 7.1% | 3.9%(+3.24)#37 | 4.9%(+2.21)#3,726 |
| 38. | 97009 | 6.9% | 3.9%(+3.08)#38 | 4.9%(+2.06)#3,893 |
| 39. | 97454 | 6.9% | 3.9%(+3.03)#39 | 4.9%(+2.00)#3,951 |
| 40. | 97040 | 6.7% | 3.9%(+2.82)#40 | 4.9%(+1.79)#4,223 |
| 41. | 97124 | 6.6% | 3.9%(+2.68)#41 | 4.9%(+1.66)#4,390 |
| 42. | 97133 | 6.5% | 3.9%(+2.64)#42 | 4.9%(+1.61)#4,459 |
| 43. | 97541 | 6.4% | 3.9%(+2.53)#43 | 4.9%(+1.51)#4,606 |
| 44. | 97111 | 6.4% | 3.9%(+2.50)#44 | 4.9%(+1.47)#4,666 |
| 45. | 97064 | 6.3% | 3.9%(+2.44)#45 | 4.9%(+1.41)#4,771 |
| 46. | 97148 | 6.3% | 3.9%(+2.41)#46 | 4.9%(+1.38)#4,813 |
| 47. | 97306 | 6.3% | 3.9%(+2.41)#47 | 4.9%(+1.38)#4,816 |
| 48. | 97370 | 6.1% | 3.9%(+2.24)#48 | 4.9%(+1.22)#5,104 |
| 49. | 97026 | 6.1% | 3.9%(+2.23)#49 | 4.9%(+1.20)#5,133 |
| 50. | 97378 | 5.8% | 3.9%(+1.91)#50 | 4.9%(+0.885)#5,711 |
| 51. | 97333 | 5.7% | 3.9%(+1.83)#51 | 4.9%(+0.801)#5,879 |
| 52. | 97209 | 5.6% | 3.9%(+1.72)#52 | 4.9%(+0.695)#6,093 |
| 53. | 97330 | 5.5% | 3.9%(+1.60)#53 | 4.9%(+0.575)#6,370 |
| 54. | 97005 | 5.5% | 3.9%(+1.58)#54 | 4.9%(+0.556)#6,399 |
| 55. | 97140 | 5.4% | 3.9%(+1.54)#55 | 4.9%(+0.513)#6,490 |
| 56. | 97023 | 5.3% | 3.9%(+1.44)#56 | 4.9%(+0.411)#6,742 |
| 57. | 97601 | 5.3% | 3.9%(+1.41)#57 | 4.9%(+0.385)#6,809 |
| 58. | 97439 | 5.2% | 3.9%(+1.36)#58 | 4.9%(+0.334)#6,927 |
| 59. | 97641 | 5.1% | 3.9%(+1.24)#59 | 4.9%(+0.216)#7,187 |
| 60. | 97127 | 5.0% | 3.9%(+1.13)#60 | 4.9%(+0.106)#7,445 |
| 61. | 97027 | 5.0% | 3.9%(+1.10)#61 | 4.9%(+0.068)#7,534 |
| 62. | 97361 | 4.9% | 3.9%(+1.07)#62 | 4.9%(+0.041)#7,604 |
| 63. | 97221 | 4.9% | 3.9%(+1.03)#63 | 4.9%(+0.002)#7,706 |
| 64. | 97442 | 4.9% | 3.9%(+1.01)#64 | 4.9%(-0.016)#7,752 |
| 65. | 97210 | 4.9% | 3.9%(+0.991)#65 | 4.9%(-0.037)#7,819 |
| 66. | 97215 | 4.8% | 3.9%(+0.950)#66 | 4.9%(-0.079)#7,942 |
| 67. | 97219 | 4.8% | 3.9%(+0.924)#67 | 4.9%(-0.104)#8,017 |
| 68. | 97850 | 4.7% | 3.9%(+0.877)#68 | 4.9%(-0.151)#8,144 |
| 69. | 97223 | 4.7% | 3.9%(+0.865)#69 | 4.9%(-0.163)#8,181 |
| 70. | 97146 | 4.7% | 3.9%(+0.849)#70 | 4.9%(-0.179)#8,225 |
| 71. | 97206 | 4.7% | 3.9%(+0.819)#71 | 4.9%(-0.209)#8,316 |
| 72. | 97201 | 4.7% | 3.9%(+0.814)#72 | 4.9%(-0.214)#8,337 |
| 73. | 97836 | 4.7% | 3.9%(+0.807)#73 | 4.9%(-0.221)#8,356 |
| 74. | 97351 | 4.6% | 3.9%(+0.721)#74 | 4.9%(-0.307)#8,602 |
| 75. | 97405 | 4.6% | 3.9%(+0.688)#75 | 4.9%(-0.341)#8,690 |
| 76. | 97224 | 4.5% | 3.9%(+0.657)#76 | 4.9%(-0.371)#8,801 |
| 77. | 97004 | 4.5% | 3.9%(+0.621)#77 | 4.9%(-0.408)#8,915 |
| 78. | 97444 | 4.4% | 3.9%(+0.583)#78 | 4.9%(-0.445)#9,035 |
| 79. | 97754 | 4.4% | 3.9%(+0.526)#79 | 4.9%(-0.503)#9,228 |
| 80. | 97220 | 4.4% | 3.9%(+0.503)#80 | 4.9%(-0.526)#9,293 |
| 81. | 97035 | 4.4% | 3.9%(+0.498)#81 | 4.9%(-0.531)#9,306 |
| 82. | 97324 | 4.3% | 3.9%(+0.482)#82 | 4.9%(-0.546)#9,361 |
| 83. | 97530 | 4.3% | 3.9%(+0.469)#83 | 4.9%(-0.560)#9,417 |
| 84. | 97365 | 4.3% | 3.9%(+0.466)#84 | 4.9%(-0.563)#9,427 |
| 85. | 97302 | 4.3% | 3.9%(+0.452)#85 | 4.9%(-0.576)#9,483 |
| 86. | 97214 | 4.2% | 3.9%(+0.354)#86 | 4.9%(-0.675)#9,773 |
| 87. | 97232 | 4.2% | 3.9%(+0.304)#87 | 4.9%(-0.724)#9,927 |
| 88. | 97876 | 4.2% | 3.9%(+0.301)#88 | 4.9%(-0.727)#9,944 |
| 89. | 97202 | 4.2% | 3.9%(+0.291)#89 | 4.9%(-0.737)#9,968 |
| 90. | 97812 | 4.1% | 3.9%(+0.267)#90 | 4.9%(-0.762)#10,046 |
| 91. | 97843 | 4.1% | 3.9%(+0.244)#91 | 4.9%(-0.784)#10,111 |
| 92. | 97070 | 4.0% | 3.9%(+0.168)#92 | 4.9%(-0.860)#10,356 |
| 93. | 97062 | 4.0% | 3.9%(+0.153)#93 | 4.9%(-0.876)#10,409 |
| 94. | 97225 | 4.0% | 3.9%(+0.096)#94 | 4.9%(-0.933)#10,587 |
| 95. | 97231 | 3.9% | 3.9%(+0.082)#95 | 4.9%(-0.947)#10,628 |
| 96. | 97321 | 3.9% | 3.9%(+0.064)#96 | 4.9%(-0.965)#10,687 |
| 97. | 97403 | 3.9% | 3.9%(+0.049)#97 | 4.9%(-0.980)#10,756 |
| 98. | 97402 | 3.9% | 3.9%(+0.041)#98 | 4.9%(-0.987)#10,793 |
| 99. | 97060 | 3.9% | 3.9%(+0.000)#99 | 4.9%(-1.03)#10,925 |
| 100. | 97132 | 3.8% | 3.9%(-0.016)#100 | 4.9%(-1.04)#10,986 |
Common Questions
What are the Top 10 Zip Codes with the Highest Percentage of Population with a Degree in Computers and Mathematics in Oregon?
Top 10 Zip Codes with the Highest Percentage of Population with a Degree in Computers and Mathematics in Oregon are:
What zip code has the Highest Percentage of Population with a Degree in Computers and Mathematics in Oregon?
97484 has the Highest Percentage of Population with a Degree in Computers and Mathematics in Oregon with 50.0%.
What is the Percentage of Population with a Degree in Computers and Mathematics in the State of Oregon?
Percentage of Population with a Degree in Computers and Mathematics in Oregon is 3.9%.
What is the Percentage of Population with a Degree in Computers and Mathematics in the United States?
Percentage of Population with a Degree in Computers and Mathematics in the United States is 4.9%.