Zip Codes with the Highest Percentage of Population with a Degree in Computers and Mathematics in Wyoming

RELATED REPORTS & OPTIONS

Computers and Mathematics
Population
Families and Households
Female Fertility
Female Fertility (Unmarried)
Race (Community Size)
Race (Percentage)
Ancestry (Community Size)
AfghanAfricanAlaska NativeAlaskan AthabascanAlbanianAleutAlsatianAmericanApacheArabArapahoArgentineanArmenianAssyrian / Chaldean / SyriacAustralianAustrianBahamianBangladeshiBarbadianBasqueBelgianBelizeanBermudanBhutaneseBlackfeetBolivianBrazilianBritishBritish West IndianBulgarianBurmeseCajunCambodianCanadianCape VerdeanCarpatho RusynCelticCentral AmericanCentral American IndianCherokeeCheyenneChickasawChileanChineseChippewaChoctawColombianColvilleComancheCosta RicanCreeCreekCroatianCrowCubanCypriotCzechCzechoslovakianDanishDelawareDominicanDutchDutch West IndianEastern EuropeanEcuadorianEgyptianEnglishEstonianEthiopianEuropeanFijianFilipinoFinnishFrenchFrench American IndianFrench CanadianGermanGerman RussianGhanaianGreekGuamanian / ChamorroGuatemalanGuyaneseHaitianHmongHonduranHopiHoumaHungarianIcelanderIndian (Asian)IndonesianInupiatIranianIraqiIrishIroquoisIsraeliItalianJamaicanJapaneseJordanianKenyanKiowaKoreanLaotianLatvianLebaneseLiberianLithuanianLumbeeLuxembourgerMacedonianMalaysianMalteseMarshalleseMenomineeMexicanMexican American IndianMongolianMoroccanNative HawaiianNavajoNepaleseNew ZealanderNicaraguanNigerianNorthern EuropeanNorwegianOkinawanOsageOttawaPaiutePakistaniPalestinianPanamanianParaguayanPennsylvania GermanPeruvianPimaPolishPortuguesePotawatomiPuebloPuerto RicanPuget Sound SalishRomanianRussianSalvadoranSamoanScandinavianScotch-IrishScottishSeminoleSenegaleseSerbianShoshoneSierra LeoneanSiouxSlavicSlovakSloveneSomaliSouth AfricanSouth AmericanSouth American IndianSoviet UnionSpaniardSpanishSpanish AmericanSpanish American IndianSri LankanSubsaharan AfricanSudaneseSwedishSwissSyrianTaiwaneseThaiTlingit-HaidaTohono O'OdhamTonganTrinidadian and TobagonianTsimshianTurkishU.S. Virgin IslanderUgandanUkrainianUruguayanUteVenezuelanVietnameseWelshWest IndianYakamaYaquiYugoslavianYumanYup'ikZimbabwean
Ancestry (Percentage)
AfghanAfricanAlaska NativeAlaskan AthabascanAlbanianAleutAlsatianAmericanApacheArabArapahoArgentineanArmenianAssyrian / Chaldean / SyriacAustralianAustrianBahamianBangladeshiBarbadianBasqueBelgianBelizeanBermudanBhutaneseBlackfeetBolivianBrazilianBritishBritish West IndianBulgarianBurmeseCajunCambodianCanadianCape VerdeanCarpatho RusynCelticCentral AmericanCentral American IndianCherokeeCheyenneChickasawChileanChineseChippewaChoctawColombianColvilleComancheCosta RicanCreeCreekCroatianCrowCubanCypriotCzechCzechoslovakianDanishDelawareDominicanDutchDutch West IndianEastern EuropeanEcuadorianEgyptianEnglishEstonianEthiopianEuropeanFijianFilipinoFinnishFrenchFrench American IndianFrench CanadianGermanGerman RussianGhanaianGreekGuamanian / ChamorroGuatemalanGuyaneseHaitianHmongHonduranHopiHoumaHungarianIcelanderIndian (Asian)IndonesianInupiatIranianIraqiIrishIroquoisIsraeliItalianJamaicanJapaneseJordanianKenyanKiowaKoreanLaotianLatvianLebaneseLiberianLithuanianLumbeeLuxembourgerMacedonianMalaysianMalteseMarshalleseMenomineeMexicanMexican American IndianMongolianMoroccanNative HawaiianNavajoNepaleseNew ZealanderNicaraguanNigerianNorthern EuropeanNorwegianOkinawanOsageOttawaPaiutePakistaniPalestinianPanamanianParaguayanPennsylvania GermanPeruvianPimaPolishPortuguesePotawatomiPuebloPuerto RicanPuget Sound SalishRomanianRussianSalvadoranSamoanScandinavianScotch-IrishScottishSeminoleSenegaleseSerbianShoshoneSierra LeoneanSiouxSlavicSlovakSloveneSomaliSouth AfricanSouth AmericanSouth American IndianSoviet UnionSpaniardSpanishSpanish AmericanSpanish American IndianSri LankanSubsaharan AfricanSudaneseSwedishSwissSyrianTaiwaneseThaiTlingit-HaidaTohono O'OdhamTonganTrinidadian and TobagonianTsimshianTurkishU.S. Virgin IslanderUgandanUkrainianUruguayanUteVenezuelanVietnameseWelshWest IndianYakamaYaquiYugoslavianYumanYup'ikZimbabwean
Immigrant Origin (Total)
AfghanistanAfricaAlbaniaArgentinaArmeniaAsiaAustraliaAustriaAzoresBahamasBangladeshBarbadosBelarusBelgiumBelizeBoliviaBosnia and HerzegovinaBrazilBulgariaBurma / MyanmarCabo VerdeCambodiaCameroonCanadaCaribbeanCentral AmericaChileChinaColombiaCongoCosta RicaCroatiaCubaCzechoslovakiaDenmarkDominicaDominican RepublicEastern AfricaEastern AsiaEastern EuropeEcuadorEgyptEl SalvadorEnglandEritreaEthiopiaEuropeFijiFranceGermanyGhanaGreeceGrenadaGuatemalaGuyanaHaitiHondurasHong KongHungaryIndiaIndonesiaIranIraqIrelandIsraelItalyJamaicaJapanJordanKazakhstanKenyaKoreaKuwaitLaosLatin AmericaLatviaLebanonLiberiaLithuaniaMalaysiaMexicoMicronesiaMiddle AfricaMoldovaMoroccoNepalNetherlandsNicaraguaNigeriaNorth MacedoniaNorthern AfricaNorthern EuropeNorwayOceaniaPakistanPanamaPeruPhilippinesPolandPortugalRomaniaRussiaSaudi ArabiaScotlandSenegalSerbiaSierra LeoneSingaporeSomaliaSouth AfricaSouth AmericaSouth Central AsiaSouth Eastern AsiaSouthern EuropeSpainSri LankaSt. Vincent and the GrenadinesSudanSwedenSwitzerlandSyriaTaiwanThailandTrinidad and TobagoTurkeyUgandaUkraineUruguayUzbekistanVenezuelaVietnamWest IndiesWestern AfricaWestern AsiaWestern EuropeYemenZaireZimbabwe
Immigrant Origin (Percentage)
AfghanistanAfricaAlbaniaArgentinaArmeniaAsiaAustraliaAustriaAzoresBahamasBangladeshBarbadosBelarusBelgiumBelizeBoliviaBosnia and HerzegovinaBrazilBulgariaBurma / MyanmarCabo VerdeCambodiaCameroonCanadaCaribbeanCentral AmericaChileChinaColombiaCongoCosta RicaCroatiaCubaCzechoslovakiaDenmarkDominicaDominican RepublicEastern AfricaEastern AsiaEastern EuropeEcuadorEgyptEl SalvadorEnglandEritreaEthiopiaEuropeFijiFranceGermanyGhanaGreeceGrenadaGuatemalaGuyanaHaitiHondurasHong KongHungaryIndiaIndonesiaIranIraqIrelandIsraelItalyJamaicaJapanJordanKazakhstanKenyaKoreaKuwaitLaosLatin AmericaLatviaLebanonLiberiaLithuaniaMalaysiaMexicoMicronesiaMiddle AfricaMoldovaMoroccoNepalNetherlandsNicaraguaNigeriaNorth MacedoniaNorthern AfricaNorthern EuropeNorwayOceaniaPakistanPanamaPeruPhilippinesPolandPortugalRomaniaRussiaSaudi ArabiaScotlandSenegalSerbiaSierra LeoneSingaporeSomaliaSouth AfricaSouth AmericaSouth Central AsiaSouth Eastern AsiaSouthern EuropeSpainSri LankaSt. Vincent and the GrenadinesSudanSwedenSwitzerlandSyriaTaiwanThailandTrinidad and TobagoTurkeyUgandaUkraineUruguayUzbekistanVenezuelaVietnamWest IndiesWestern AfricaWestern AsiaWestern EuropeYemenZaireZimbabwe
Income
Income (Families)
Income (Households)
Poverty
Poverty (Families)
Unemployment
Employment Occupations
Employment Industries
Employer Class
Commute Time
Commute Means
School Enrollment
Education by Degree Field
Occupancy
Finances
Physical Characteristics
Wyoming
Compare Zip Codes
Comparison Subject

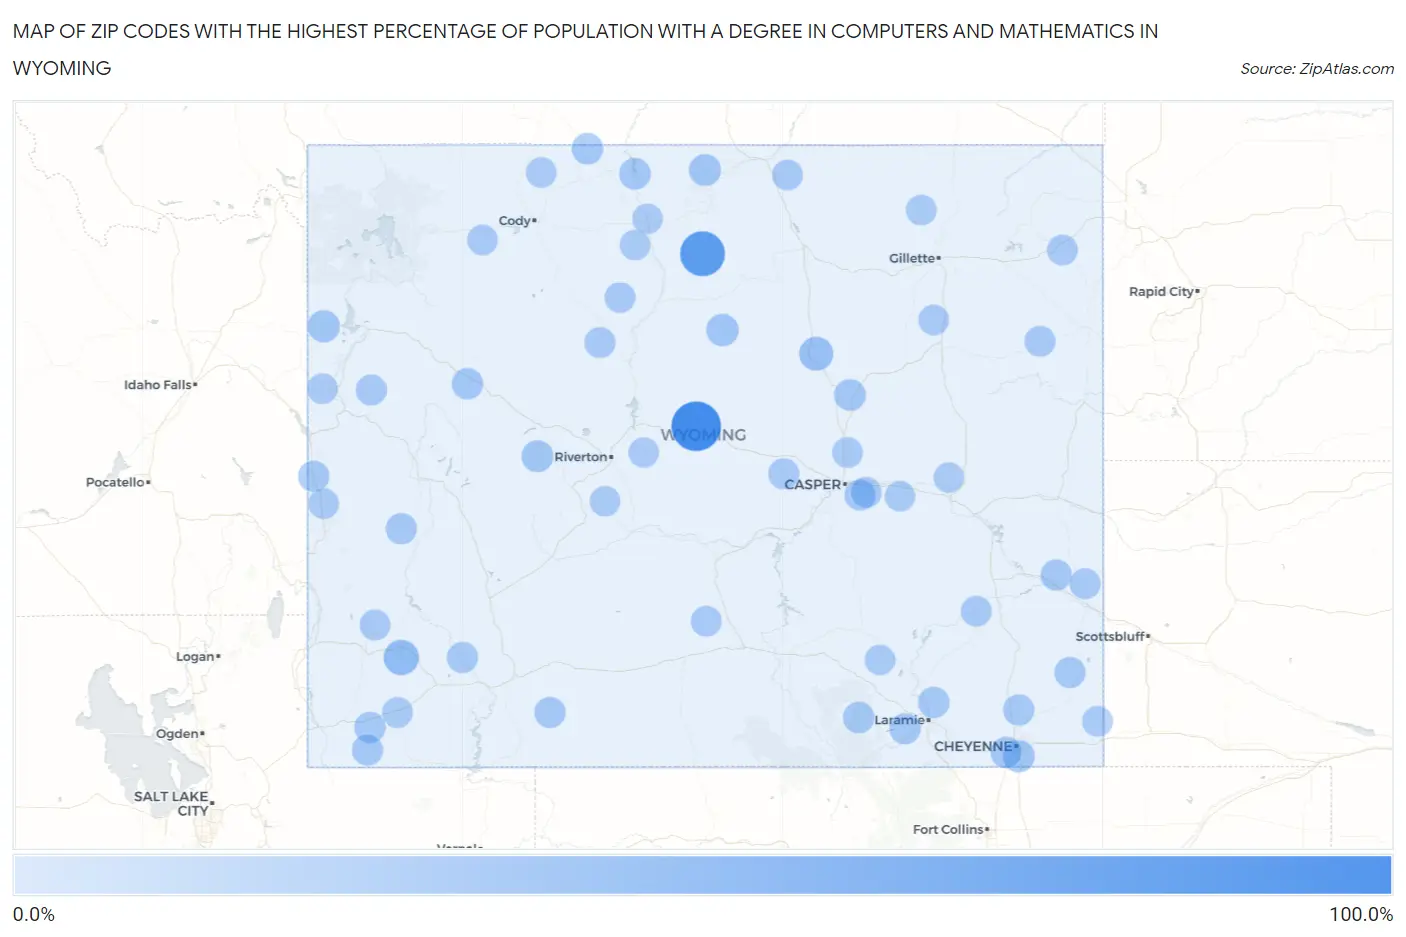
Map of Zip Codes with the Highest Percentage of Population with a Degree in Computers and Mathematics in Wyoming

0.0%
100.0%
Zip Codes with the Highest Percentage of Population with a Degree in Computers and Mathematics in Wyoming Map

Zip Codes with the Highest Percentage of Population with a Degree in Computers and Mathematics in Wyoming

Zip Code % Graduates vs State vs National
1.82642100.0%2.6%(+97.4)#14.9%(+95.1)#19
2.8242875.0%2.6%(+72.4)#24.9%(+70.1)#30
3.8312425.0%2.6%(+22.4)#34.9%(+20.1)#306
4.8263917.8%2.6%(+15.2)#44.9%(+12.9)#571
5.824429.7%2.6%(+7.17)#54.9%(+4.85)#1,864
6.834148.6%2.6%(+6.03)#64.9%(+3.70)#2,475
7.820078.3%2.6%(+5.69)#74.9%(+3.37)#2,700
8.828367.7%2.6%(+5.12)#84.9%(+2.80)#3,153
9.825147.2%2.6%(+4.64)#94.9%(+2.32)#3,611
10.826436.7%2.6%(+4.09)#104.9%(+1.77)#4,250
11.824315.9%2.6%(+3.32)#114.9%(+1.00)#5,498
12.825135.7%2.6%(+3.16)#124.9%(+0.834)#5,820
13.824235.3%2.6%(+2.69)#134.9%(+0.369)#6,863
14.831134.6%2.6%(+2.07)#144.9%(-0.251)#8,452
15.829334.5%2.6%(+1.97)#154.9%(-0.349)#8,720
16.820724.5%2.6%(+1.93)#164.9%(-0.395)#8,878
17.820554.5%2.6%(+1.92)#174.9%(-0.403)#8,904
18.820014.3%2.6%(+1.70)#184.9%(-0.626)#9,627
19.826094.0%2.6%(+1.47)#194.9%(-0.854)#10,336
20.822124.0%2.6%(+1.43)#204.9%(-0.894)#10,462
21.820093.9%2.6%(+1.30)#214.9%(-1.02)#10,902
22.831273.7%2.6%(+1.17)#224.9%(-1.16)#11,402
23.829353.6%2.6%(+1.04)#234.9%(-1.28)#11,847
24.829013.6%2.6%(+1.02)#244.9%(-1.30)#11,910
25.829303.6%2.6%(+1.02)#254.9%(-1.31)#11,940
26.820703.3%2.6%(+0.739)#264.9%(-1.58)#12,982
27.822213.3%2.6%(+0.689)#274.9%(-1.63)#13,152
28.824433.0%2.6%(+0.399)#284.9%(-1.92)#14,176
29.827012.8%2.6%(+0.180)#294.9%(-2.14)#14,975
30.826042.7%2.6%(+0.175)#304.9%(-2.15)#14,992
31.830012.7%2.6%(+0.153)#314.9%(-2.17)#15,068
32.822402.7%2.6%(+0.135)#324.9%(-2.19)#15,131
33.826362.5%2.6%(-0.049)#334.9%(-2.37)#15,816
34.831012.2%2.6%(-0.370)#344.9%(-2.69)#16,966
35.824011.9%2.6%(-0.675)#354.9%(-3.00)#17,941
36.829371.9%2.6%(-0.715)#364.9%(-3.04)#18,071
37.828011.8%2.6%(-0.768)#374.9%(-3.09)#18,221
38.823011.8%2.6%(-0.790)#384.9%(-3.11)#18,289
39.822011.7%2.6%(-0.845)#394.9%(-3.17)#18,448
40.826011.6%2.6%(-0.929)#404.9%(-3.25)#18,718
41.827291.4%2.6%(-1.16)#414.9%(-3.49)#19,401
42.820821.2%2.6%(-1.38)#424.9%(-3.70)#20,010
43.827181.2%2.6%(-1.39)#434.9%(-3.71)#20,049
44.824141.1%2.6%(-1.46)#444.9%(-3.79)#20,240
45.824351.0%2.6%(-1.56)#454.9%(-3.88)#20,487
46.830140.97%2.6%(-1.60)#464.9%(-3.92)#20,586
47.827160.92%2.6%(-1.66)#474.9%(-3.98)#20,706
48.831100.87%2.6%(-1.70)#484.9%(-4.02)#20,794
49.825200.71%2.6%(-1.86)#494.9%(-4.18)#21,120
50.820830.62%2.6%(-1.95)#504.9%(-4.27)#21,275
51.824100.42%2.6%(-2.15)#514.9%(-4.47)#21,578
52.825010.23%2.6%(-2.34)#524.9%(-4.66)#21,744
53.826370.21%2.6%(-2.36)#534.9%(-4.68)#21,758
54.824260.21%2.6%(-2.36)#544.9%(-4.68)#21,759
55.826330.055%2.6%(-2.52)#554.9%(-4.84)#21,805

Common Questions

What are the Top 10 Zip Codes with the Highest Percentage of Population with a Degree in Computers and Mathematics in Wyoming?
Top 10 Zip Codes with the Highest Percentage of Population with a Degree in Computers and Mathematics in Wyoming are:
#1
100.0%
#2
75.0%
#3
25.0%
#4
17.8%
#5
9.7%
#6
8.6%
#7
8.3%
#8
7.7%
#9
7.2%
#10
6.7%
What zip code has the Highest Percentage of Population with a Degree in Computers and Mathematics in Wyoming?
82642 has the Highest Percentage of Population with a Degree in Computers and Mathematics in Wyoming with 100.0%.
What is the Percentage of Population with a Degree in Computers and Mathematics in the State of Wyoming?
Percentage of Population with a Degree in Computers and Mathematics in Wyoming is 2.6%.
What is the Percentage of Population with a Degree in Computers and Mathematics in the United States?
Percentage of Population with a Degree in Computers and Mathematics in the United States is 4.9%.