Zip Codes with the Highest Percentage of Population with a Degree in Computers and Mathematics in South Carolina
RELATED REPORTS & OPTIONS
Computers and Mathematics
South Carolina
Compare Zip Codes
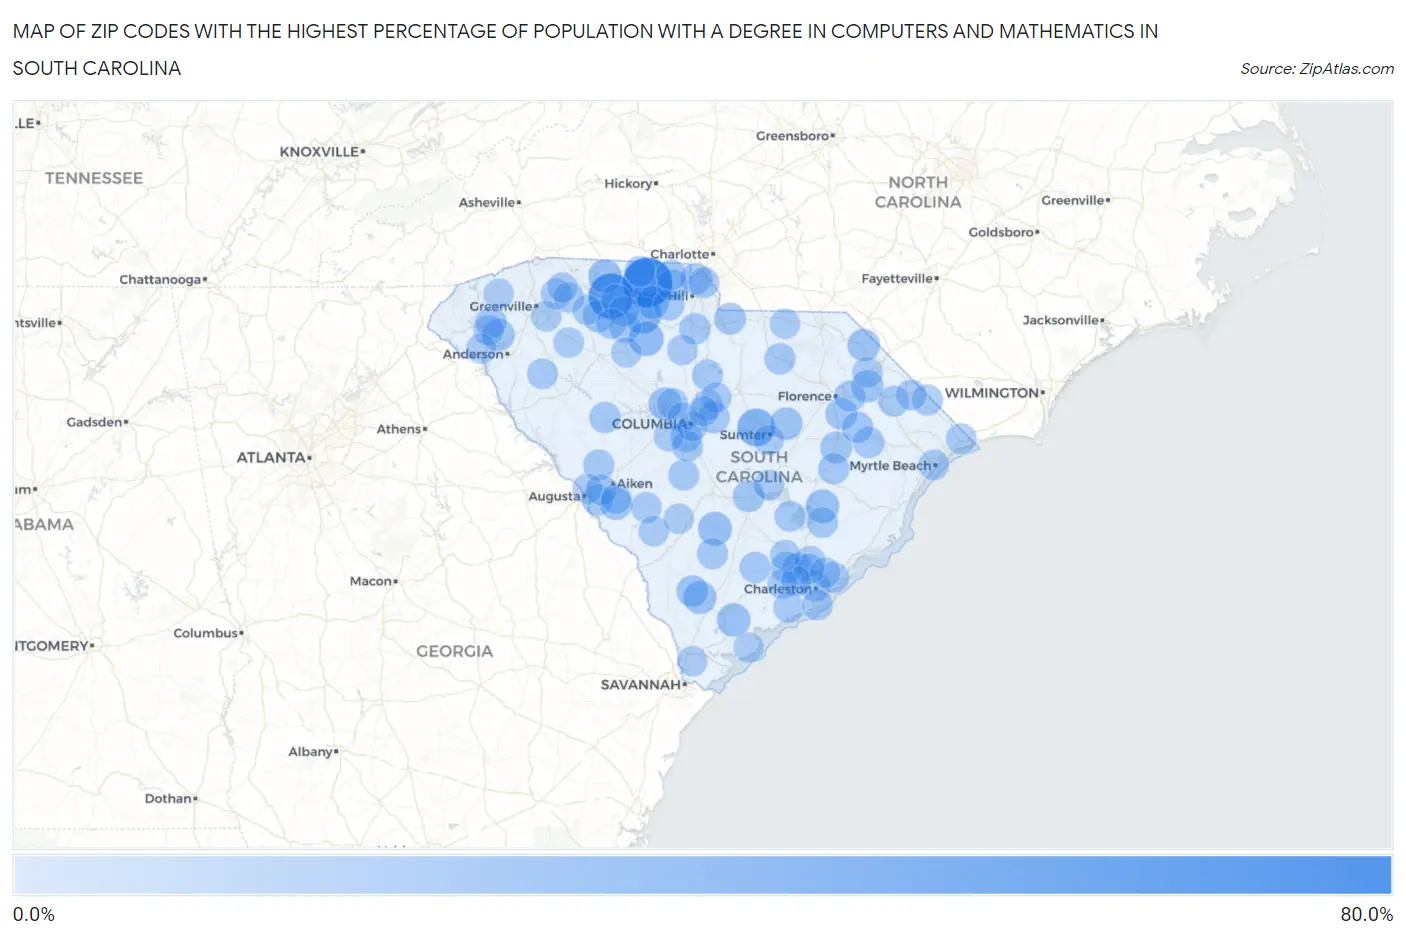
Map of Zip Codes with the Highest Percentage of Population with a Degree in Computers and Mathematics in South Carolina
0.0%
80.0%
Zip Codes with the Highest Percentage of Population with a Degree in Computers and Mathematics in South Carolina
| Zip Code | % Graduates | vs State | vs National | |
| 1. | 29743 | 67.1% | 3.7%(+63.3)#1 | 4.9%(+62.2)#40 |
| 2. | 29373 | 53.3% | 3.7%(+49.6)#2 | 4.9%(+48.4)#63 |
| 3. | 29152 | 28.4% | 3.7%(+24.7)#3 | 4.9%(+23.5)#250 |
| 4. | 29364 | 26.3% | 3.7%(+22.6)#4 | 4.9%(+21.4)#279 |
| 5. | 29031 | 18.5% | 3.7%(+14.7)#5 | 4.9%(+13.6)#534 |
| 6. | 29432 | 15.5% | 3.7%(+11.8)#6 | 4.9%(+10.6)#745 |
| 7. | 29940 | 14.7% | 3.7%(+10.9)#7 | 4.9%(+9.79)#822 |
| 8. | 29479 | 14.7% | 3.7%(+10.9)#8 | 4.9%(+9.77)#826 |
| 9. | 29330 | 14.6% | 3.7%(+10.9)#9 | 4.9%(+9.71)#831 |
| 10. | 29916 | 12.7% | 3.7%(+8.98)#10 | 4.9%(+7.83)#1,088 |
| 11. | 29742 | 12.4% | 3.7%(+8.66)#11 | 4.9%(+7.51)#1,150 |
| 12. | 29177 | 12.2% | 3.7%(+8.50)#12 | 4.9%(+7.35)#1,178 |
| 13. | 29104 | 11.8% | 3.7%(+8.08)#13 | 4.9%(+6.93)#1,249 |
| 14. | 29525 | 11.2% | 3.7%(+7.46)#14 | 4.9%(+6.32)#1,401 |
| 15. | 29374 | 11.0% | 3.7%(+7.25)#15 | 4.9%(+6.11)#1,455 |
| 16. | 29592 | 10.3% | 3.7%(+6.60)#16 | 4.9%(+5.45)#1,632 |
| 17. | 29670 | 10.3% | 3.7%(+6.56)#17 | 4.9%(+5.42)#1,646 |
| 18. | 29944 | 10.2% | 3.7%(+6.41)#18 | 4.9%(+5.27)#1,704 |
| 19. | 29809 | 10.2% | 3.7%(+6.40)#19 | 4.9%(+5.26)#1,706 |
| 20. | 29560 | 9.7% | 3.7%(+5.91)#20 | 4.9%(+4.76)#1,900 |
| 21. | 29720 | 9.1% | 3.7%(+5.37)#21 | 4.9%(+4.22)#2,163 |
| 22. | 29541 | 9.0% | 3.7%(+5.24)#22 | 4.9%(+4.10)#2,260 |
| 23. | 29142 | 8.9% | 3.7%(+5.15)#23 | 4.9%(+4.00)#2,316 |
| 24. | 29207 | 8.3% | 3.7%(+4.58)#24 | 4.9%(+3.44)#2,630 |
| 25. | 29172 | 8.3% | 3.7%(+4.52)#25 | 4.9%(+3.38)#2,691 |
| 26. | 29485 | 8.1% | 3.7%(+4.36)#26 | 4.9%(+3.22)#2,812 |
| 27. | 29101 | 7.9% | 3.7%(+4.14)#27 | 4.9%(+2.99)#2,993 |
| 28. | 29729 | 7.9% | 3.7%(+4.13)#28 | 4.9%(+2.99)#2,995 |
| 29. | 29555 | 7.9% | 3.7%(+4.12)#29 | 4.9%(+2.98)#3,001 |
| 30. | 29420 | 7.8% | 3.7%(+4.04)#30 | 4.9%(+2.90)#3,072 |
| 31. | 29138 | 7.7% | 3.7%(+3.92)#31 | 4.9%(+2.78)#3,181 |
| 32. | 29583 | 7.6% | 3.7%(+3.87)#32 | 4.9%(+2.73)#3,222 |
| 33. | 29726 | 7.4% | 3.7%(+3.68)#33 | 4.9%(+2.53)#3,411 |
| 34. | 29708 | 7.4% | 3.7%(+3.65)#34 | 4.9%(+2.51)#3,436 |
| 35. | 29745 | 7.3% | 3.7%(+3.53)#35 | 4.9%(+2.39)#3,543 |
| 36. | 29842 | 7.3% | 3.7%(+3.53)#36 | 4.9%(+2.38)#3,546 |
| 37. | 29372 | 7.2% | 3.7%(+3.49)#37 | 4.9%(+2.34)#3,584 |
| 38. | 29556 | 7.2% | 3.7%(+3.49)#38 | 4.9%(+2.34)#3,587 |
| 39. | 29435 | 7.1% | 3.7%(+3.36)#39 | 4.9%(+2.22)#3,716 |
| 40. | 29063 | 7.1% | 3.7%(+3.34)#40 | 4.9%(+2.19)#3,742 |
| 41. | 29847 | 6.9% | 3.7%(+3.14)#41 | 4.9%(+1.99)#3,962 |
| 42. | 29506 | 6.7% | 3.7%(+3.00)#42 | 4.9%(+1.86)#4,140 |
| 43. | 29130 | 6.7% | 3.7%(+2.98)#43 | 4.9%(+1.83)#4,170 |
| 44. | 29112 | 6.6% | 3.7%(+2.87)#44 | 4.9%(+1.73)#4,312 |
| 45. | 29715 | 6.5% | 3.7%(+2.71)#45 | 4.9%(+1.57)#4,516 |
| 46. | 29493 | 6.5% | 3.7%(+2.70)#46 | 4.9%(+1.56)#4,531 |
| 47. | 29379 | 6.4% | 3.7%(+2.61)#47 | 4.9%(+1.46)#4,678 |
| 48. | 29403 | 6.3% | 3.7%(+2.59)#48 | 4.9%(+1.44)#4,706 |
| 49. | 29436 | 6.2% | 3.7%(+2.50)#49 | 4.9%(+1.36)#4,847 |
| 50. | 29574 | 6.2% | 3.7%(+2.46)#50 | 4.9%(+1.32)#4,923 |
| 51. | 29630 | 6.1% | 3.7%(+2.40)#51 | 4.9%(+1.25)#5,030 |
| 52. | 29545 | 6.1% | 3.7%(+2.34)#52 | 4.9%(+1.19)#5,143 |
| 53. | 29053 | 6.1% | 3.7%(+2.34)#53 | 4.9%(+1.19)#5,147 |
| 54. | 29431 | 6.1% | 3.7%(+2.33)#54 | 4.9%(+1.18)#5,160 |
| 55. | 29229 | 6.0% | 3.7%(+2.27)#55 | 4.9%(+1.12)#5,267 |
| 56. | 29853 | 5.9% | 3.7%(+2.17)#56 | 4.9%(+1.02)#5,446 |
| 57. | 29851 | 5.8% | 3.7%(+2.05)#57 | 4.9%(+0.901)#5,681 |
| 58. | 29487 | 5.7% | 3.7%(+1.99)#58 | 4.9%(+0.850)#5,790 |
| 59. | 29702 | 5.7% | 3.7%(+1.93)#59 | 4.9%(+0.785)#5,912 |
| 60. | 29631 | 5.6% | 3.7%(+1.88)#60 | 4.9%(+0.738)#6,011 |
| 61. | 29651 | 5.6% | 3.7%(+1.81)#61 | 4.9%(+0.668)#6,159 |
| 62. | 29565 | 5.5% | 3.7%(+1.78)#62 | 4.9%(+0.634)#6,248 |
| 63. | 29439 | 5.4% | 3.7%(+1.67)#63 | 4.9%(+0.525)#6,467 |
| 64. | 29445 | 5.4% | 3.7%(+1.65)#64 | 4.9%(+0.501)#6,516 |
| 65. | 29466 | 5.4% | 3.7%(+1.63)#65 | 4.9%(+0.482)#6,564 |
| 66. | 29566 | 5.3% | 3.7%(+1.57)#66 | 4.9%(+0.426)#6,712 |
| 67. | 29410 | 5.3% | 3.7%(+1.55)#67 | 4.9%(+0.402)#6,760 |
| 68. | 29581 | 5.3% | 3.7%(+1.54)#68 | 4.9%(+0.394)#6,782 |
| 69. | 29470 | 5.2% | 3.7%(+1.41)#69 | 4.9%(+0.261)#7,077 |
| 70. | 29710 | 5.0% | 3.7%(+1.29)#70 | 4.9%(+0.145)#7,362 |
| 71. | 29577 | 5.0% | 3.7%(+1.28)#71 | 4.9%(+0.132)#7,390 |
| 72. | 29638 | 5.0% | 3.7%(+1.23)#72 | 4.9%(+0.082)#7,509 |
| 73. | 29645 | 4.9% | 3.7%(+1.19)#73 | 4.9%(+0.041)#7,605 |
| 74. | 29812 | 4.9% | 3.7%(+1.18)#74 | 4.9%(+0.040)#7,606 |
| 75. | 29414 | 4.9% | 3.7%(+1.18)#75 | 4.9%(+0.036)#7,617 |
| 76. | 29014 | 4.9% | 3.7%(+1.16)#76 | 4.9%(+0.014)#7,672 |
| 77. | 29803 | 4.9% | 3.7%(+1.15)#77 | 4.9%(+0.001)#7,708 |
| 78. | 29353 | 4.9% | 3.7%(+1.14)#78 | 4.9%(-0.008)#7,728 |
| 79. | 29662 | 4.8% | 3.7%(+1.08)#79 | 4.9%(-0.063)#7,896 |
| 80. | 29334 | 4.8% | 3.7%(+1.03)#80 | 4.9%(-0.117)#8,058 |
| 81. | 29210 | 4.7% | 3.7%(+0.993)#81 | 4.9%(-0.151)#8,145 |
| 82. | 29201 | 4.7% | 3.7%(+0.990)#82 | 4.9%(-0.154)#8,155 |
| 83. | 29492 | 4.7% | 3.7%(+0.989)#83 | 4.9%(-0.155)#8,156 |
| 84. | 29150 | 4.6% | 3.7%(+0.874)#84 | 4.9%(-0.271)#8,503 |
| 85. | 29042 | 4.6% | 3.7%(+0.805)#85 | 4.9%(-0.340)#8,686 |
| 86. | 29045 | 4.5% | 3.7%(+0.792)#86 | 4.9%(-0.352)#8,742 |
| 87. | 29148 | 4.5% | 3.7%(+0.772)#87 | 4.9%(-0.372)#8,806 |
| 88. | 29920 | 4.5% | 3.7%(+0.758)#88 | 4.9%(-0.386)#8,848 |
| 89. | 29365 | 4.5% | 3.7%(+0.753)#89 | 4.9%(-0.391)#8,865 |
| 90. | 29927 | 4.5% | 3.7%(+0.747)#90 | 4.9%(-0.397)#8,885 |
| 91. | 29689 | 4.4% | 3.7%(+0.656)#91 | 4.9%(-0.488)#9,184 |
| 92. | 29741 | 4.4% | 3.7%(+0.646)#92 | 4.9%(-0.498)#9,212 |
| 93. | 29376 | 4.4% | 3.7%(+0.628)#93 | 4.9%(-0.516)#9,270 |
| 94. | 29321 | 4.4% | 3.7%(+0.612)#94 | 4.9%(-0.533)#9,315 |
| 95. | 29073 | 4.3% | 3.7%(+0.559)#95 | 4.9%(-0.585)#9,515 |
| 96. | 29841 | 4.3% | 3.7%(+0.536)#96 | 4.9%(-0.608)#9,568 |
| 97. | 29671 | 4.3% | 3.7%(+0.510)#97 | 4.9%(-0.634)#9,654 |
| 98. | 29483 | 4.2% | 3.7%(+0.495)#98 | 4.9%(-0.650)#9,701 |
| 99. | 29223 | 4.2% | 3.7%(+0.437)#99 | 4.9%(-0.707)#9,882 |
| 100. | 29178 | 4.1% | 3.7%(+0.387)#100 | 4.9%(-0.758)#10,031 |
Common Questions
What are the Top 10 Zip Codes with the Highest Percentage of Population with a Degree in Computers and Mathematics in South Carolina?
Top 10 Zip Codes with the Highest Percentage of Population with a Degree in Computers and Mathematics in South Carolina are:
What zip code has the Highest Percentage of Population with a Degree in Computers and Mathematics in South Carolina?
29743 has the Highest Percentage of Population with a Degree in Computers and Mathematics in South Carolina with 67.1%.
What is the Percentage of Population with a Degree in Computers and Mathematics in the State of South Carolina?
Percentage of Population with a Degree in Computers and Mathematics in South Carolina is 3.7%.
What is the Percentage of Population with a Degree in Computers and Mathematics in the United States?
Percentage of Population with a Degree in Computers and Mathematics in the United States is 4.9%.