Zip Codes with the Highest Percentage of Population with a Degree in Computers and Mathematics in New Hampshire
RELATED REPORTS & OPTIONS
Computers and Mathematics
New Hampshire
Compare Zip Codes
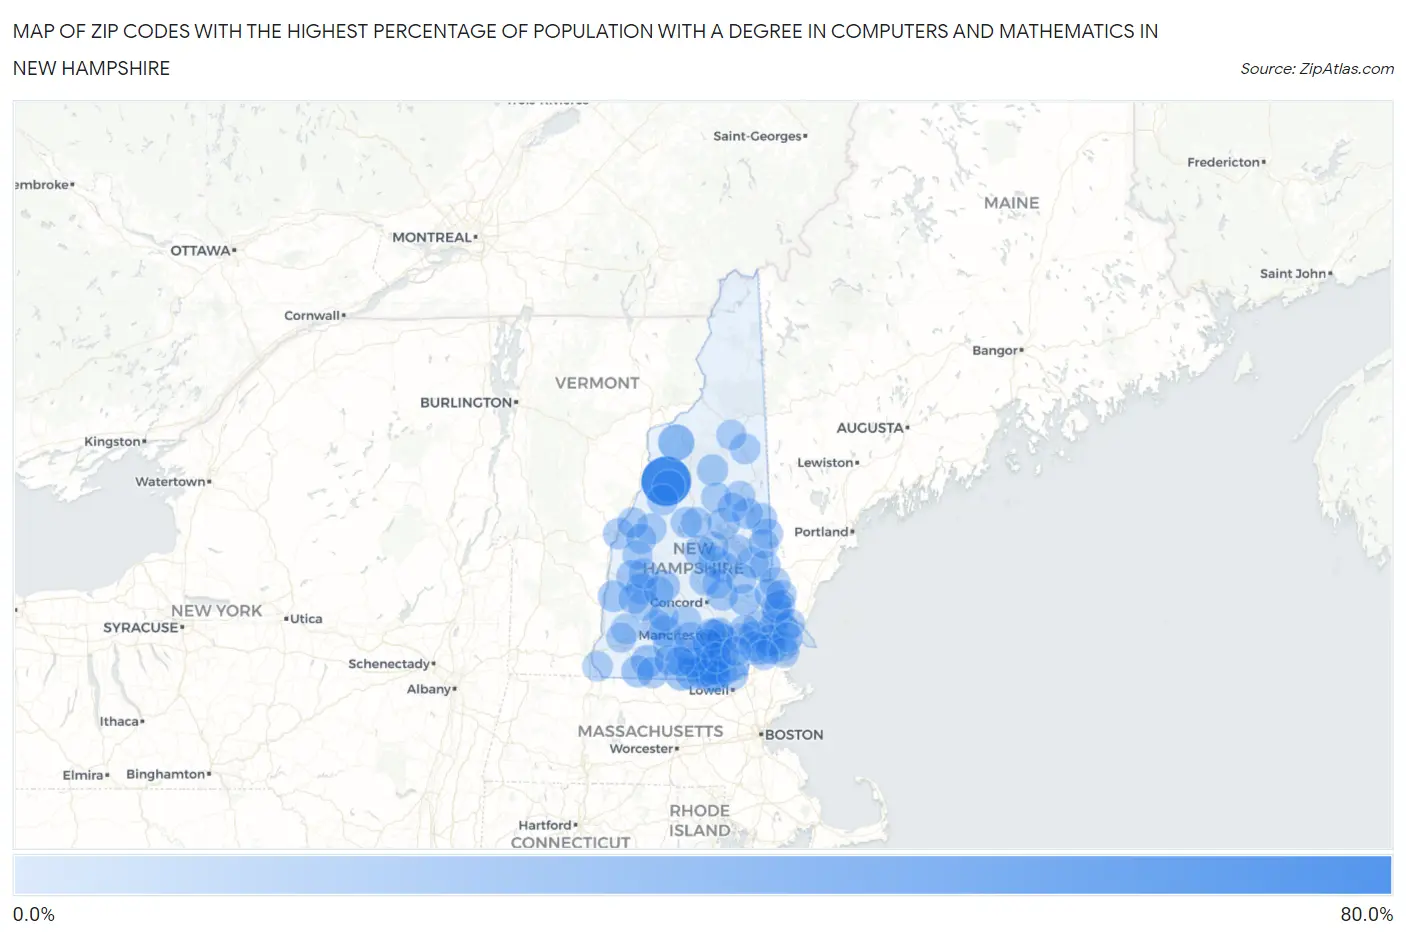
Map of Zip Codes with the Highest Percentage of Population with a Degree in Computers and Mathematics in New Hampshire
0.0%
80.0%
Zip Codes with the Highest Percentage of Population with a Degree in Computers and Mathematics in New Hampshire
| Zip Code | % Graduates | vs State | vs National | |
| 1. | 03238 | 62.5% | 4.9%(+57.6)#1 | 4.9%(+57.6)#43 |
| 2. | 03586 | 21.5% | 4.9%(+16.6)#2 | 4.9%(+16.6)#410 |
| 3. | 03101 | 14.2% | 4.9%(+9.32)#3 | 4.9%(+9.33)#889 |
| 4. | 03048 | 13.8% | 4.9%(+8.87)#4 | 4.9%(+8.88)#934 |
| 5. | 03063 | 11.5% | 4.9%(+6.61)#5 | 4.9%(+6.61)#1,328 |
| 6. | 03452 | 11.2% | 4.9%(+6.31)#6 | 4.9%(+6.31)#1,402 |
| 7. | 03279 | 11.0% | 4.9%(+6.14)#7 | 4.9%(+6.14)#1,447 |
| 8. | 03062 | 10.8% | 4.9%(+5.90)#8 | 4.9%(+5.91)#1,503 |
| 9. | 03273 | 10.7% | 4.9%(+5.81)#9 | 4.9%(+5.82)#1,525 |
| 10. | 03773 | 10.4% | 4.9%(+5.50)#10 | 4.9%(+5.51)#1,613 |
| 11. | 03447 | 10.2% | 4.9%(+5.26)#11 | 4.9%(+5.27)#1,702 |
| 12. | 03254 | 10.0% | 4.9%(+5.06)#12 | 4.9%(+5.06)#1,770 |
| 13. | 03269 | 9.5% | 4.9%(+4.56)#13 | 4.9%(+4.57)#1,985 |
| 14. | 03033 | 9.5% | 4.9%(+4.55)#14 | 4.9%(+4.56)#1,992 |
| 15. | 03049 | 9.0% | 4.9%(+4.08)#15 | 4.9%(+4.08)#2,272 |
| 16. | 03603 | 8.6% | 4.9%(+3.74)#16 | 4.9%(+3.74)#2,457 |
| 17. | 03042 | 8.5% | 4.9%(+3.63)#17 | 4.9%(+3.64)#2,522 |
| 18. | 03047 | 8.5% | 4.9%(+3.62)#18 | 4.9%(+3.63)#2,526 |
| 19. | 03054 | 8.5% | 4.9%(+3.57)#19 | 4.9%(+3.58)#2,559 |
| 20. | 03261 | 8.3% | 4.9%(+3.44)#20 | 4.9%(+3.45)#2,625 |
| 21. | 03882 | 8.3% | 4.9%(+3.43)#21 | 4.9%(+3.44)#2,635 |
| 22. | 03855 | 8.2% | 4.9%(+3.26)#22 | 4.9%(+3.27)#2,774 |
| 23. | 03461 | 8.1% | 4.9%(+3.25)#23 | 4.9%(+3.26)#2,786 |
| 24. | 03051 | 8.0% | 4.9%(+3.10)#24 | 4.9%(+3.10)#2,904 |
| 25. | 03442 | 7.9% | 4.9%(+3.03)#25 | 4.9%(+3.04)#2,955 |
| 26. | 03064 | 7.7% | 4.9%(+2.77)#26 | 4.9%(+2.78)#3,178 |
| 27. | 03784 | 7.7% | 4.9%(+2.75)#27 | 4.9%(+2.76)#3,193 |
| 28. | 03060 | 7.6% | 4.9%(+2.72)#28 | 4.9%(+2.73)#3,219 |
| 29. | 03851 | 7.6% | 4.9%(+2.65)#29 | 4.9%(+2.66)#3,290 |
| 30. | 03215 | 7.5% | 4.9%(+2.63)#30 | 4.9%(+2.64)#3,307 |
| 31. | 03220 | 7.4% | 4.9%(+2.54)#31 | 4.9%(+2.55)#3,393 |
| 32. | 03258 | 7.4% | 4.9%(+2.50)#32 | 4.9%(+2.51)#3,430 |
| 33. | 03752 | 7.2% | 4.9%(+2.28)#33 | 4.9%(+2.29)#3,642 |
| 34. | 03824 | 7.1% | 4.9%(+2.22)#34 | 4.9%(+2.23)#3,711 |
| 35. | 03087 | 7.1% | 4.9%(+2.21)#35 | 4.9%(+2.22)#3,714 |
| 36. | 03084 | 7.1% | 4.9%(+2.15)#36 | 4.9%(+2.16)#3,766 |
| 37. | 03031 | 7.1% | 4.9%(+2.15)#37 | 4.9%(+2.16)#3,768 |
| 38. | 03839 | 7.0% | 4.9%(+2.14)#38 | 4.9%(+2.14)#3,783 |
| 39. | 03264 | 6.8% | 4.9%(+1.89)#39 | 4.9%(+1.90)#4,071 |
| 40. | 03282 | 6.8% | 4.9%(+1.85)#40 | 4.9%(+1.86)#4,132 |
| 41. | 03217 | 6.6% | 4.9%(+1.73)#41 | 4.9%(+1.74)#4,292 |
| 42. | 03044 | 6.5% | 4.9%(+1.64)#42 | 4.9%(+1.65)#4,397 |
| 43. | 03280 | 6.5% | 4.9%(+1.64)#43 | 4.9%(+1.65)#4,403 |
| 44. | 03057 | 6.5% | 4.9%(+1.60)#44 | 4.9%(+1.61)#4,465 |
| 45. | 03224 | 6.5% | 4.9%(+1.59)#45 | 4.9%(+1.60)#4,483 |
| 46. | 03830 | 6.2% | 4.9%(+1.32)#46 | 4.9%(+1.33)#4,896 |
| 47. | 03237 | 6.2% | 4.9%(+1.32)#47 | 4.9%(+1.33)#4,907 |
| 48. | 03741 | 6.1% | 4.9%(+1.25)#48 | 4.9%(+1.26)#5,023 |
| 49. | 03055 | 6.1% | 4.9%(+1.16)#49 | 4.9%(+1.17)#5,188 |
| 50. | 03846 | 5.9% | 4.9%(+1.01)#50 | 4.9%(+1.02)#5,451 |
| 51. | 03036 | 5.9% | 4.9%(+0.997)#51 | 4.9%(+1.01)#5,478 |
| 52. | 03814 | 5.9% | 4.9%(+0.994)#52 | 4.9%(+1.00)#5,492 |
| 53. | 03840 | 5.8% | 4.9%(+0.931)#53 | 4.9%(+0.939)#5,612 |
| 54. | 03605 | 5.7% | 4.9%(+0.845)#54 | 4.9%(+0.853)#5,780 |
| 55. | 03856 | 5.7% | 4.9%(+0.794)#55 | 4.9%(+0.803)#5,875 |
| 56. | 03833 | 5.7% | 4.9%(+0.794)#56 | 4.9%(+0.802)#5,876 |
| 57. | 03070 | 5.6% | 4.9%(+0.711)#57 | 4.9%(+0.720)#6,041 |
| 58. | 03077 | 5.6% | 4.9%(+0.702)#58 | 4.9%(+0.711)#6,059 |
| 59. | 03868 | 5.6% | 4.9%(+0.677)#59 | 4.9%(+0.685)#6,115 |
| 60. | 03848 | 5.6% | 4.9%(+0.674)#60 | 4.9%(+0.682)#6,123 |
| 61. | 03755 | 5.6% | 4.9%(+0.669)#61 | 4.9%(+0.677)#6,135 |
| 62. | 03076 | 5.5% | 4.9%(+0.636)#62 | 4.9%(+0.644)#6,227 |
| 63. | 03782 | 5.5% | 4.9%(+0.610)#63 | 4.9%(+0.619)#6,275 |
| 64. | 03109 | 5.5% | 4.9%(+0.599)#64 | 4.9%(+0.608)#6,297 |
| 65. | 03823 | 5.5% | 4.9%(+0.577)#65 | 4.9%(+0.585)#6,351 |
| 66. | 03820 | 5.4% | 4.9%(+0.529)#66 | 4.9%(+0.538)#6,439 |
| 67. | 03827 | 5.4% | 4.9%(+0.450)#67 | 4.9%(+0.459)#6,634 |
| 68. | 03878 | 5.3% | 4.9%(+0.443)#68 | 4.9%(+0.451)#6,652 |
| 69. | 03440 | 5.2% | 4.9%(+0.323)#69 | 4.9%(+0.332)#6,932 |
| 70. | 03817 | 5.2% | 4.9%(+0.315)#70 | 4.9%(+0.323)#6,950 |
| 71. | 03810 | 5.1% | 4.9%(+0.182)#71 | 4.9%(+0.191)#7,247 |
| 72. | 03819 | 5.1% | 4.9%(+0.167)#72 | 4.9%(+0.175)#7,283 |
| 73. | 03259 | 5.0% | 4.9%(+0.134)#73 | 4.9%(+0.142)#7,370 |
| 74. | 03281 | 4.9% | 4.9%(-0.018)#74 | 4.9%(-0.010)#7,736 |
| 75. | 03748 | 4.9% | 4.9%(-0.019)#75 | 4.9%(-0.010)#7,738 |
| 76. | 03103 | 4.8% | 4.9%(-0.095)#76 | 4.9%(-0.086)#7,962 |
| 77. | 03104 | 4.8% | 4.9%(-0.100)#77 | 4.9%(-0.091)#7,978 |
| 78. | 03053 | 4.8% | 4.9%(-0.121)#78 | 4.9%(-0.113)#8,045 |
| 79. | 03246 | 4.8% | 4.9%(-0.124)#79 | 4.9%(-0.115)#8,053 |
| 80. | 03448 | 4.8% | 4.9%(-0.140)#80 | 4.9%(-0.132)#8,092 |
| 81. | 03244 | 4.7% | 4.9%(-0.164)#81 | 4.9%(-0.156)#8,158 |
| 82. | 03225 | 4.7% | 4.9%(-0.198)#82 | 4.9%(-0.190)#8,255 |
| 83. | 03451 | 4.7% | 4.9%(-0.228)#83 | 4.9%(-0.219)#8,351 |
| 84. | 03110 | 4.7% | 4.9%(-0.228)#84 | 4.9%(-0.220)#8,352 |
| 85. | 03102 | 4.7% | 4.9%(-0.252)#85 | 4.9%(-0.243)#8,429 |
| 86. | 03052 | 4.6% | 4.9%(-0.288)#86 | 4.9%(-0.280)#8,534 |
| 87. | 03844 | 4.6% | 4.9%(-0.317)#87 | 4.9%(-0.309)#8,605 |
| 88. | 03221 | 4.6% | 4.9%(-0.330)#88 | 4.9%(-0.322)#8,641 |
| 89. | 03874 | 4.5% | 4.9%(-0.362)#89 | 4.9%(-0.354)#8,744 |
| 90. | 03307 | 4.5% | 4.9%(-0.411)#90 | 4.9%(-0.402)#8,901 |
| 91. | 03801 | 4.5% | 4.9%(-0.428)#91 | 4.9%(-0.420)#8,956 |
| 92. | 03862 | 4.4% | 4.9%(-0.463)#92 | 4.9%(-0.454)#9,064 |
| 93. | 03593 | 4.4% | 4.9%(-0.523)#93 | 4.9%(-0.514)#9,267 |
| 94. | 03883 | 4.3% | 4.9%(-0.555)#94 | 4.9%(-0.546)#9,366 |
| 95. | 03753 | 4.3% | 4.9%(-0.576)#95 | 4.9%(-0.567)#9,450 |
| 96. | 03872 | 4.3% | 4.9%(-0.591)#96 | 4.9%(-0.583)#9,505 |
| 97. | 03858 | 4.3% | 4.9%(-0.593)#97 | 4.9%(-0.585)#9,513 |
| 98. | 03086 | 4.3% | 4.9%(-0.597)#98 | 4.9%(-0.588)#9,521 |
| 99. | 03431 | 4.3% | 4.9%(-0.609)#99 | 4.9%(-0.601)#9,555 |
| 100. | 03038 | 4.3% | 4.9%(-0.630)#100 | 4.9%(-0.621)#9,611 |
Common Questions
What are the Top 10 Zip Codes with the Highest Percentage of Population with a Degree in Computers and Mathematics in New Hampshire?
Top 10 Zip Codes with the Highest Percentage of Population with a Degree in Computers and Mathematics in New Hampshire are:
What zip code has the Highest Percentage of Population with a Degree in Computers and Mathematics in New Hampshire?
03238 has the Highest Percentage of Population with a Degree in Computers and Mathematics in New Hampshire with 62.5%.
What is the Percentage of Population with a Degree in Computers and Mathematics in the State of New Hampshire?
Percentage of Population with a Degree in Computers and Mathematics in New Hampshire is 4.9%.
What is the Percentage of Population with a Degree in Computers and Mathematics in the United States?
Percentage of Population with a Degree in Computers and Mathematics in the United States is 4.9%.