Zip Codes with the Highest Percentage of Population with a Degree in Computers and Mathematics in Puerto Rico
RELATED REPORTS & OPTIONS
Computers and Mathematics
Puerto Rico
Compare Zip Codes
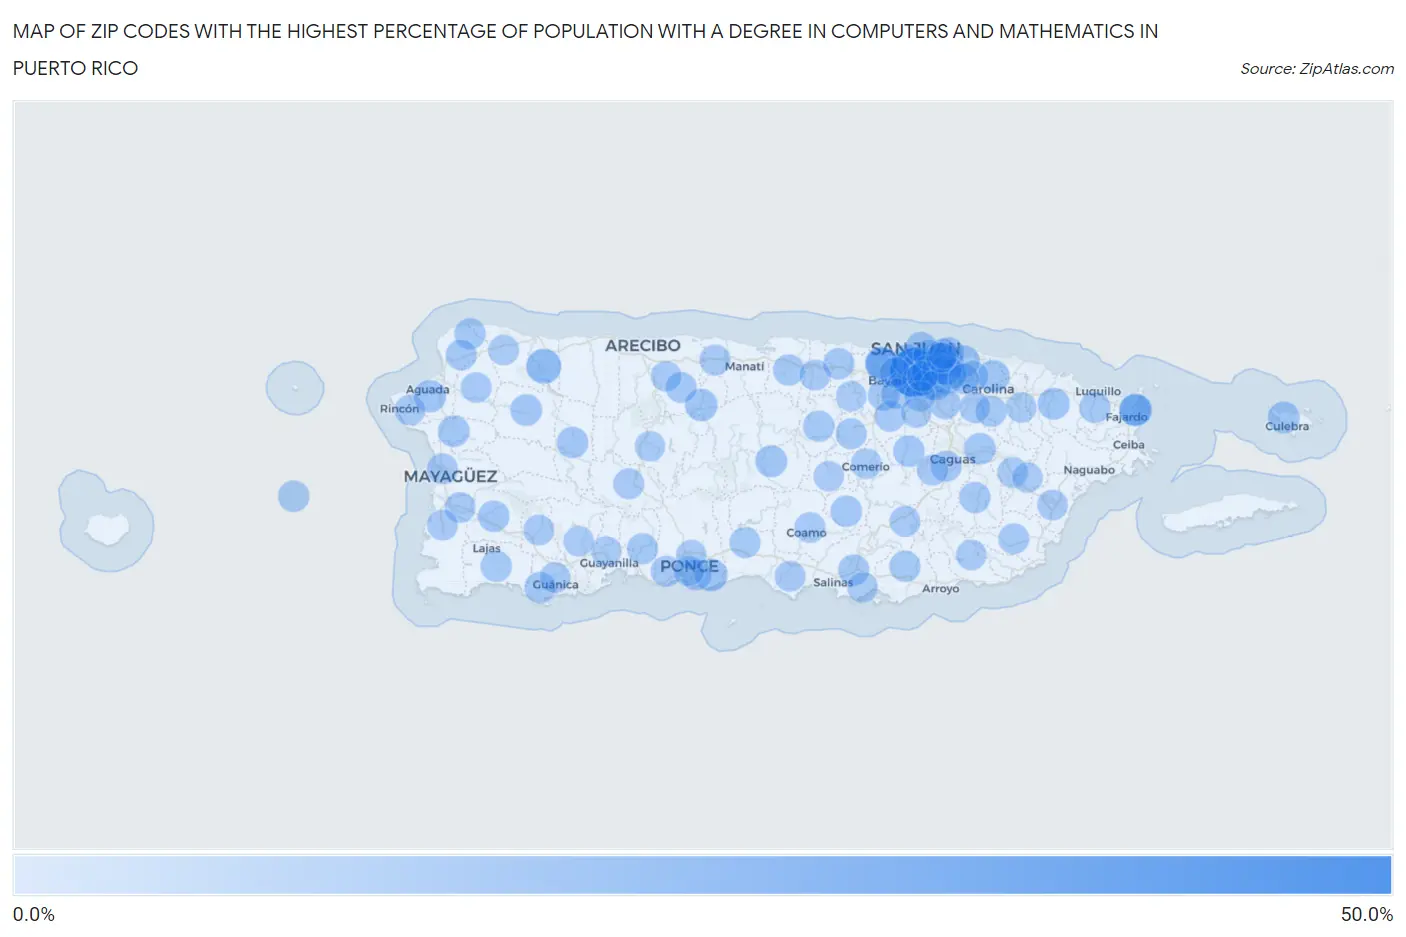
Map of Zip Codes with the Highest Percentage of Population with a Degree in Computers and Mathematics in Puerto Rico
0.0%
50.0%
Zip Codes with the Highest Percentage of Population with a Degree in Computers and Mathematics in Puerto Rico
| Zip Code | % Graduates | vs State | vs National | |
| 1. | 00934 | 45.0% | 2.9%(+42.1)#1 | 4.9%(+40.1)#110 |
| 2. | 00678 | 11.7% | 2.9%(+8.74)#2 | 4.9%(+6.76)#1,293 |
| 3. | 00952 | 9.4% | 2.9%(+6.53)#3 | 4.9%(+4.55)#1,995 |
| 4. | 00909 | 7.0% | 2.9%(+4.14)#4 | 4.9%(+2.15)#3,773 |
| 5. | 00715 | 6.8% | 2.9%(+3.88)#5 | 4.9%(+1.90)#4,081 |
| 6. | 00650 | 6.3% | 2.9%(+3.34)#6 | 4.9%(+1.36)#4,839 |
| 7. | 00915 | 5.8% | 2.9%(+2.93)#7 | 4.9%(+0.944)#5,609 |
| 8. | 00740 | 5.8% | 2.9%(+2.88)#8 | 4.9%(+0.894)#5,689 |
| 9. | 00602 | 5.7% | 2.9%(+2.83)#9 | 4.9%(+0.845)#5,799 |
| 10. | 00965 | 5.7% | 2.9%(+2.75)#10 | 4.9%(+0.766)#5,953 |
| 11. | 00775 | 5.3% | 2.9%(+2.39)#11 | 4.9%(+0.409)#6,747 |
| 12. | 00979 | 5.3% | 2.9%(+2.37)#12 | 4.9%(+0.391)#6,794 |
| 13. | 00738 | 5.1% | 2.9%(+2.19)#13 | 4.9%(+0.204)#7,216 |
| 14. | 00985 | 5.1% | 2.9%(+2.18)#14 | 4.9%(+0.195)#7,241 |
| 15. | 00745 | 5.0% | 2.9%(+2.07)#15 | 4.9%(+0.087)#7,497 |
| 16. | 00720 | 4.8% | 2.9%(+1.85)#16 | 4.9%(-0.129)#8,079 |
| 17. | 00949 | 4.7% | 2.9%(+1.81)#17 | 4.9%(-0.172)#8,212 |
| 18. | 00685 | 4.6% | 2.9%(+1.66)#18 | 4.9%(-0.326)#8,652 |
| 19. | 00921 | 4.4% | 2.9%(+1.50)#19 | 4.9%(-0.481)#9,151 |
| 20. | 00925 | 4.4% | 2.9%(+1.47)#20 | 4.9%(-0.511)#9,257 |
| 21. | 00778 | 4.3% | 2.9%(+1.42)#21 | 4.9%(-0.560)#9,418 |
| 22. | 00610 | 4.3% | 2.9%(+1.42)#22 | 4.9%(-0.566)#9,446 |
| 23. | 00962 | 4.2% | 2.9%(+1.26)#23 | 4.9%(-0.720)#9,915 |
| 24. | 00703 | 4.1% | 2.9%(+1.23)#24 | 4.9%(-0.753)#10,024 |
| 25. | 00680 | 4.0% | 2.9%(+1.10)#25 | 4.9%(-0.878)#10,410 |
| 26. | 00957 | 4.0% | 2.9%(+1.09)#26 | 4.9%(-0.891)#10,444 |
| 27. | 00669 | 4.0% | 2.9%(+1.09)#27 | 4.9%(-0.891)#10,446 |
| 28. | 00901 | 4.0% | 2.9%(+1.06)#28 | 4.9%(-0.921)#10,544 |
| 29. | 00920 | 3.9% | 2.9%(+0.959)#29 | 4.9%(-1.02)#10,899 |
| 30. | 00683 | 3.8% | 2.9%(+0.923)#30 | 4.9%(-1.06)#11,056 |
| 31. | 00982 | 3.8% | 2.9%(+0.901)#31 | 4.9%(-1.08)#11,141 |
| 32. | 00705 | 3.8% | 2.9%(+0.841)#32 | 4.9%(-1.14)#11,359 |
| 33. | 00646 | 3.7% | 2.9%(+0.823)#33 | 4.9%(-1.16)#11,412 |
| 34. | 00783 | 3.7% | 2.9%(+0.780)#34 | 4.9%(-1.20)#11,572 |
| 35. | 00690 | 3.6% | 2.9%(+0.703)#35 | 4.9%(-1.28)#11,842 |
| 36. | 00784 | 3.6% | 2.9%(+0.665)#36 | 4.9%(-1.32)#11,974 |
| 37. | 00966 | 3.6% | 2.9%(+0.652)#37 | 4.9%(-1.33)#12,047 |
| 38. | 00987 | 3.5% | 2.9%(+0.603)#38 | 4.9%(-1.38)#12,230 |
| 39. | 00918 | 3.5% | 2.9%(+0.577)#39 | 4.9%(-1.41)#12,330 |
| 40. | 00693 | 3.5% | 2.9%(+0.564)#40 | 4.9%(-1.42)#12,376 |
| 41. | 00667 | 3.4% | 2.9%(+0.492)#41 | 4.9%(-1.49)#12,652 |
| 42. | 00926 | 3.4% | 2.9%(+0.470)#42 | 4.9%(-1.51)#12,720 |
| 43. | 00647 | 3.4% | 2.9%(+0.440)#43 | 4.9%(-1.54)#12,823 |
| 44. | 00754 | 3.3% | 2.9%(+0.422)#44 | 4.9%(-1.56)#12,883 |
| 45. | 00773 | 3.3% | 2.9%(+0.400)#45 | 4.9%(-1.58)#12,980 |
| 46. | 00624 | 3.1% | 2.9%(+0.223)#46 | 4.9%(-1.76)#13,599 |
| 47. | 00913 | 3.1% | 2.9%(+0.181)#47 | 4.9%(-1.80)#13,751 |
| 48. | 00751 | 3.0% | 2.9%(+0.093)#48 | 4.9%(-1.89)#14,086 |
| 49. | 00603 | 3.0% | 2.9%(+0.061)#49 | 4.9%(-1.92)#14,170 |
| 50. | 00688 | 3.0% | 2.9%(+0.050)#50 | 4.9%(-1.93)#14,205 |
| 51. | 00907 | 2.9% | 2.9%(+0.014)#51 | 4.9%(-1.97)#14,340 |
| 52. | 00795 | 2.9% | 2.9%(-0.019)#52 | 4.9%(-2.00)#14,450 |
| 53. | 00927 | 2.9% | 2.9%(-0.037)#53 | 4.9%(-2.02)#14,520 |
| 54. | 00719 | 2.9% | 2.9%(-0.039)#54 | 4.9%(-2.02)#14,532 |
| 55. | 00923 | 2.9% | 2.9%(-0.061)#55 | 4.9%(-2.04)#14,607 |
| 56. | 00601 | 2.8% | 2.9%(-0.074)#56 | 4.9%(-2.06)#14,657 |
| 57. | 00682 | 2.8% | 2.9%(-0.090)#57 | 4.9%(-2.07)#14,713 |
| 58. | 00617 | 2.8% | 2.9%(-0.155)#58 | 4.9%(-2.14)#14,961 |
| 59. | 00692 | 2.7% | 2.9%(-0.166)#59 | 4.9%(-2.15)#14,996 |
| 60. | 00728 | 2.7% | 2.9%(-0.167)#60 | 4.9%(-2.15)#15,000 |
| 61. | 00725 | 2.7% | 2.9%(-0.179)#61 | 4.9%(-2.16)#15,045 |
| 62. | 00976 | 2.7% | 2.9%(-0.201)#62 | 4.9%(-2.18)#15,117 |
| 63. | 00956 | 2.7% | 2.9%(-0.214)#63 | 4.9%(-2.20)#15,177 |
| 64. | 00660 | 2.7% | 2.9%(-0.260)#64 | 4.9%(-2.24)#15,337 |
| 65. | 00727 | 2.5% | 2.9%(-0.404)#65 | 4.9%(-2.39)#15,864 |
| 66. | 00623 | 2.5% | 2.9%(-0.409)#66 | 4.9%(-2.39)#15,881 |
| 67. | 00716 | 2.5% | 2.9%(-0.412)#67 | 4.9%(-2.39)#15,885 |
| 68. | 00767 | 2.5% | 2.9%(-0.415)#68 | 4.9%(-2.40)#15,912 |
| 69. | 00917 | 2.5% | 2.9%(-0.416)#69 | 4.9%(-2.40)#15,916 |
| 70. | 00736 | 2.5% | 2.9%(-0.428)#70 | 4.9%(-2.41)#15,977 |
| 71. | 00757 | 2.4% | 2.9%(-0.487)#71 | 4.9%(-2.47)#16,173 |
| 72. | 00959 | 2.4% | 2.9%(-0.545)#72 | 4.9%(-2.53)#16,377 |
| 73. | 00677 | 2.3% | 2.9%(-0.570)#73 | 4.9%(-2.55)#16,446 |
| 74. | 00769 | 2.3% | 2.9%(-0.610)#74 | 4.9%(-2.59)#16,584 |
| 75. | 00653 | 2.3% | 2.9%(-0.617)#75 | 4.9%(-2.60)#16,606 |
| 76. | 00961 | 2.2% | 2.9%(-0.685)#76 | 4.9%(-2.67)#16,863 |
| 77. | 00969 | 2.2% | 2.9%(-0.726)#77 | 4.9%(-2.71)#17,011 |
| 78. | 00676 | 2.2% | 2.9%(-0.730)#78 | 4.9%(-2.71)#17,022 |
| 79. | 00637 | 2.2% | 2.9%(-0.731)#79 | 4.9%(-2.71)#17,031 |
| 80. | 00782 | 2.1% | 2.9%(-0.791)#80 | 4.9%(-2.77)#17,236 |
| 81. | 00791 | 2.1% | 2.9%(-0.827)#81 | 4.9%(-2.81)#17,329 |
| 82. | 00924 | 2.0% | 2.9%(-0.873)#82 | 4.9%(-2.86)#17,492 |
| 83. | 00612 | 2.0% | 2.9%(-0.900)#83 | 4.9%(-2.88)#17,595 |
| 84. | 00723 | 2.0% | 2.9%(-0.962)#84 | 4.9%(-2.94)#17,786 |
| 85. | 00717 | 1.9% | 2.9%(-0.962)#85 | 4.9%(-2.94)#17,787 |
| 86. | 00777 | 1.9% | 2.9%(-0.968)#86 | 4.9%(-2.95)#17,809 |
| 87. | 00771 | 1.9% | 2.9%(-0.992)#87 | 4.9%(-2.97)#17,880 |
| 88. | 00656 | 1.9% | 2.9%(-0.993)#88 | 4.9%(-2.98)#17,884 |
| 89. | 00971 | 1.9% | 2.9%(-0.996)#89 | 4.9%(-2.98)#17,892 |
| 90. | 00704 | 1.9% | 2.9%(-0.999)#90 | 4.9%(-2.98)#17,902 |
| 91. | 00662 | 1.9% | 2.9%(-1.02)#91 | 4.9%(-3.00)#17,950 |
| 92. | 00698 | 1.9% | 2.9%(-1.02)#92 | 4.9%(-3.01)#17,966 |
| 93. | 00729 | 1.8% | 2.9%(-1.12)#93 | 4.9%(-3.10)#18,248 |
| 94. | 00968 | 1.8% | 2.9%(-1.13)#94 | 4.9%(-3.11)#18,294 |
| 95. | 00794 | 1.8% | 2.9%(-1.15)#95 | 4.9%(-3.14)#18,359 |
| 96. | 00953 | 1.7% | 2.9%(-1.26)#96 | 4.9%(-3.24)#18,690 |
| 97. | 00730 | 1.6% | 2.9%(-1.30)#97 | 4.9%(-3.29)#18,834 |
| 98. | 00641 | 1.6% | 2.9%(-1.31)#98 | 4.9%(-3.29)#18,845 |
| 99. | 00911 | 1.6% | 2.9%(-1.34)#99 | 4.9%(-3.32)#18,928 |
| 100. | 00912 | 1.6% | 2.9%(-1.34)#100 | 4.9%(-3.33)#18,940 |
1
2Common Questions
What are the Top 10 Zip Codes with the Highest Percentage of Population with a Degree in Computers and Mathematics in Puerto Rico?
Top 10 Zip Codes with the Highest Percentage of Population with a Degree in Computers and Mathematics in Puerto Rico are:
What zip code has the Highest Percentage of Population with a Degree in Computers and Mathematics in Puerto Rico?
00934 has the Highest Percentage of Population with a Degree in Computers and Mathematics in Puerto Rico with 45.0%.
What is the Percentage of Population with a Degree in Computers and Mathematics in the State of Puerto Rico?
Percentage of Population with a Degree in Computers and Mathematics in Puerto Rico is 2.9%.
What is the Percentage of Population with a Degree in Computers and Mathematics in the United States?
Percentage of Population with a Degree in Computers and Mathematics in the United States is 4.9%.