Zip Codes with the Highest Percentage of Population with a Degree in Computers and Mathematics in Nebraska
RELATED REPORTS & OPTIONS
Computers and Mathematics
Nebraska
Compare Zip Codes
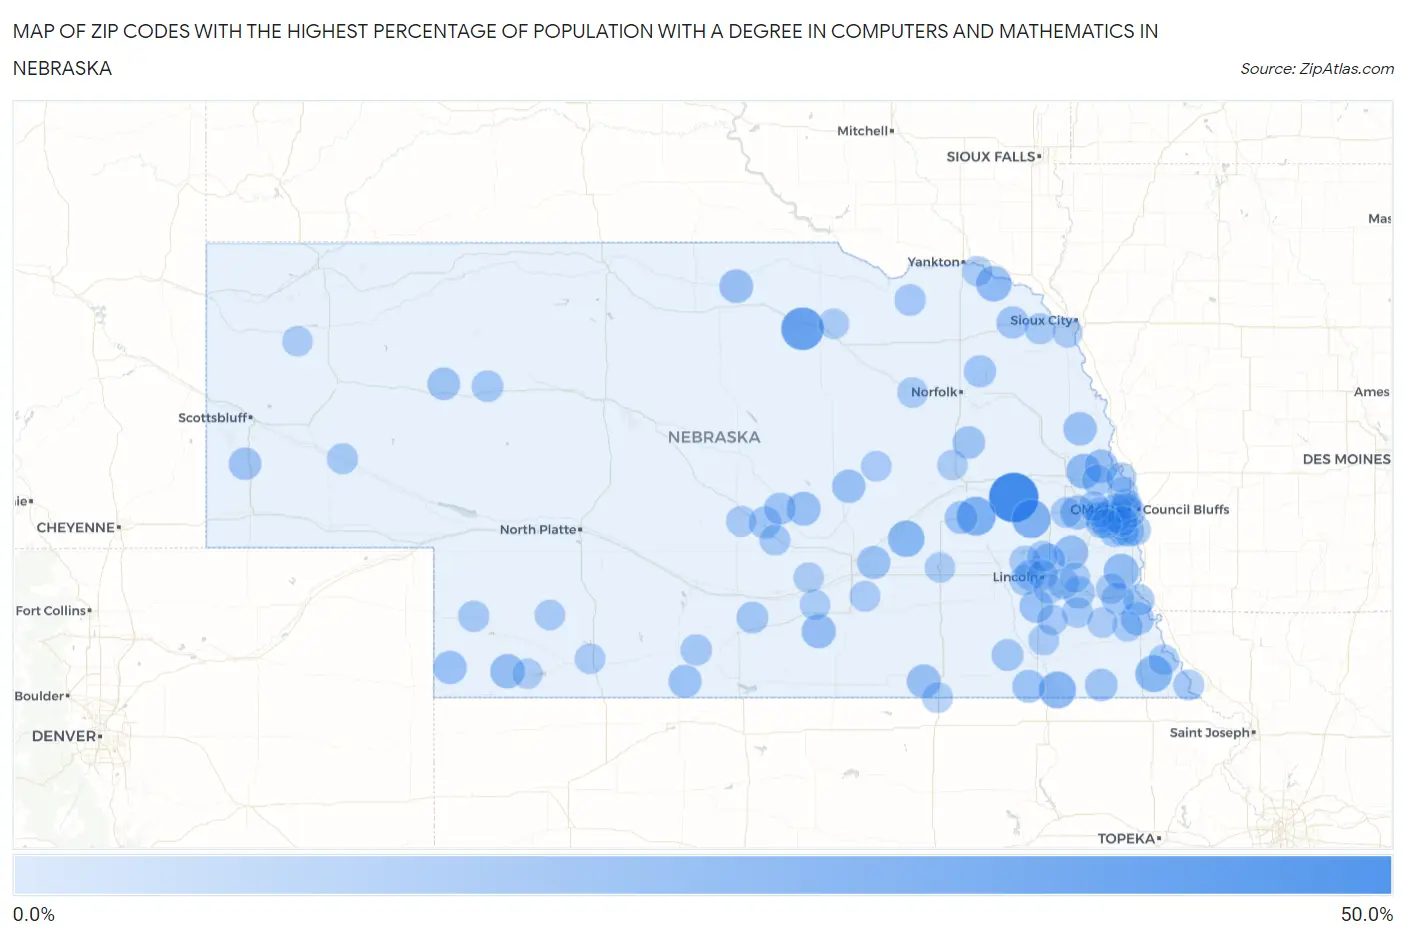
Map of Zip Codes with the Highest Percentage of Population with a Degree in Computers and Mathematics in Nebraska
0.0%
50.0%
Zip Codes with the Highest Percentage of Population with a Degree in Computers and Mathematics in Nebraska
| Zip Code | % Graduates | vs State | vs National | |
| 1. | 68001 | 50.0% | 3.8%(+46.2)#1 | 4.9%(+45.1)#87 |
| 2. | 68734 | 33.3% | 3.8%(+29.5)#2 | 4.9%(+28.4)#191 |
| 3. | 68658 | 24.1% | 3.8%(+20.3)#3 | 4.9%(+19.2)#324 |
| 4. | 68070 | 23.8% | 3.8%(+20.0)#4 | 4.9%(+18.9)#340 |
| 5. | 68309 | 20.0% | 3.8%(+16.2)#5 | 4.9%(+15.1)#472 |
| 6. | 68457 | 19.4% | 3.8%(+15.6)#6 | 4.9%(+14.6)#489 |
| 7. | 68846 | 18.8% | 3.8%(+15.0)#7 | 4.9%(+13.9)#522 |
| 8. | 68792 | 16.3% | 3.8%(+12.5)#8 | 4.9%(+11.4)#673 |
| 9. | 68413 | 15.3% | 3.8%(+11.5)#9 | 4.9%(+10.4)#762 |
| 10. | 68002 | 15.1% | 3.8%(+11.3)#10 | 4.9%(+10.2)#782 |
| 11. | 69037 | 14.0% | 3.8%(+10.2)#11 | 4.9%(+9.14)#904 |
| 12. | 68073 | 13.5% | 3.8%(+9.72)#12 | 4.9%(+8.62)#976 |
| 13. | 68366 | 13.4% | 3.8%(+9.64)#13 | 4.9%(+8.55)#988 |
| 14. | 68950 | 13.3% | 3.8%(+9.54)#14 | 4.9%(+8.44)#1,008 |
| 15. | 68817 | 13.0% | 3.8%(+9.25)#15 | 4.9%(+8.15)#1,050 |
| 16. | 68759 | 12.8% | 3.8%(+8.97)#16 | 4.9%(+7.87)#1,081 |
| 17. | 68340 | 12.6% | 3.8%(+8.85)#17 | 4.9%(+7.75)#1,102 |
| 18. | 68008 | 12.3% | 3.8%(+8.46)#18 | 4.9%(+7.36)#1,176 |
| 19. | 69030 | 11.8% | 3.8%(+7.97)#19 | 4.9%(+6.87)#1,272 |
| 20. | 68404 | 11.7% | 3.8%(+7.85)#20 | 4.9%(+6.76)#1,295 |
| 21. | 68882 | 11.6% | 3.8%(+7.83)#21 | 4.9%(+6.73)#1,302 |
| 22. | 68019 | 11.5% | 3.8%(+7.68)#22 | 4.9%(+6.58)#1,333 |
| 23. | 68865 | 11.3% | 3.8%(+7.51)#23 | 4.9%(+6.42)#1,375 |
| 24. | 68379 | 11.1% | 3.8%(+7.31)#24 | 4.9%(+6.22)#1,433 |
| 25. | 68926 | 10.9% | 3.8%(+7.14)#25 | 4.9%(+6.04)#1,471 |
| 26. | 68662 | 10.8% | 3.8%(+6.97)#26 | 4.9%(+5.88)#1,508 |
| 27. | 68415 | 10.6% | 3.8%(+6.84)#27 | 4.9%(+5.74)#1,541 |
| 28. | 68514 | 10.6% | 3.8%(+6.82)#28 | 4.9%(+5.73)#1,549 |
| 29. | 69333 | 10.0% | 3.8%(+6.20)#29 | 4.9%(+5.11)#1,760 |
| 30. | 68631 | 9.8% | 3.8%(+6.04)#30 | 4.9%(+4.94)#1,820 |
| 31. | 68420 | 9.8% | 3.8%(+6.02)#31 | 4.9%(+4.93)#1,828 |
| 32. | 69345 | 9.8% | 3.8%(+6.01)#32 | 4.9%(+4.91)#1,837 |
| 33. | 68852 | 9.1% | 3.8%(+5.29)#33 | 4.9%(+4.20)#2,195 |
| 34. | 68732 | 9.1% | 3.8%(+5.29)#34 | 4.9%(+4.20)#2,204 |
| 35. | 68418 | 9.0% | 3.8%(+5.17)#35 | 4.9%(+4.07)#2,283 |
| 36. | 68740 | 8.9% | 3.8%(+5.06)#36 | 4.9%(+3.96)#2,332 |
| 37. | 68853 | 8.8% | 3.8%(+4.98)#37 | 4.9%(+3.89)#2,382 |
| 38. | 68346 | 8.8% | 3.8%(+4.97)#38 | 4.9%(+3.88)#2,389 |
| 39. | 68940 | 8.0% | 3.8%(+4.20)#39 | 4.9%(+3.11)#2,897 |
| 40. | 68424 | 7.9% | 3.8%(+4.07)#40 | 4.9%(+2.97)#3,010 |
| 41. | 68046 | 7.7% | 3.8%(+3.95)#41 | 4.9%(+2.86)#3,099 |
| 42. | 68133 | 7.7% | 3.8%(+3.92)#42 | 4.9%(+2.82)#3,120 |
| 43. | 68724 | 7.7% | 3.8%(+3.90)#43 | 4.9%(+2.80)#3,168 |
| 44. | 69366 | 7.6% | 3.8%(+3.78)#44 | 4.9%(+2.68)#3,269 |
| 45. | 68410 | 7.3% | 3.8%(+3.48)#45 | 4.9%(+2.38)#3,551 |
| 46. | 68005 | 7.2% | 3.8%(+3.36)#46 | 4.9%(+2.26)#3,678 |
| 47. | 68936 | 7.1% | 3.8%(+3.35)#47 | 4.9%(+2.25)#3,696 |
| 48. | 68137 | 7.0% | 3.8%(+3.20)#48 | 4.9%(+2.10)#3,836 |
| 49. | 69033 | 6.8% | 3.8%(+2.96)#49 | 4.9%(+1.86)#4,138 |
| 50. | 68135 | 6.5% | 3.8%(+2.70)#50 | 4.9%(+1.60)#4,475 |
| 51. | 68034 | 6.4% | 3.8%(+2.61)#51 | 4.9%(+1.52)#4,593 |
| 52. | 68123 | 6.3% | 3.8%(+2.52)#52 | 4.9%(+1.43)#4,735 |
| 53. | 68402 | 6.3% | 3.8%(+2.52)#53 | 4.9%(+1.42)#4,746 |
| 54. | 68532 | 6.2% | 3.8%(+2.45)#54 | 4.9%(+1.36)#4,853 |
| 55. | 68785 | 6.2% | 3.8%(+2.45)#55 | 4.9%(+1.36)#4,865 |
| 56. | 68136 | 6.2% | 3.8%(+2.42)#56 | 4.9%(+1.32)#4,916 |
| 57. | 68437 | 6.2% | 3.8%(+2.38)#57 | 4.9%(+1.28)#4,989 |
| 58. | 69125 | 6.2% | 3.8%(+2.36)#58 | 4.9%(+1.26)#5,018 |
| 59. | 68844 | 6.1% | 3.8%(+2.33)#59 | 4.9%(+1.23)#5,079 |
| 60. | 68528 | 6.1% | 3.8%(+2.32)#60 | 4.9%(+1.22)#5,093 |
| 61. | 68461 | 6.1% | 3.8%(+2.26)#61 | 4.9%(+1.17)#5,193 |
| 62. | 68344 | 6.1% | 3.8%(+2.26)#62 | 4.9%(+1.17)#5,197 |
| 63. | 68431 | 6.1% | 3.8%(+2.26)#63 | 4.9%(+1.17)#5,199 |
| 64. | 68108 | 6.0% | 3.8%(+2.24)#64 | 4.9%(+1.14)#5,245 |
| 65. | 68131 | 6.0% | 3.8%(+2.18)#65 | 4.9%(+1.08)#5,334 |
| 66. | 68422 | 5.9% | 3.8%(+2.09)#66 | 4.9%(+0.988)#5,527 |
| 67. | 68358 | 5.7% | 3.8%(+1.94)#67 | 4.9%(+0.839)#5,812 |
| 68. | 68327 | 5.7% | 3.8%(+1.92)#68 | 4.9%(+0.820)#5,848 |
| 69. | 68336 | 5.6% | 3.8%(+1.85)#69 | 4.9%(+0.756)#5,977 |
| 70. | 68980 | 5.6% | 3.8%(+1.82)#70 | 4.9%(+0.724)#6,031 |
| 71. | 68417 | 5.6% | 3.8%(+1.76)#71 | 4.9%(+0.662)#6,193 |
| 72. | 68041 | 5.5% | 3.8%(+1.72)#72 | 4.9%(+0.628)#6,260 |
| 73. | 68781 | 5.4% | 3.8%(+1.62)#73 | 4.9%(+0.521)#6,473 |
| 74. | 68127 | 5.4% | 3.8%(+1.57)#74 | 4.9%(+0.472)#6,590 |
| 75. | 68627 | 5.3% | 3.8%(+1.52)#75 | 4.9%(+0.425)#6,716 |
| 76. | 68152 | 5.3% | 3.8%(+1.50)#76 | 4.9%(+0.405)#6,755 |
| 77. | 68114 | 5.2% | 3.8%(+1.44)#77 | 4.9%(+0.345)#6,909 |
| 78. | 68855 | 5.2% | 3.8%(+1.40)#78 | 4.9%(+0.301)#7,004 |
| 79. | 68111 | 5.2% | 3.8%(+1.38)#79 | 4.9%(+0.282)#7,030 |
| 80. | 68763 | 5.1% | 3.8%(+1.35)#80 | 4.9%(+0.255)#7,092 |
| 81. | 68320 | 5.1% | 3.8%(+1.29)#81 | 4.9%(+0.191)#7,253 |
| 82. | 69032 | 5.1% | 3.8%(+1.25)#82 | 4.9%(+0.157)#7,331 |
| 83. | 69001 | 5.0% | 3.8%(+1.24)#83 | 4.9%(+0.144)#7,366 |
| 84. | 68467 | 5.0% | 3.8%(+1.21)#84 | 4.9%(+0.115)#7,432 |
| 85. | 68774 | 5.0% | 3.8%(+1.20)#85 | 4.9%(+0.106)#7,457 |
| 86. | 68023 | 5.0% | 3.8%(+1.16)#86 | 4.9%(+0.062)#7,554 |
| 87. | 68329 | 5.0% | 3.8%(+1.15)#87 | 4.9%(+0.057)#7,566 |
| 88. | 68508 | 4.9% | 3.8%(+1.14)#88 | 4.9%(+0.041)#7,603 |
| 89. | 68653 | 4.9% | 3.8%(+1.08)#89 | 4.9%(-0.016)#7,759 |
| 90. | 69348 | 4.8% | 3.8%(+1.05)#90 | 4.9%(-0.045)#7,854 |
| 91. | 68956 | 4.8% | 3.8%(+1.02)#91 | 4.9%(-0.079)#7,943 |
| 92. | 68157 | 4.8% | 3.8%(+0.993)#92 | 4.9%(-0.104)#8,015 |
| 93. | 69043 | 4.8% | 3.8%(+0.965)#93 | 4.9%(-0.132)#8,097 |
| 94. | 68130 | 4.7% | 3.8%(+0.932)#94 | 4.9%(-0.164)#8,186 |
| 95. | 68516 | 4.7% | 3.8%(+0.913)#95 | 4.9%(-0.184)#8,240 |
| 96. | 68022 | 4.7% | 3.8%(+0.875)#96 | 4.9%(-0.222)#8,362 |
| 97. | 68347 | 4.6% | 3.8%(+0.843)#97 | 4.9%(-0.254)#8,459 |
| 98. | 68876 | 4.6% | 3.8%(+0.805)#98 | 4.9%(-0.291)#8,557 |
| 99. | 68138 | 4.6% | 3.8%(+0.787)#99 | 4.9%(-0.310)#8,607 |
| 100. | 68731 | 4.6% | 3.8%(+0.776)#100 | 4.9%(-0.321)#8,637 |
Common Questions
What are the Top 10 Zip Codes with the Highest Percentage of Population with a Degree in Computers and Mathematics in Nebraska?
Top 10 Zip Codes with the Highest Percentage of Population with a Degree in Computers and Mathematics in Nebraska are:
What zip code has the Highest Percentage of Population with a Degree in Computers and Mathematics in Nebraska?
68001 has the Highest Percentage of Population with a Degree in Computers and Mathematics in Nebraska with 50.0%.
What is the Percentage of Population with a Degree in Computers and Mathematics in the State of Nebraska?
Percentage of Population with a Degree in Computers and Mathematics in Nebraska is 3.8%.
What is the Percentage of Population with a Degree in Computers and Mathematics in the United States?
Percentage of Population with a Degree in Computers and Mathematics in the United States is 4.9%.