Zip Codes with the Highest Percentage of Population with a Degree in Computers and Mathematics in Arkansas
RELATED REPORTS & OPTIONS
Computers and Mathematics
Arkansas
Compare Zip Codes
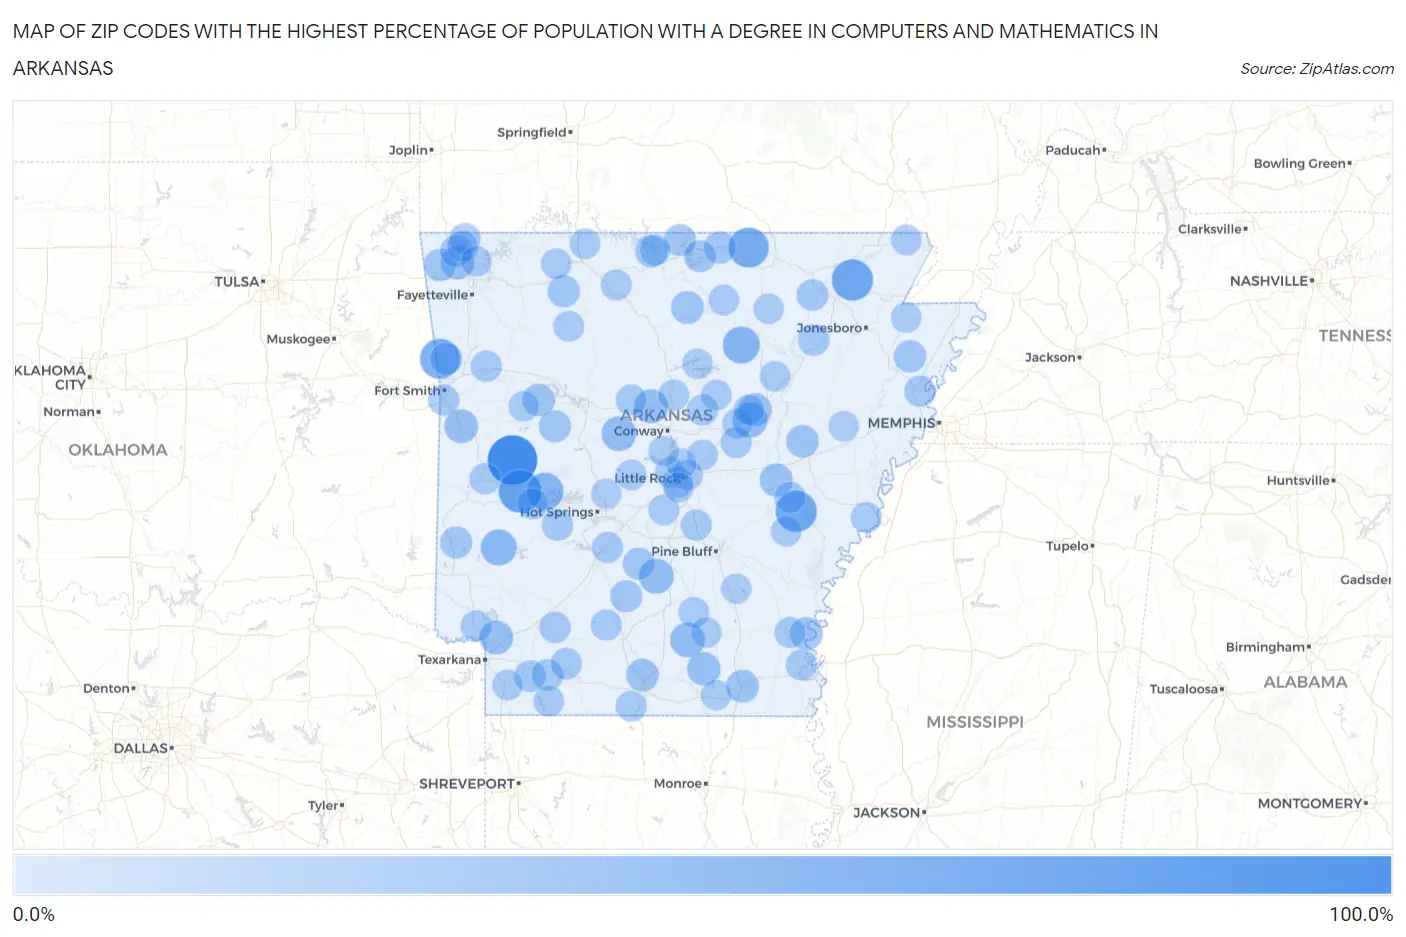
Map of Zip Codes with the Highest Percentage of Population with a Degree in Computers and Mathematics in Arkansas
0.0%
100.0%
Zip Codes with the Highest Percentage of Population with a Degree in Computers and Mathematics in Arkansas
| Zip Code | % Graduates | vs State | vs National | |
| 1. | 72841 | 84.8% | 4.0%(+80.7)#1 | 4.9%(+79.9)#25 |
| 2. | 71965 | 55.6% | 4.0%(+51.5)#2 | 4.9%(+50.7)#59 |
| 3. | 72026 | 50.0% | 4.0%(+46.0)#3 | 4.9%(+45.1)#82 |
| 4. | 72449 | 50.0% | 4.0%(+46.0)#4 | 4.9%(+45.1)#85 |
| 5. | 72520 | 45.5% | 4.0%(+41.4)#5 | 4.9%(+40.6)#103 |
| 6. | 72955 | 45.0% | 4.0%(+41.0)#6 | 4.9%(+40.1)#109 |
| 7. | 72550 | 32.1% | 4.0%(+28.1)#7 | 4.9%(+27.2)#199 |
| 8. | 71970 | 31.9% | 4.0%(+27.9)#8 | 4.9%(+27.1)#202 |
| 9. | 71959 | 28.2% | 4.0%(+24.2)#9 | 4.9%(+23.3)#251 |
| 10. | 72068 | 24.2% | 4.0%(+20.2)#10 | 4.9%(+19.3)#318 |
| 11. | 71725 | 23.8% | 4.0%(+19.8)#11 | 4.9%(+18.9)#338 |
| 12. | 71631 | 23.1% | 4.0%(+19.0)#12 | 4.9%(+18.2)#358 |
| 13. | 72001 | 22.2% | 4.0%(+18.2)#13 | 4.9%(+17.3)#384 |
| 14. | 72157 | 20.2% | 4.0%(+16.2)#14 | 4.9%(+15.3)#454 |
| 15. | 71853 | 19.0% | 4.0%(+15.0)#15 | 4.9%(+14.2)#504 |
| 16. | 72940 | 18.8% | 4.0%(+14.8)#16 | 4.9%(+13.9)#518 |
| 17. | 72082 | 18.1% | 4.0%(+14.1)#17 | 4.9%(+13.2)#561 |
| 18. | 72713 | 17.4% | 4.0%(+13.4)#18 | 4.9%(+12.5)#591 |
| 19. | 71647 | 17.2% | 4.0%(+13.2)#19 | 4.9%(+12.3)#612 |
| 20. | 72041 | 16.7% | 4.0%(+12.6)#20 | 4.9%(+11.8)#644 |
| 21. | 71630 | 15.6% | 4.0%(+11.5)#21 | 4.9%(+10.7)#743 |
| 22. | 71646 | 15.3% | 4.0%(+11.3)#22 | 4.9%(+10.4)#761 |
| 23. | 72533 | 15.1% | 4.0%(+11.1)#23 | 4.9%(+10.2)#778 |
| 24. | 72036 | 14.3% | 4.0%(+10.2)#24 | 4.9%(+9.39)#869 |
| 25. | 72865 | 14.0% | 4.0%(+10.0)#25 | 4.9%(+9.15)#903 |
| 26. | 71759 | 14.0% | 4.0%(+9.92)#26 | 4.9%(+9.06)#913 |
| 27. | 72354 | 13.6% | 4.0%(+9.54)#27 | 4.9%(+8.69)#965 |
| 28. | 72734 | 13.6% | 4.0%(+9.53)#28 | 4.9%(+8.67)#967 |
| 29. | 72583 | 12.8% | 4.0%(+8.81)#29 | 4.9%(+7.95)#1,072 |
| 30. | 72624 | 12.8% | 4.0%(+8.73)#30 | 4.9%(+7.87)#1,083 |
| 31. | 72084 | 12.5% | 4.0%(+8.46)#31 | 4.9%(+7.61)#1,129 |
| 32. | 72619 | 12.5% | 4.0%(+8.42)#32 | 4.9%(+7.56)#1,146 |
| 33. | 72932 | 12.3% | 4.0%(+8.26)#33 | 4.9%(+7.40)#1,168 |
| 34. | 72719 | 12.0% | 4.0%(+8.00)#34 | 4.9%(+7.14)#1,208 |
| 35. | 72824 | 12.0% | 4.0%(+7.96)#35 | 4.9%(+7.11)#1,215 |
| 36. | 71973 | 12.0% | 4.0%(+7.96)#36 | 4.9%(+7.11)#1,216 |
| 37. | 71763 | 11.9% | 4.0%(+7.81)#37 | 4.9%(+6.96)#1,242 |
| 38. | 72623 | 11.4% | 4.0%(+7.33)#38 | 4.9%(+6.47)#1,357 |
| 39. | 72531 | 11.1% | 4.0%(+7.07)#39 | 4.9%(+6.22)#1,426 |
| 40. | 72458 | 10.6% | 4.0%(+6.57)#40 | 4.9%(+5.71)#1,552 |
| 41. | 71845 | 10.4% | 4.0%(+6.35)#41 | 4.9%(+5.50)#1,616 |
| 42. | 71860 | 10.4% | 4.0%(+6.34)#42 | 4.9%(+5.49)#1,618 |
| 43. | 72473 | 9.9% | 4.0%(+5.84)#43 | 4.9%(+4.98)#1,804 |
| 44. | 71770 | 9.7% | 4.0%(+5.63)#44 | 4.9%(+4.77)#1,896 |
| 45. | 71933 | 9.6% | 4.0%(+5.57)#45 | 4.9%(+4.71)#1,922 |
| 46. | 71835 | 9.2% | 4.0%(+5.16)#46 | 4.9%(+4.30)#2,113 |
| 47. | 72384 | 9.1% | 4.0%(+5.05)#47 | 4.9%(+4.20)#2,193 |
| 48. | 71941 | 9.0% | 4.0%(+4.97)#48 | 4.9%(+4.11)#2,252 |
| 49. | 72714 | 8.8% | 4.0%(+4.73)#49 | 4.9%(+3.87)#2,392 |
| 50. | 72947 | 8.7% | 4.0%(+4.69)#50 | 4.9%(+3.83)#2,410 |
| 51. | 72111 | 8.5% | 4.0%(+4.50)#51 | 4.9%(+3.64)#2,517 |
| 52. | 72908 | 8.5% | 4.0%(+4.46)#52 | 4.9%(+3.61)#2,537 |
| 53. | 72926 | 8.5% | 4.0%(+4.41)#53 | 4.9%(+3.56)#2,569 |
| 54. | 72134 | 8.4% | 4.0%(+4.38)#54 | 4.9%(+3.53)#2,585 |
| 55. | 71822 | 8.3% | 4.0%(+4.24)#55 | 4.9%(+3.38)#2,689 |
| 56. | 72642 | 8.3% | 4.0%(+4.22)#56 | 4.9%(+3.37)#2,698 |
| 57. | 72712 | 8.2% | 4.0%(+4.14)#57 | 4.9%(+3.28)#2,761 |
| 58. | 71749 | 8.1% | 4.0%(+4.07)#58 | 4.9%(+3.21)#2,817 |
| 59. | 71726 | 8.0% | 4.0%(+4.01)#59 | 4.9%(+3.15)#2,864 |
| 60. | 72176 | 8.0% | 4.0%(+3.96)#60 | 4.9%(+3.11)#2,891 |
| 61. | 72063 | 7.9% | 4.0%(+3.87)#61 | 4.9%(+3.01)#2,972 |
| 62. | 72132 | 7.9% | 4.0%(+3.85)#62 | 4.9%(+2.99)#2,988 |
| 63. | 71653 | 7.9% | 4.0%(+3.83)#63 | 4.9%(+2.97)#3,012 |
| 64. | 71957 | 7.8% | 4.0%(+3.76)#64 | 4.9%(+2.91)#3,063 |
| 65. | 72204 | 7.7% | 4.0%(+3.68)#65 | 4.9%(+2.83)#3,115 |
| 66. | 71654 | 7.6% | 4.0%(+3.60)#66 | 4.9%(+2.74)#3,210 |
| 67. | 72633 | 7.4% | 4.0%(+3.33)#67 | 4.9%(+2.47)#3,461 |
| 68. | 72039 | 7.2% | 4.0%(+3.18)#68 | 4.9%(+2.33)#3,608 |
| 69. | 72342 | 7.2% | 4.0%(+3.12)#69 | 4.9%(+2.26)#3,674 |
| 70. | 72076 | 6.9% | 4.0%(+2.84)#70 | 4.9%(+1.98)#3,968 |
| 71. | 72456 | 6.8% | 4.0%(+2.78)#71 | 4.9%(+1.92)#4,045 |
| 72. | 72011 | 6.8% | 4.0%(+2.77)#72 | 4.9%(+1.91)#4,061 |
| 73. | 72628 | 6.8% | 4.0%(+2.74)#73 | 4.9%(+1.89)#4,101 |
| 74. | 71861 | 6.5% | 4.0%(+2.51)#74 | 4.9%(+1.65)#4,395 |
| 75. | 72662 | 6.5% | 4.0%(+2.48)#75 | 4.9%(+1.63)#4,428 |
| 76. | 72114 | 6.4% | 4.0%(+2.39)#76 | 4.9%(+1.53)#4,566 |
| 77. | 71660 | 6.3% | 4.0%(+2.31)#77 | 4.9%(+1.46)#4,695 |
| 78. | 72638 | 6.3% | 4.0%(+2.29)#78 | 4.9%(+1.43)#4,725 |
| 79. | 72137 | 6.3% | 4.0%(+2.24)#79 | 4.9%(+1.38)#4,814 |
| 80. | 72122 | 6.2% | 4.0%(+2.17)#80 | 4.9%(+1.32)#4,926 |
| 81. | 71671 | 6.1% | 4.0%(+2.07)#81 | 4.9%(+1.21)#5,115 |
| 82. | 72020 | 6.1% | 4.0%(+2.04)#82 | 4.9%(+1.18)#5,167 |
| 83. | 72556 | 6.0% | 4.0%(+2.01)#83 | 4.9%(+1.15)#5,225 |
| 84. | 72758 | 6.0% | 4.0%(+1.98)#84 | 4.9%(+1.12)#5,271 |
| 85. | 71837 | 6.0% | 4.0%(+1.98)#85 | 4.9%(+1.12)#5,279 |
| 86. | 72003 | 6.0% | 4.0%(+1.96)#86 | 4.9%(+1.11)#5,303 |
| 87. | 72447 | 5.9% | 4.0%(+1.87)#87 | 4.9%(+1.01)#5,465 |
| 88. | 72855 | 5.9% | 4.0%(+1.86)#88 | 4.9%(+1.00)#5,491 |
| 89. | 72102 | 5.9% | 4.0%(+1.86)#89 | 4.9%(+1.00)#5,497 |
| 90. | 72212 | 5.9% | 4.0%(+1.85)#90 | 4.9%(+0.997)#5,506 |
| 91. | 71635 | 5.8% | 4.0%(+1.78)#91 | 4.9%(+0.923)#5,645 |
| 92. | 72118 | 5.8% | 4.0%(+1.73)#92 | 4.9%(+0.873)#5,742 |
| 93. | 72106 | 5.7% | 4.0%(+1.65)#93 | 4.9%(+0.795)#5,890 |
| 94. | 71909 | 5.7% | 4.0%(+1.62)#94 | 4.9%(+0.760)#5,970 |
| 95. | 72521 | 5.6% | 4.0%(+1.61)#95 | 4.9%(+0.749)#5,992 |
| 96. | 71667 | 5.6% | 4.0%(+1.55)#96 | 4.9%(+0.694)#6,096 |
| 97. | 72326 | 5.6% | 4.0%(+1.54)#97 | 4.9%(+0.681)#6,127 |
| 98. | 72143 | 5.6% | 4.0%(+1.52)#98 | 4.9%(+0.660)#6,200 |
| 99. | 72067 | 5.5% | 4.0%(+1.47)#99 | 4.9%(+0.616)#6,284 |
| 100. | 72209 | 5.1% | 4.0%(+1.06)#100 | 4.9%(+0.199)#7,229 |
Common Questions
What are the Top 10 Zip Codes with the Highest Percentage of Population with a Degree in Computers and Mathematics in Arkansas?
Top 10 Zip Codes with the Highest Percentage of Population with a Degree in Computers and Mathematics in Arkansas are:
What zip code has the Highest Percentage of Population with a Degree in Computers and Mathematics in Arkansas?
72841 has the Highest Percentage of Population with a Degree in Computers and Mathematics in Arkansas with 84.8%.
What is the Percentage of Population with a Degree in Computers and Mathematics in the State of Arkansas?
Percentage of Population with a Degree in Computers and Mathematics in Arkansas is 4.0%.
What is the Percentage of Population with a Degree in Computers and Mathematics in the United States?
Percentage of Population with a Degree in Computers and Mathematics in the United States is 4.9%.