Zip Codes with the Highest Percentage of Population with a Degree in Computers and Mathematics in Iowa
RELATED REPORTS & OPTIONS
Computers and Mathematics
Iowa
Compare Zip Codes
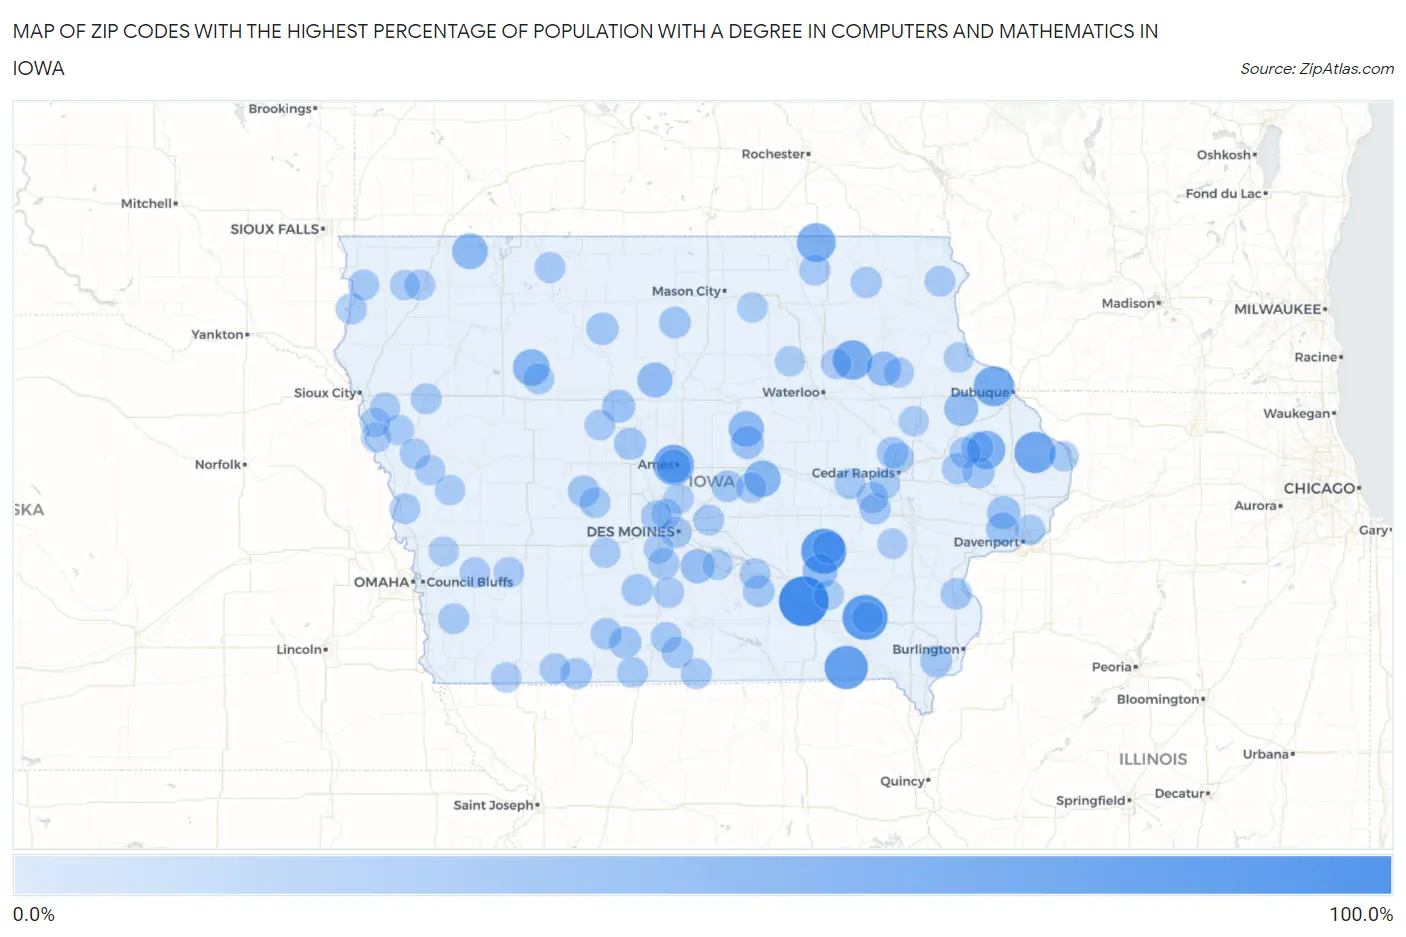
Map of Zip Codes with the Highest Percentage of Population with a Degree in Computers and Mathematics in Iowa
0.0%
100.0%
Zip Codes with the Highest Percentage of Population with a Degree in Computers and Mathematics in Iowa
| Zip Code | % Graduates | vs State | vs National | |
| 1. | 52566 | 88.9% | 3.7%(+85.2)#1 | 4.9%(+84.0)#23 |
| 2. | 52557 | 69.5% | 3.7%(+65.8)#2 | 4.9%(+64.6)#37 |
| 3. | 50255 | 69.2% | 3.7%(+65.5)#3 | 4.9%(+64.3)#38 |
| 4. | 52570 | 61.5% | 3.7%(+57.9)#4 | 4.9%(+56.6)#45 |
| 5. | 52074 | 53.1% | 3.7%(+49.4)#5 | 4.9%(+48.2)#64 |
| 6. | 50012 | 50.0% | 3.7%(+46.3)#6 | 4.9%(+45.1)#76 |
| 7. | 52039 | 47.7% | 3.7%(+44.0)#7 | 4.9%(+42.8)#93 |
| 8. | 50664 | 45.5% | 3.7%(+41.8)#8 | 4.9%(+40.6)#105 |
| 9. | 52134 | 42.9% | 3.7%(+39.2)#9 | 4.9%(+38.0)#119 |
| 10. | 52309 | 40.0% | 3.7%(+36.3)#10 | 4.9%(+35.1)#130 |
| 11. | 50078 | 33.3% | 3.7%(+29.6)#11 | 4.9%(+28.4)#190 |
| 12. | 50593 | 33.3% | 3.7%(+29.6)#12 | 4.9%(+28.4)#192 |
| 13. | 51345 | 29.6% | 3.7%(+25.9)#13 | 4.9%(+24.7)#235 |
| 14. | 50269 | 28.6% | 3.7%(+24.9)#14 | 4.9%(+23.7)#246 |
| 15. | 50599 | 26.7% | 3.7%(+23.0)#15 | 4.9%(+21.8)#274 |
| 16. | 52550 | 25.0% | 3.7%(+21.3)#16 | 4.9%(+20.1)#298 |
| 17. | 50671 | 24.3% | 3.7%(+20.6)#17 | 4.9%(+19.4)#316 |
| 18. | 52078 | 23.0% | 3.7%(+19.3)#18 | 4.9%(+18.1)#365 |
| 19. | 50013 | 22.2% | 3.7%(+18.5)#19 | 4.9%(+17.3)#383 |
| 20. | 50001 | 22.1% | 3.7%(+18.5)#20 | 4.9%(+17.3)#389 |
| 21. | 50148 | 18.5% | 3.7%(+14.8)#21 | 4.9%(+13.6)#531 |
| 22. | 52745 | 18.5% | 3.7%(+14.8)#22 | 4.9%(+13.6)#535 |
| 23. | 50569 | 18.5% | 3.7%(+14.8)#23 | 4.9%(+13.6)#537 |
| 24. | 52773 | 16.6% | 3.7%(+12.9)#24 | 4.9%(+11.7)#658 |
| 25. | 50519 | 15.4% | 3.7%(+11.8)#25 | 4.9%(+10.5)#748 |
| 26. | 50136 | 14.8% | 3.7%(+11.1)#26 | 4.9%(+9.86)#816 |
| 27. | 50223 | 14.3% | 3.7%(+10.6)#27 | 4.9%(+9.39)#873 |
| 28. | 50074 | 14.3% | 3.7%(+10.6)#28 | 4.9%(+9.39)#881 |
| 29. | 50026 | 13.4% | 3.7%(+9.75)#29 | 4.9%(+8.54)#991 |
| 30. | 52624 | 13.4% | 3.7%(+9.69)#30 | 4.9%(+8.48)#999 |
| 31. | 50222 | 13.0% | 3.7%(+9.30)#31 | 4.9%(+8.09)#1,058 |
| 32. | 52323 | 13.0% | 3.7%(+9.28)#32 | 4.9%(+8.07)#1,062 |
| 33. | 50044 | 12.5% | 3.7%(+8.82)#33 | 4.9%(+7.61)#1,130 |
| 34. | 50234 | 12.5% | 3.7%(+8.82)#34 | 4.9%(+7.61)#1,134 |
| 35. | 50439 | 12.5% | 3.7%(+8.82)#35 | 4.9%(+7.61)#1,139 |
| 36. | 52556 | 12.2% | 3.7%(+8.48)#36 | 4.9%(+7.27)#1,188 |
| 37. | 52321 | 12.1% | 3.7%(+8.44)#37 | 4.9%(+7.23)#1,197 |
| 38. | 52203 | 11.9% | 3.7%(+8.23)#38 | 4.9%(+7.02)#1,232 |
| 39. | 50103 | 11.6% | 3.7%(+7.94)#39 | 4.9%(+6.73)#1,301 |
| 40. | 50861 | 11.4% | 3.7%(+7.74)#40 | 4.9%(+6.53)#1,342 |
| 41. | 52341 | 11.3% | 3.7%(+7.66)#41 | 4.9%(+6.45)#1,363 |
| 42. | 52653 | 11.2% | 3.7%(+7.49)#42 | 4.9%(+6.28)#1,405 |
| 43. | 50160 | 11.1% | 3.7%(+7.43)#43 | 4.9%(+6.22)#1,427 |
| 44. | 52236 | 11.0% | 3.7%(+7.28)#44 | 4.9%(+6.06)#1,465 |
| 45. | 50836 | 10.8% | 3.7%(+7.13)#45 | 4.9%(+5.92)#1,501 |
| 46. | 52320 | 10.7% | 3.7%(+6.98)#46 | 4.9%(+5.77)#1,533 |
| 47. | 52212 | 10.6% | 3.7%(+6.91)#47 | 4.9%(+5.70)#1,556 |
| 48. | 52168 | 10.4% | 3.7%(+6.73)#48 | 4.9%(+5.52)#1,608 |
| 49. | 50277 | 10.3% | 3.7%(+6.57)#49 | 4.9%(+5.36)#1,667 |
| 50. | 51023 | 10.0% | 3.7%(+6.34)#50 | 4.9%(+5.13)#1,746 |
| 51. | 50140 | 9.8% | 3.7%(+6.09)#51 | 4.9%(+4.88)#1,848 |
| 52. | 50628 | 9.7% | 3.7%(+6.04)#52 | 4.9%(+4.83)#1,873 |
| 53. | 50111 | 9.6% | 3.7%(+5.94)#53 | 4.9%(+4.73)#1,916 |
| 54. | 50540 | 9.5% | 3.7%(+5.78)#54 | 4.9%(+4.57)#1,988 |
| 55. | 51551 | 9.4% | 3.7%(+5.72)#55 | 4.9%(+4.51)#2,016 |
| 56. | 52209 | 9.2% | 3.7%(+5.47)#56 | 4.9%(+4.26)#2,147 |
| 57. | 50833 | 9.1% | 3.7%(+5.44)#57 | 4.9%(+4.23)#2,162 |
| 58. | 50169 | 9.1% | 3.7%(+5.43)#58 | 4.9%(+4.22)#2,164 |
| 59. | 50309 | 9.1% | 3.7%(+5.42)#59 | 4.9%(+4.21)#2,172 |
| 60. | 51016 | 9.1% | 3.7%(+5.41)#60 | 4.9%(+4.20)#2,189 |
| 61. | 52170 | 9.1% | 3.7%(+5.41)#61 | 4.9%(+4.20)#2,199 |
| 62. | 50264 | 9.1% | 3.7%(+5.41)#62 | 4.9%(+4.20)#2,200 |
| 63. | 50052 | 9.1% | 3.7%(+5.41)#63 | 4.9%(+4.20)#2,208 |
| 64. | 51247 | 9.0% | 3.7%(+5.34)#64 | 4.9%(+4.13)#2,233 |
| 65. | 50119 | 8.9% | 3.7%(+5.21)#65 | 4.9%(+3.99)#2,324 |
| 66. | 51365 | 8.6% | 3.7%(+4.94)#66 | 4.9%(+3.73)#2,462 |
| 67. | 50543 | 8.6% | 3.7%(+4.90)#67 | 4.9%(+3.69)#2,490 |
| 68. | 51544 | 8.5% | 3.7%(+4.85)#68 | 4.9%(+3.64)#2,518 |
| 69. | 50141 | 8.2% | 3.7%(+4.48)#69 | 4.9%(+3.27)#2,776 |
| 70. | 51026 | 8.1% | 3.7%(+4.42)#70 | 4.9%(+3.21)#2,819 |
| 71. | 50210 | 8.1% | 3.7%(+4.40)#71 | 4.9%(+3.19)#2,834 |
| 72. | 50070 | 8.0% | 3.7%(+4.35)#72 | 4.9%(+3.14)#2,879 |
| 73. | 50668 | 8.0% | 3.7%(+4.32)#73 | 4.9%(+3.11)#2,895 |
| 74. | 51010 | 8.0% | 3.7%(+4.32)#74 | 4.9%(+3.11)#2,898 |
| 75. | 51557 | 7.8% | 3.7%(+4.16)#75 | 4.9%(+2.95)#3,029 |
| 76. | 50650 | 7.8% | 3.7%(+4.16)#76 | 4.9%(+2.95)#3,030 |
| 77. | 51201 | 7.6% | 3.7%(+3.91)#77 | 4.9%(+2.70)#3,247 |
| 78. | 52328 | 7.5% | 3.7%(+3.86)#78 | 4.9%(+2.65)#3,298 |
| 79. | 50468 | 7.5% | 3.7%(+3.81)#79 | 4.9%(+2.60)#3,350 |
| 80. | 51560 | 7.5% | 3.7%(+3.80)#80 | 4.9%(+2.59)#3,357 |
| 81. | 50670 | 7.3% | 3.7%(+3.63)#81 | 4.9%(+2.42)#3,518 |
| 82. | 52228 | 7.3% | 3.7%(+3.62)#82 | 4.9%(+2.41)#3,523 |
| 83. | 52247 | 7.3% | 3.7%(+3.58)#83 | 4.9%(+2.37)#3,559 |
| 84. | 52807 | 7.2% | 3.7%(+3.56)#84 | 4.9%(+2.35)#3,576 |
| 85. | 51572 | 7.1% | 3.7%(+3.46)#85 | 4.9%(+2.25)#3,691 |
| 86. | 51637 | 7.1% | 3.7%(+3.46)#86 | 4.9%(+2.25)#3,697 |
| 87. | 51559 | 7.0% | 3.7%(+3.32)#87 | 4.9%(+2.11)#3,818 |
| 88. | 51055 | 6.8% | 3.7%(+3.16)#88 | 4.9%(+1.95)#3,997 |
| 89. | 51234 | 6.8% | 3.7%(+3.16)#89 | 4.9%(+1.95)#4,002 |
| 90. | 52563 | 6.8% | 3.7%(+3.14)#90 | 4.9%(+1.93)#4,028 |
| 91. | 52052 | 6.8% | 3.7%(+3.09)#91 | 4.9%(+1.88)#4,107 |
| 92. | 51529 | 6.8% | 3.7%(+3.08)#92 | 4.9%(+1.87)#4,120 |
| 93. | 50061 | 6.8% | 3.7%(+3.07)#93 | 4.9%(+1.86)#4,137 |
| 94. | 52218 | 6.7% | 3.7%(+3.05)#94 | 4.9%(+1.84)#4,163 |
| 95. | 51007 | 6.7% | 3.7%(+3.03)#95 | 4.9%(+1.82)#4,177 |
| 96. | 51052 | 6.7% | 3.7%(+3.03)#96 | 4.9%(+1.82)#4,185 |
| 97. | 50007 | 6.7% | 3.7%(+3.01)#97 | 4.9%(+1.80)#4,204 |
| 98. | 50131 | 6.6% | 3.7%(+2.94)#98 | 4.9%(+1.73)#4,310 |
| 99. | 52070 | 6.6% | 3.7%(+2.87)#99 | 4.9%(+1.66)#4,379 |
| 100. | 50225 | 6.6% | 3.7%(+2.87)#100 | 4.9%(+1.66)#4,386 |
Common Questions
What are the Top 10 Zip Codes with the Highest Percentage of Population with a Degree in Computers and Mathematics in Iowa?
Top 10 Zip Codes with the Highest Percentage of Population with a Degree in Computers and Mathematics in Iowa are:
What zip code has the Highest Percentage of Population with a Degree in Computers and Mathematics in Iowa?
52566 has the Highest Percentage of Population with a Degree in Computers and Mathematics in Iowa with 88.9%.
What is the Percentage of Population with a Degree in Computers and Mathematics in the State of Iowa?
Percentage of Population with a Degree in Computers and Mathematics in Iowa is 3.7%.
What is the Percentage of Population with a Degree in Computers and Mathematics in the United States?
Percentage of Population with a Degree in Computers and Mathematics in the United States is 4.9%.