Zip Codes with the Highest Percentage of Population with a Degree in Computers and Mathematics in Nevada
RELATED REPORTS & OPTIONS
Computers and Mathematics
Nevada
Compare Zip Codes
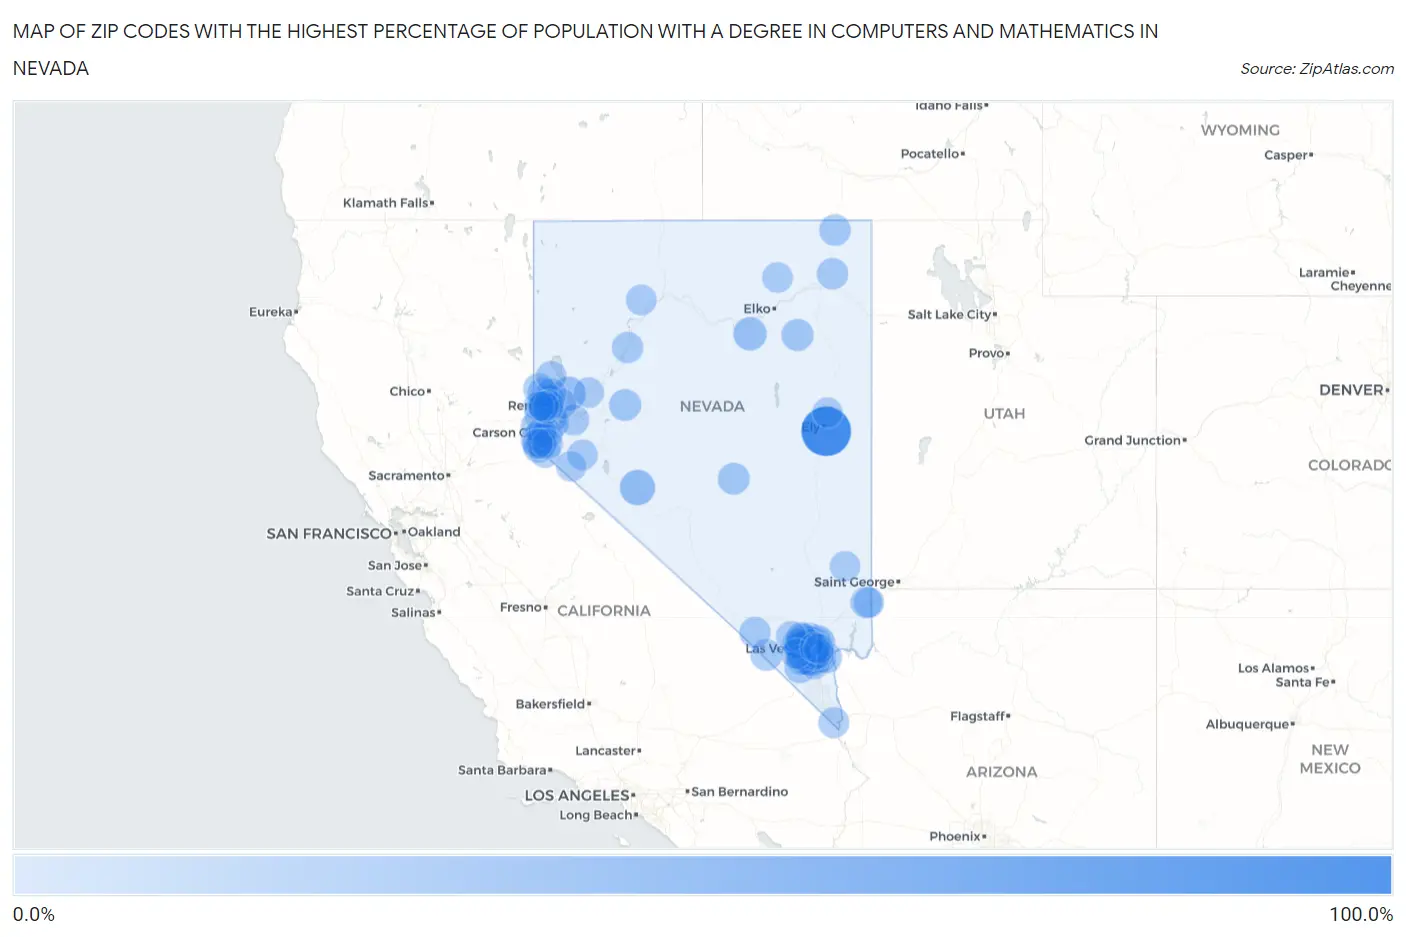
Map of Zip Codes with the Highest Percentage of Population with a Degree in Computers and Mathematics in Nevada
0.0%
100.0%
Zip Codes with the Highest Percentage of Population with a Degree in Computers and Mathematics in Nevada
| Zip Code | % Graduates | vs State | vs National | |
| 1. | 89315 | 100.0% | 4.2%(+95.8)#1 | 4.9%(+95.1)#18 |
| 2. | 89422 | 26.5% | 4.2%(+22.3)#2 | 4.9%(+21.6)#276 |
| 3. | 89191 | 24.0% | 4.2%(+19.8)#3 | 4.9%(+19.1)#328 |
| 4. | 89442 | 20.6% | 4.2%(+16.4)#4 | 4.9%(+15.7)#441 |
| 5. | 89822 | 17.2% | 4.2%(+13.0)#5 | 4.9%(+12.3)#615 |
| 6. | 89413 | 15.3% | 4.2%(+11.1)#6 | 4.9%(+10.4)#764 |
| 7. | 89440 | 13.6% | 4.2%(+9.39)#7 | 4.9%(+8.70)#962 |
| 8. | 89833 | 10.3% | 4.2%(+6.10)#8 | 4.9%(+5.42)#1,650 |
| 9. | 89406 | 9.5% | 4.2%(+5.30)#9 | 4.9%(+4.61)#1,964 |
| 10. | 89049 | 9.3% | 4.2%(+5.10)#10 | 4.9%(+4.42)#2,057 |
| 11. | 89061 | 8.0% | 4.2%(+3.78)#11 | 4.9%(+3.09)#2,916 |
| 12. | 89169 | 8.0% | 4.2%(+3.77)#12 | 4.9%(+3.08)#2,924 |
| 13. | 89084 | 7.9% | 4.2%(+3.74)#13 | 4.9%(+3.05)#2,947 |
| 14. | 89034 | 7.8% | 4.2%(+3.61)#14 | 4.9%(+2.92)#3,048 |
| 15. | 89825 | 7.7% | 4.2%(+3.48)#15 | 4.9%(+2.80)#3,152 |
| 16. | 89139 | 7.5% | 4.2%(+3.30)#16 | 4.9%(+2.62)#3,327 |
| 17. | 89005 | 7.4% | 4.2%(+3.22)#17 | 4.9%(+2.53)#3,409 |
| 18. | 89179 | 7.3% | 4.2%(+3.12)#18 | 4.9%(+2.43)#3,500 |
| 19. | 89101 | 7.2% | 4.2%(+2.98)#19 | 4.9%(+2.29)#3,640 |
| 20. | 89512 | 7.1% | 4.2%(+2.85)#20 | 4.9%(+2.17)#3,760 |
| 21. | 89521 | 7.0% | 4.2%(+2.81)#21 | 4.9%(+2.13)#3,798 |
| 22. | 89060 | 7.0% | 4.2%(+2.80)#22 | 4.9%(+2.12)#3,808 |
| 23. | 89835 | 6.9% | 4.2%(+2.66)#23 | 4.9%(+1.97)#3,978 |
| 24. | 89102 | 6.7% | 4.2%(+2.53)#24 | 4.9%(+1.84)#4,158 |
| 25. | 89433 | 6.6% | 4.2%(+2.38)#25 | 4.9%(+1.70)#4,345 |
| 26. | 89108 | 6.5% | 4.2%(+2.32)#26 | 4.9%(+1.64)#4,412 |
| 27. | 89118 | 6.5% | 4.2%(+2.25)#27 | 4.9%(+1.57)#4,511 |
| 28. | 89012 | 6.5% | 4.2%(+2.25)#28 | 4.9%(+1.57)#4,514 |
| 29. | 89419 | 6.3% | 4.2%(+2.08)#29 | 4.9%(+1.40)#4,785 |
| 30. | 89145 | 5.9% | 4.2%(+1.64)#30 | 4.9%(+0.956)#5,583 |
| 31. | 89113 | 5.7% | 4.2%(+1.50)#31 | 4.9%(+0.811)#5,866 |
| 32. | 89119 | 5.7% | 4.2%(+1.46)#32 | 4.9%(+0.778)#5,933 |
| 33. | 89508 | 5.6% | 4.2%(+1.43)#33 | 4.9%(+0.745)#5,997 |
| 34. | 89074 | 5.4% | 4.2%(+1.23)#34 | 4.9%(+0.542)#6,428 |
| 35. | 89131 | 5.3% | 4.2%(+1.11)#35 | 4.9%(+0.426)#6,713 |
| 36. | 89115 | 5.3% | 4.2%(+1.09)#36 | 4.9%(+0.407)#6,751 |
| 37. | 89158 | 5.3% | 4.2%(+1.09)#37 | 4.9%(+0.404)#6,757 |
| 38. | 89117 | 5.2% | 4.2%(+1.04)#38 | 4.9%(+0.354)#6,890 |
| 39. | 89044 | 5.2% | 4.2%(+0.992)#39 | 4.9%(+0.306)#6,990 |
| 40. | 89123 | 5.2% | 4.2%(+0.959)#40 | 4.9%(+0.273)#7,055 |
| 41. | 89128 | 5.2% | 4.2%(+0.958)#41 | 4.9%(+0.272)#7,060 |
| 42. | 89029 | 5.1% | 4.2%(+0.896)#42 | 4.9%(+0.209)#7,198 |
| 43. | 89429 | 5.1% | 4.2%(+0.843)#43 | 4.9%(+0.157)#7,329 |
| 44. | 89141 | 5.0% | 4.2%(+0.833)#44 | 4.9%(+0.147)#7,354 |
| 45. | 89511 | 5.0% | 4.2%(+0.810)#45 | 4.9%(+0.124)#7,408 |
| 46. | 89183 | 5.0% | 4.2%(+0.809)#46 | 4.9%(+0.123)#7,412 |
| 47. | 89434 | 4.8% | 4.2%(+0.588)#47 | 4.9%(-0.098)#8,002 |
| 48. | 89147 | 4.8% | 4.2%(+0.547)#48 | 4.9%(-0.140)#8,119 |
| 49. | 89103 | 4.7% | 4.2%(+0.460)#49 | 4.9%(-0.226)#8,371 |
| 50. | 89015 | 4.6% | 4.2%(+0.358)#50 | 4.9%(-0.328)#8,659 |
| 51. | 89146 | 4.5% | 4.2%(+0.254)#51 | 4.9%(-0.432)#8,992 |
| 52. | 89107 | 4.5% | 4.2%(+0.248)#52 | 4.9%(-0.438)#9,009 |
| 53. | 89460 | 4.4% | 4.2%(+0.182)#53 | 4.9%(-0.504)#9,229 |
| 54. | 89705 | 4.3% | 4.2%(+0.121)#54 | 4.9%(-0.565)#9,438 |
| 55. | 89449 | 4.2% | 4.2%(+0.017)#55 | 4.9%(-0.669)#9,746 |
| 56. | 89451 | 4.0% | 4.2%(-0.195)#56 | 4.9%(-0.881)#10,418 |
| 57. | 89121 | 3.9% | 4.2%(-0.284)#57 | 4.9%(-0.970)#10,714 |
| 58. | 89701 | 3.9% | 4.2%(-0.342)#58 | 4.9%(-1.03)#10,926 |
| 59. | 89081 | 3.8% | 4.2%(-0.360)#59 | 4.9%(-1.05)#10,989 |
| 60. | 89052 | 3.8% | 4.2%(-0.394)#60 | 4.9%(-1.08)#11,136 |
| 61. | 89445 | 3.8% | 4.2%(-0.420)#61 | 4.9%(-1.11)#11,235 |
| 62. | 89129 | 3.7% | 4.2%(-0.490)#62 | 4.9%(-1.18)#11,473 |
| 63. | 89120 | 3.7% | 4.2%(-0.505)#63 | 4.9%(-1.19)#11,535 |
| 64. | 89503 | 3.7% | 4.2%(-0.508)#64 | 4.9%(-1.19)#11,542 |
| 65. | 89441 | 3.7% | 4.2%(-0.508)#65 | 4.9%(-1.19)#11,543 |
| 66. | 89031 | 3.6% | 4.2%(-0.623)#66 | 4.9%(-1.31)#11,947 |
| 67. | 89030 | 3.5% | 4.2%(-0.691)#67 | 4.9%(-1.38)#12,222 |
| 68. | 89122 | 3.5% | 4.2%(-0.720)#68 | 4.9%(-1.41)#12,342 |
| 69. | 89703 | 3.5% | 4.2%(-0.749)#69 | 4.9%(-1.43)#12,446 |
| 70. | 89027 | 3.4% | 4.2%(-0.760)#70 | 4.9%(-1.45)#12,478 |
| 71. | 89011 | 3.4% | 4.2%(-0.773)#71 | 4.9%(-1.46)#12,537 |
| 72. | 89509 | 3.4% | 4.2%(-0.801)#72 | 4.9%(-1.49)#12,643 |
| 73. | 89144 | 3.4% | 4.2%(-0.826)#73 | 4.9%(-1.51)#12,719 |
| 74. | 89014 | 3.4% | 4.2%(-0.850)#74 | 4.9%(-1.54)#12,795 |
| 75. | 89447 | 3.3% | 4.2%(-0.860)#75 | 4.9%(-1.55)#12,842 |
| 76. | 89801 | 3.3% | 4.2%(-0.885)#76 | 4.9%(-1.57)#12,944 |
| 77. | 89436 | 3.2% | 4.2%(-0.969)#77 | 4.9%(-1.66)#13,234 |
| 78. | 89502 | 3.2% | 4.2%(-1.02)#78 | 4.9%(-1.71)#13,443 |
| 79. | 89134 | 3.1% | 4.2%(-1.09)#79 | 4.9%(-1.77)#13,661 |
| 80. | 89032 | 3.1% | 4.2%(-1.09)#80 | 4.9%(-1.78)#13,679 |
| 81. | 89411 | 3.1% | 4.2%(-1.14)#81 | 4.9%(-1.83)#13,845 |
| 82. | 89506 | 3.0% | 4.2%(-1.16)#82 | 4.9%(-1.85)#13,925 |
| 83. | 89148 | 3.0% | 4.2%(-1.26)#83 | 4.9%(-1.94)#14,246 |
| 84. | 89510 | 2.9% | 4.2%(-1.28)#84 | 4.9%(-1.96)#14,322 |
| 85. | 89408 | 2.9% | 4.2%(-1.34)#85 | 4.9%(-2.03)#14,547 |
| 86. | 89138 | 2.8% | 4.2%(-1.39)#86 | 4.9%(-2.08)#14,721 |
| 87. | 89008 | 2.8% | 4.2%(-1.45)#87 | 4.9%(-2.14)#14,958 |
| 88. | 89143 | 2.7% | 4.2%(-1.55)#88 | 4.9%(-2.24)#15,323 |
| 89. | 89178 | 2.6% | 4.2%(-1.57)#89 | 4.9%(-2.25)#15,384 |
| 90. | 89423 | 2.6% | 4.2%(-1.58)#90 | 4.9%(-2.27)#15,438 |
| 91. | 89431 | 2.6% | 4.2%(-1.60)#91 | 4.9%(-2.29)#15,494 |
| 92. | 89448 | 2.6% | 4.2%(-1.61)#92 | 4.9%(-2.30)#15,552 |
| 93. | 89166 | 2.5% | 4.2%(-1.72)#93 | 4.9%(-2.40)#15,947 |
| 94. | 89444 | 2.5% | 4.2%(-1.73)#94 | 4.9%(-2.42)#16,005 |
| 95. | 89135 | 2.5% | 4.2%(-1.75)#95 | 4.9%(-2.44)#16,087 |
| 96. | 89110 | 2.4% | 4.2%(-1.80)#96 | 4.9%(-2.48)#16,229 |
| 97. | 89523 | 2.3% | 4.2%(-1.87)#97 | 4.9%(-2.56)#16,468 |
| 98. | 89156 | 2.3% | 4.2%(-1.88)#98 | 4.9%(-2.56)#16,489 |
| 99. | 89501 | 2.3% | 4.2%(-1.94)#99 | 4.9%(-2.63)#16,722 |
| 100. | 89301 | 2.3% | 4.2%(-1.95)#100 | 4.9%(-2.64)#16,749 |
1
2Common Questions
What are the Top 10 Zip Codes with the Highest Percentage of Population with a Degree in Computers and Mathematics in Nevada?
Top 10 Zip Codes with the Highest Percentage of Population with a Degree in Computers and Mathematics in Nevada are:
What zip code has the Highest Percentage of Population with a Degree in Computers and Mathematics in Nevada?
89315 has the Highest Percentage of Population with a Degree in Computers and Mathematics in Nevada with 100.0%.
What is the Percentage of Population with a Degree in Computers and Mathematics in the State of Nevada?
Percentage of Population with a Degree in Computers and Mathematics in Nevada is 4.2%.
What is the Percentage of Population with a Degree in Computers and Mathematics in the United States?
Percentage of Population with a Degree in Computers and Mathematics in the United States is 4.9%.