Zip Codes with the Highest Percentage of Population with a Degree in Computers and Mathematics in Kentucky
RELATED REPORTS & OPTIONS
Computers and Mathematics
Kentucky
Compare Zip Codes
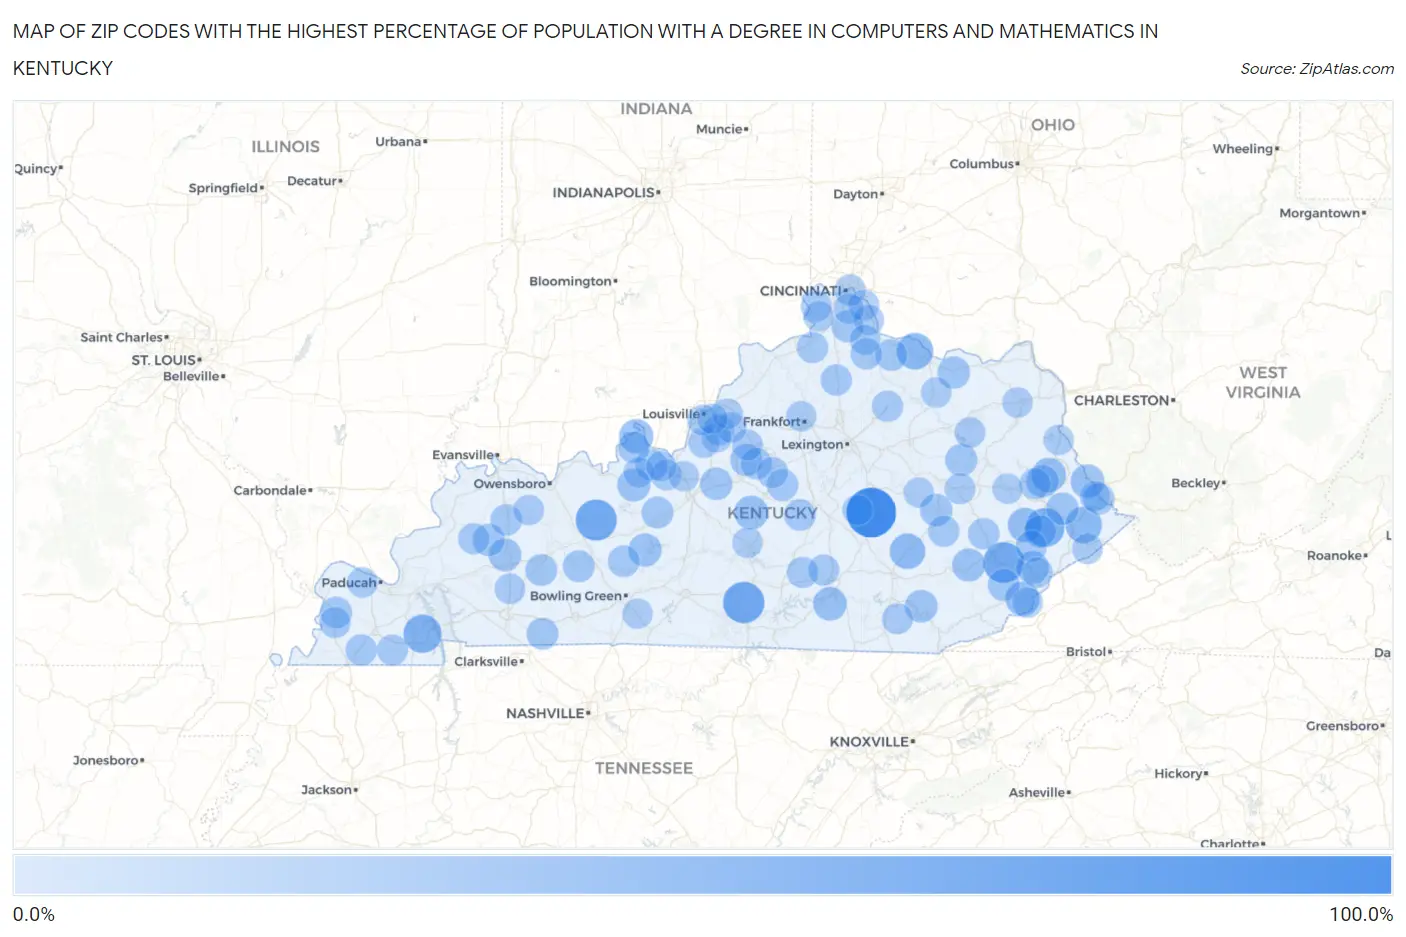
Map of Zip Codes with the Highest Percentage of Population with a Degree in Computers and Mathematics in Kentucky
0.0%
100.0%
Zip Codes with the Highest Percentage of Population with a Degree in Computers and Mathematics in Kentucky
| Zip Code | % Graduates | vs State | vs National | |
| 1. | 40404 | 100.0% | 3.8%(+96.2)#1 | 4.9%(+95.1)#3 |
| 2. | 42715 | 58.6% | 3.8%(+54.8)#2 | 4.9%(+53.7)#52 |
| 3. | 42361 | 57.4% | 3.8%(+53.6)#3 | 4.9%(+52.6)#54 |
| 4. | 41751 | 56.5% | 3.8%(+52.7)#4 | 4.9%(+51.6)#57 |
| 5. | 41651 | 47.1% | 3.8%(+43.2)#5 | 4.9%(+42.2)#98 |
| 6. | 42036 | 43.0% | 3.8%(+39.2)#6 | 4.9%(+38.1)#117 |
| 7. | 41034 | 35.1% | 3.8%(+31.2)#7 | 4.9%(+30.2)#168 |
| 8. | 41557 | 34.5% | 3.8%(+30.7)#8 | 4.9%(+29.6)#171 |
| 9. | 40402 | 30.1% | 3.8%(+26.3)#9 | 4.9%(+25.2)#222 |
| 10. | 41640 | 25.0% | 3.8%(+21.2)#10 | 4.9%(+20.1)#295 |
| 11. | 41271 | 25.0% | 3.8%(+21.2)#11 | 4.9%(+20.1)#303 |
| 12. | 40104 | 23.8% | 3.8%(+20.0)#12 | 4.9%(+18.9)#335 |
| 13. | 40807 | 23.7% | 3.8%(+19.9)#13 | 4.9%(+18.9)#341 |
| 14. | 41231 | 22.1% | 3.8%(+18.2)#14 | 4.9%(+17.2)#391 |
| 15. | 40063 | 21.2% | 3.8%(+17.4)#15 | 4.9%(+16.3)#422 |
| 16. | 42518 | 21.2% | 3.8%(+17.4)#16 | 4.9%(+16.3)#423 |
| 17. | 42207 | 19.4% | 3.8%(+15.6)#17 | 4.9%(+14.6)#488 |
| 18. | 41749 | 18.4% | 3.8%(+14.6)#18 | 4.9%(+13.5)#541 |
| 19. | 40144 | 18.4% | 3.8%(+14.6)#19 | 4.9%(+13.5)#544 |
| 20. | 41824 | 17.4% | 3.8%(+13.6)#20 | 4.9%(+12.5)#598 |
| 21. | 42410 | 16.7% | 3.8%(+12.8)#21 | 4.9%(+11.8)#642 |
| 22. | 40923 | 16.4% | 3.8%(+12.5)#22 | 4.9%(+11.5)#667 |
| 23. | 41268 | 15.9% | 3.8%(+12.0)#23 | 4.9%(+11.0)#712 |
| 24. | 41189 | 15.8% | 3.8%(+11.9)#24 | 4.9%(+10.9)#725 |
| 25. | 40107 | 15.6% | 3.8%(+11.8)#25 | 4.9%(+10.7)#737 |
| 26. | 41659 | 15.4% | 3.8%(+11.6)#26 | 4.9%(+10.5)#752 |
| 27. | 41311 | 15.2% | 3.8%(+11.4)#27 | 4.9%(+10.3)#767 |
| 28. | 42441 | 14.8% | 3.8%(+11.0)#28 | 4.9%(+9.90)#812 |
| 29. | 40020 | 14.3% | 3.8%(+10.4)#29 | 4.9%(+9.39)#880 |
| 30. | 40387 | 13.9% | 3.8%(+10.1)#30 | 4.9%(+9.02)#918 |
| 31. | 41666 | 13.6% | 3.8%(+9.80)#31 | 4.9%(+8.74)#952 |
| 32. | 41063 | 13.2% | 3.8%(+9.33)#32 | 4.9%(+8.27)#1,029 |
| 33. | 41763 | 13.0% | 3.8%(+9.21)#33 | 4.9%(+8.15)#1,048 |
| 34. | 41004 | 12.6% | 3.8%(+8.77)#34 | 4.9%(+7.71)#1,110 |
| 35. | 42273 | 12.5% | 3.8%(+8.66)#35 | 4.9%(+7.61)#1,133 |
| 36. | 42345 | 12.4% | 3.8%(+8.58)#36 | 4.9%(+7.52)#1,149 |
| 37. | 42234 | 12.3% | 3.8%(+8.50)#37 | 4.9%(+7.44)#1,159 |
| 38. | 42712 | 12.2% | 3.8%(+8.38)#38 | 4.9%(+7.32)#1,180 |
| 39. | 40464 | 11.8% | 3.8%(+7.93)#39 | 4.9%(+6.87)#1,263 |
| 40. | 42275 | 11.8% | 3.8%(+7.93)#40 | 4.9%(+6.87)#1,264 |
| 41. | 40142 | 11.7% | 3.8%(+7.81)#41 | 4.9%(+6.76)#1,294 |
| 42. | 40040 | 11.5% | 3.8%(+7.70)#42 | 4.9%(+6.64)#1,322 |
| 43. | 41503 | 11.4% | 3.8%(+7.53)#43 | 4.9%(+6.47)#1,360 |
| 44. | 42023 | 11.1% | 3.8%(+7.23)#44 | 4.9%(+6.17)#1,439 |
| 45. | 41348 | 11.0% | 3.8%(+7.16)#45 | 4.9%(+6.11)#1,458 |
| 46. | 42456 | 10.8% | 3.8%(+6.94)#46 | 4.9%(+5.88)#1,506 |
| 47. | 41040 | 10.7% | 3.8%(+6.81)#47 | 4.9%(+5.76)#1,537 |
| 48. | 41010 | 10.6% | 3.8%(+6.79)#48 | 4.9%(+5.73)#1,545 |
| 49. | 40157 | 10.5% | 3.8%(+6.69)#49 | 4.9%(+5.63)#1,577 |
| 50. | 41314 | 10.5% | 3.8%(+6.66)#50 | 4.9%(+5.60)#1,588 |
| 51. | 42088 | 10.3% | 3.8%(+6.42)#51 | 4.9%(+5.36)#1,665 |
| 52. | 40008 | 10.1% | 3.8%(+6.31)#52 | 4.9%(+5.25)#1,708 |
| 53. | 41046 | 9.9% | 3.8%(+6.07)#53 | 4.9%(+5.02)#1,788 |
| 54. | 42450 | 9.6% | 3.8%(+5.78)#54 | 4.9%(+4.73)#1,915 |
| 55. | 40348 | 9.5% | 3.8%(+5.69)#55 | 4.9%(+4.63)#1,951 |
| 56. | 40078 | 9.5% | 3.8%(+5.63)#56 | 4.9%(+4.57)#1,984 |
| 57. | 42565 | 9.5% | 3.8%(+5.62)#57 | 4.9%(+4.57)#1,989 |
| 58. | 41844 | 9.4% | 3.8%(+5.54)#58 | 4.9%(+4.48)#2,027 |
| 59. | 41222 | 9.3% | 3.8%(+5.46)#59 | 4.9%(+4.40)#2,070 |
| 60. | 41073 | 8.7% | 3.8%(+4.89)#60 | 4.9%(+3.83)#2,411 |
| 61. | 42553 | 8.6% | 3.8%(+4.72)#61 | 4.9%(+3.66)#2,502 |
| 62. | 42021 | 8.5% | 3.8%(+4.61)#62 | 4.9%(+3.56)#2,568 |
| 63. | 42040 | 8.4% | 3.8%(+4.59)#63 | 4.9%(+3.53)#2,584 |
| 64. | 40109 | 8.2% | 3.8%(+4.40)#64 | 4.9%(+3.35)#2,715 |
| 65. | 41301 | 8.2% | 3.8%(+4.36)#65 | 4.9%(+3.30)#2,748 |
| 66. | 40759 | 8.1% | 3.8%(+4.24)#66 | 4.9%(+3.18)#2,842 |
| 67. | 40228 | 8.0% | 3.8%(+4.18)#67 | 4.9%(+3.12)#2,883 |
| 68. | 40071 | 7.8% | 3.8%(+4.01)#68 | 4.9%(+2.95)#3,027 |
| 69. | 41059 | 7.3% | 3.8%(+3.45)#69 | 4.9%(+2.40)#3,534 |
| 70. | 40855 | 7.0% | 3.8%(+3.16)#70 | 4.9%(+2.11)#3,828 |
| 71. | 42217 | 6.9% | 3.8%(+3.03)#71 | 4.9%(+1.98)#3,975 |
| 72. | 40313 | 6.7% | 3.8%(+2.89)#72 | 4.9%(+1.83)#4,167 |
| 73. | 41005 | 6.7% | 3.8%(+2.89)#73 | 4.9%(+1.83)#4,168 |
| 74. | 41041 | 6.7% | 3.8%(+2.84)#74 | 4.9%(+1.78)#4,232 |
| 75. | 40299 | 6.7% | 3.8%(+2.83)#75 | 4.9%(+1.77)#4,265 |
| 76. | 40175 | 6.6% | 3.8%(+2.77)#76 | 4.9%(+1.71)#4,324 |
| 77. | 42086 | 6.6% | 3.8%(+2.76)#77 | 4.9%(+1.70)#4,339 |
| 78. | 41522 | 6.6% | 3.8%(+2.73)#78 | 4.9%(+1.67)#4,368 |
| 79. | 41007 | 6.4% | 3.8%(+2.60)#79 | 4.9%(+1.55)#4,547 |
| 80. | 42327 | 6.4% | 3.8%(+2.59)#80 | 4.9%(+1.54)#4,557 |
| 81. | 41858 | 6.4% | 3.8%(+2.54)#81 | 4.9%(+1.48)#4,649 |
| 82. | 41006 | 6.4% | 3.8%(+2.53)#82 | 4.9%(+1.47)#4,667 |
| 83. | 41514 | 6.4% | 3.8%(+2.52)#83 | 4.9%(+1.46)#4,681 |
| 84. | 40146 | 6.3% | 3.8%(+2.51)#84 | 4.9%(+1.46)#4,693 |
| 85. | 41015 | 6.3% | 3.8%(+2.49)#85 | 4.9%(+1.44)#4,716 |
| 86. | 41091 | 6.2% | 3.8%(+2.35)#86 | 4.9%(+1.29)#4,962 |
| 87. | 40229 | 6.1% | 3.8%(+2.23)#87 | 4.9%(+1.18)#5,173 |
| 88. | 40208 | 6.0% | 3.8%(+2.19)#88 | 4.9%(+1.13)#5,257 |
| 89. | 40601 | 6.0% | 3.8%(+2.16)#89 | 4.9%(+1.10)#5,316 |
| 90. | 40160 | 5.9% | 3.8%(+2.06)#90 | 4.9%(+1.00)#5,484 |
| 91. | 40223 | 5.9% | 3.8%(+2.06)#91 | 4.9%(+0.998)#5,504 |
| 92. | 40472 | 5.9% | 3.8%(+2.05)#92 | 4.9%(+0.988)#5,525 |
| 93. | 42718 | 5.9% | 3.8%(+2.04)#93 | 4.9%(+0.983)#5,536 |
| 94. | 41465 | 5.9% | 3.8%(+2.02)#94 | 4.9%(+0.962)#5,568 |
| 95. | 40461 | 5.8% | 3.8%(+1.95)#95 | 4.9%(+0.893)#5,691 |
| 96. | 41230 | 5.7% | 3.8%(+1.89)#96 | 4.9%(+0.836)#5,818 |
| 97. | 42122 | 5.6% | 3.8%(+1.76)#97 | 4.9%(+0.704)#6,067 |
| 98. | 40117 | 5.5% | 3.8%(+1.69)#98 | 4.9%(+0.636)#6,245 |
| 99. | 41143 | 5.5% | 3.8%(+1.64)#99 | 4.9%(+0.585)#6,348 |
| 100. | 40205 | 5.4% | 3.8%(+1.61)#100 | 4.9%(+0.551)#6,412 |
Common Questions
What are the Top 10 Zip Codes with the Highest Percentage of Population with a Degree in Computers and Mathematics in Kentucky?
Top 10 Zip Codes with the Highest Percentage of Population with a Degree in Computers and Mathematics in Kentucky are:
What zip code has the Highest Percentage of Population with a Degree in Computers and Mathematics in Kentucky?
40404 has the Highest Percentage of Population with a Degree in Computers and Mathematics in Kentucky with 100.0%.
What is the Percentage of Population with a Degree in Computers and Mathematics in the State of Kentucky?
Percentage of Population with a Degree in Computers and Mathematics in Kentucky is 3.8%.
What is the Percentage of Population with a Degree in Computers and Mathematics in the United States?
Percentage of Population with a Degree in Computers and Mathematics in the United States is 4.9%.