Zip Codes with the Highest Percentage of Population with a Degree in Computers and Mathematics in Massachusetts
RELATED REPORTS & OPTIONS
Computers and Mathematics
Massachusetts
Compare Zip Codes
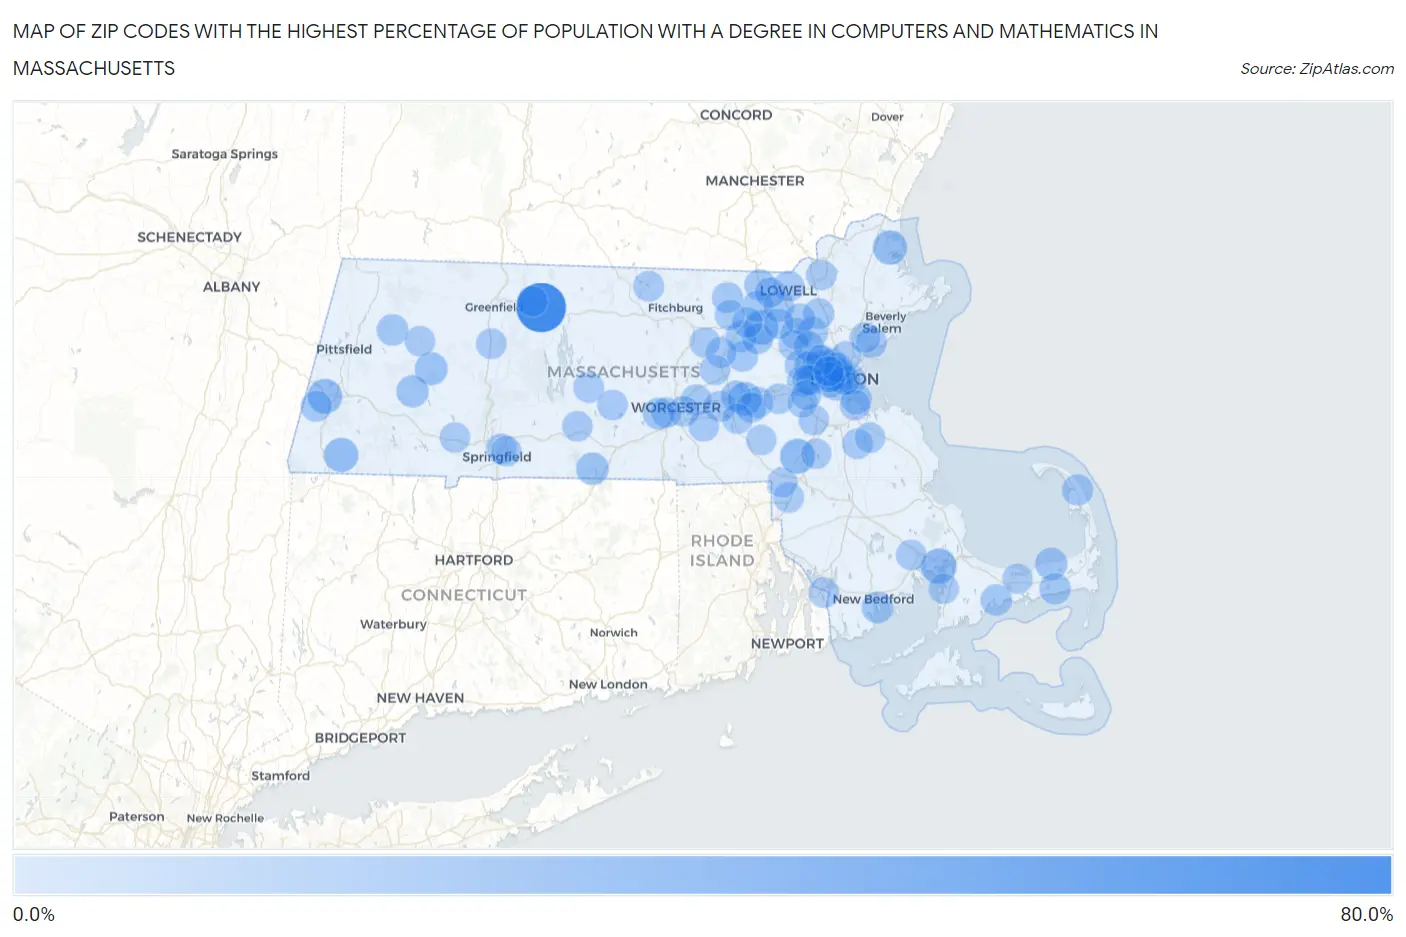
Map of Zip Codes with the Highest Percentage of Population with a Degree in Computers and Mathematics in Massachusetts
0.0%
80.0%
Zip Codes with the Highest Percentage of Population with a Degree in Computers and Mathematics in Massachusetts
| Zip Code | % Graduates | vs State | vs National | |
| 1. | 01380 | 77.8% | 5.3%(+72.5)#1 | 4.9%(+72.9)#29 |
| 2. | 02558 | 25.7% | 5.3%(+20.4)#2 | 4.9%(+20.8)#292 |
| 3. | 02071 | 23.4% | 5.3%(+18.1)#3 | 4.9%(+18.5)#351 |
| 4. | 01229 | 22.7% | 5.3%(+17.5)#4 | 4.9%(+17.8)#370 |
| 5. | 01718 | 21.9% | 5.3%(+16.6)#5 | 4.9%(+17.0)#395 |
| 6. | 01244 | 21.1% | 5.3%(+15.8)#6 | 4.9%(+16.2)#429 |
| 7. | 01951 | 20.9% | 5.3%(+15.7)#7 | 4.9%(+16.0)#432 |
| 8. | 01745 | 18.2% | 5.3%(+13.0)#8 | 4.9%(+13.4)#550 |
| 9. | 01084 | 16.3% | 5.3%(+11.1)#9 | 4.9%(+11.4)#674 |
| 10. | 01521 | 14.8% | 5.3%(+9.55)#10 | 4.9%(+9.92)#810 |
| 11. | 01011 | 14.5% | 5.3%(+9.24)#11 | 4.9%(+9.61)#846 |
| 12. | 02641 | 13.8% | 5.3%(+8.50)#12 | 4.9%(+8.87)#936 |
| 13. | 01611 | 12.2% | 5.3%(+6.94)#13 | 4.9%(+7.31)#1,182 |
| 14. | 02744 | 11.8% | 5.3%(+6.56)#14 | 4.9%(+6.93)#1,251 |
| 15. | 01270 | 11.8% | 5.3%(+6.50)#15 | 4.9%(+6.87)#1,262 |
| 16. | 02655 | 11.3% | 5.3%(+6.05)#16 | 4.9%(+6.42)#1,374 |
| 17. | 02639 | 11.3% | 5.3%(+6.03)#17 | 4.9%(+6.39)#1,384 |
| 18. | 01719 | 11.1% | 5.3%(+5.86)#18 | 4.9%(+6.22)#1,417 |
| 19. | 02163 | 10.9% | 5.3%(+5.63)#19 | 4.9%(+6.00)#1,483 |
| 20. | 01879 | 10.8% | 5.3%(+5.57)#20 | 4.9%(+5.94)#1,497 |
| 21. | 02666 | 10.6% | 5.3%(+5.33)#21 | 4.9%(+5.70)#1,559 |
| 22. | 01886 | 10.2% | 5.3%(+4.98)#22 | 4.9%(+5.35)#1,674 |
| 23. | 01450 | 10.2% | 5.3%(+4.93)#23 | 4.9%(+5.30)#1,693 |
| 24. | 01702 | 10.2% | 5.3%(+4.91)#24 | 4.9%(+5.28)#1,697 |
| 25. | 02142 | 10.1% | 5.3%(+4.88)#25 | 4.9%(+5.25)#1,709 |
| 26. | 01581 | 9.8% | 5.3%(+4.57)#26 | 4.9%(+4.94)#1,816 |
| 27. | 01730 | 9.7% | 5.3%(+4.48)#27 | 4.9%(+4.85)#1,865 |
| 28. | 01772 | 9.6% | 5.3%(+4.34)#28 | 4.9%(+4.70)#1,924 |
| 29. | 01545 | 9.6% | 5.3%(+4.33)#29 | 4.9%(+4.70)#1,929 |
| 30. | 01803 | 9.5% | 5.3%(+4.26)#30 | 4.9%(+4.63)#1,947 |
| 31. | 01775 | 9.5% | 5.3%(+4.26)#31 | 4.9%(+4.63)#1,957 |
| 32. | 02120 | 9.5% | 5.3%(+4.25)#32 | 4.9%(+4.62)#1,962 |
| 33. | 01236 | 9.4% | 5.3%(+4.18)#33 | 4.9%(+4.55)#1,993 |
| 34. | 02466 | 9.4% | 5.3%(+4.18)#34 | 4.9%(+4.55)#1,998 |
| 35. | 01887 | 9.4% | 5.3%(+4.12)#35 | 4.9%(+4.49)#2,023 |
| 36. | 01902 | 9.3% | 5.3%(+4.04)#36 | 4.9%(+4.41)#2,060 |
| 37. | 01720 | 9.3% | 5.3%(+4.04)#37 | 4.9%(+4.41)#2,062 |
| 38. | 01824 | 9.3% | 5.3%(+4.01)#38 | 4.9%(+4.38)#2,083 |
| 39. | 02171 | 9.3% | 5.3%(+4.00)#39 | 4.9%(+4.37)#2,085 |
| 40. | 02140 | 9.1% | 5.3%(+3.87)#40 | 4.9%(+4.24)#2,159 |
| 41. | 02141 | 9.1% | 5.3%(+3.84)#41 | 4.9%(+4.21)#2,170 |
| 42. | 02139 | 9.0% | 5.3%(+3.75)#42 | 4.9%(+4.12)#2,245 |
| 43. | 01430 | 8.8% | 5.3%(+3.54)#43 | 4.9%(+3.91)#2,367 |
| 44. | 01850 | 8.6% | 5.3%(+3.35)#44 | 4.9%(+3.72)#2,467 |
| 45. | 02144 | 8.5% | 5.3%(+3.28)#45 | 4.9%(+3.65)#2,513 |
| 46. | 01031 | 8.5% | 5.3%(+3.26)#46 | 4.9%(+3.62)#2,529 |
| 47. | 01344 | 8.5% | 5.3%(+3.23)#47 | 4.9%(+3.60)#2,538 |
| 48. | 01373 | 8.3% | 5.3%(+3.07)#48 | 4.9%(+3.44)#2,629 |
| 49. | 02210 | 8.3% | 5.3%(+3.07)#49 | 4.9%(+3.44)#2,650 |
| 50. | 01821 | 8.3% | 5.3%(+3.03)#50 | 4.9%(+3.40)#2,676 |
| 51. | 01460 | 8.3% | 5.3%(+3.01)#51 | 4.9%(+3.38)#2,690 |
| 52. | 02576 | 8.3% | 5.3%(+2.99)#52 | 4.9%(+3.36)#2,708 |
| 53. | 01604 | 8.2% | 5.3%(+2.98)#53 | 4.9%(+3.35)#2,710 |
| 54. | 01740 | 8.2% | 5.3%(+2.94)#54 | 4.9%(+3.31)#2,744 |
| 55. | 02478 | 8.2% | 5.3%(+2.91)#55 | 4.9%(+3.28)#2,767 |
| 56. | 01092 | 8.2% | 5.3%(+2.89)#56 | 4.9%(+3.26)#2,781 |
| 57. | 01519 | 8.1% | 5.3%(+2.85)#57 | 4.9%(+3.22)#2,815 |
| 58. | 01843 | 8.1% | 5.3%(+2.80)#58 | 4.9%(+3.17)#2,853 |
| 59. | 01535 | 8.1% | 5.3%(+2.79)#59 | 4.9%(+3.16)#2,860 |
| 60. | 02721 | 8.0% | 5.3%(+2.69)#60 | 4.9%(+3.06)#2,934 |
| 61. | 01026 | 7.9% | 5.3%(+2.67)#61 | 4.9%(+3.04)#2,952 |
| 62. | 01731 | 7.9% | 5.3%(+2.65)#62 | 4.9%(+3.02)#2,967 |
| 63. | 02343 | 7.9% | 5.3%(+2.62)#63 | 4.9%(+2.99)#2,992 |
| 64. | 01721 | 7.9% | 5.3%(+2.59)#64 | 4.9%(+2.96)#3,019 |
| 65. | 01904 | 7.8% | 5.3%(+2.56)#65 | 4.9%(+2.93)#3,039 |
| 66. | 02446 | 7.8% | 5.3%(+2.49)#66 | 4.9%(+2.86)#3,097 |
| 67. | 01523 | 7.8% | 5.3%(+2.49)#67 | 4.9%(+2.86)#3,098 |
| 68. | 01748 | 7.7% | 5.3%(+2.48)#68 | 4.9%(+2.85)#3,106 |
| 69. | 01104 | 7.7% | 5.3%(+2.46)#69 | 4.9%(+2.83)#3,118 |
| 70. | 01603 | 7.7% | 5.3%(+2.42)#70 | 4.9%(+2.78)#3,174 |
| 71. | 02170 | 7.6% | 5.3%(+2.37)#71 | 4.9%(+2.74)#3,206 |
| 72. | 02476 | 7.6% | 5.3%(+2.36)#72 | 4.9%(+2.73)#3,223 |
| 73. | 02148 | 7.6% | 5.3%(+2.32)#73 | 4.9%(+2.68)#3,265 |
| 74. | 01863 | 7.6% | 5.3%(+2.30)#74 | 4.9%(+2.67)#3,278 |
| 75. | 02090 | 7.6% | 5.3%(+2.29)#75 | 4.9%(+2.66)#3,289 |
| 76. | 02763 | 7.5% | 5.3%(+2.25)#76 | 4.9%(+2.62)#3,319 |
| 77. | 02111 | 7.5% | 5.3%(+2.24)#77 | 4.9%(+2.61)#3,335 |
| 78. | 01109 | 7.5% | 5.3%(+2.23)#78 | 4.9%(+2.59)#3,351 |
| 79. | 02190 | 7.5% | 5.3%(+2.19)#79 | 4.9%(+2.56)#3,384 |
| 80. | 01760 | 7.4% | 5.3%(+2.18)#80 | 4.9%(+2.55)#3,396 |
| 81. | 01741 | 7.4% | 5.3%(+2.13)#81 | 4.9%(+2.50)#3,445 |
| 82. | 02451 | 7.4% | 5.3%(+2.13)#82 | 4.9%(+2.50)#3,446 |
| 83. | 01432 | 7.3% | 5.3%(+2.07)#83 | 4.9%(+2.44)#3,484 |
| 84. | 01503 | 7.3% | 5.3%(+2.06)#84 | 4.9%(+2.42)#3,507 |
| 85. | 02067 | 7.3% | 5.3%(+2.05)#85 | 4.9%(+2.42)#3,517 |
| 86. | 01085 | 7.2% | 5.3%(+1.96)#86 | 4.9%(+2.33)#3,605 |
| 87. | 02534 | 7.2% | 5.3%(+1.92)#87 | 4.9%(+2.29)#3,648 |
| 88. | 02420 | 7.1% | 5.3%(+1.87)#88 | 4.9%(+2.24)#3,703 |
| 89. | 02460 | 7.1% | 5.3%(+1.85)#89 | 4.9%(+2.22)#3,718 |
| 90. | 02145 | 7.1% | 5.3%(+1.82)#90 | 4.9%(+2.19)#3,744 |
| 91. | 02630 | 7.0% | 5.3%(+1.74)#91 | 4.9%(+2.11)#3,814 |
| 92. | 02452 | 7.0% | 5.3%(+1.72)#92 | 4.9%(+2.09)#3,849 |
| 93. | 02492 | 7.0% | 5.3%(+1.71)#93 | 4.9%(+2.08)#3,868 |
| 94. | 02134 | 6.9% | 5.3%(+1.69)#94 | 4.9%(+2.05)#3,894 |
| 95. | 02053 | 6.9% | 5.3%(+1.65)#95 | 4.9%(+2.02)#3,935 |
| 96. | 02762 | 6.9% | 5.3%(+1.64)#96 | 4.9%(+2.01)#3,938 |
| 97. | 02474 | 6.9% | 5.3%(+1.62)#97 | 4.9%(+1.99)#3,964 |
| 98. | 02465 | 6.8% | 5.3%(+1.59)#98 | 4.9%(+1.95)#3,991 |
| 99. | 02138 | 6.8% | 5.3%(+1.58)#99 | 4.9%(+1.95)#4,000 |
| 100. | 02494 | 6.8% | 5.3%(+1.57)#100 | 4.9%(+1.94)#4,022 |
Common Questions
What are the Top 10 Zip Codes with the Highest Percentage of Population with a Degree in Computers and Mathematics in Massachusetts?
Top 10 Zip Codes with the Highest Percentage of Population with a Degree in Computers and Mathematics in Massachusetts are:
What zip code has the Highest Percentage of Population with a Degree in Computers and Mathematics in Massachusetts?
01380 has the Highest Percentage of Population with a Degree in Computers and Mathematics in Massachusetts with 77.8%.
What is the Percentage of Population with a Degree in Computers and Mathematics in the State of Massachusetts?
Percentage of Population with a Degree in Computers and Mathematics in Massachusetts is 5.3%.
What is the Percentage of Population with a Degree in Computers and Mathematics in the United States?
Percentage of Population with a Degree in Computers and Mathematics in the United States is 4.9%.