Woodward County, OK Map & Demographics
Woodward County Map
Woodward County Overview
$31,995
PER CAPITA INCOME
$71,512
AVG FAMILY INCOME
$61,207
AVG HOUSEHOLD INCOME
37.5%
WAGE / INCOME GAP [ % ]
62.5¢/ $1
WAGE / INCOME GAP [ $ ]
$10,486
FAMILY INCOME DEFICIT
0.44
INEQUALITY / GINI INDEX
20,411
TOTAL POPULATION
10,797
MALE POPULATION
9,614
FEMALE POPULATION
112.30
MALES / 100 FEMALES
89.04
FEMALES / 100 MALES
36.8
MEDIAN AGE
2.9
AVG FAMILY SIZE
2.4
AVG HOUSEHOLD SIZE
9,960
LABOR FORCE [ PEOPLE ]
62.0%
PERCENT IN LABOR FORCE
5.3%
UNEMPLOYMENT RATE
Woodward County Area Codes
Income in Woodward County
Income Overview in Woodward County
Per Capita Income in Woodward County is $31,995, while median incomes of families and households are $71,512 and $61,207 respectively.
| Characteristic | Number | Measure |
| Per Capita Income | 20,411 | $31,995 |
| Median Family Income | 5,418 | $71,512 |
| Mean Family Income | 5,418 | $90,048 |
| Median Household Income | 8,007 | $61,207 |
| Mean Household Income | 8,007 | $81,479 |
| Income Deficit | 5,418 | $10,486 |
| Wage / Income Gap (%) | 20,411 | 37.54% |
| Wage / Income Gap ($) | 20,411 | 62.46¢ per $1 |
| Gini / Inequality Index | 20,411 | 0.44 |
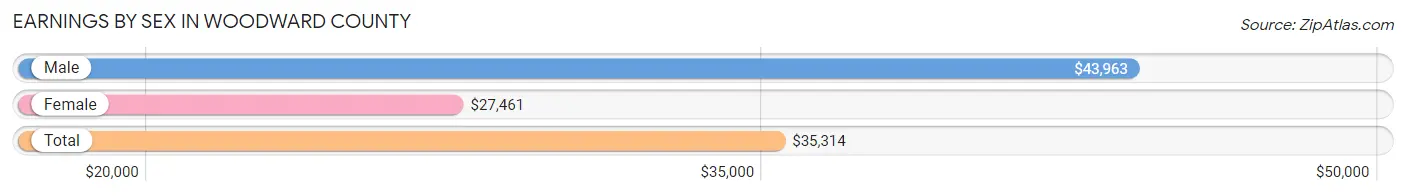
Earnings by Sex in Woodward County
Average Earnings in Woodward County are $35,314, $43,963 for men and $27,461 for women, a difference of 37.5%.
| Sex | Number | Average Earnings |
| Male | 6,103 (56.6%) | $43,963 |
| Female | 4,689 (43.4%) | $27,461 |
| Total | 10,792 (100.0%) | $35,314 |
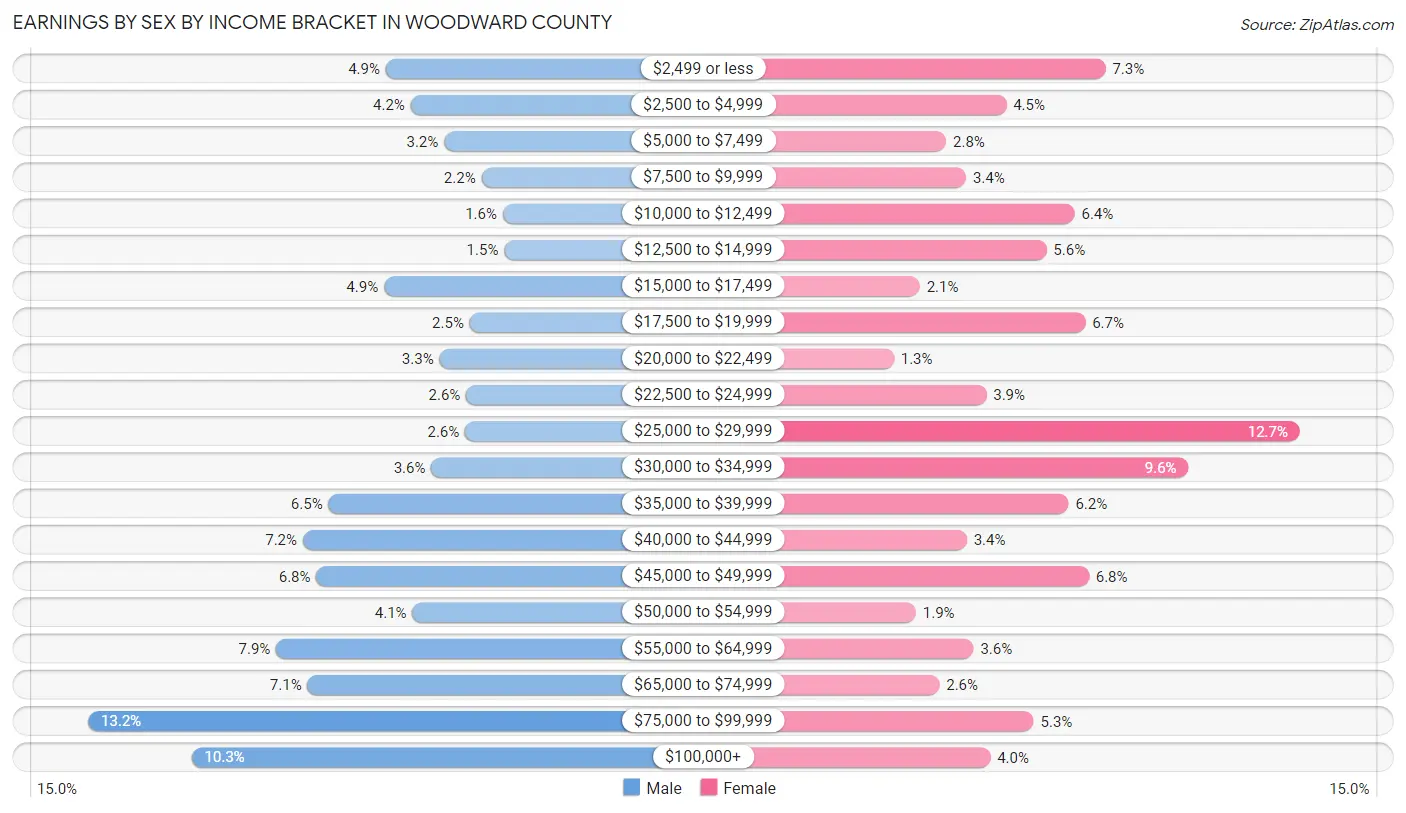
Earnings by Sex by Income Bracket in Woodward County
The most common earnings brackets in Woodward County are $75,000 to $99,999 for men (807 | 13.2%) and $25,000 to $29,999 for women (597 | 12.7%).
| Income | Male | Female |
| $2,499 or less | 296 (4.9%) | 341 (7.3%) |
| $2,500 to $4,999 | 253 (4.2%) | 210 (4.5%) |
| $5,000 to $7,499 | 196 (3.2%) | 131 (2.8%) |
| $7,500 to $9,999 | 132 (2.2%) | 157 (3.4%) |
| $10,000 to $12,499 | 95 (1.6%) | 300 (6.4%) |
| $12,500 to $14,999 | 93 (1.5%) | 263 (5.6%) |
| $15,000 to $17,499 | 299 (4.9%) | 96 (2.1%) |
| $17,500 to $19,999 | 152 (2.5%) | 314 (6.7%) |
| $20,000 to $22,499 | 204 (3.3%) | 62 (1.3%) |
| $22,500 to $24,999 | 158 (2.6%) | 184 (3.9%) |
| $25,000 to $29,999 | 160 (2.6%) | 597 (12.7%) |
| $30,000 to $34,999 | 218 (3.6%) | 450 (9.6%) |
| $35,000 to $39,999 | 394 (6.5%) | 292 (6.2%) |
| $40,000 to $44,999 | 438 (7.2%) | 158 (3.4%) |
| $45,000 to $49,999 | 415 (6.8%) | 319 (6.8%) |
| $50,000 to $54,999 | 250 (4.1%) | 91 (1.9%) |
| $55,000 to $64,999 | 484 (7.9%) | 167 (3.6%) |
| $65,000 to $74,999 | 430 (7.0%) | 122 (2.6%) |
| $75,000 to $99,999 | 807 (13.2%) | 246 (5.2%) |
| $100,000+ | 629 (10.3%) | 189 (4.0%) |
| Total | 6,103 (100.0%) | 4,689 (100.0%) |
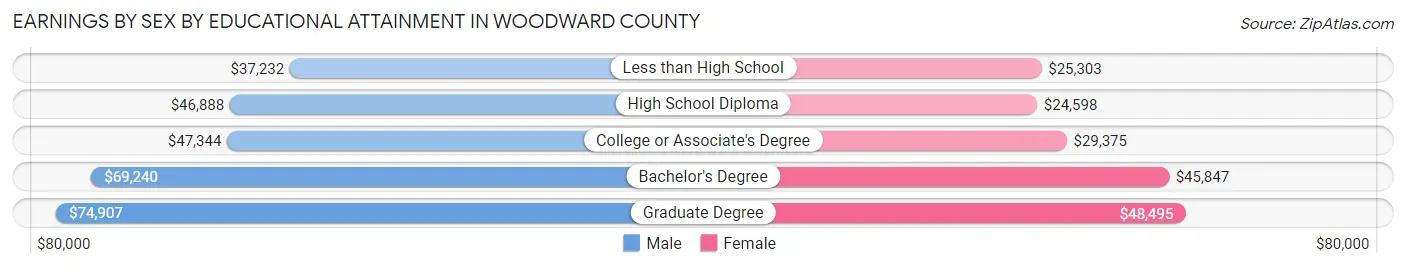
Earnings by Sex by Educational Attainment in Woodward County
Average earnings in Woodward County are $48,450 for men and $29,583 for women, a difference of 38.9%. Men with an educational attainment of graduate degree enjoy the highest average annual earnings of $74,907, while those with less than high school education earn the least with $37,232. Women with an educational attainment of graduate degree earn the most with the average annual earnings of $48,495, while those with high school diploma education have the smallest earnings of $24,598.
| Educational Attainment | Male Income | Female Income |
| Less than High School | $37,232 | $25,303 |
| High School Diploma | $46,888 | $24,598 |
| College or Associate's Degree | $47,344 | $29,375 |
| Bachelor's Degree | $69,240 | $45,847 |
| Graduate Degree | $74,907 | $48,495 |
| Total | $48,450 | $29,583 |
Family Income in Woodward County
Family Income Brackets in Woodward County
According to the Woodward County family income data, there are 1,057 families falling into the $50,000 to $74,999 income range, which is the most common income bracket and makes up 19.5% of all families. Conversely, the $10,000 to $14,999 income bracket is the least frequent group with only 70 families (1.3%) belonging to this category.
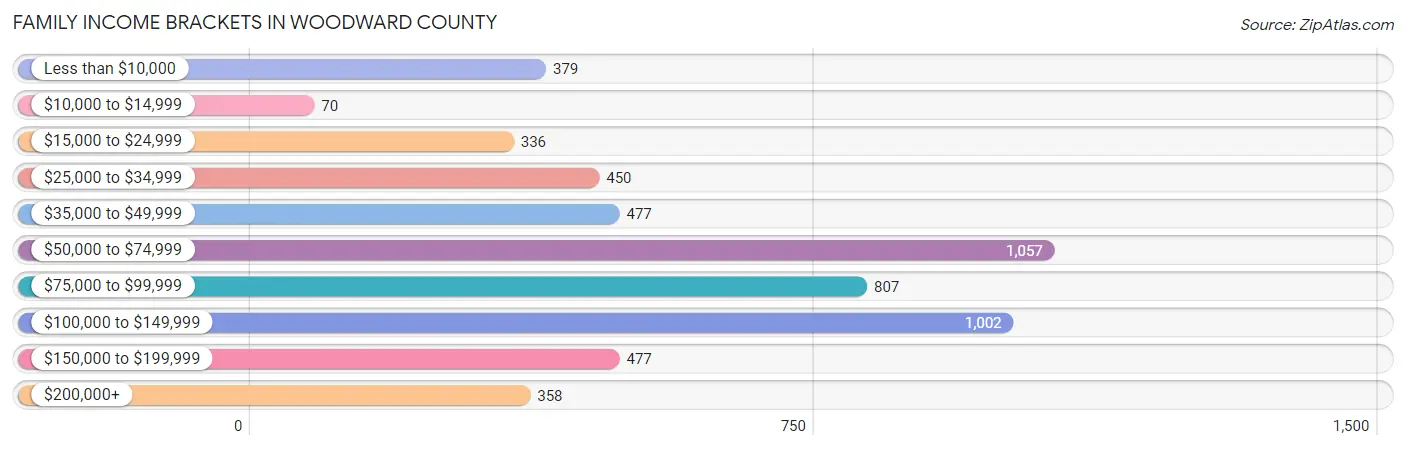
| Income Bracket | # Families | % Families |
| Less than $10,000 | 379 | 7.0% |
| $10,000 to $14,999 | 70 | 1.3% |
| $15,000 to $24,999 | 336 | 6.2% |
| $25,000 to $34,999 | 450 | 8.3% |
| $35,000 to $49,999 | 477 | 8.8% |
| $50,000 to $74,999 | 1,057 | 19.5% |
| $75,000 to $99,999 | 807 | 14.9% |
| $100,000 to $149,999 | 1,002 | 18.5% |
| $150,000 to $199,999 | 477 | 8.8% |
| $200,000+ | 358 | 6.6% |
Family Income by Famaliy Size in Woodward County
4-person families (870 | 16.1%) account for the highest median family income in Woodward County with $104,773 per family, while 3-person families (1,081 | 20.0%) have the highest median income of $31,157 per family member.
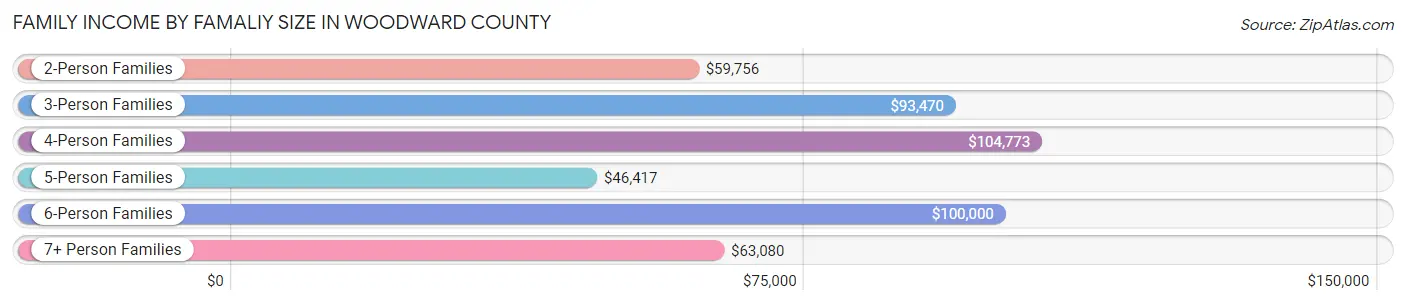
| Income Bracket | # Families | Median Income |
| 2-Person Families | 2,954 (54.5%) | $59,756 |
| 3-Person Families | 1,081 (20.0%) | $93,470 |
| 4-Person Families | 870 (16.1%) | $104,773 |
| 5-Person Families | 237 (4.4%) | $46,417 |
| 6-Person Families | 162 (3.0%) | $100,000 |
| 7+ Person Families | 114 (2.1%) | $63,080 |
| Total | 5,418 (100.0%) | $71,512 |
Family Income by Number of Earners in Woodward County
The median family income in Woodward County is $71,512, with families comprising 2 earners (2,083) having the highest median family income of $94,125, while families with no earners (770) have the lowest median family income of $35,556, accounting for 38.5% and 14.2% of families, respectively.
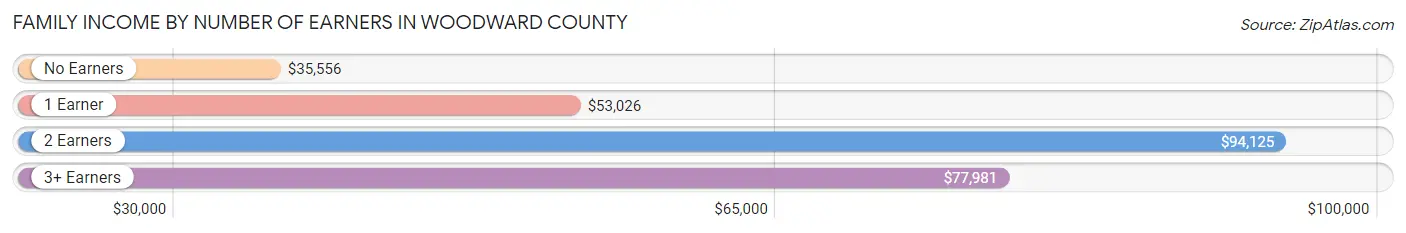
| Number of Earners | # Families | Median Income |
| No Earners | 770 (14.2%) | $35,556 |
| 1 Earner | 2,022 (37.3%) | $53,026 |
| 2 Earners | 2,083 (38.5%) | $94,125 |
| 3+ Earners | 543 (10.0%) | $77,981 |
| Total | 5,418 (100.0%) | $71,512 |
Household Income in Woodward County
Household Income Brackets in Woodward County
With 1,681 households falling in the category, the $50,000 to $74,999 income range is the most frequent in Woodward County, accounting for 21.0% of all households. In contrast, only 176 households (2.2%) fall into the $10,000 to $14,999 income bracket, making it the least populous group.
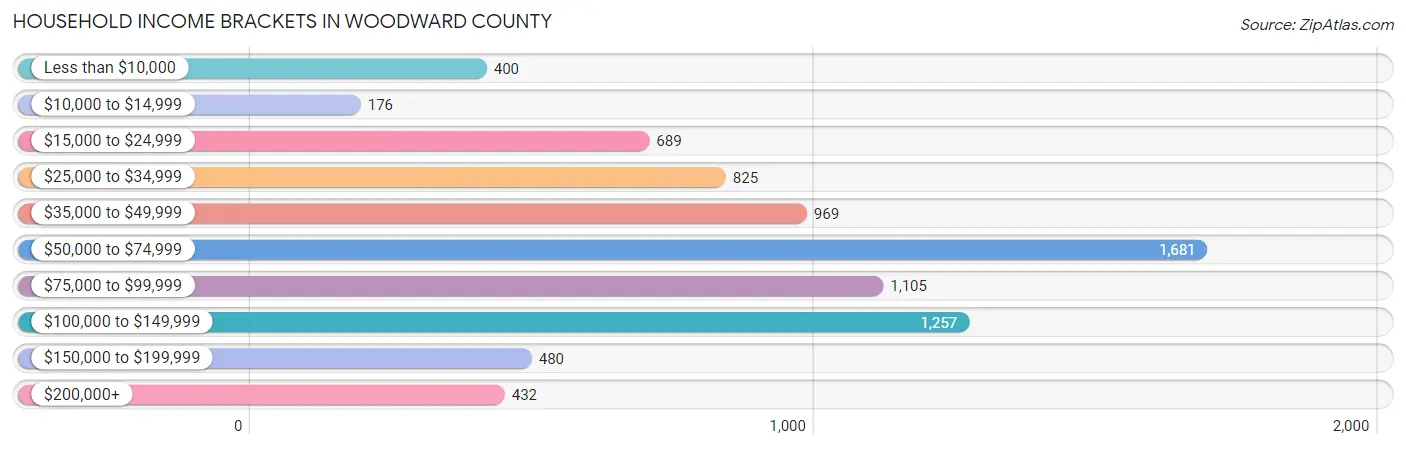
| Income Bracket | # Households | % Households |
| Less than $10,000 | 400 | 5.0% |
| $10,000 to $14,999 | 176 | 2.2% |
| $15,000 to $24,999 | 689 | 8.6% |
| $25,000 to $34,999 | 825 | 10.3% |
| $35,000 to $49,999 | 969 | 12.1% |
| $50,000 to $74,999 | 1,681 | 21.0% |
| $75,000 to $99,999 | 1,105 | 13.8% |
| $100,000 to $149,999 | 1,257 | 15.7% |
| $150,000 to $199,999 | 480 | 6.0% |
| $200,000+ | 432 | 5.4% |
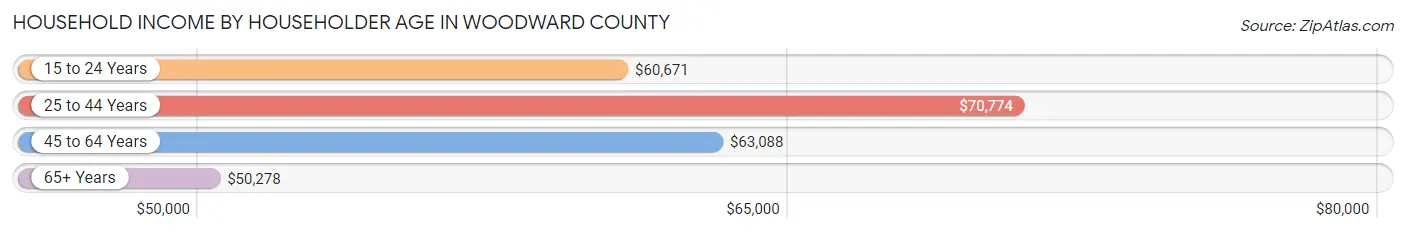
Household Income by Householder Age in Woodward County
The median household income in Woodward County is $61,207, with the highest median household income of $70,774 found in the 25 to 44 years age bracket for the primary householder. A total of 2,777 households (34.7%) fall into this category. Meanwhile, the 65+ years age bracket for the primary householder has the lowest median household income of $50,278, with 2,176 households (27.2%) in this group.
| Income Bracket | # Households | Median Income |
| 15 to 24 Years | 342 (4.3%) | $60,671 |
| 25 to 44 Years | 2,777 (34.7%) | $70,774 |
| 45 to 64 Years | 2,712 (33.9%) | $63,088 |
| 65+ Years | 2,176 (27.2%) | $50,278 |
| Total | 8,007 (100.0%) | $61,207 |
Poverty in Woodward County
Income Below Poverty by Sex and Age in Woodward County
With 10.9% poverty level for males and 19.2% for females among the residents of Woodward County, under 5 year old males and under 5 year old females are the most vulnerable to poverty, with 223 males (33.2%) and 200 females (41.6%) in their respective age groups living below the poverty level.
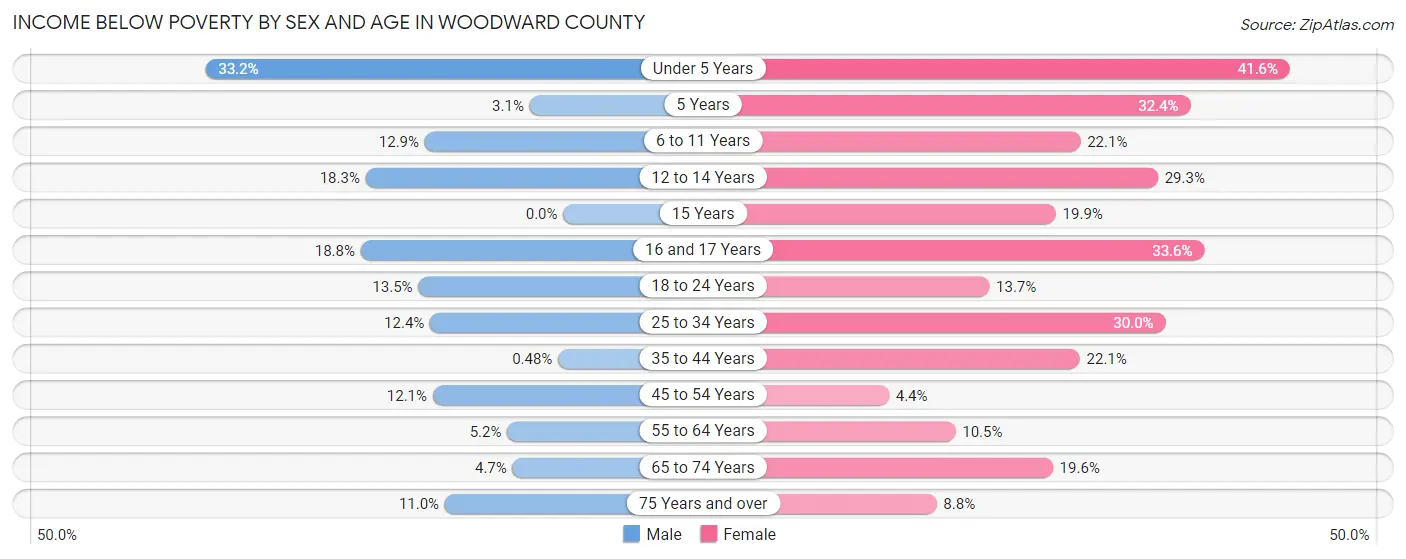
| Age Bracket | Male | Female |
| Under 5 Years | 223 (33.2%) | 200 (41.6%) |
| 5 Years | 6 (3.1%) | 11 (32.4%) |
| 6 to 11 Years | 121 (12.9%) | 189 (22.1%) |
| 12 to 14 Years | 62 (18.3%) | 134 (29.3%) |
| 15 Years | 0 (0.0%) | 27 (19.9%) |
| 16 and 17 Years | 75 (18.8%) | 73 (33.6%) |
| 18 to 24 Years | 110 (13.5%) | 101 (13.7%) |
| 25 to 34 Years | 173 (12.4%) | 361 (30.0%) |
| 35 to 44 Years | 6 (0.5%) | 294 (22.1%) |
| 45 to 54 Years | 139 (12.1%) | 46 (4.4%) |
| 55 to 64 Years | 60 (5.2%) | 124 (10.5%) |
| 65 to 74 Years | 41 (4.7%) | 172 (19.6%) |
| 75 Years and over | 69 (11.0%) | 72 (8.8%) |
| Total | 1,085 (10.9%) | 1,804 (19.2%) |
Income Above Poverty by Sex and Age in Woodward County
According to the poverty statistics in Woodward County, males aged 15 years and females aged 45 to 54 years are the age groups that are most secure financially, with 100.0% of males and 95.6% of females in these age groups living above the poverty line.
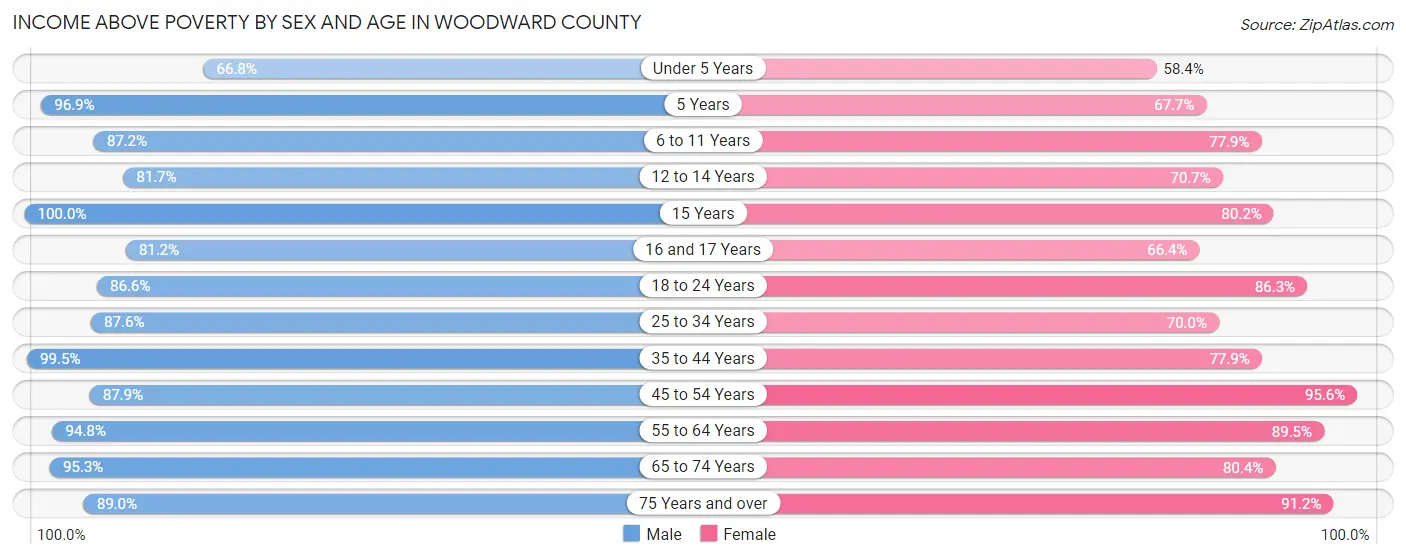
| Age Bracket | Male | Female |
| Under 5 Years | 448 (66.8%) | 281 (58.4%) |
| 5 Years | 186 (96.9%) | 23 (67.6%) |
| 6 to 11 Years | 821 (87.2%) | 665 (77.9%) |
| 12 to 14 Years | 276 (81.7%) | 323 (70.7%) |
| 15 Years | 104 (100.0%) | 109 (80.1%) |
| 16 and 17 Years | 324 (81.2%) | 144 (66.4%) |
| 18 to 24 Years | 708 (86.6%) | 638 (86.3%) |
| 25 to 34 Years | 1,227 (87.6%) | 841 (70.0%) |
| 35 to 44 Years | 1,251 (99.5%) | 1,038 (77.9%) |
| 45 to 54 Years | 1,009 (87.9%) | 1,009 (95.6%) |
| 55 to 64 Years | 1,094 (94.8%) | 1,054 (89.5%) |
| 65 to 74 Years | 829 (95.3%) | 707 (80.4%) |
| 75 Years and over | 559 (89.0%) | 748 (91.2%) |
| Total | 8,836 (89.1%) | 7,580 (80.8%) |
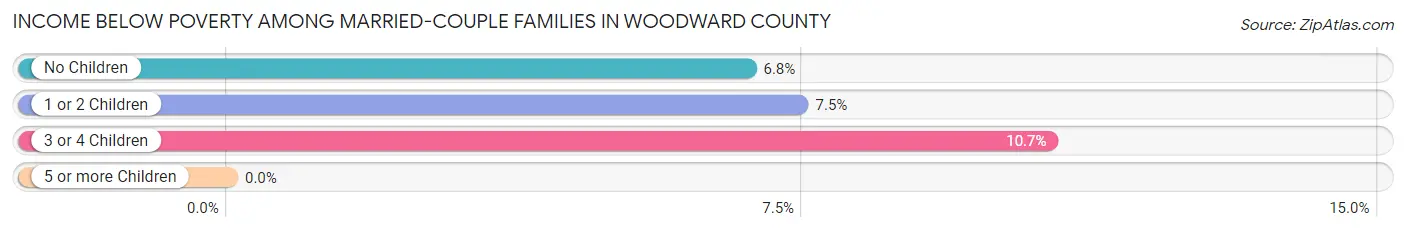
Income Below Poverty Among Married-Couple Families in Woodward County
The poverty statistics for married-couple families in Woodward County show that 7.3% or 293 of the total 4,032 families live below the poverty line. Families with 3 or 4 children have the highest poverty rate of 10.7%, comprising of 27 families. On the other hand, families with 5 or more children have the lowest poverty rate of 0.0%, which includes 0 families.
| Children | Above Poverty | Below Poverty |
| No Children | 2,134 (93.2%) | 155 (6.8%) |
| 1 or 2 Children | 1,379 (92.5%) | 111 (7.4%) |
| 3 or 4 Children | 225 (89.3%) | 27 (10.7%) |
| 5 or more Children | 1 (100.0%) | 0 (0.0%) |
| Total | 3,739 (92.7%) | 293 (7.3%) |
Income Below Poverty Among Single-Parent Households in Woodward County
According to the poverty data in Woodward County, 14.3% or 43 single-father households and 45.3% or 491 single-mother households are living below the poverty line. Among single-father households, those with no children have the highest poverty rate, with 32 households (21.2%) experiencing poverty. Likewise, among single-mother households, those with 5 or more children have the highest poverty rate, with 44 households (100.0%) falling below the poverty line.
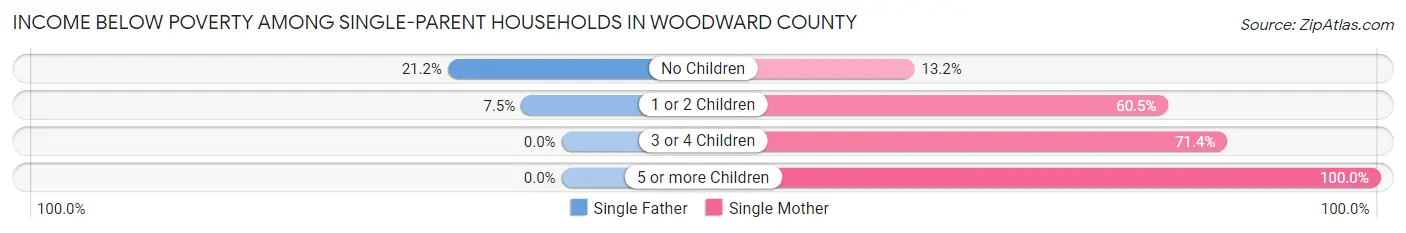
| Children | Single Father | Single Mother |
| No Children | 32 (21.2%) | 52 (13.2%) |
| 1 or 2 Children | 11 (7.5%) | 370 (60.5%) |
| 3 or 4 Children | 0 (0.0%) | 25 (71.4%) |
| 5 or more Children | 0 (0.0%) | 44 (100.0%) |
| Total | 43 (14.3%) | 491 (45.3%) |
Income Below Poverty Among Married-Couple vs Single-Parent Households in Woodward County
The poverty data for Woodward County shows that 293 of the married-couple family households (7.3%) and 534 of the single-parent households (38.5%) are living below the poverty level. Within the married-couple family households, those with 3 or 4 children have the highest poverty rate, with 27 households (10.7%) falling below the poverty line. Among the single-parent households, those with 5 or more children have the highest poverty rate, with 44 household (100.0%) living below poverty.
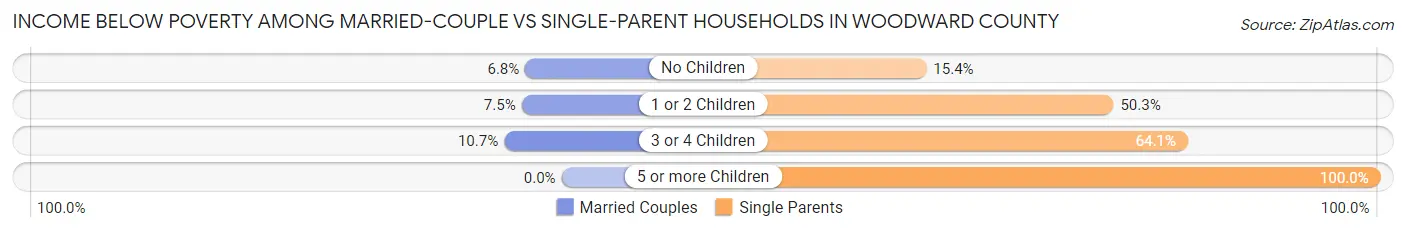
| Children | Married-Couple Families | Single-Parent Households |
| No Children | 155 (6.8%) | 84 (15.4%) |
| 1 or 2 Children | 111 (7.4%) | 381 (50.3%) |
| 3 or 4 Children | 27 (10.7%) | 25 (64.1%) |
| 5 or more Children | 0 (0.0%) | 44 (100.0%) |
| Total | 293 (7.3%) | 534 (38.5%) |
Race in Woodward County
The most populous races in Woodward County are White / Caucasian (17,532 | 85.9%), Hispanic or Latino (2,845 | 13.9%), and Two or more Races (1,232 | 6.0%).
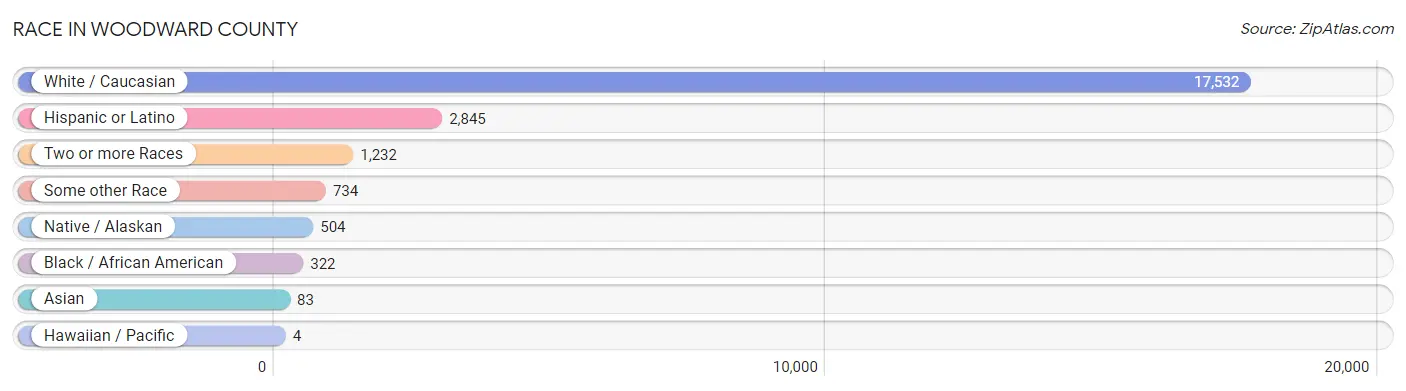
| Race | # Population | % Population |
| Asian | 83 | 0.4% |
| Black / African American | 322 | 1.6% |
| Hawaiian / Pacific | 4 | 0.0% |
| Hispanic or Latino | 2,845 | 13.9% |
| Native / Alaskan | 504 | 2.5% |
| White / Caucasian | 17,532 | 85.9% |
| Two or more Races | 1,232 | 6.0% |
| Some other Race | 734 | 3.6% |
| Total | 20,411 | 100.0% |
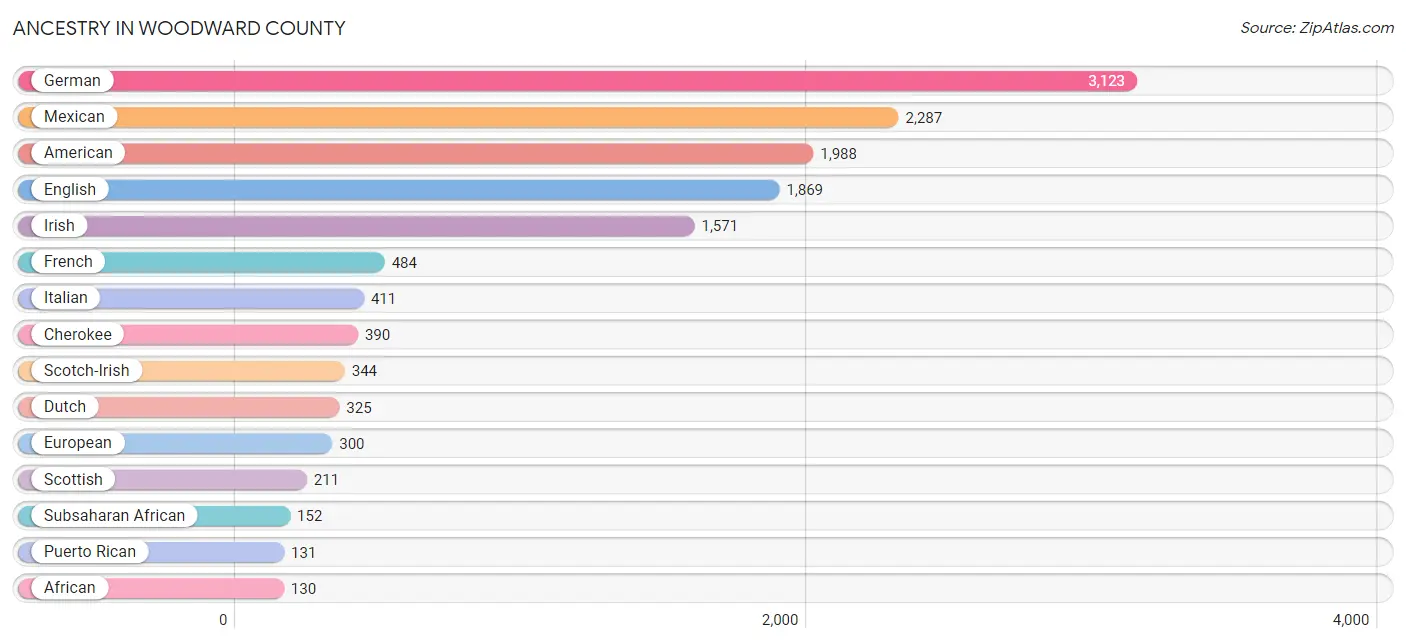
Ancestry in Woodward County
The most populous ancestries reported in Woodward County are German (3,123 | 15.3%), Mexican (2,287 | 11.2%), American (1,988 | 9.7%), English (1,869 | 9.2%), and Irish (1,571 | 7.7%), together accounting for 53.1% of all Woodward County residents.
| Ancestry | # Population | % Population |
| African | 130 | 0.6% |
| American | 1,988 | 9.7% |
| Apache | 63 | 0.3% |
| Arapaho | 9 | 0.0% |
| Bhutanese | 76 | 0.4% |
| British | 54 | 0.3% |
| Burmese | 6 | 0.0% |
| Central American | 15 | 0.1% |
| Cherokee | 390 | 1.9% |
| Cheyenne | 14 | 0.1% |
| Chickasaw | 67 | 0.3% |
| Choctaw | 43 | 0.2% |
| Comanche | 47 | 0.2% |
| Creek | 32 | 0.2% |
| Croatian | 7 | 0.0% |
| Czech | 66 | 0.3% |
| Czechoslovakian | 37 | 0.2% |
| Danish | 36 | 0.2% |
| Delaware | 2 | 0.0% |
| Dutch | 325 | 1.6% |
| Dutch West Indian | 50 | 0.2% |
| English | 1,869 | 9.2% |
| European | 300 | 1.5% |
| Filipino | 9 | 0.0% |
| Finnish | 10 | 0.1% |
| French | 484 | 2.4% |
| French American Indian | 2 | 0.0% |
| French Canadian | 10 | 0.1% |
| German | 3,123 | 15.3% |
| Honduran | 12 | 0.1% |
| Indian (Asian) | 61 | 0.3% |
| Irish | 1,571 | 7.7% |
| Italian | 411 | 2.0% |
| Jamaican | 29 | 0.1% |
| Kiowa | 13 | 0.1% |
| Korean | 51 | 0.3% |
| Mexican | 2,287 | 11.2% |
| Native Hawaiian | 65 | 0.3% |
| Navajo | 28 | 0.1% |
| Northern European | 1 | 0.0% |
| Norwegian | 67 | 0.3% |
| Polish | 106 | 0.5% |
| Portuguese | 25 | 0.1% |
| Potawatomi | 25 | 0.1% |
| Puerto Rican | 131 | 0.6% |
| Romanian | 12 | 0.1% |
| Russian | 52 | 0.3% |
| Salvadoran | 3 | 0.0% |
| Scandinavian | 82 | 0.4% |
| Scotch-Irish | 344 | 1.7% |
| Scottish | 211 | 1.0% |
| Sioux | 5 | 0.0% |
| South African | 22 | 0.1% |
| South American | 30 | 0.2% |
| Spaniard | 100 | 0.5% |
| Spanish | 11 | 0.1% |
| Subsaharan African | 152 | 0.7% |
| Swedish | 95 | 0.5% |
| Swiss | 35 | 0.2% |
| Ukrainian | 11 | 0.1% |
| Venezuelan | 30 | 0.2% |
| Welsh | 83 | 0.4% | View All 62 Rows |
Immigrants in Woodward County
The most numerous immigrant groups reported in Woodward County came from Latin America (998 | 4.9%), Central America (977 | 4.8%), Mexico (965 | 4.7%), Asia (79 | 0.4%), and China (70 | 0.3%), together accounting for 15.1% of all Woodward County residents.
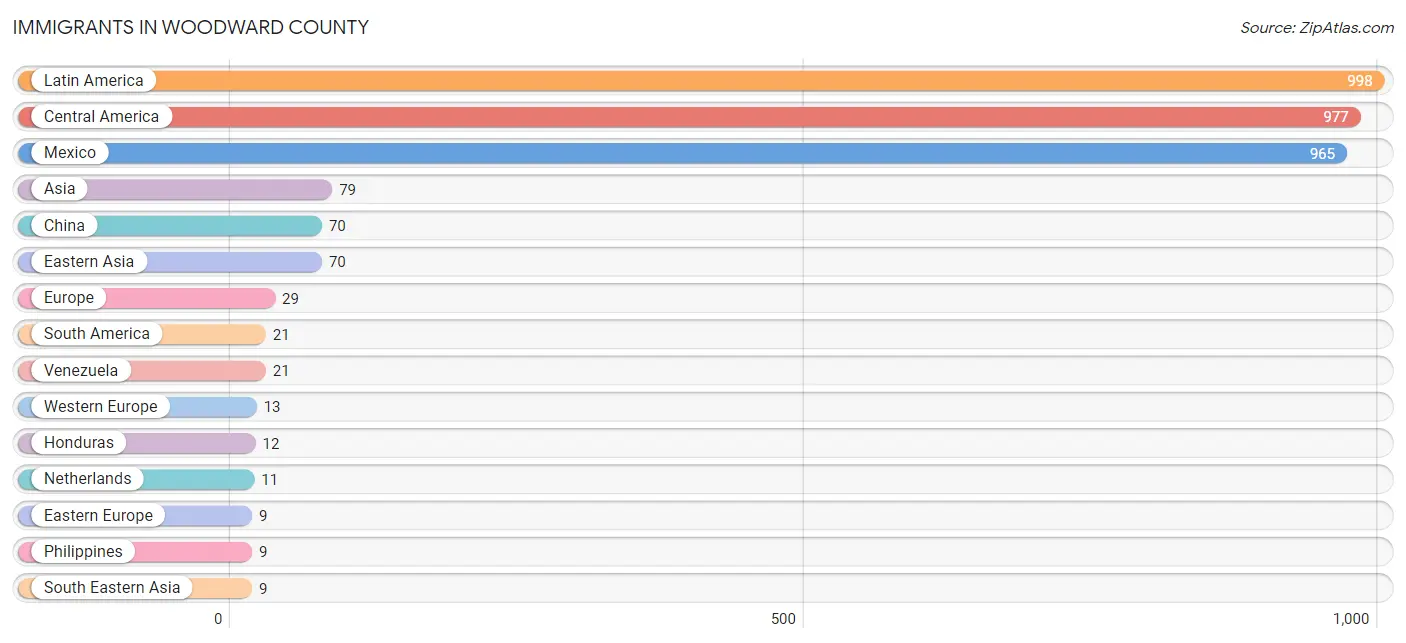
| Immigration Origin | # Population | % Population |
| Asia | 79 | 0.4% |
| Central America | 977 | 4.8% |
| China | 70 | 0.3% |
| Eastern Asia | 70 | 0.3% |
| Eastern Europe | 9 | 0.0% |
| England | 7 | 0.0% |
| Europe | 29 | 0.1% |
| Germany | 2 | 0.0% |
| Honduras | 12 | 0.1% |
| Latin America | 998 | 4.9% |
| Mexico | 965 | 4.7% |
| Netherlands | 11 | 0.1% |
| Northern Europe | 7 | 0.0% |
| Philippines | 9 | 0.0% |
| Romania | 5 | 0.0% |
| South America | 21 | 0.1% |
| South Eastern Asia | 9 | 0.0% |
| Taiwan | 9 | 0.0% |
| Ukraine | 4 | 0.0% |
| Venezuela | 21 | 0.1% |
| Western Europe | 13 | 0.1% | View All 21 Rows |
Sex and Age in Woodward County
Sex and Age in Woodward County
The most populous age groups in Woodward County are 45 to 49 Years (865 | 8.0%) for men and 60 to 64 Years (757 | 7.9%) for women.
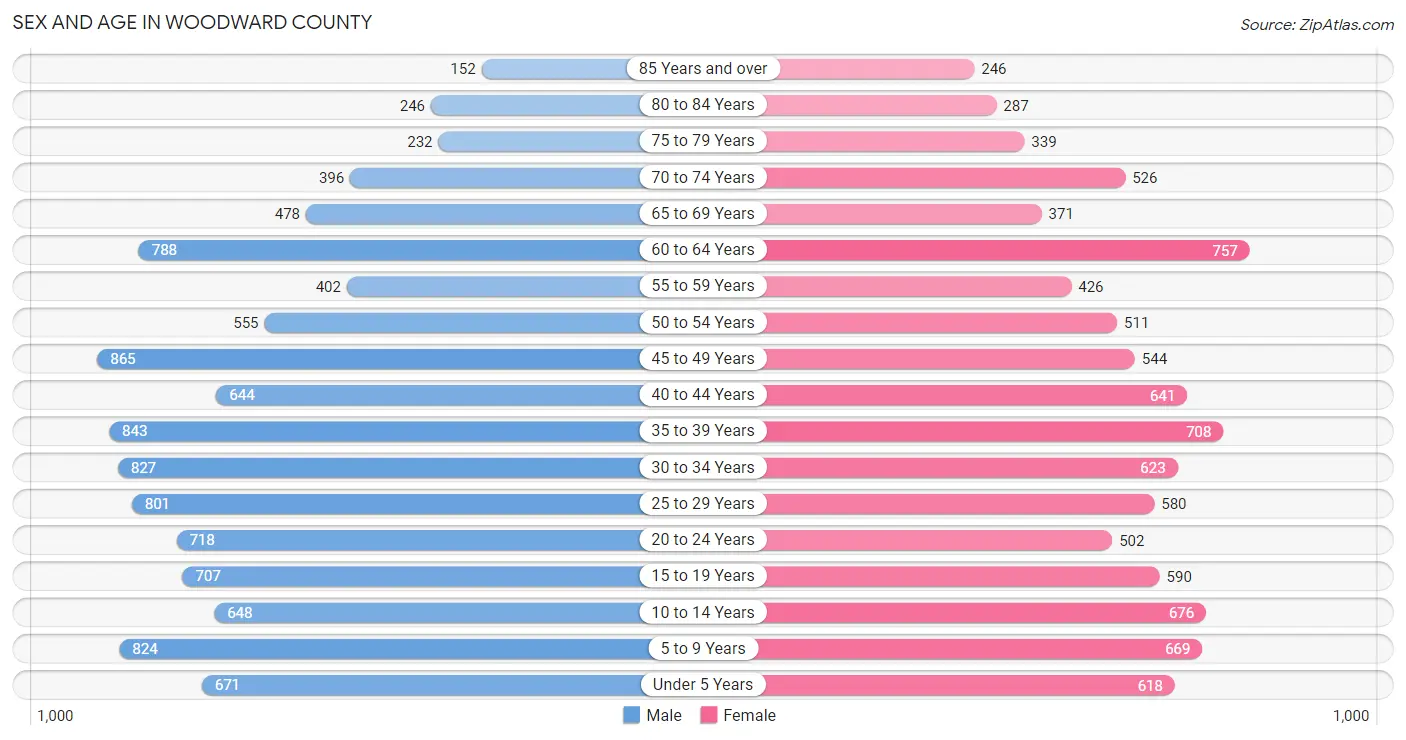
| Age Bracket | Male | Female |
| Under 5 Years | 671 (6.2%) | 618 (6.4%) |
| 5 to 9 Years | 824 (7.6%) | 669 (7.0%) |
| 10 to 14 Years | 648 (6.0%) | 676 (7.0%) |
| 15 to 19 Years | 707 (6.6%) | 590 (6.1%) |
| 20 to 24 Years | 718 (6.7%) | 502 (5.2%) |
| 25 to 29 Years | 801 (7.4%) | 580 (6.0%) |
| 30 to 34 Years | 827 (7.7%) | 623 (6.5%) |
| 35 to 39 Years | 843 (7.8%) | 708 (7.4%) |
| 40 to 44 Years | 644 (6.0%) | 641 (6.7%) |
| 45 to 49 Years | 865 (8.0%) | 544 (5.7%) |
| 50 to 54 Years | 555 (5.1%) | 511 (5.3%) |
| 55 to 59 Years | 402 (3.7%) | 426 (4.4%) |
| 60 to 64 Years | 788 (7.3%) | 757 (7.9%) |
| 65 to 69 Years | 478 (4.4%) | 371 (3.9%) |
| 70 to 74 Years | 396 (3.7%) | 526 (5.5%) |
| 75 to 79 Years | 232 (2.1%) | 339 (3.5%) |
| 80 to 84 Years | 246 (2.3%) | 287 (3.0%) |
| 85 Years and over | 152 (1.4%) | 246 (2.6%) |
| Total | 10,797 (100.0%) | 9,614 (100.0%) |
Families and Households in Woodward County
Median Family Size in Woodward County
The median family size in Woodward County is 2.92 persons per family, with married-couple families (4,032 | 74.4%) accounting for the largest median family size of 2.98 persons per family. On the other hand, single male/father families (301 | 5.6%) represent the smallest median family size with 2.48 persons per family.
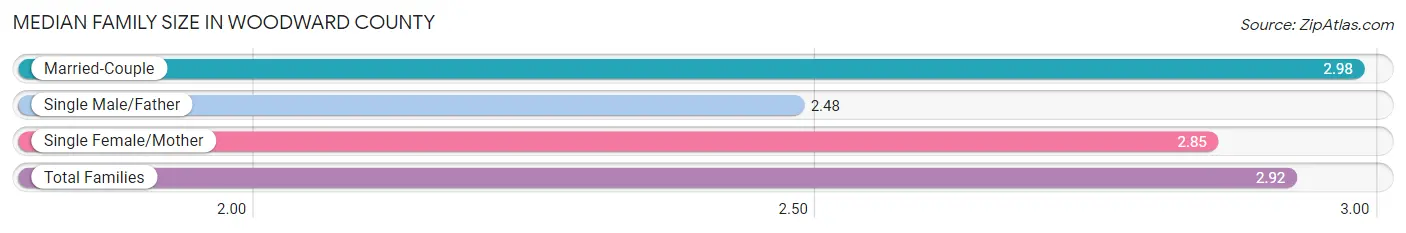
| Family Type | # Families | Family Size |
| Married-Couple | 4,032 (74.4%) | 2.98 |
| Single Male/Father | 301 (5.6%) | 2.48 |
| Single Female/Mother | 1,085 (20.0%) | 2.85 |
| Total Families | 5,418 (100.0%) | 2.92 |
Median Household Size in Woodward County
The median household size in Woodward County is 2.41 persons per household, with single female/mother households (1,085 | 13.6%) accounting for the largest median household size of 3.21 persons per household. non-family households (2,589 | 32.3%) represent the smallest median household size with 1.14 persons per household.
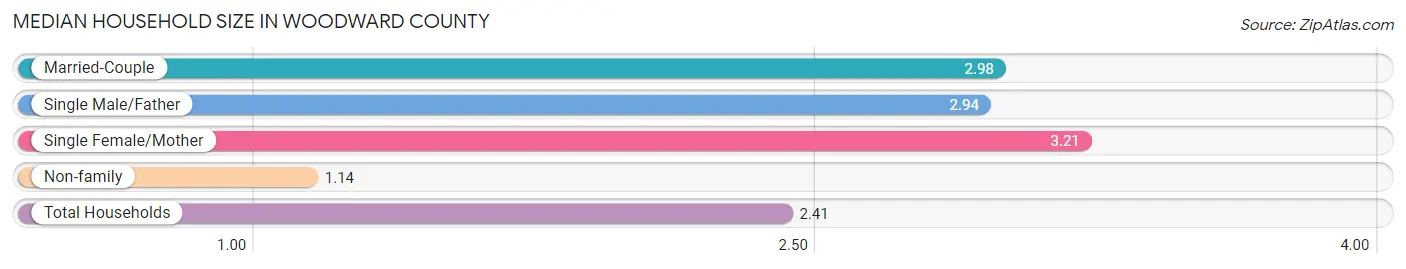
| Household Type | # Households | Household Size |
| Married-Couple | 4,032 (50.4%) | 2.98 |
| Single Male/Father | 301 (3.8%) | 2.94 |
| Single Female/Mother | 1,085 (13.6%) | 3.21 |
| Non-family | 2,589 (32.3%) | 1.14 |
| Total Households | 8,007 (100.0%) | 2.41 |
Household Size by Marriage Status in Woodward County
Out of a total of 8,007 households in Woodward County, 5,418 (67.7%) are family households, while 2,589 (32.3%) are nonfamily households. The most numerous type of family households are 2-person households, comprising 2,719, and the most common type of nonfamily households are 1-person households, comprising 2,314.
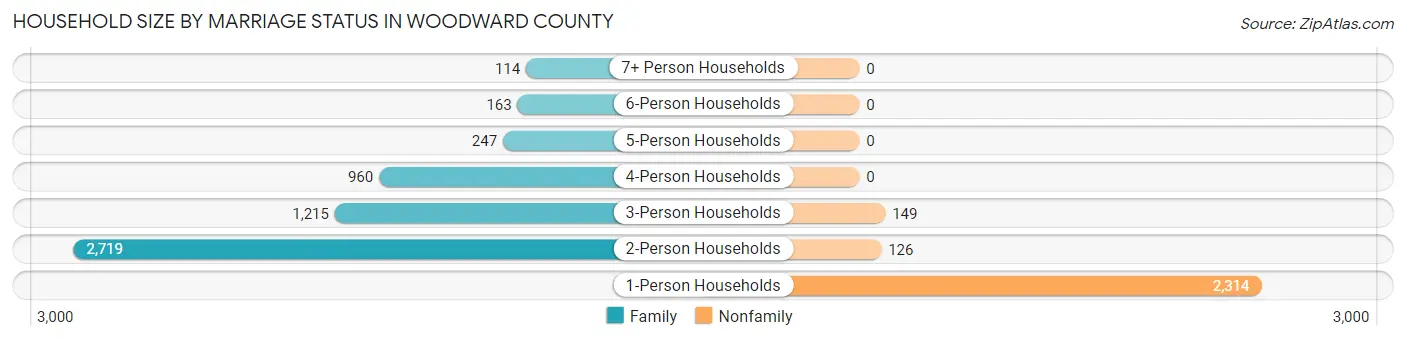
| Household Size | Family Households | Nonfamily Households |
| 1-Person Households | - | 2,314 (28.9%) |
| 2-Person Households | 2,719 (34.0%) | 126 (1.6%) |
| 3-Person Households | 1,215 (15.2%) | 149 (1.9%) |
| 4-Person Households | 960 (12.0%) | 0 (0.0%) |
| 5-Person Households | 247 (3.1%) | 0 (0.0%) |
| 6-Person Households | 163 (2.0%) | 0 (0.0%) |
| 7+ Person Households | 114 (1.4%) | 0 (0.0%) |
| Total | 5,418 (67.7%) | 2,589 (32.3%) |
Female Fertility in Woodward County
Fertility by Age in Woodward County
Average fertility rate in Woodward County is 84.0 births per 1,000 women. Women in the age bracket of 20 to 34 years have the highest fertility rate with 164.0 births per 1,000 women. Women in the age bracket of 20 to 34 years acount for 75.6% of all women with births.
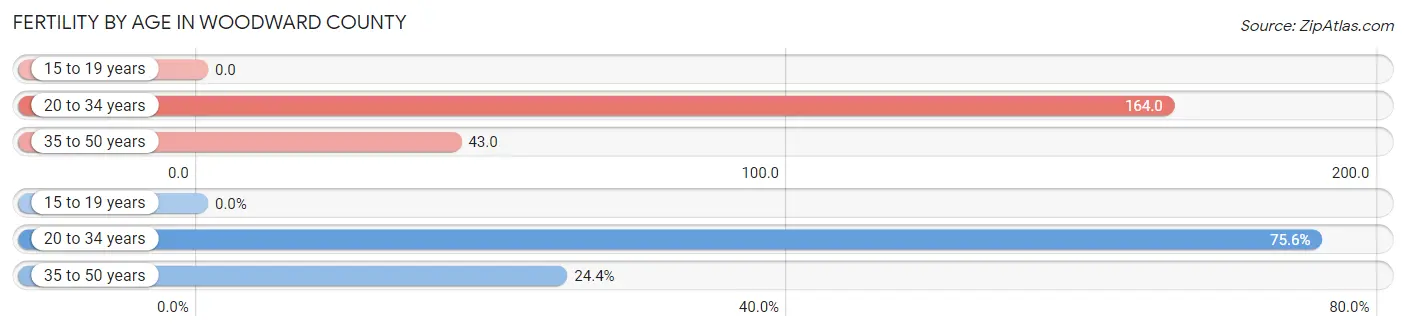
| Age Bracket | Women with Births | Births / 1,000 Women |
| 15 to 19 years | 0 (0.0%) | 0.0 |
| 20 to 34 years | 279 (75.6%) | 164.0 |
| 35 to 50 years | 90 (24.4%) | 43.0 |
| Total | 369 (100.0%) | 84.0 |
Fertility by Age by Marriage Status in Woodward County
75.9% of women with births (369) in Woodward County are married. The highest percentage of unmarried women with births falls into 20 to 34 years age bracket with 29.7% of them unmarried at the time of birth, while the lowest percentage of unmarried women with births belong to 35 to 50 years age bracket with 6.7% of them unmarried.
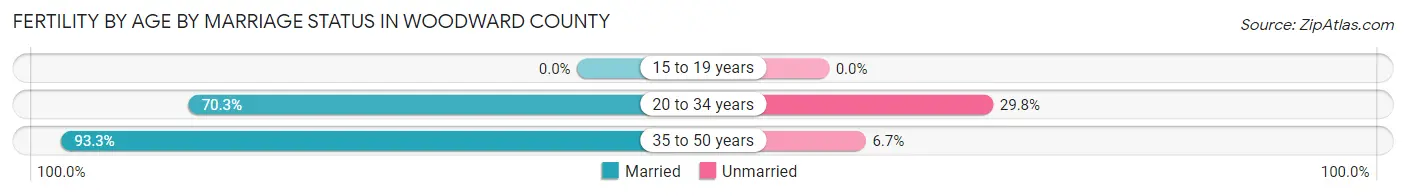
| Age Bracket | Married | Unmarried |
| 15 to 19 years | 0 (0.0%) | 0 (0.0%) |
| 20 to 34 years | 196 (70.3%) | 83 (29.7%) |
| 35 to 50 years | 84 (93.3%) | 6 (6.7%) |
| Total | 280 (75.9%) | 89 (24.1%) |
Fertility by Education in Woodward County
Average fertility rate in Woodward County is 84.0 births per 1,000 women. Women with the education attainment of bachelor's degree have the highest fertility rate of 142.0 births per 1,000 women, while women with the education attainment of college or associate's degree have the lowest fertility at 7.0 births per 1,000 women. Women with the education attainment of high school diploma represent 46.1% of all women with births.
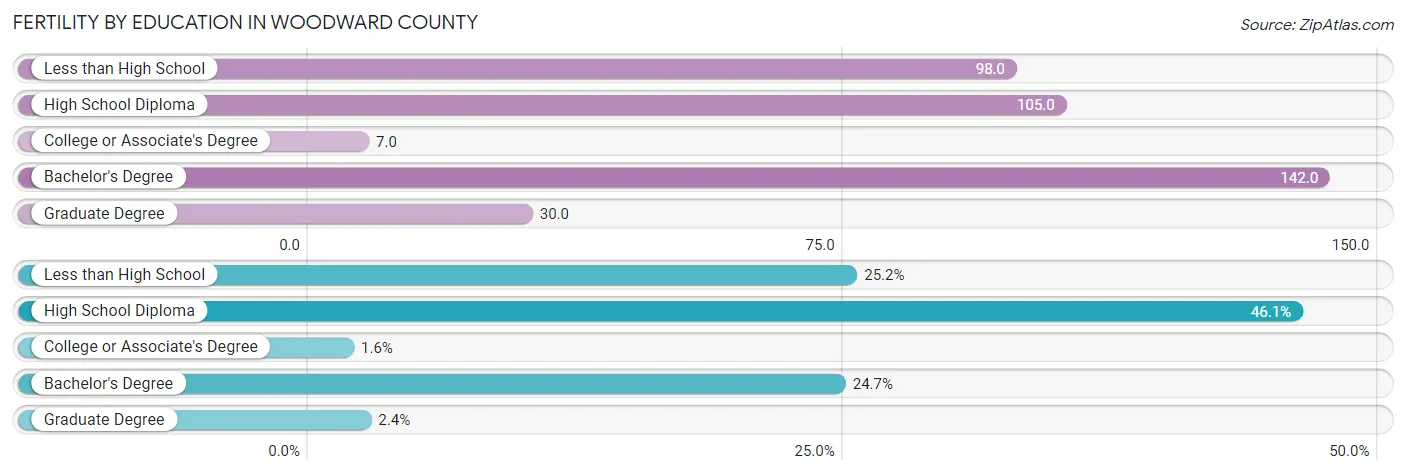
| Educational Attainment | Women with Births | Births / 1,000 Women |
| Less than High School | 93 (25.2%) | 98.0 |
| High School Diploma | 170 (46.1%) | 105.0 |
| College or Associate's Degree | 6 (1.6%) | 7.0 |
| Bachelor's Degree | 91 (24.7%) | 142.0 |
| Graduate Degree | 9 (2.4%) | 30.0 |
| Total | 369 (100.0%) | 84.0 |
Fertility by Education by Marriage Status in Woodward County
24.1% of women with births in Woodward County are unmarried. Women with the educational attainment of less than high school are most likely to be married with 100.0% of them married at childbirth, while women with the educational attainment of high school diploma are least likely to be married with 52.3% of them unmarried at childbirth.
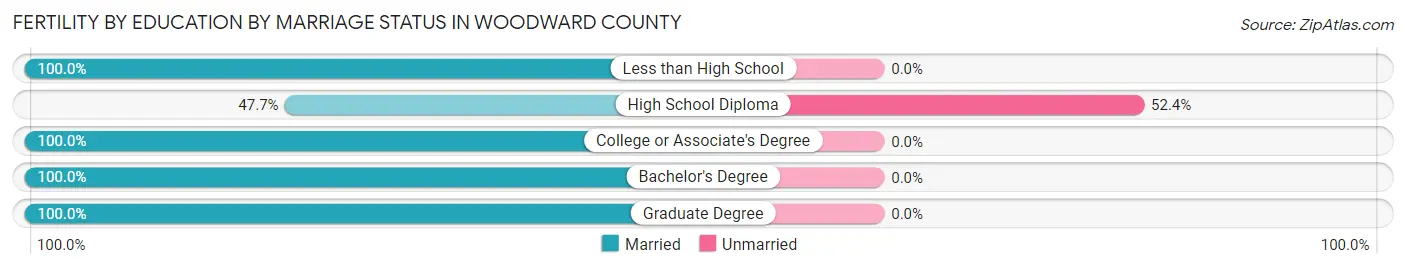
| Educational Attainment | Married | Unmarried |
| Less than High School | 93 (100.0%) | 0 (0.0%) |
| High School Diploma | 81 (47.6%) | 89 (52.3%) |
| College or Associate's Degree | 6 (100.0%) | 0 (0.0%) |
| Bachelor's Degree | 91 (100.0%) | 0 (0.0%) |
| Graduate Degree | 9 (100.0%) | 0 (0.0%) |
| Total | 280 (75.9%) | 89 (24.1%) |
Employment Characteristics in Woodward County
Employment by Class of Employer in Woodward County
Among the 9,248 employed individuals in Woodward County, private company employees (5,645 | 61.0%), state government employees (874 | 9.5%), and local government employees (833 | 9.0%) make up the most common classes of employment.
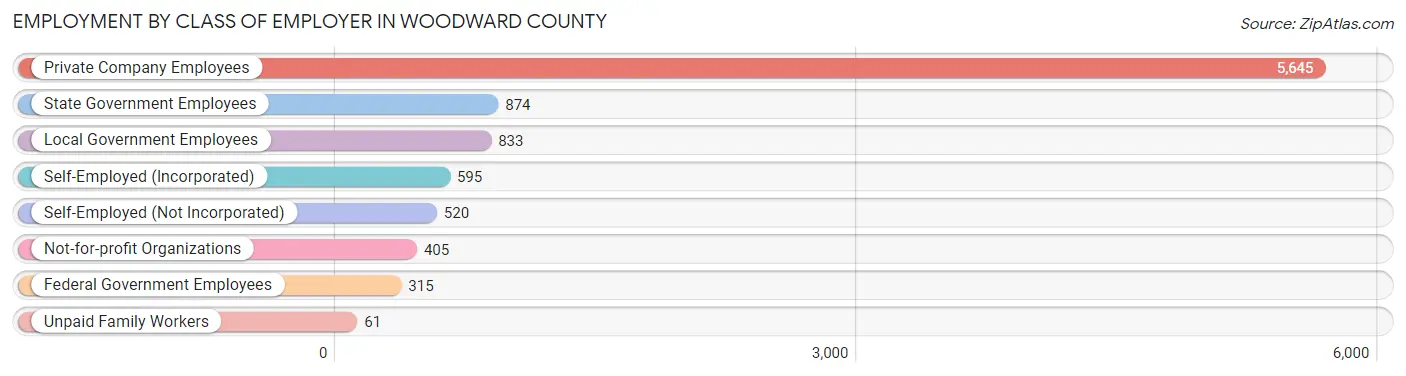
| Employer Class | # Employees | % Employees |
| Private Company Employees | 5,645 | 61.0% |
| Self-Employed (Incorporated) | 595 | 6.4% |
| Self-Employed (Not Incorporated) | 520 | 5.6% |
| Not-for-profit Organizations | 405 | 4.4% |
| Local Government Employees | 833 | 9.0% |
| State Government Employees | 874 | 9.5% |
| Federal Government Employees | 315 | 3.4% |
| Unpaid Family Workers | 61 | 0.7% |
| Total | 9,248 | 100.0% |
Employment Status by Age in Woodward County
According to the labor force statistics for Woodward County, out of the total population over 16 years of age (16,065), 62.0% or 9,960 individuals are in the labor force, with 5.3% or 528 of them unemployed. The age group with the highest labor force participation rate is 25 to 29 years, with 86.5% or 1,195 individuals in the labor force. Within the labor force, the 25 to 29 years age range has the highest percentage of unemployed individuals, with 15.1% or 180 of them being unemployed.
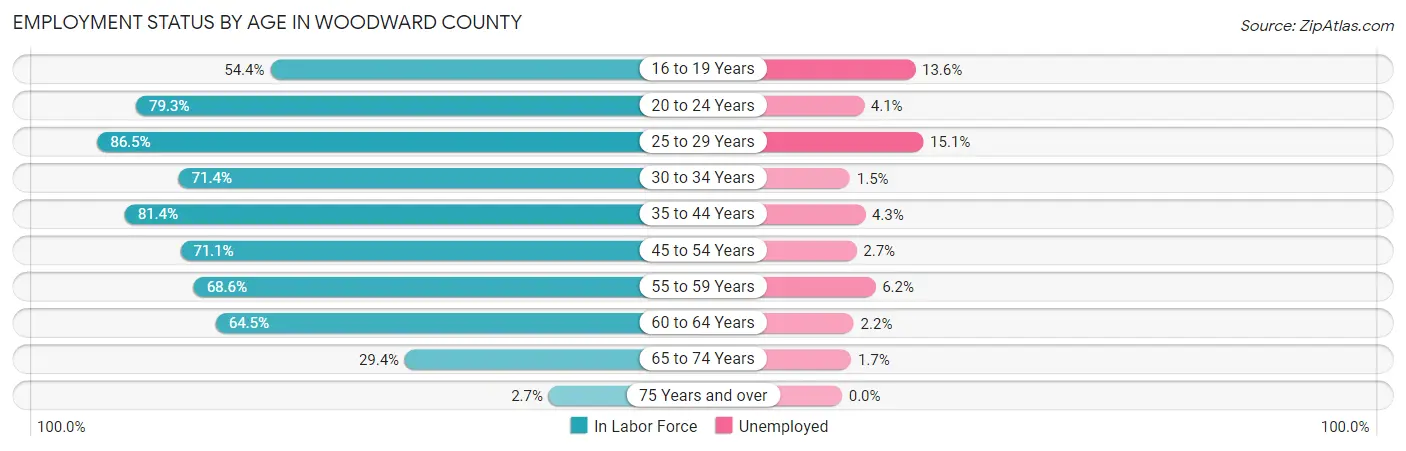
| Age Bracket | In Labor Force | Unemployed |
| 16 to 19 Years | 575 (54.4%) | 78 (13.6%) |
| 20 to 24 Years | 967 (79.3%) | 40 (4.1%) |
| 25 to 29 Years | 1,195 (86.5%) | 180 (15.1%) |
| 30 to 34 Years | 1,035 (71.4%) | 16 (1.5%) |
| 35 to 44 Years | 2,309 (81.4%) | 99 (4.3%) |
| 45 to 54 Years | 1,760 (71.1%) | 48 (2.7%) |
| 55 to 59 Years | 568 (68.6%) | 35 (6.2%) |
| 60 to 64 Years | 997 (64.5%) | 22 (2.2%) |
| 65 to 74 Years | 521 (29.4%) | 9 (1.7%) |
| 75 Years and over | 41 (2.7%) | 0 (0.0%) |
| Total | 9,960 (62.0%) | 528 (5.3%) |
Employment Status by Educational Attainment in Woodward County
According to labor force statistics for Woodward County, 74.8% of individuals (7,865) out of the total population between 25 and 64 years of age (10,515) are in the labor force, with 5.1% or 401 of them being unemployed. The group with the highest labor force participation rate are those with the educational attainment of bachelor's degree or higher, with 87.8% or 1,679 individuals in the labor force. Within the labor force, individuals with college / associate degree education have the highest percentage of unemployment, with 8.3% or 179 of them being unemployed.
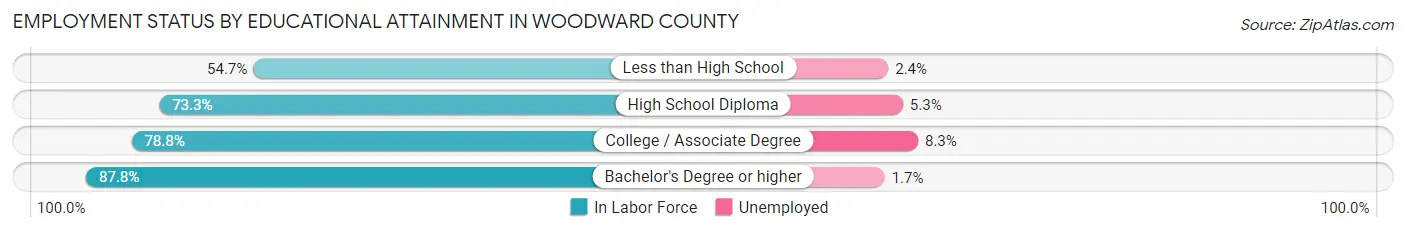
| Educational Attainment | In Labor Force | Unemployed |
| Less than High School | 799 (54.7%) | 35 (2.4%) |
| High School Diploma | 3,233 (73.3%) | 234 (5.3%) |
| College / Associate Degree | 2,152 (78.8%) | 227 (8.3%) |
| Bachelor's Degree or higher | 1,679 (87.8%) | 33 (1.7%) |
| Total | 7,865 (74.8%) | 536 (5.1%) |
Employment Occupations by Sex in Woodward County
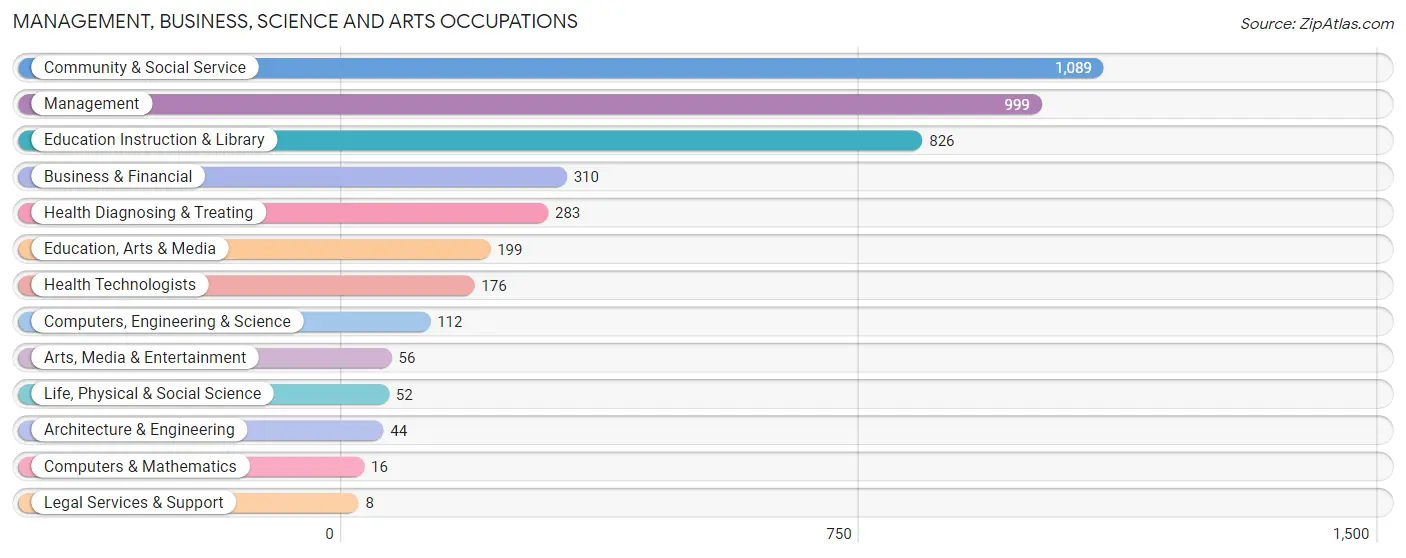
Management, Business, Science and Arts Occupations
The most common Management, Business, Science and Arts occupations in Woodward County are Community & Social Service (1,089 | 11.6%), Management (999 | 10.6%), Education Instruction & Library (826 | 8.8%), Business & Financial (310 | 3.3%), and Health Diagnosing & Treating (283 | 3.0%).
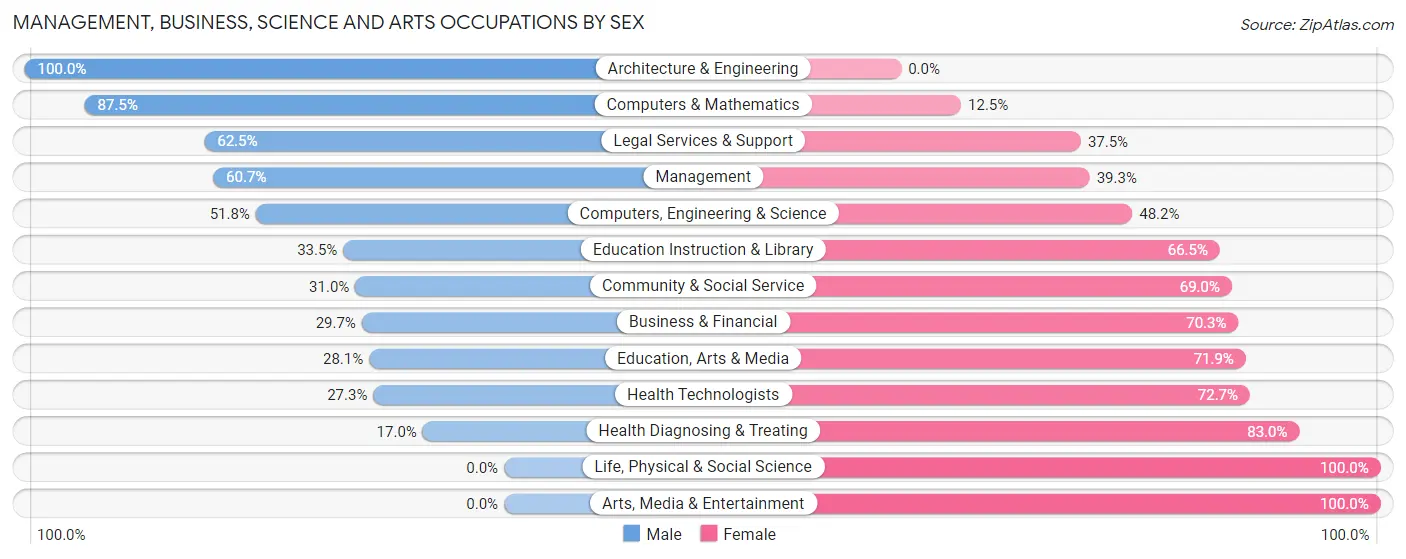
Management, Business, Science and Arts Occupations by Sex
Within the Management, Business, Science and Arts occupations in Woodward County, the most male-oriented occupations are Architecture & Engineering (100.0%), Computers & Mathematics (87.5%), and Legal Services & Support (62.5%), while the most female-oriented occupations are Life, Physical & Social Science (100.0%), Arts, Media & Entertainment (100.0%), and Health Diagnosing & Treating (83.0%).
| Occupation | Male | Female |
| Management | 606 (60.7%) | 393 (39.3%) |
| Business & Financial | 92 (29.7%) | 218 (70.3%) |
| Computers, Engineering & Science | 58 (51.8%) | 54 (48.2%) |
| Computers & Mathematics | 14 (87.5%) | 2 (12.5%) |
| Architecture & Engineering | 44 (100.0%) | 0 (0.0%) |
| Life, Physical & Social Science | 0 (0.0%) | 52 (100.0%) |
| Community & Social Service | 338 (31.0%) | 751 (69.0%) |
| Education, Arts & Media | 56 (28.1%) | 143 (71.9%) |
| Legal Services & Support | 5 (62.5%) | 3 (37.5%) |
| Education Instruction & Library | 277 (33.5%) | 549 (66.5%) |
| Arts, Media & Entertainment | 0 (0.0%) | 56 (100.0%) |
| Health Diagnosing & Treating | 48 (17.0%) | 235 (83.0%) |
| Health Technologists | 48 (27.3%) | 128 (72.7%) |
| Total (Category) | 1,142 (40.9%) | 1,651 (59.1%) |
| Total (Overall) | 5,349 (56.8%) | 4,076 (43.2%) |
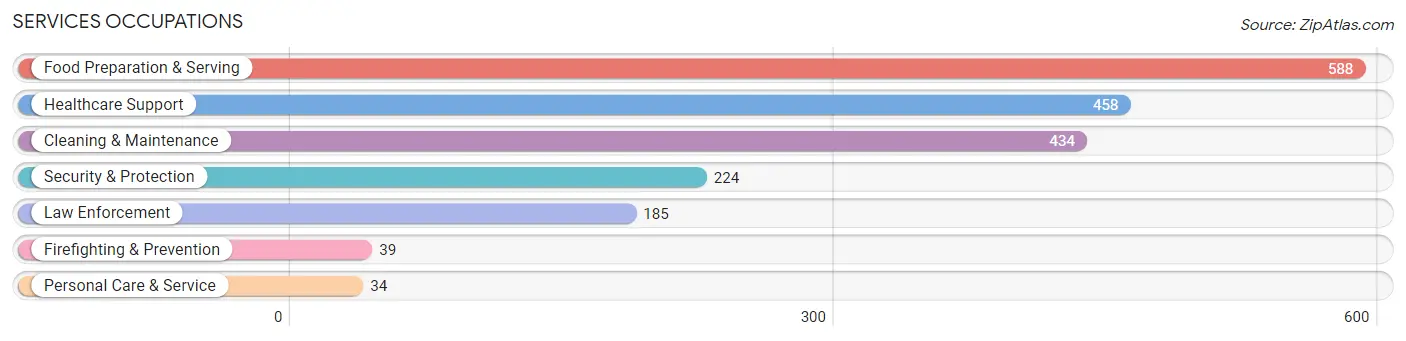
Services Occupations
The most common Services occupations in Woodward County are Food Preparation & Serving (588 | 6.2%), Healthcare Support (458 | 4.9%), Cleaning & Maintenance (434 | 4.6%), Security & Protection (224 | 2.4%), and Law Enforcement (185 | 2.0%).
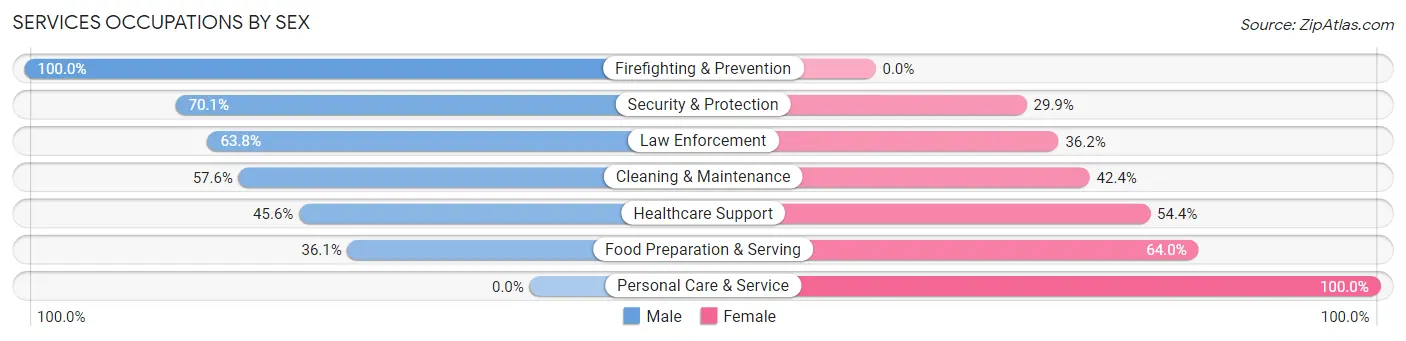
Services Occupations by Sex
Within the Services occupations in Woodward County, the most male-oriented occupations are Firefighting & Prevention (100.0%), Security & Protection (70.1%), and Law Enforcement (63.8%), while the most female-oriented occupations are Personal Care & Service (100.0%), Food Preparation & Serving (63.9%), and Healthcare Support (54.4%).
| Occupation | Male | Female |
| Healthcare Support | 209 (45.6%) | 249 (54.4%) |
| Security & Protection | 157 (70.1%) | 67 (29.9%) |
| Firefighting & Prevention | 39 (100.0%) | 0 (0.0%) |
| Law Enforcement | 118 (63.8%) | 67 (36.2%) |
| Food Preparation & Serving | 212 (36.0%) | 376 (63.9%) |
| Cleaning & Maintenance | 250 (57.6%) | 184 (42.4%) |
| Personal Care & Service | 0 (0.0%) | 34 (100.0%) |
| Total (Category) | 828 (47.6%) | 910 (52.4%) |
| Total (Overall) | 5,349 (56.8%) | 4,076 (43.2%) |
Sales and Office Occupations
The most common Sales and Office occupations in Woodward County are Sales & Related (1,241 | 13.2%), and Office & Administration (696 | 7.4%).
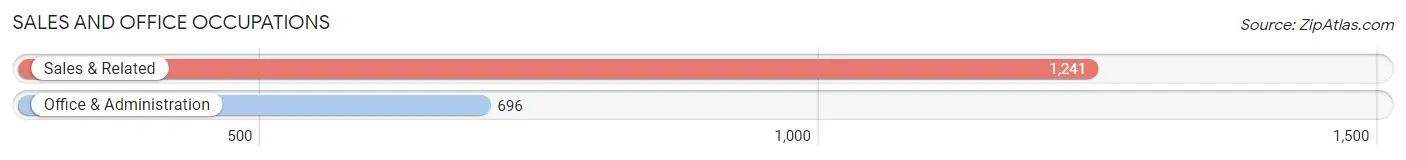
Sales and Office Occupations by Sex
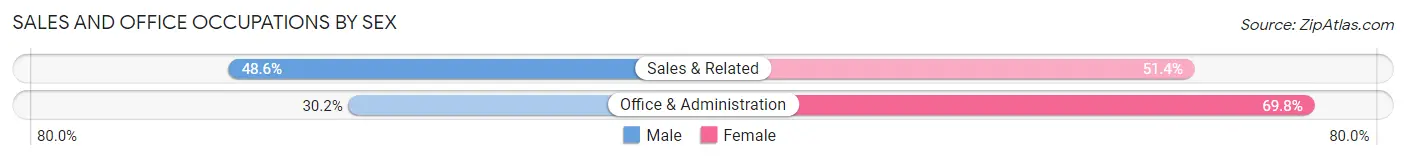
| Occupation | Male | Female |
| Sales & Related | 603 (48.6%) | 638 (51.4%) |
| Office & Administration | 210 (30.2%) | 486 (69.8%) |
| Total (Category) | 813 (42.0%) | 1,124 (58.0%) |
| Total (Overall) | 5,349 (56.8%) | 4,076 (43.2%) |
Natural Resources, Construction and Maintenance Occupations
The most common Natural Resources, Construction and Maintenance occupations in Woodward County are Construction & Extraction (703 | 7.5%), Installation, Maintenance & Repair (358 | 3.8%), and Farming, Fishing & Forestry (115 | 1.2%).
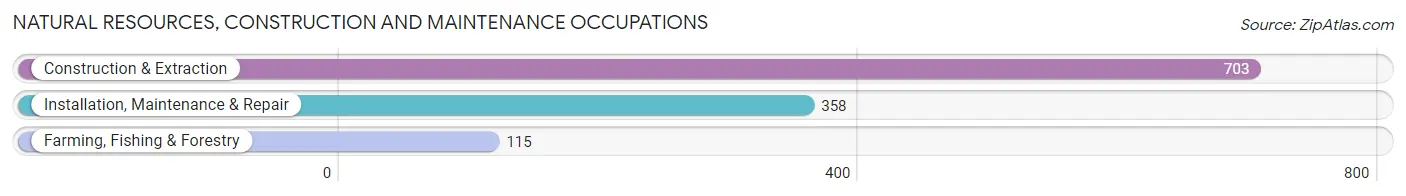
Natural Resources, Construction and Maintenance Occupations by Sex
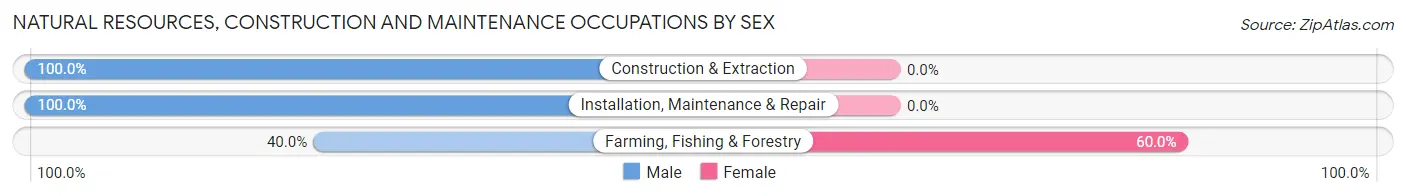
| Occupation | Male | Female |
| Farming, Fishing & Forestry | 46 (40.0%) | 69 (60.0%) |
| Construction & Extraction | 703 (100.0%) | 0 (0.0%) |
| Installation, Maintenance & Repair | 358 (100.0%) | 0 (0.0%) |
| Total (Category) | 1,107 (94.1%) | 69 (5.9%) |
| Total (Overall) | 5,349 (56.8%) | 4,076 (43.2%) |
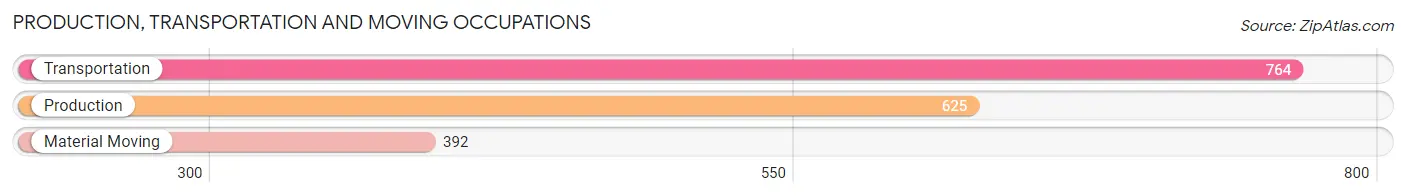
Production, Transportation and Moving Occupations
The most common Production, Transportation and Moving occupations in Woodward County are Transportation (764 | 8.1%), Production (625 | 6.6%), and Material Moving (392 | 4.2%).
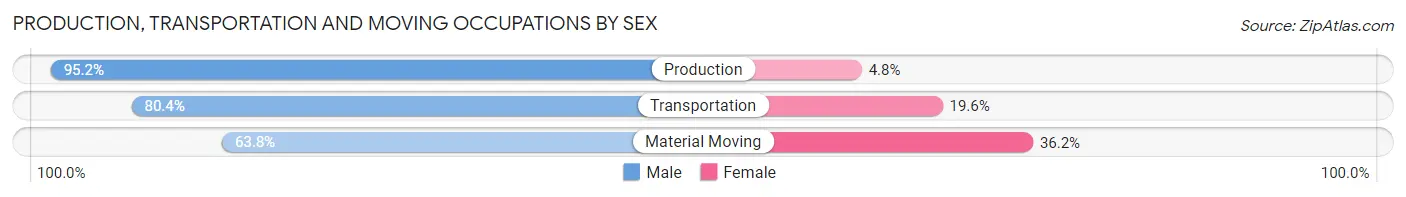
Production, Transportation and Moving Occupations by Sex
| Occupation | Male | Female |
| Production | 595 (95.2%) | 30 (4.8%) |
| Transportation | 614 (80.4%) | 150 (19.6%) |
| Material Moving | 250 (63.8%) | 142 (36.2%) |
| Total (Category) | 1,459 (81.9%) | 322 (18.1%) |
| Total (Overall) | 5,349 (56.8%) | 4,076 (43.2%) |
Employment Industries by Sex in Woodward County
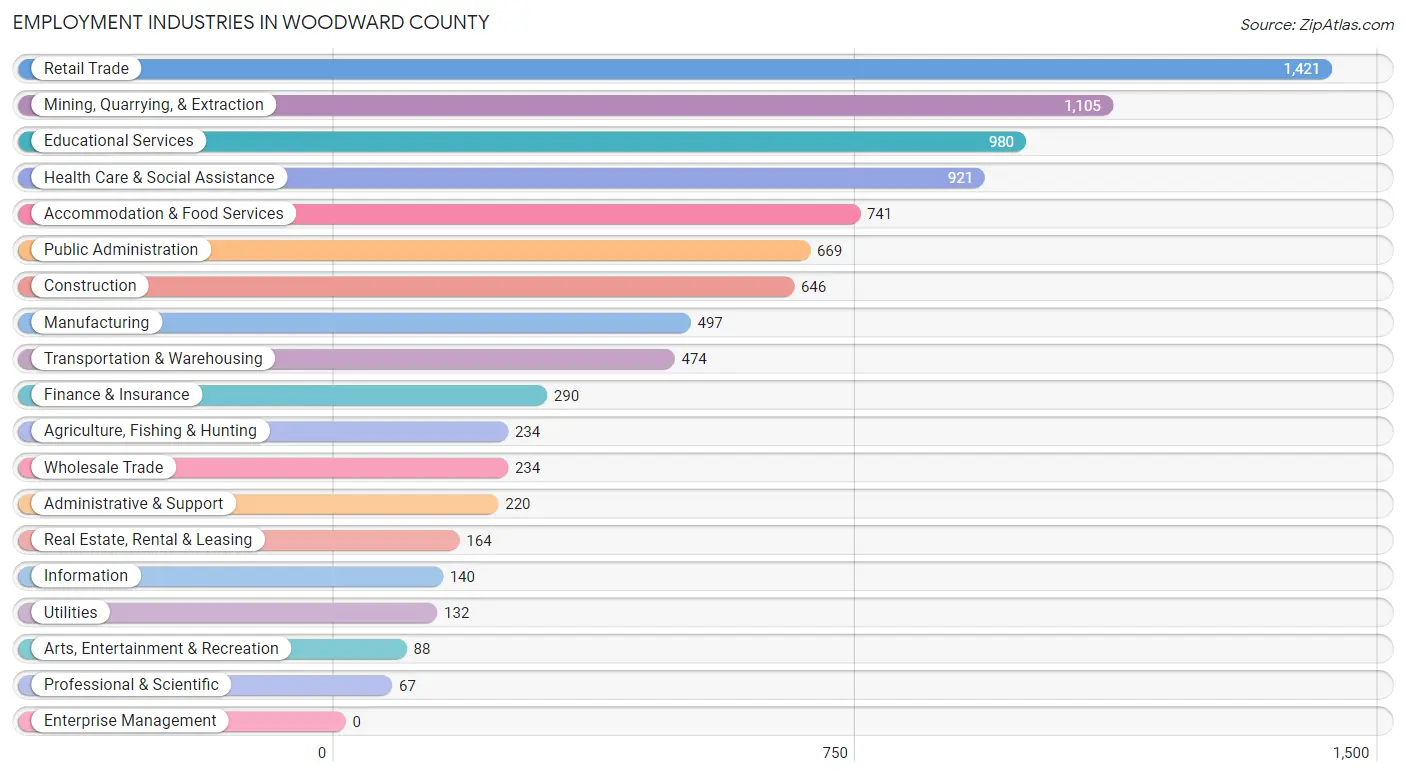
Employment Industries in Woodward County
The major employment industries in Woodward County include Retail Trade (1,421 | 15.1%), Mining, Quarrying, & Extraction (1,105 | 11.7%), Educational Services (980 | 10.4%), Health Care & Social Assistance (921 | 9.8%), and Accommodation & Food Services (741 | 7.9%).
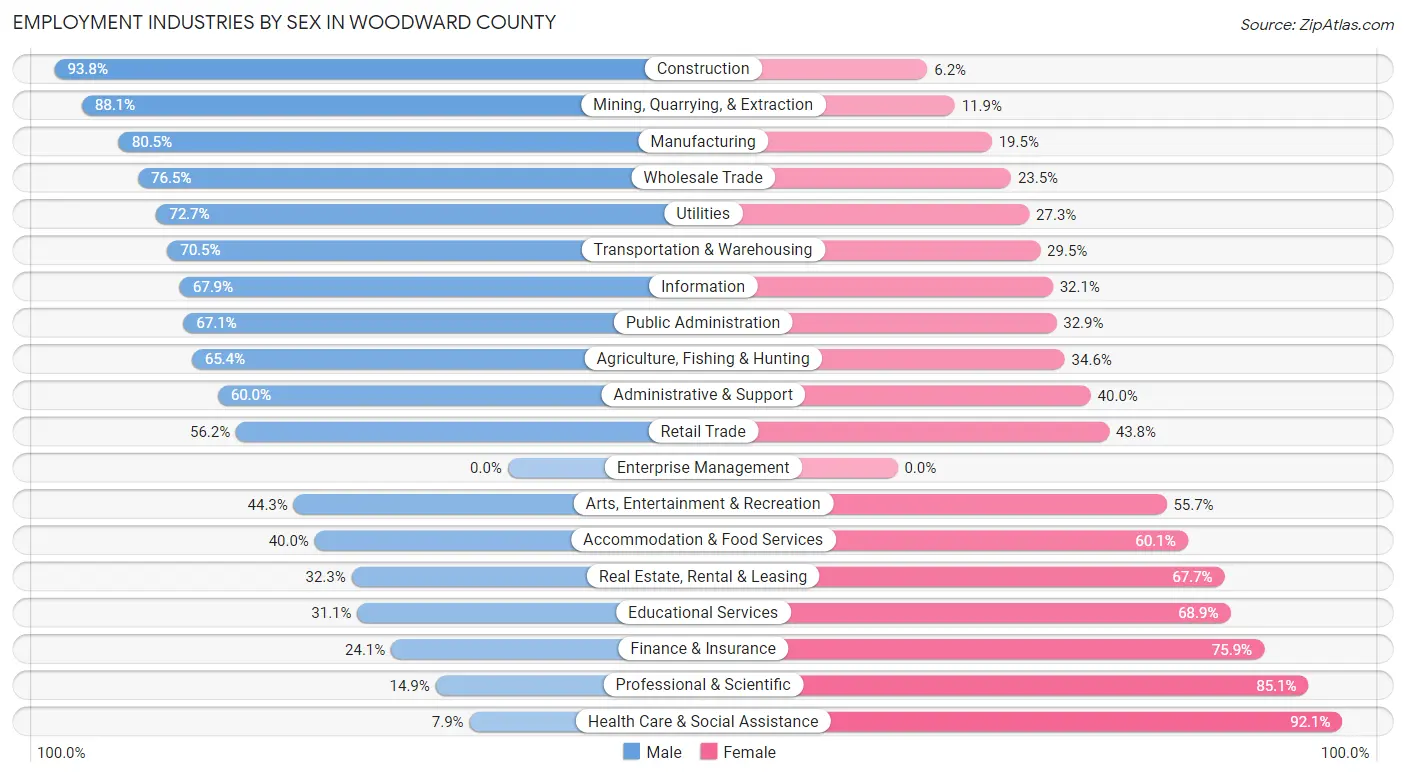
Employment Industries by Sex in Woodward County
The Woodward County industries that see more men than women are Construction (93.8%), Mining, Quarrying, & Extraction (88.1%), and Manufacturing (80.5%), whereas the industries that tend to have a higher number of women are Health Care & Social Assistance (92.1%), Professional & Scientific (85.1%), and Finance & Insurance (75.9%).
| Industry | Male | Female |
| Agriculture, Fishing & Hunting | 153 (65.4%) | 81 (34.6%) |
| Mining, Quarrying, & Extraction | 974 (88.1%) | 131 (11.9%) |
| Construction | 606 (93.8%) | 40 (6.2%) |
| Manufacturing | 400 (80.5%) | 97 (19.5%) |
| Wholesale Trade | 179 (76.5%) | 55 (23.5%) |
| Retail Trade | 799 (56.2%) | 622 (43.8%) |
| Transportation & Warehousing | 334 (70.5%) | 140 (29.5%) |
| Utilities | 96 (72.7%) | 36 (27.3%) |
| Information | 95 (67.9%) | 45 (32.1%) |
| Finance & Insurance | 70 (24.1%) | 220 (75.9%) |
| Real Estate, Rental & Leasing | 53 (32.3%) | 111 (67.7%) |
| Professional & Scientific | 10 (14.9%) | 57 (85.1%) |
| Enterprise Management | 0 (0.0%) | 0 (0.0%) |
| Administrative & Support | 132 (60.0%) | 88 (40.0%) |
| Educational Services | 305 (31.1%) | 675 (68.9%) |
| Health Care & Social Assistance | 73 (7.9%) | 848 (92.1%) |
| Arts, Entertainment & Recreation | 39 (44.3%) | 49 (55.7%) |
| Accommodation & Food Services | 296 (40.0%) | 445 (60.1%) |
| Public Administration | 449 (67.1%) | 220 (32.9%) |
| Total | 5,349 (56.8%) | 4,076 (43.2%) |
Education in Woodward County
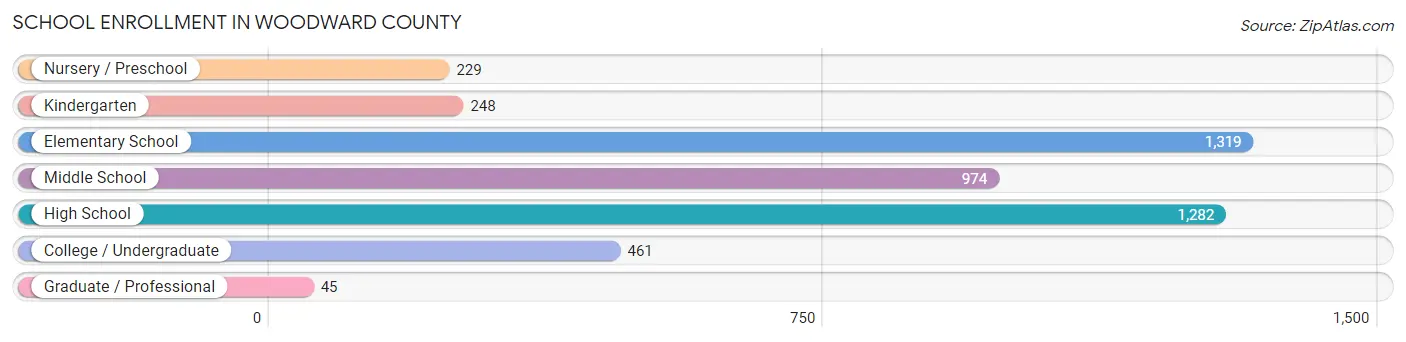
School Enrollment in Woodward County
The most common levels of schooling among the 4,558 students in Woodward County are elementary school (1,319 | 28.9%), high school (1,282 | 28.1%), and middle school (974 | 21.4%).
| School Level | # Students | % Students |
| Nursery / Preschool | 229 | 5.0% |
| Kindergarten | 248 | 5.4% |
| Elementary School | 1,319 | 28.9% |
| Middle School | 974 | 21.4% |
| High School | 1,282 | 28.1% |
| College / Undergraduate | 461 | 10.1% |
| Graduate / Professional | 45 | 1.0% |
| Total | 4,558 | 100.0% |
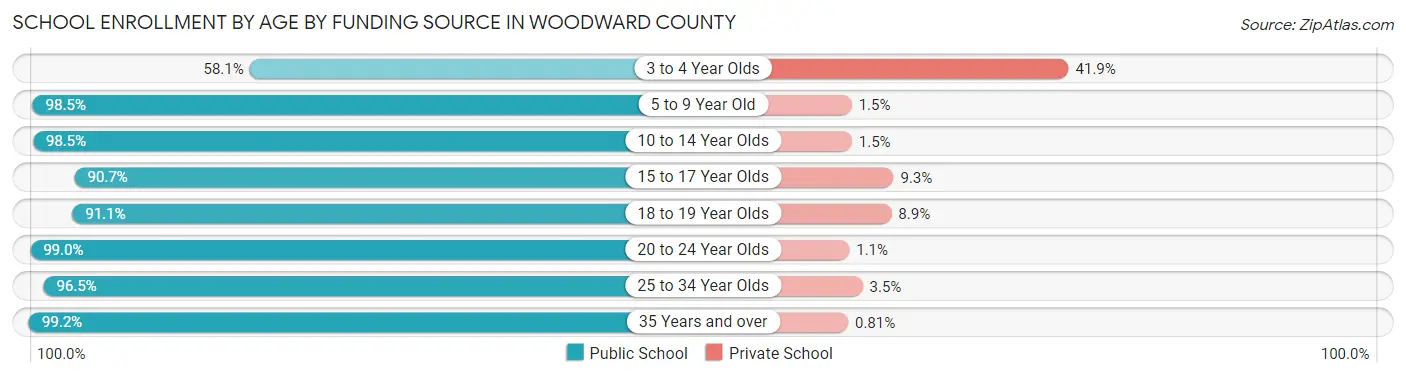
School Enrollment by Age by Funding Source in Woodward County
Out of a total of 4,558 students who are enrolled in schools in Woodward County, 232 (5.1%) attend a private institution, while the remaining 4,326 (94.9%) are enrolled in public schools. The age group of 3 to 4 year olds has the highest likelihood of being enrolled in private schools, with 75 (41.9% in the age bracket) enrolled. Conversely, the age group of 35 years and over has the lowest likelihood of being enrolled in a private school, with 245 (99.2% in the age bracket) attending a public institution.
| Age Bracket | Public School | Private School |
| 3 to 4 Year Olds | 104 (58.1%) | 75 (41.9%) |
| 5 to 9 Year Old | 1,378 (98.5%) | 21 (1.5%) |
| 10 to 14 Year Olds | 1,289 (98.5%) | 20 (1.5%) |
| 15 to 17 Year Olds | 791 (90.7%) | 81 (9.3%) |
| 18 to 19 Year Olds | 287 (91.1%) | 28 (8.9%) |
| 20 to 24 Year Olds | 94 (99.0%) | 1 (1.1%) |
| 25 to 34 Year Olds | 137 (96.5%) | 5 (3.5%) |
| 35 Years and over | 245 (99.2%) | 2 (0.8%) |
| Total | 4,326 (94.9%) | 232 (5.1%) |
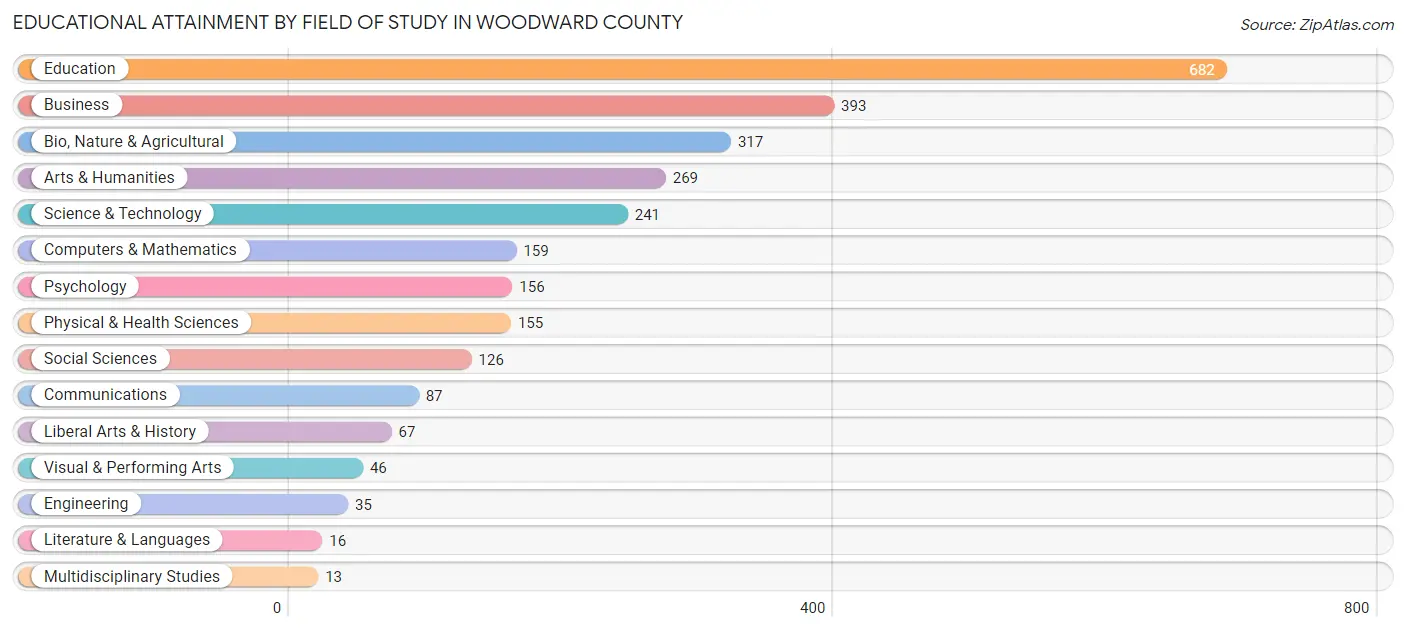
Educational Attainment by Field of Study in Woodward County
Education (682 | 24.7%), business (393 | 14.2%), bio, nature & agricultural (317 | 11.5%), arts & humanities (269 | 9.7%), and science & technology (241 | 8.7%) are the most common fields of study among 2,762 individuals in Woodward County who have obtained a bachelor's degree or higher.
| Field of Study | # Graduates | % Graduates |
| Computers & Mathematics | 159 | 5.8% |
| Bio, Nature & Agricultural | 317 | 11.5% |
| Physical & Health Sciences | 155 | 5.6% |
| Psychology | 156 | 5.7% |
| Social Sciences | 126 | 4.6% |
| Engineering | 35 | 1.3% |
| Multidisciplinary Studies | 13 | 0.5% |
| Science & Technology | 241 | 8.7% |
| Business | 393 | 14.2% |
| Education | 682 | 24.7% |
| Literature & Languages | 16 | 0.6% |
| Liberal Arts & History | 67 | 2.4% |
| Visual & Performing Arts | 46 | 1.7% |
| Communications | 87 | 3.2% |
| Arts & Humanities | 269 | 9.7% |
| Total | 2,762 | 100.0% |
Transportation & Commute in Woodward County
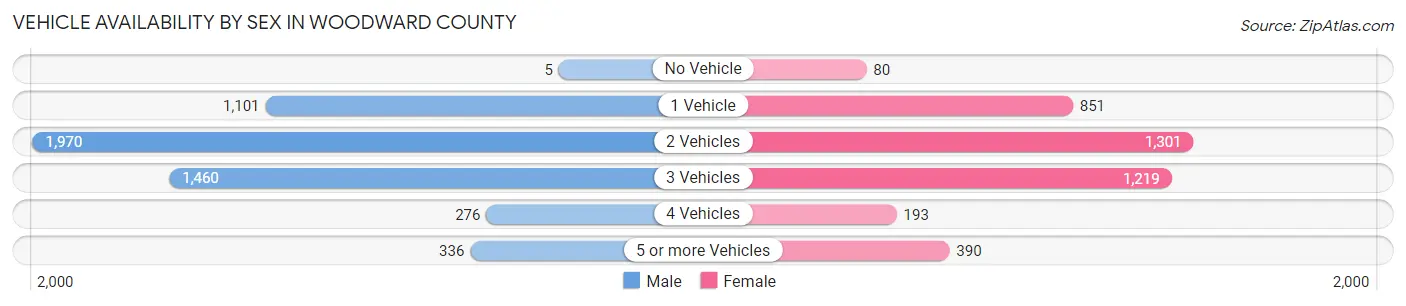
Vehicle Availability by Sex in Woodward County
The most prevalent vehicle ownership categories in Woodward County are males with 2 vehicles (1,970, accounting for 38.3%) and females with 2 vehicles (1,301, making up 48.8%).
| Vehicles Available | Male | Female |
| No Vehicle | 5 (0.1%) | 80 (2.0%) |
| 1 Vehicle | 1,101 (21.4%) | 851 (21.1%) |
| 2 Vehicles | 1,970 (38.3%) | 1,301 (32.3%) |
| 3 Vehicles | 1,460 (28.4%) | 1,219 (30.2%) |
| 4 Vehicles | 276 (5.4%) | 193 (4.8%) |
| 5 or more Vehicles | 336 (6.5%) | 390 (9.7%) |
| Total | 5,148 (100.0%) | 4,034 (100.0%) |
Commute Time in Woodward County
The most frequently occuring commute durations in Woodward County are 5 to 9 minutes (2,382 commuters, 26.3%), 10 to 14 minutes (1,944 commuters, 21.5%), and 15 to 19 minutes (1,432 commuters, 15.8%).
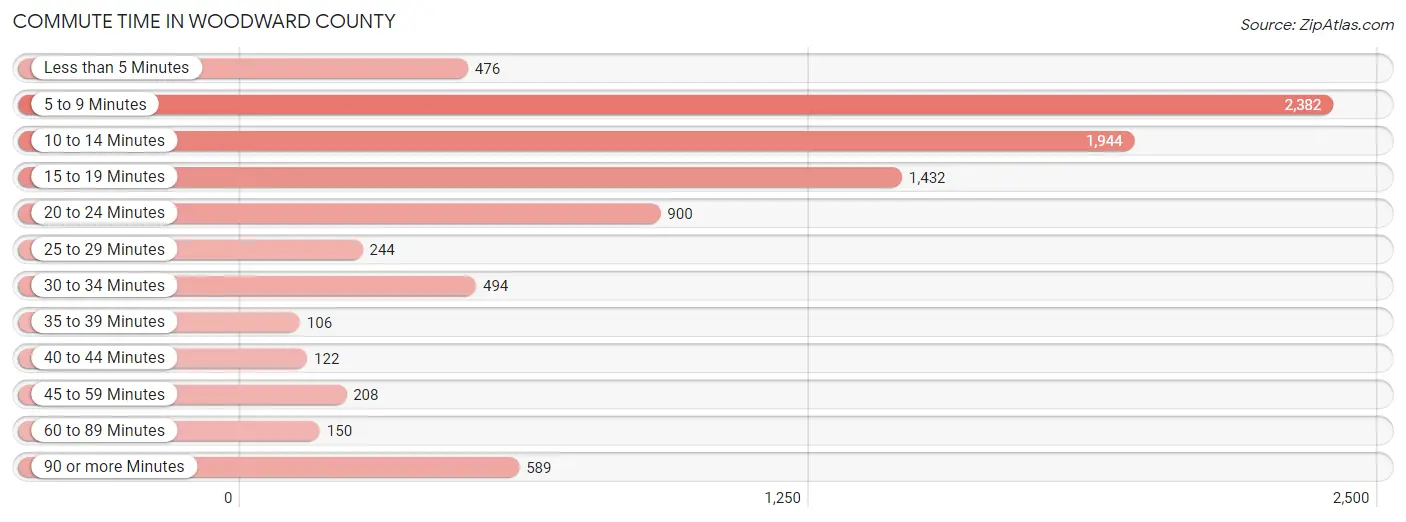
| Commute Time | # Commuters | % Commuters |
| Less than 5 Minutes | 476 | 5.3% |
| 5 to 9 Minutes | 2,382 | 26.3% |
| 10 to 14 Minutes | 1,944 | 21.5% |
| 15 to 19 Minutes | 1,432 | 15.8% |
| 20 to 24 Minutes | 900 | 10.0% |
| 25 to 29 Minutes | 244 | 2.7% |
| 30 to 34 Minutes | 494 | 5.5% |
| 35 to 39 Minutes | 106 | 1.2% |
| 40 to 44 Minutes | 122 | 1.3% |
| 45 to 59 Minutes | 208 | 2.3% |
| 60 to 89 Minutes | 150 | 1.7% |
| 90 or more Minutes | 589 | 6.5% |
Commute Time by Sex in Woodward County
The most common commute times in Woodward County are 5 to 9 minutes (1,269 commuters, 24.6%) for males and 5 to 9 minutes (1,113 commuters, 28.7%) for females.
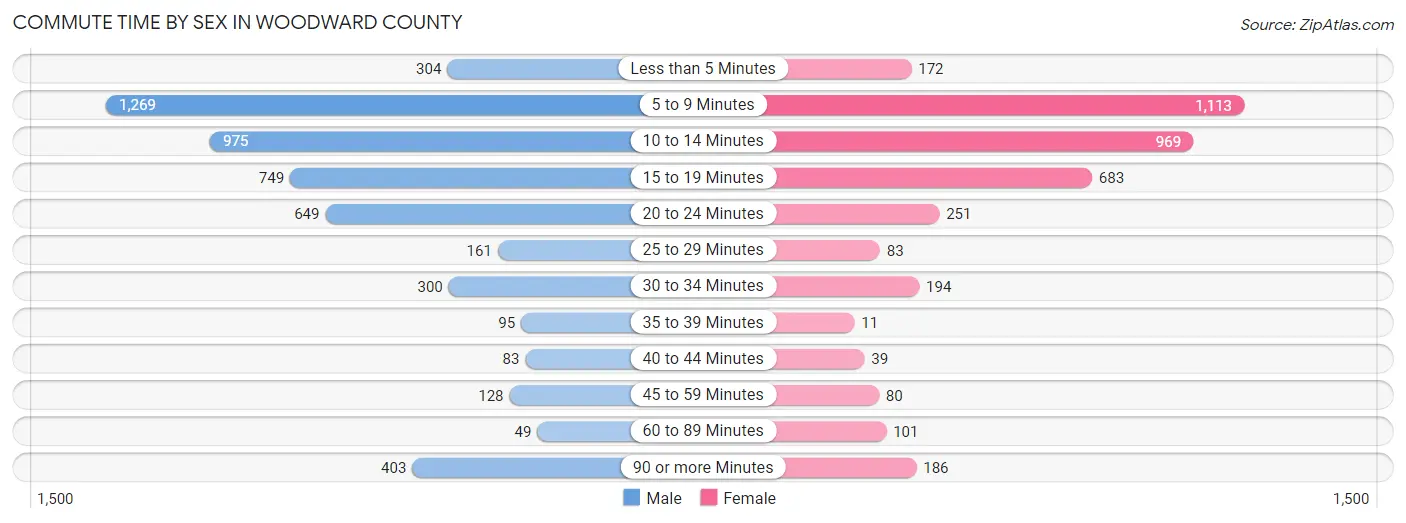
| Commute Time | Male | Female |
| Less than 5 Minutes | 304 (5.9%) | 172 (4.4%) |
| 5 to 9 Minutes | 1,269 (24.6%) | 1,113 (28.7%) |
| 10 to 14 Minutes | 975 (18.9%) | 969 (25.0%) |
| 15 to 19 Minutes | 749 (14.5%) | 683 (17.6%) |
| 20 to 24 Minutes | 649 (12.6%) | 251 (6.5%) |
| 25 to 29 Minutes | 161 (3.1%) | 83 (2.1%) |
| 30 to 34 Minutes | 300 (5.8%) | 194 (5.0%) |
| 35 to 39 Minutes | 95 (1.8%) | 11 (0.3%) |
| 40 to 44 Minutes | 83 (1.6%) | 39 (1.0%) |
| 45 to 59 Minutes | 128 (2.5%) | 80 (2.1%) |
| 60 to 89 Minutes | 49 (0.9%) | 101 (2.6%) |
| 90 or more Minutes | 403 (7.8%) | 186 (4.8%) |
Time of Departure to Work by Sex in Woodward County
The most frequent times of departure to work in Woodward County are 7:00 AM to 7:29 AM (858, 16.6%) for males and 7:30 AM to 7:59 AM (811, 20.9%) for females.
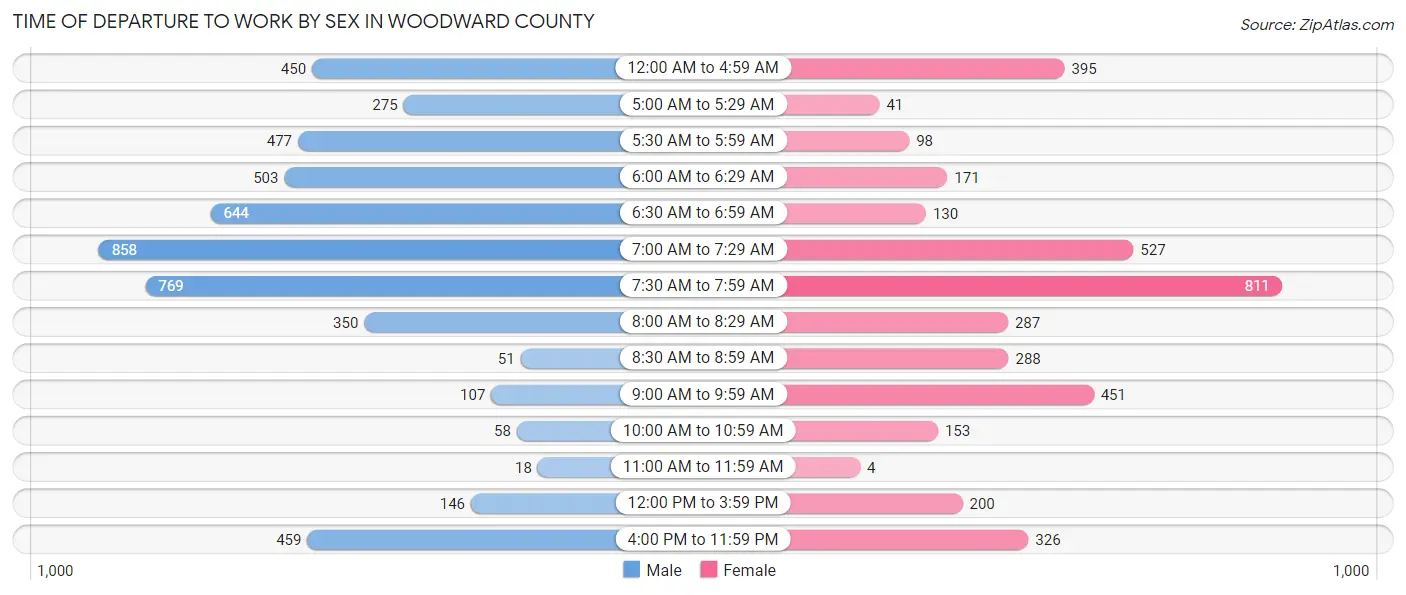
| Time of Departure | Male | Female |
| 12:00 AM to 4:59 AM | 450 (8.7%) | 395 (10.2%) |
| 5:00 AM to 5:29 AM | 275 (5.3%) | 41 (1.1%) |
| 5:30 AM to 5:59 AM | 477 (9.2%) | 98 (2.5%) |
| 6:00 AM to 6:29 AM | 503 (9.7%) | 171 (4.4%) |
| 6:30 AM to 6:59 AM | 644 (12.5%) | 130 (3.4%) |
| 7:00 AM to 7:29 AM | 858 (16.6%) | 527 (13.6%) |
| 7:30 AM to 7:59 AM | 769 (14.9%) | 811 (20.9%) |
| 8:00 AM to 8:29 AM | 350 (6.8%) | 287 (7.4%) |
| 8:30 AM to 8:59 AM | 51 (1.0%) | 288 (7.4%) |
| 9:00 AM to 9:59 AM | 107 (2.1%) | 451 (11.6%) |
| 10:00 AM to 10:59 AM | 58 (1.1%) | 153 (3.9%) |
| 11:00 AM to 11:59 AM | 18 (0.4%) | 4 (0.1%) |
| 12:00 PM to 3:59 PM | 146 (2.8%) | 200 (5.1%) |
| 4:00 PM to 11:59 PM | 459 (8.9%) | 326 (8.4%) |
| Total | 5,165 (100.0%) | 3,882 (100.0%) |
Housing Occupancy in Woodward County
Occupancy by Ownership in Woodward County
Of the total 8,007 dwellings in Woodward County, owner-occupied units account for 5,712 (71.3%), while renter-occupied units make up 2,295 (28.7%).
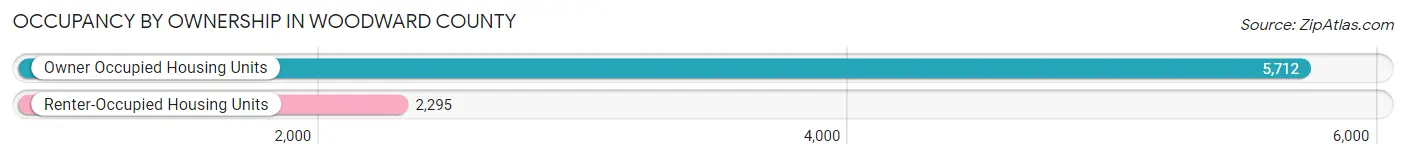
| Occupancy | # Housing Units | % Housing Units |
| Owner Occupied Housing Units | 5,712 | 71.3% |
| Renter-Occupied Housing Units | 2,295 | 28.7% |
| Total Occupied Housing Units | 8,007 | 100.0% |
Occupancy by Household Size in Woodward County
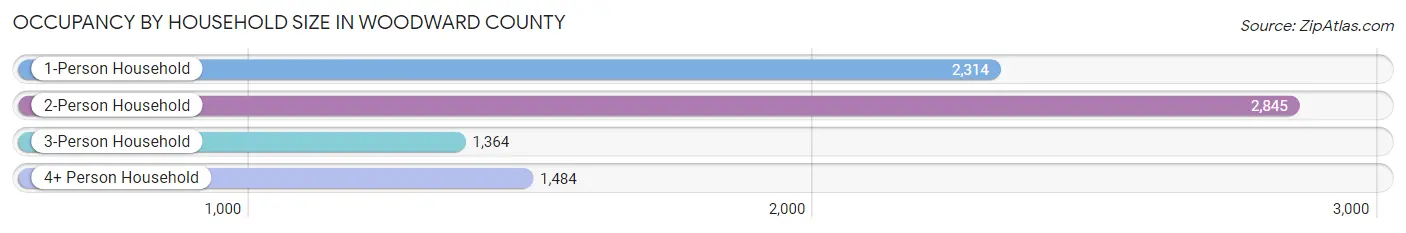
| Household Size | # Housing Units | % Housing Units |
| 1-Person Household | 2,314 | 28.9% |
| 2-Person Household | 2,845 | 35.5% |
| 3-Person Household | 1,364 | 17.0% |
| 4+ Person Household | 1,484 | 18.5% |
| Total Housing Units | 8,007 | 100.0% |
Occupancy by Ownership by Household Size in Woodward County
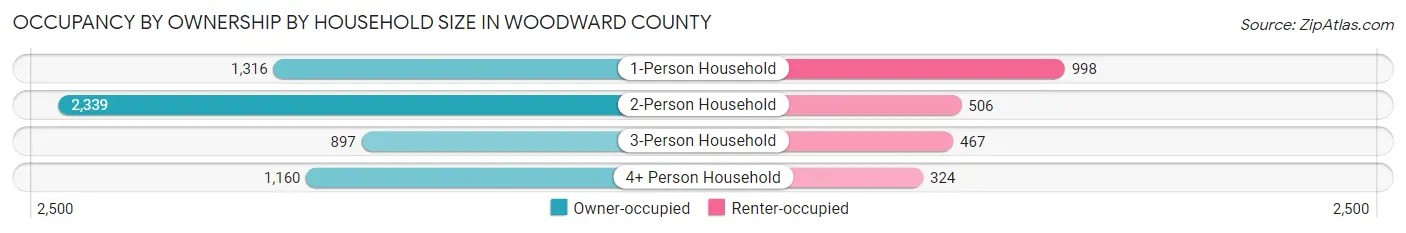
| Household Size | Owner-occupied | Renter-occupied |
| 1-Person Household | 1,316 (56.9%) | 998 (43.1%) |
| 2-Person Household | 2,339 (82.2%) | 506 (17.8%) |
| 3-Person Household | 897 (65.8%) | 467 (34.2%) |
| 4+ Person Household | 1,160 (78.2%) | 324 (21.8%) |
| Total Housing Units | 5,712 (71.3%) | 2,295 (28.7%) |
Occupancy by Educational Attainment in Woodward County
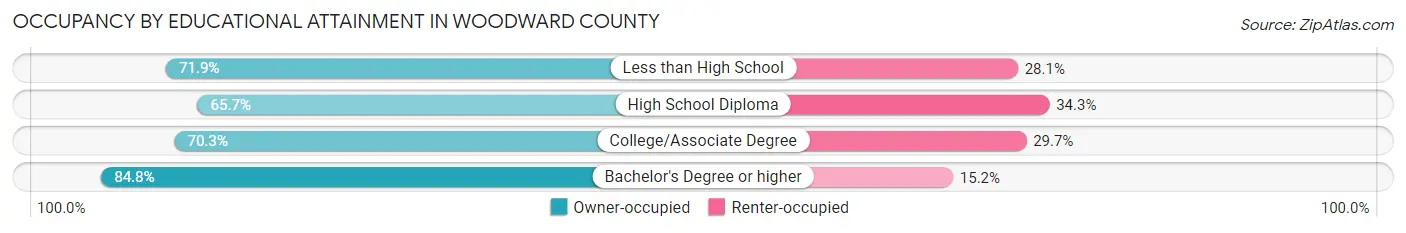
| Household Size | Owner-occupied | Renter-occupied |
| Less than High School | 474 (71.9%) | 185 (28.1%) |
| High School Diploma | 2,269 (65.7%) | 1,185 (34.3%) |
| College/Associate Degree | 1,609 (70.3%) | 681 (29.7%) |
| Bachelor's Degree or higher | 1,360 (84.8%) | 244 (15.2%) |
Occupancy by Age of Householder in Woodward County
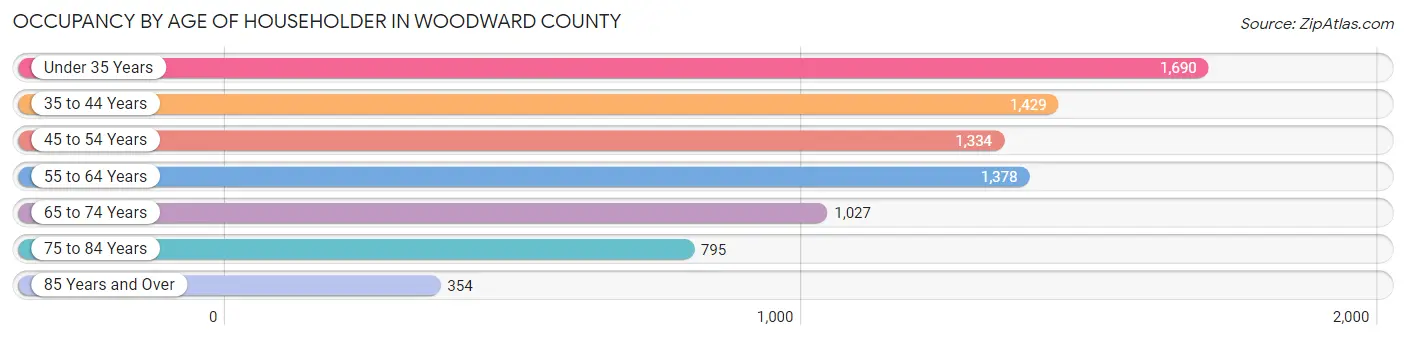
| Age Bracket | # Households | % Households |
| Under 35 Years | 1,690 | 21.1% |
| 35 to 44 Years | 1,429 | 17.8% |
| 45 to 54 Years | 1,334 | 16.7% |
| 55 to 64 Years | 1,378 | 17.2% |
| 65 to 74 Years | 1,027 | 12.8% |
| 75 to 84 Years | 795 | 9.9% |
| 85 Years and Over | 354 | 4.4% |
| Total | 8,007 | 100.0% |
Housing Finances in Woodward County
Median Income by Occupancy in Woodward County
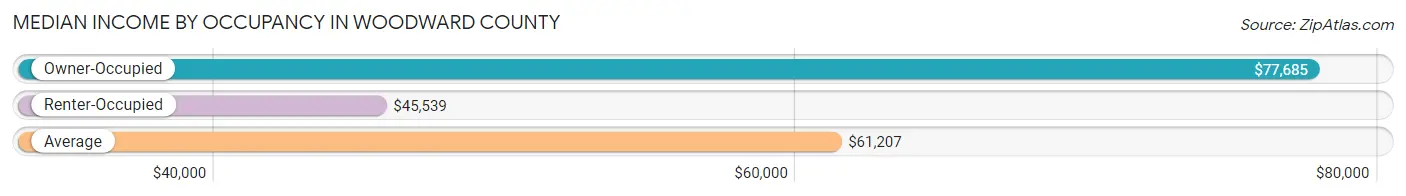
| Occupancy Type | # Households | Median Income |
| Owner-Occupied | 5,712 (71.3%) | $77,685 |
| Renter-Occupied | 2,295 (28.7%) | $45,539 |
| Average | 8,007 (100.0%) | $61,207 |
Occupancy by Householder Income Bracket in Woodward County
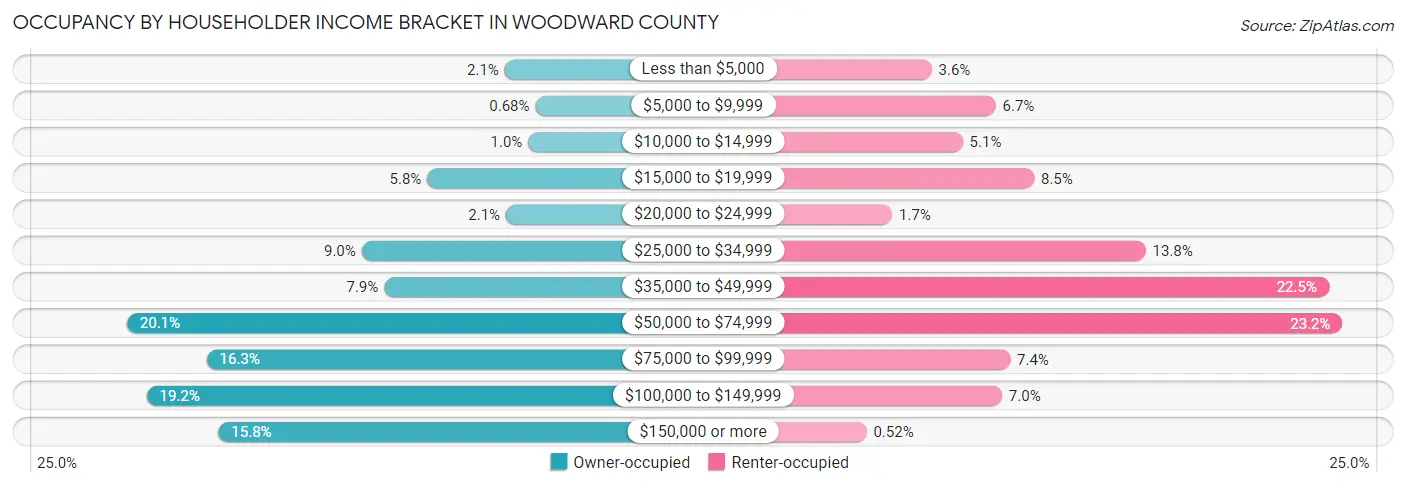
| Income Bracket | Owner-occupied | Renter-occupied |
| Less than $5,000 | 122 (2.1%) | 83 (3.6%) |
| $5,000 to $9,999 | 39 (0.7%) | 153 (6.7%) |
| $10,000 to $14,999 | 58 (1.0%) | 117 (5.1%) |
| $15,000 to $19,999 | 333 (5.8%) | 195 (8.5%) |
| $20,000 to $24,999 | 119 (2.1%) | 40 (1.7%) |
| $25,000 to $34,999 | 511 (8.9%) | 317 (13.8%) |
| $35,000 to $49,999 | 450 (7.9%) | 517 (22.5%) |
| $50,000 to $74,999 | 1,150 (20.1%) | 532 (23.2%) |
| $75,000 to $99,999 | 933 (16.3%) | 169 (7.4%) |
| $100,000 to $149,999 | 1,096 (19.2%) | 160 (7.0%) |
| $150,000 or more | 901 (15.8%) | 12 (0.5%) |
| Total | 5,712 (100.0%) | 2,295 (100.0%) |
Monthly Housing Cost Tiers in Woodward County
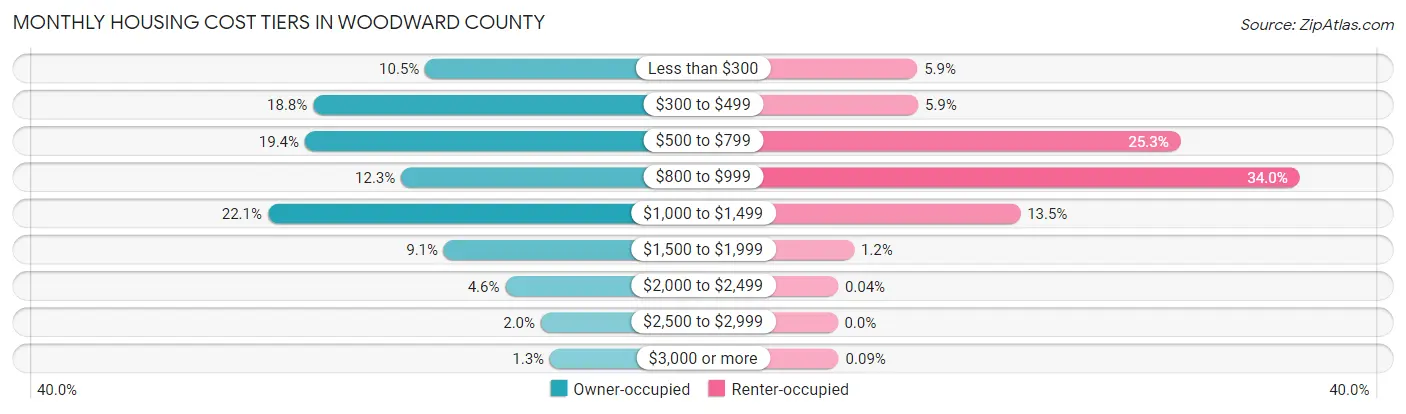
| Monthly Cost | Owner-occupied | Renter-occupied |
| Less than $300 | 600 (10.5%) | 135 (5.9%) |
| $300 to $499 | 1,071 (18.8%) | 136 (5.9%) |
| $500 to $799 | 1,106 (19.4%) | 580 (25.3%) |
| $800 to $999 | 701 (12.3%) | 781 (34.0%) |
| $1,000 to $1,499 | 1,262 (22.1%) | 309 (13.5%) |
| $1,500 to $1,999 | 521 (9.1%) | 28 (1.2%) |
| $2,000 to $2,499 | 263 (4.6%) | 1 (0.0%) |
| $2,500 to $2,999 | 113 (2.0%) | 0 (0.0%) |
| $3,000 or more | 75 (1.3%) | 2 (0.1%) |
| Total | 5,712 (100.0%) | 2,295 (100.0%) |
Physical Housing Characteristics in Woodward County
Housing Structures in Woodward County
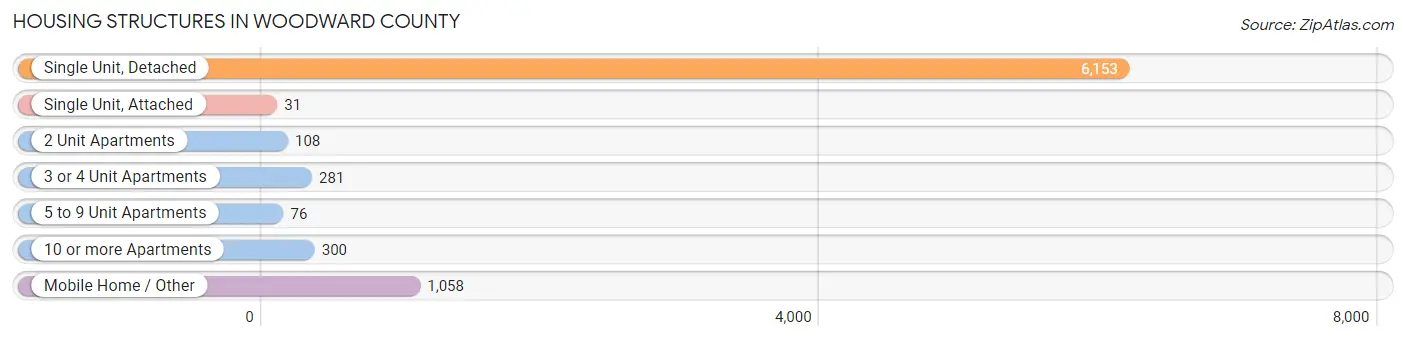
| Structure Type | # Housing Units | % Housing Units |
| Single Unit, Detached | 6,153 | 76.8% |
| Single Unit, Attached | 31 | 0.4% |
| 2 Unit Apartments | 108 | 1.3% |
| 3 or 4 Unit Apartments | 281 | 3.5% |
| 5 to 9 Unit Apartments | 76 | 0.9% |
| 10 or more Apartments | 300 | 3.7% |
| Mobile Home / Other | 1,058 | 13.2% |
| Total | 8,007 | 100.0% |
Housing Structures by Occupancy in Woodward County
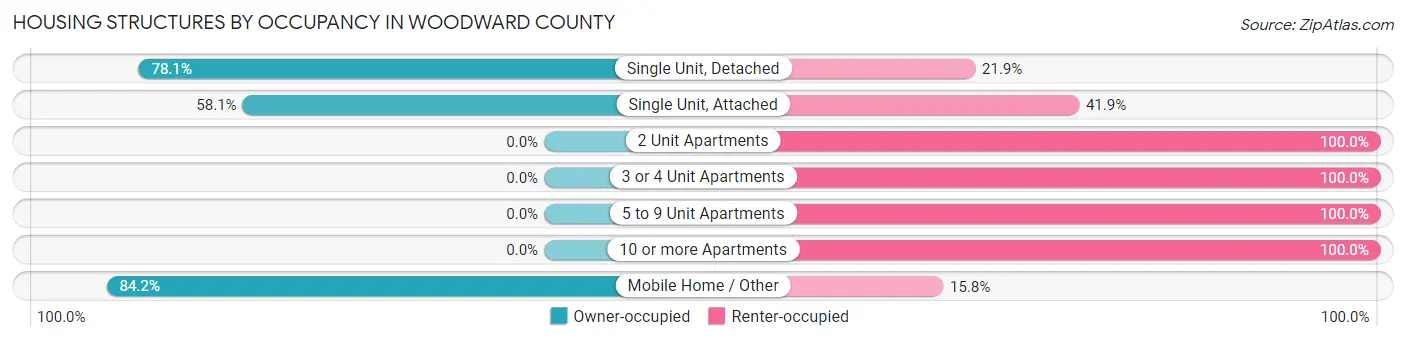
| Structure Type | Owner-occupied | Renter-occupied |
| Single Unit, Detached | 4,803 (78.1%) | 1,350 (21.9%) |
| Single Unit, Attached | 18 (58.1%) | 13 (41.9%) |
| 2 Unit Apartments | 0 (0.0%) | 108 (100.0%) |
| 3 or 4 Unit Apartments | 0 (0.0%) | 281 (100.0%) |
| 5 to 9 Unit Apartments | 0 (0.0%) | 76 (100.0%) |
| 10 or more Apartments | 0 (0.0%) | 300 (100.0%) |
| Mobile Home / Other | 891 (84.2%) | 167 (15.8%) |
| Total | 5,712 (71.3%) | 2,295 (28.7%) |
Housing Structures by Number of Rooms in Woodward County
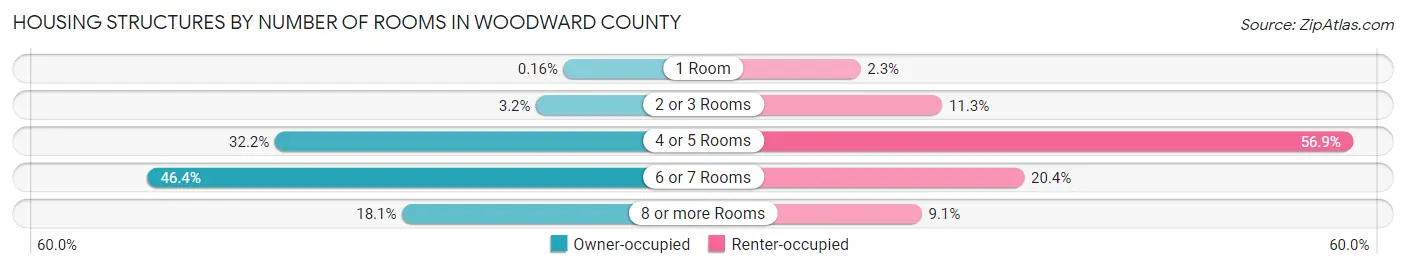
| Number of Rooms | Owner-occupied | Renter-occupied |
| 1 Room | 9 (0.2%) | 52 (2.3%) |
| 2 or 3 Rooms | 183 (3.2%) | 260 (11.3%) |
| 4 or 5 Rooms | 1,839 (32.2%) | 1,306 (56.9%) |
| 6 or 7 Rooms | 2,648 (46.4%) | 469 (20.4%) |
| 8 or more Rooms | 1,033 (18.1%) | 208 (9.1%) |
| Total | 5,712 (100.0%) | 2,295 (100.0%) |
Housing Structure by Heating Type in Woodward County
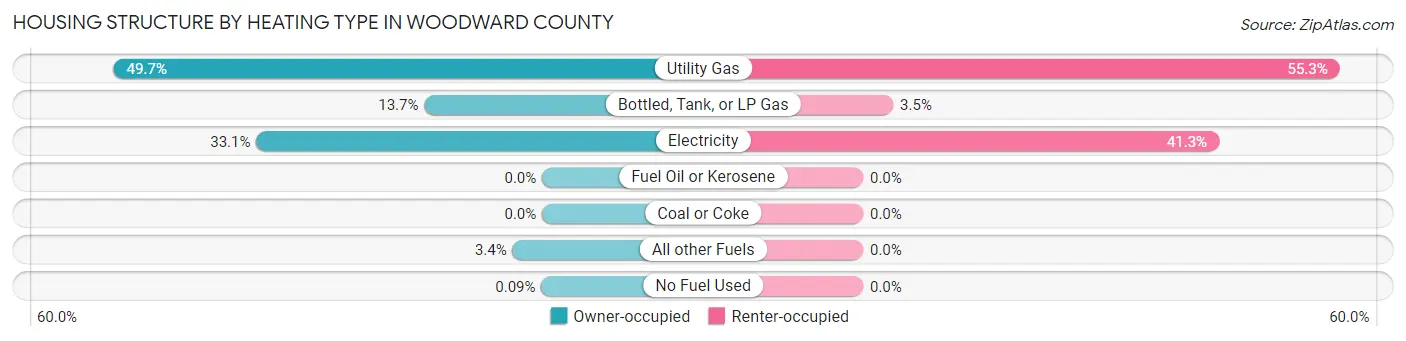
| Heating Type | Owner-occupied | Renter-occupied |
| Utility Gas | 2,838 (49.7%) | 1,268 (55.2%) |
| Bottled, Tank, or LP Gas | 780 (13.7%) | 80 (3.5%) |
| Electricity | 1,893 (33.1%) | 947 (41.3%) |
| Fuel Oil or Kerosene | 0 (0.0%) | 0 (0.0%) |
| Coal or Coke | 0 (0.0%) | 0 (0.0%) |
| All other Fuels | 196 (3.4%) | 0 (0.0%) |
| No Fuel Used | 5 (0.1%) | 0 (0.0%) |
| Total | 5,712 (100.0%) | 2,295 (100.0%) |
Household Vehicle Usage in Woodward County
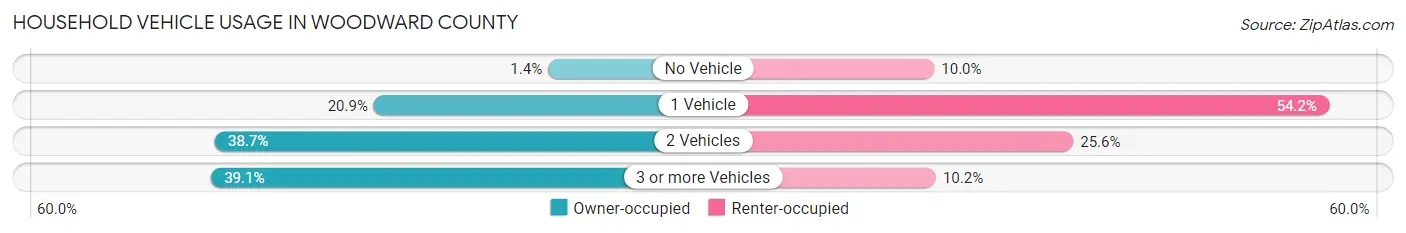
| Vehicles per Household | Owner-occupied | Renter-occupied |
| No Vehicle | 78 (1.4%) | 230 (10.0%) |
| 1 Vehicle | 1,193 (20.9%) | 1,244 (54.2%) |
| 2 Vehicles | 2,208 (38.7%) | 587 (25.6%) |
| 3 or more Vehicles | 2,233 (39.1%) | 234 (10.2%) |
| Total | 5,712 (100.0%) | 2,295 (100.0%) |
Real Estate & Mortgages in Woodward County
Real Estate and Mortgage Overview in Woodward County
| Characteristic | Without Mortgage | With Mortgage |
| Housing Units | 2,874 | 2,838 |
| Median Property Value | $155,500 | $168,000 |
| Median Household Income | $57,257 | $478 |
| Monthly Housing Costs | $458 | $75 |
| Real Estate Taxes | $718 | $159 |
Property Value by Mortgage Status in Woodward County
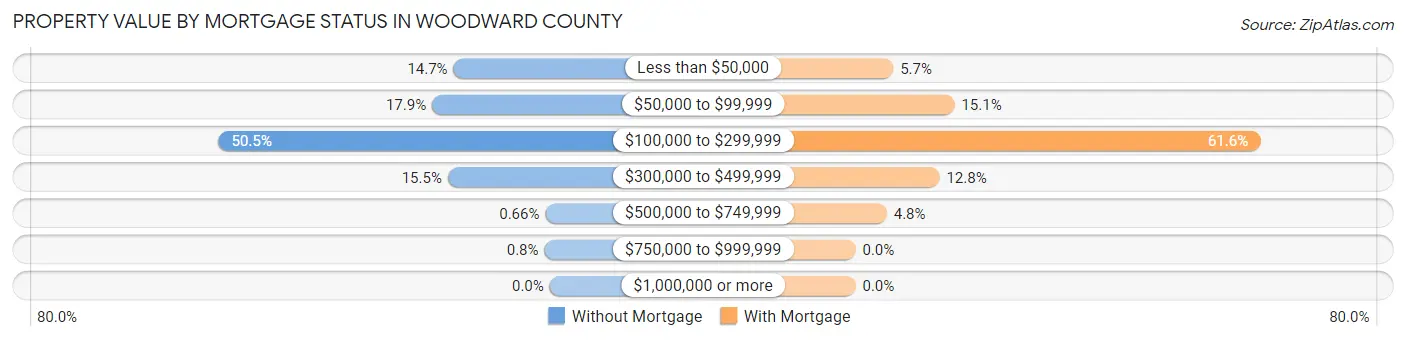
| Property Value | Without Mortgage | With Mortgage |
| Less than $50,000 | 421 (14.6%) | 163 (5.7%) |
| $50,000 to $99,999 | 515 (17.9%) | 428 (15.1%) |
| $100,000 to $299,999 | 1,450 (50.4%) | 1,749 (61.6%) |
| $300,000 to $499,999 | 446 (15.5%) | 363 (12.8%) |
| $500,000 to $749,999 | 19 (0.7%) | 135 (4.8%) |
| $750,000 to $999,999 | 23 (0.8%) | 0 (0.0%) |
| $1,000,000 or more | 0 (0.0%) | 0 (0.0%) |
| Total | 2,874 (100.0%) | 2,838 (100.0%) |
Household Income by Mortgage Status in Woodward County
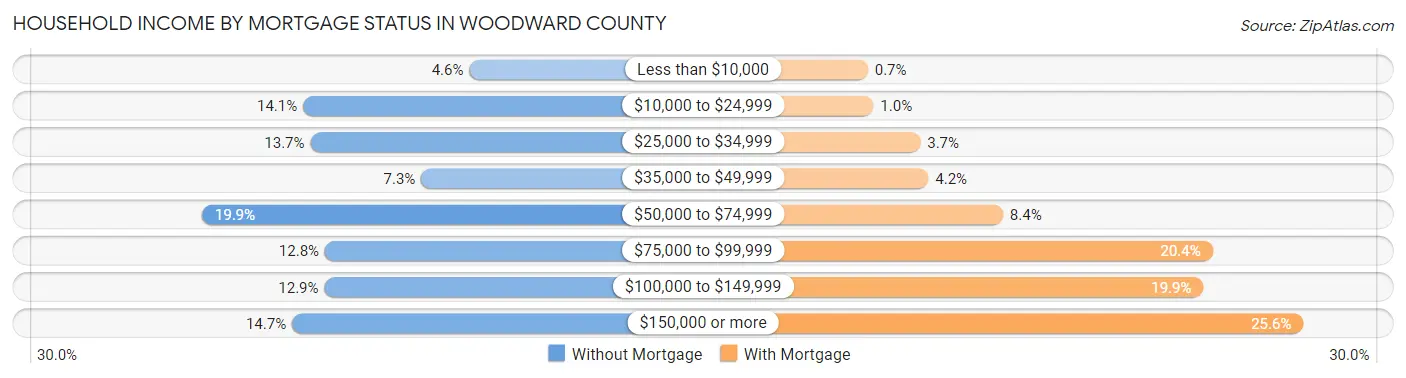
| Household Income | Without Mortgage | With Mortgage |
| Less than $10,000 | 132 (4.6%) | 20 (0.7%) |
| $10,000 to $24,999 | 405 (14.1%) | 29 (1.0%) |
| $25,000 to $34,999 | 393 (13.7%) | 105 (3.7%) |
| $35,000 to $49,999 | 211 (7.3%) | 118 (4.2%) |
| $50,000 to $74,999 | 571 (19.9%) | 239 (8.4%) |
| $75,000 to $99,999 | 369 (12.8%) | 579 (20.4%) |
| $100,000 to $149,999 | 370 (12.9%) | 564 (19.9%) |
| $150,000 or more | 423 (14.7%) | 726 (25.6%) |
| Total | 2,874 (100.0%) | 2,838 (100.0%) |
Property Value to Household Income Ratio in Woodward County
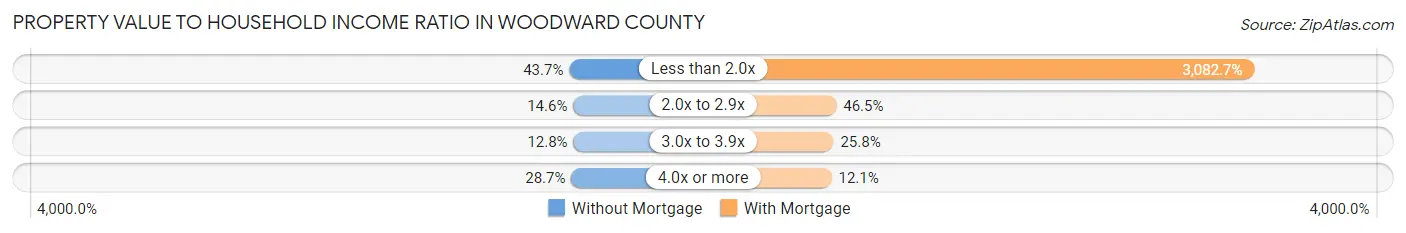
| Value-to-Income Ratio | Without Mortgage | With Mortgage |
| Less than 2.0x | 1,256 (43.7%) | 87,488 (3,082.7%) |
| 2.0x to 2.9x | 419 (14.6%) | 1,320 (46.5%) |
| 3.0x to 3.9x | 369 (12.8%) | 733 (25.8%) |
| 4.0x or more | 826 (28.7%) | 342 (12.0%) |
| Total | 2,874 (100.0%) | 2,838 (100.0%) |
Real Estate Taxes by Mortgage Status in Woodward County
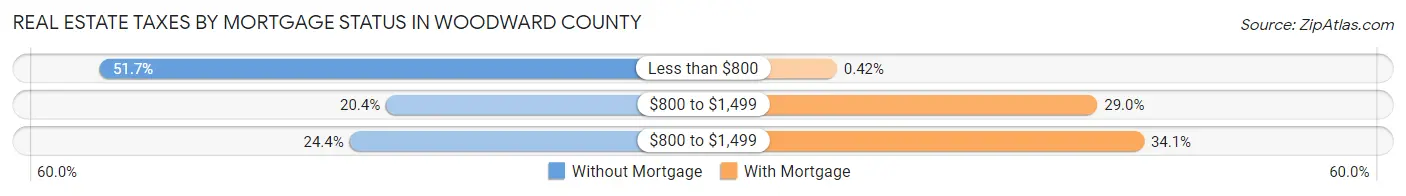
| Property Taxes | Without Mortgage | With Mortgage |
| Less than $800 | 1,487 (51.7%) | 12 (0.4%) |
| $800 to $1,499 | 586 (20.4%) | 822 (29.0%) |
| $800 to $1,499 | 701 (24.4%) | 967 (34.1%) |
| Total | 2,874 (100.0%) | 2,838 (100.0%) |
Health & Disability in Woodward County
Health Insurance Coverage by Age in Woodward County
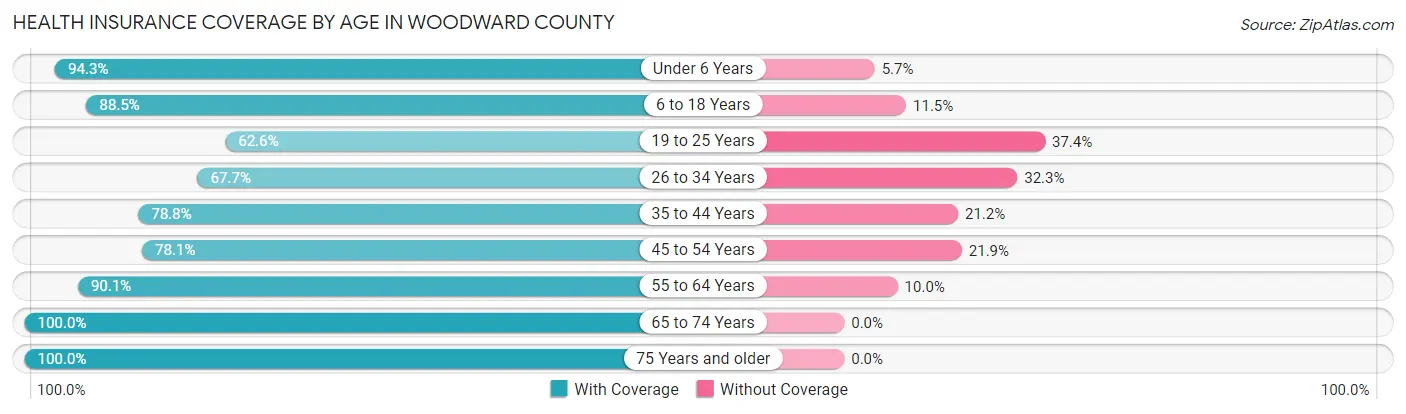
| Age Bracket | With Coverage | Without Coverage |
| Under 6 Years | 1,429 (94.3%) | 86 (5.7%) |
| 6 to 18 Years | 3,276 (88.5%) | 427 (11.5%) |
| 19 to 25 Years | 1,038 (62.6%) | 621 (37.4%) |
| 26 to 34 Years | 1,520 (67.7%) | 724 (32.3%) |
| 35 to 44 Years | 2,028 (78.8%) | 546 (21.2%) |
| 45 to 54 Years | 1,720 (78.1%) | 483 (21.9%) |
| 55 to 64 Years | 2,100 (90.0%) | 232 (10.0%) |
| 65 to 74 Years | 1,749 (100.0%) | 0 (0.0%) |
| 75 Years and older | 1,448 (100.0%) | 0 (0.0%) |
| Total | 16,308 (84.0%) | 3,119 (16.1%) |
Health Insurance Coverage by Citizenship Status in Woodward County
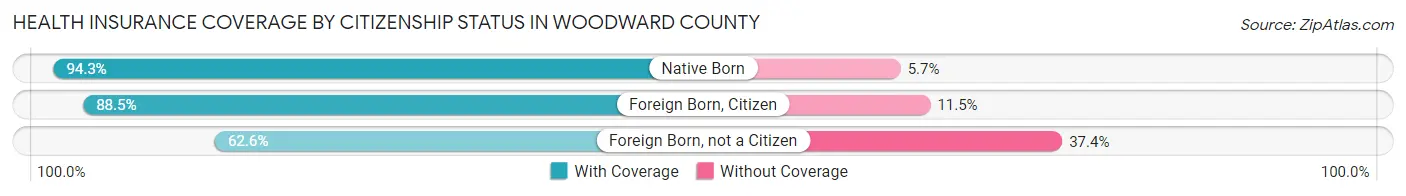
| Citizenship Status | With Coverage | Without Coverage |
| Native Born | 1,429 (94.3%) | 86 (5.7%) |
| Foreign Born, Citizen | 3,276 (88.5%) | 427 (11.5%) |
| Foreign Born, not a Citizen | 1,038 (62.6%) | 621 (37.4%) |
Health Insurance Coverage by Household Income in Woodward County
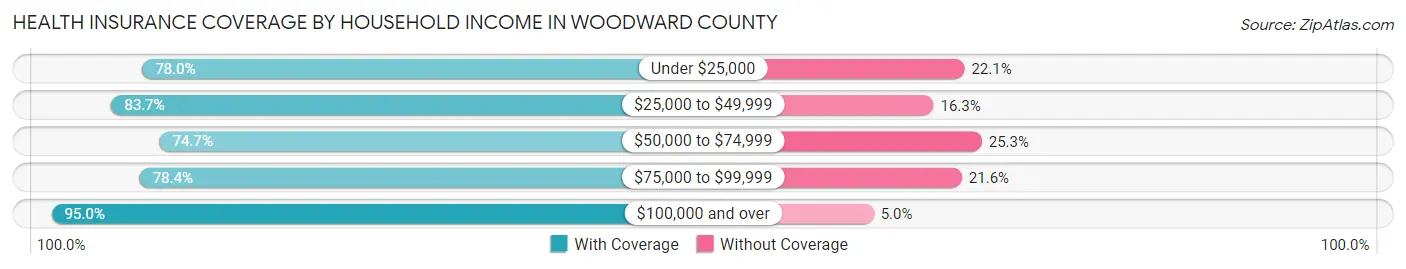
| Household Income | With Coverage | Without Coverage |
| Under $25,000 | 1,966 (77.9%) | 556 (22.1%) |
| $25,000 to $49,999 | 3,111 (83.7%) | 604 (16.3%) |
| $50,000 to $74,999 | 3,096 (74.7%) | 1,048 (25.3%) |
| $75,000 to $99,999 | 2,185 (78.4%) | 601 (21.6%) |
| $100,000 and over | 5,841 (95.0%) | 310 (5.0%) |
Public vs Private Health Insurance Coverage by Age in Woodward County
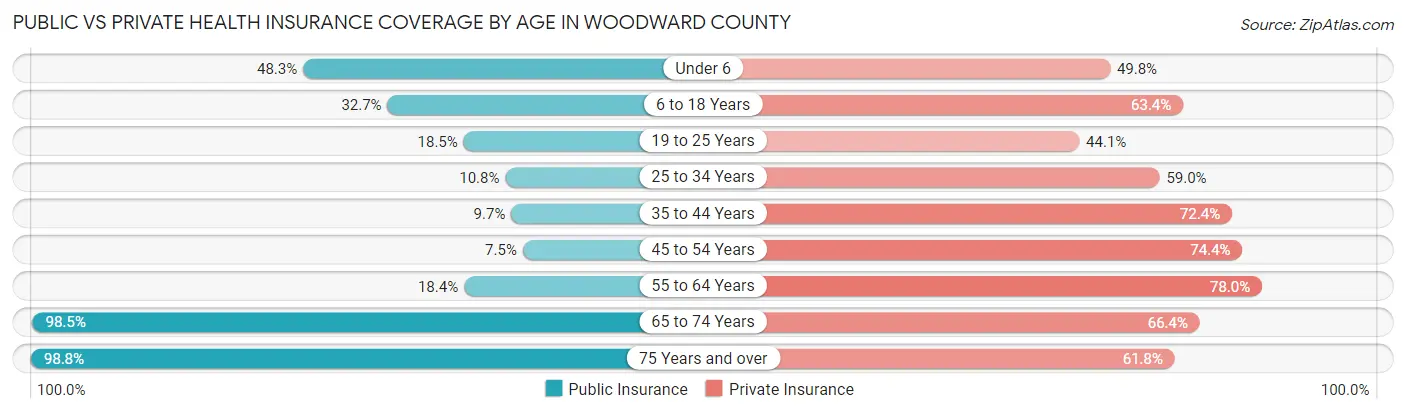
| Age Bracket | Public Insurance | Private Insurance |
| Under 6 | 732 (48.3%) | 754 (49.8%) |
| 6 to 18 Years | 1,209 (32.7%) | 2,346 (63.3%) |
| 19 to 25 Years | 307 (18.5%) | 731 (44.1%) |
| 25 to 34 Years | 242 (10.8%) | 1,323 (59.0%) |
| 35 to 44 Years | 249 (9.7%) | 1,864 (72.4%) |
| 45 to 54 Years | 166 (7.5%) | 1,638 (74.4%) |
| 55 to 64 Years | 430 (18.4%) | 1,819 (78.0%) |
| 65 to 74 Years | 1,723 (98.5%) | 1,162 (66.4%) |
| 75 Years and over | 1,431 (98.8%) | 895 (61.8%) |
| Total | 6,489 (33.4%) | 12,532 (64.5%) |
Disability Status by Sex by Age in Woodward County
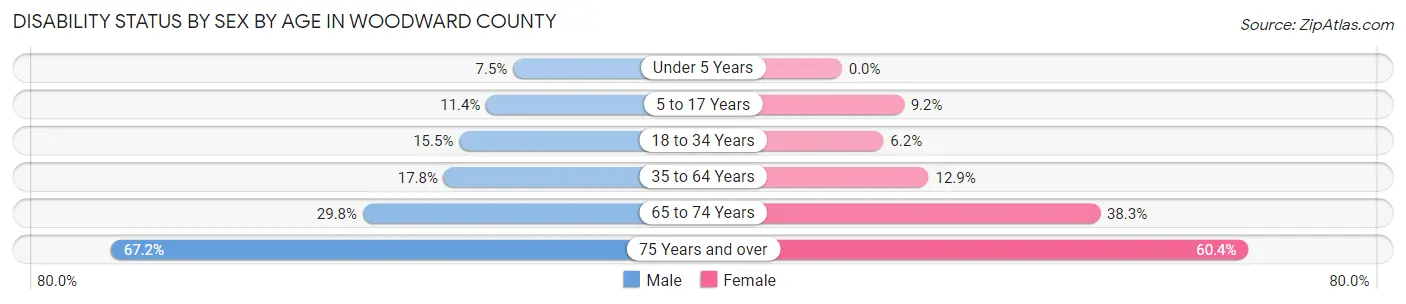
| Age Bracket | Male | Female |
| Under 5 Years | 50 (7.4%) | 0 (0.0%) |
| 5 to 17 Years | 226 (11.4%) | 156 (9.2%) |
| 18 to 34 Years | 343 (15.5%) | 120 (6.2%) |
| 35 to 64 Years | 629 (17.7%) | 459 (12.9%) |
| 65 to 74 Years | 259 (29.8%) | 337 (38.3%) |
| 75 Years and over | 422 (67.2%) | 495 (60.4%) |
Disability Class by Sex by Age in Woodward County
Disability Class: Hearing Difficulty
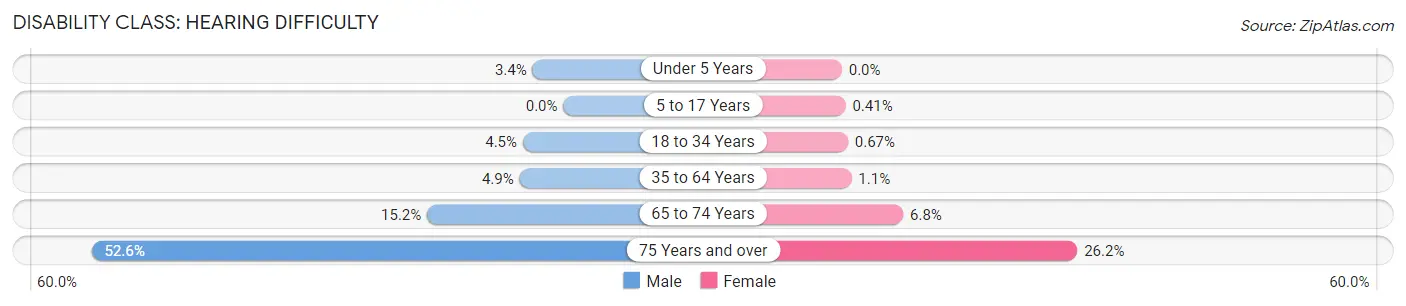
| Age Bracket | Male | Female |
| Under 5 Years | 23 (3.4%) | 0 (0.0%) |
| 5 to 17 Years | 0 (0.0%) | 7 (0.4%) |
| 18 to 34 Years | 100 (4.5%) | 13 (0.7%) |
| 35 to 64 Years | 173 (4.9%) | 38 (1.1%) |
| 65 to 74 Years | 132 (15.2%) | 60 (6.8%) |
| 75 Years and over | 330 (52.5%) | 215 (26.2%) |
Disability Class: Vision Difficulty
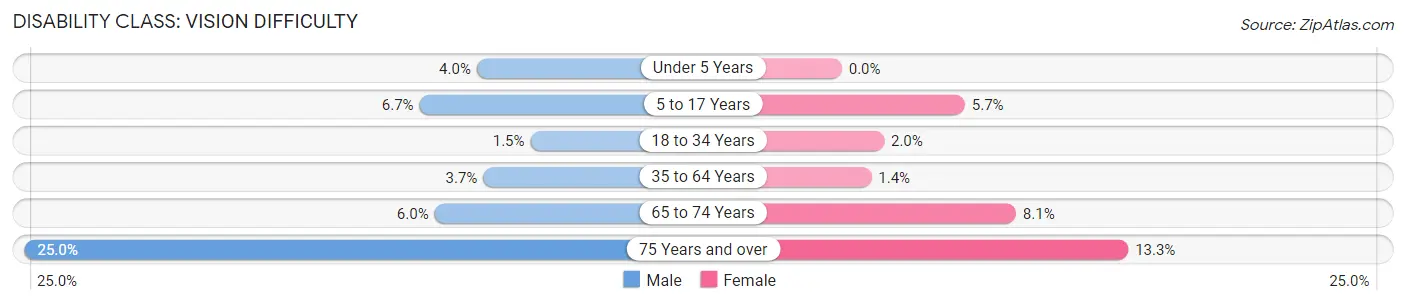
| Age Bracket | Male | Female |
| Under 5 Years | 27 (4.0%) | 0 (0.0%) |
| 5 to 17 Years | 132 (6.7%) | 97 (5.7%) |
| 18 to 34 Years | 34 (1.5%) | 38 (2.0%) |
| 35 to 64 Years | 132 (3.7%) | 49 (1.4%) |
| 65 to 74 Years | 52 (6.0%) | 71 (8.1%) |
| 75 Years and over | 157 (25.0%) | 109 (13.3%) |
Disability Class: Cognitive Difficulty
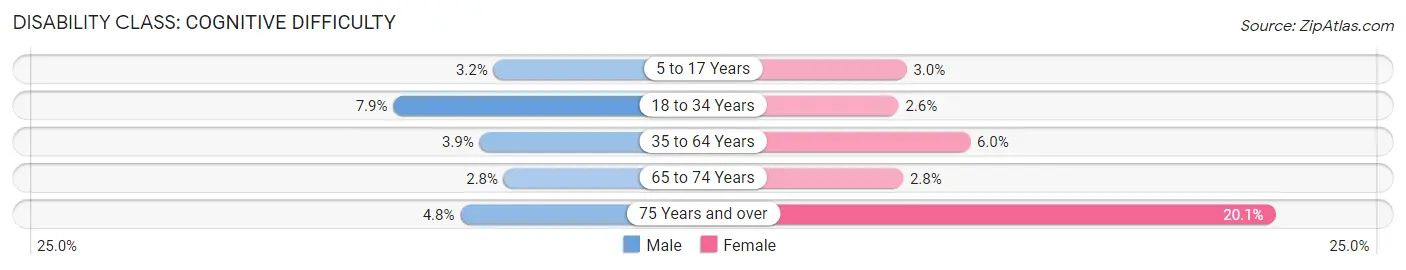
| Age Bracket | Male | Female |
| 5 to 17 Years | 64 (3.2%) | 51 (3.0%) |
| 18 to 34 Years | 175 (7.9%) | 51 (2.6%) |
| 35 to 64 Years | 138 (3.9%) | 212 (5.9%) |
| 65 to 74 Years | 24 (2.8%) | 25 (2.8%) |
| 75 Years and over | 30 (4.8%) | 165 (20.1%) |
Disability Class: Ambulatory Difficulty
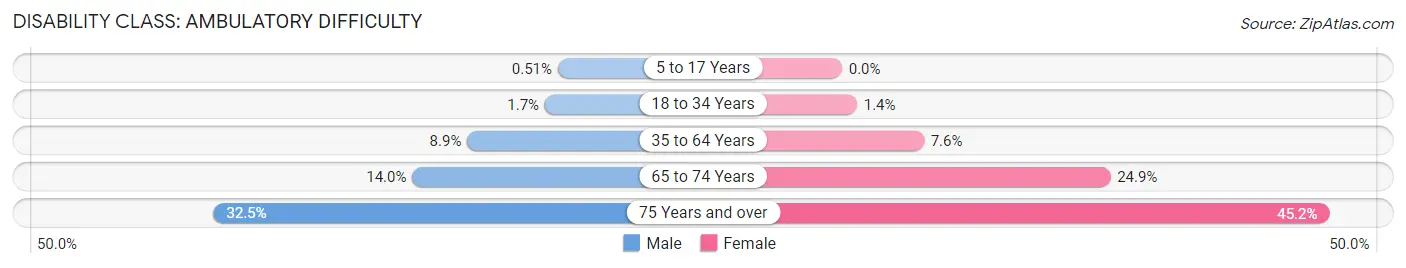
| Age Bracket | Male | Female |
| 5 to 17 Years | 10 (0.5%) | 0 (0.0%) |
| 18 to 34 Years | 38 (1.7%) | 27 (1.4%) |
| 35 to 64 Years | 316 (8.9%) | 271 (7.6%) |
| 65 to 74 Years | 122 (14.0%) | 219 (24.9%) |
| 75 Years and over | 204 (32.5%) | 371 (45.2%) |
Disability Class: Self-Care Difficulty
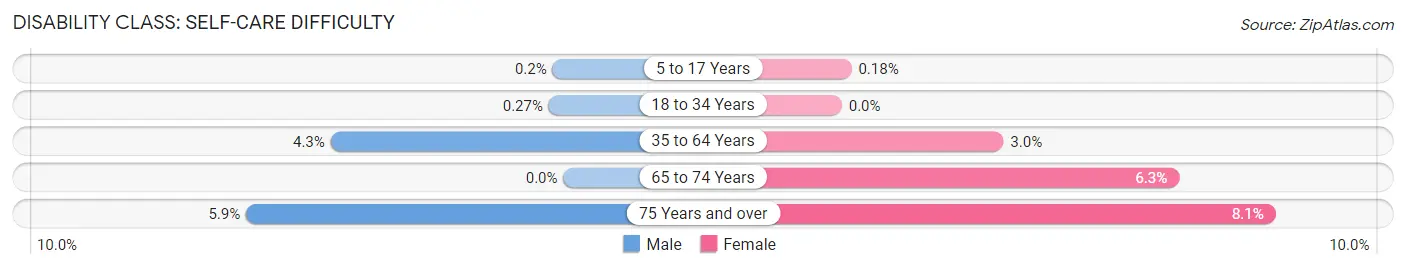
| Age Bracket | Male | Female |
| 5 to 17 Years | 4 (0.2%) | 3 (0.2%) |
| 18 to 34 Years | 6 (0.3%) | 0 (0.0%) |
| 35 to 64 Years | 153 (4.3%) | 107 (3.0%) |
| 65 to 74 Years | 0 (0.0%) | 55 (6.3%) |
| 75 Years and over | 37 (5.9%) | 66 (8.1%) |
Technology Access in Woodward County
Computing Device Access in Woodward County
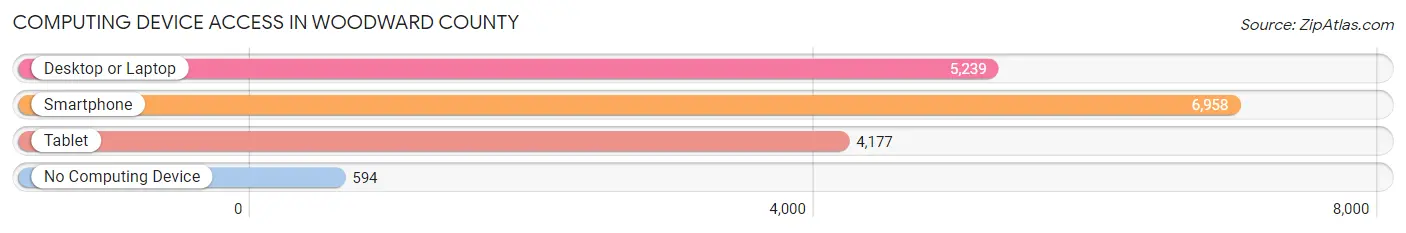
| Device Type | # Households | % Households |
| Desktop or Laptop | 5,239 | 65.4% |
| Smartphone | 6,958 | 86.9% |
| Tablet | 4,177 | 52.2% |
| No Computing Device | 594 | 7.4% |
| Total | 8,007 | 100.0% |
Internet Access in Woodward County
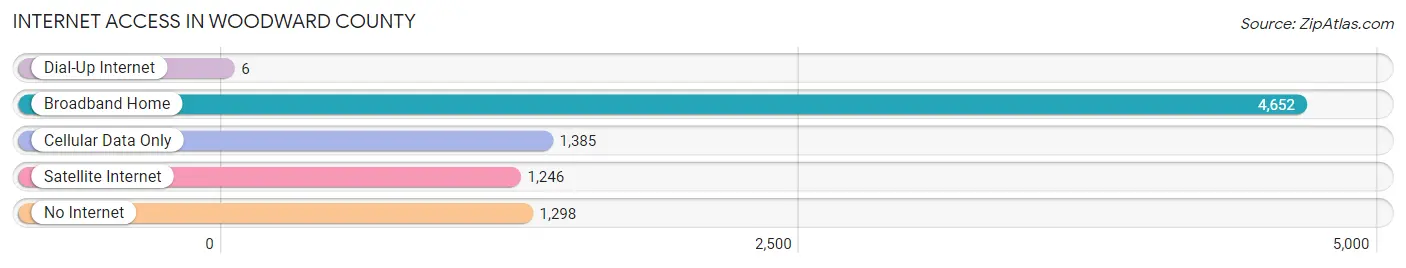
| Internet Type | # Households | % Households |
| Dial-Up Internet | 6 | 0.1% |
| Broadband Home | 4,652 | 58.1% |
| Cellular Data Only | 1,385 | 17.3% |
| Satellite Internet | 1,246 | 15.6% |
| No Internet | 1,298 | 16.2% |
| Total | 8,007 | 100.0% |
Woodward County Summary
Woodward County is located in the northwestern part of Oklahoma, and is bordered by Harper County to the north, Ellis County to the east, Dewey County to the south, and Texas to the west. The county seat is Woodward, and the county was named after Brinton W. Woodward, a prominent lawyer and judge in the area. The county covers an area of 1,092 square miles, and has a population of 20,081 as of the 2010 census.
Geography
Woodward County is located in the western part of the state, and is part of the Great Plains region. The county is mostly flat, with some rolling hills in the eastern part. The county is drained by the North Canadian River, which flows through the county from north to south. The county is mostly covered in grassland, with some areas of wooded hills. The climate is semi-arid, with hot summers and cold winters.
Economy
The economy of Woodward County is largely based on agriculture, with wheat, corn, and sorghum being the main crops. Cattle ranching is also an important part of the economy, and there are several large ranches in the county. Oil and gas production is also an important part of the economy, and there are several oil and gas wells in the county. The county also has a large manufacturing sector, with several factories producing a variety of products.
Demographics
As of the 2010 census, the population of Woodward County was 20,081. The population is mostly white, with a small minority of African Americans, Native Americans, and Hispanics. The median household income is $41,945, and the median home value is $90,400. The unemployment rate is 4.2%, and the poverty rate is 13.3%.
Education
Woodward County is served by the Woodward Public Schools, which includes four elementary schools, one middle school, and one high school. The county also has several private schools, including Woodward Christian Academy and Woodward Academy. The county is also home to Northwestern Oklahoma State University, which offers a variety of undergraduate and graduate degree programs.
Conclusion
Woodward County is a rural county located in the northwestern part of Oklahoma. The county is mostly flat, with some rolling hills in the eastern part. The economy is largely based on agriculture, with wheat, corn, and sorghum being the main crops. The population is mostly white, with a small minority of African Americans, Native Americans, and Hispanics. The county is served by the Woodward Public Schools, and is home to Northwestern Oklahoma State University.
Common Questions
What is Per Capita Income in Woodward County?
Per Capita income in Woodward County is $31,995.
What is the Median Family Income in Woodward County?
Median Family Income in Woodward County is $71,512.
What is the Median Household income in Woodward County?
Median Household Income in Woodward County is $61,207.
What is Income or Wage Gap in Woodward County?
Income or Wage Gap in Woodward County is 37.5%.
Women in Woodward County earn 62.5 cents for every dollar earned by a man.
What is Family Income Deficit in Woodward County?
Family Income Deficit in Woodward County is $10,486.
Families that are below poverty line in Woodward County earn $10,486 less on average than the poverty threshold level.
What is Inequality or Gini Index in Woodward County?
Inequality or Gini Index in Woodward County is 0.44.
What is the Total Population of Woodward County?
Total Population of Woodward County is 20,411.
What is the Total Male Population of Woodward County?
Total Male Population of Woodward County is 10,797.
What is the Total Female Population of Woodward County?
Total Female Population of Woodward County is 9,614.
What is the Ratio of Males per 100 Females in Woodward County?
There are 112.30 Males per 100 Females in Woodward County.
What is the Ratio of Females per 100 Males in Woodward County?
There are 89.04 Females per 100 Males in Woodward County.
What is the Median Population Age in Woodward County?
Median Population Age in Woodward County is 36.8 Years.
What is the Average Family Size in Woodward County
Average Family Size in Woodward County is 2.9 People.
What is the Average Household Size in Woodward County
Average Household Size in Woodward County is 2.4 People.
How Large is the Labor Force in Woodward County?
There are 9,960 People in the Labor Forcein in Woodward County.
What is the Percentage of People in the Labor Force in Woodward County?
62.0% of People are in the Labor Force in Woodward County.
What is the Unemployment Rate in Woodward County?
Unemployment Rate in Woodward County is 5.3%.