Washita County, OK Map & Demographics
Washita County Map
Washita County Overview
$31,421
PER CAPITA INCOME
$69,790
AVG FAMILY INCOME
$60,600
AVG HOUSEHOLD INCOME
33.6%
WAGE / INCOME GAP [ % ]
66.4¢/ $1
WAGE / INCOME GAP [ $ ]
$10,136
FAMILY INCOME DEFICIT
0.42
INEQUALITY / GINI INDEX
10,930
TOTAL POPULATION
5,460
MALE POPULATION
5,470
FEMALE POPULATION
99.82
MALES / 100 FEMALES
100.18
FEMALES / 100 MALES
40.4
MEDIAN AGE
3.1
AVG FAMILY SIZE
2.6
AVG HOUSEHOLD SIZE
5,063
LABOR FORCE [ PEOPLE ]
59.4%
PERCENT IN LABOR FORCE
5.8%
UNEMPLOYMENT RATE
Income in Washita County
Income Overview in Washita County
Per Capita Income in Washita County is $31,421, while median incomes of families and households are $69,790 and $60,600 respectively.
| Characteristic | Number | Measure |
| Per Capita Income | 10,930 | $31,421 |
| Median Family Income | 2,780 | $69,790 |
| Mean Family Income | 2,780 | $90,048 |
| Median Household Income | 4,046 | $60,600 |
| Mean Household Income | 4,046 | $77,457 |
| Income Deficit | 2,780 | $10,136 |
| Wage / Income Gap (%) | 10,930 | 33.61% |
| Wage / Income Gap ($) | 10,930 | 66.39¢ per $1 |
| Gini / Inequality Index | 10,930 | 0.42 |
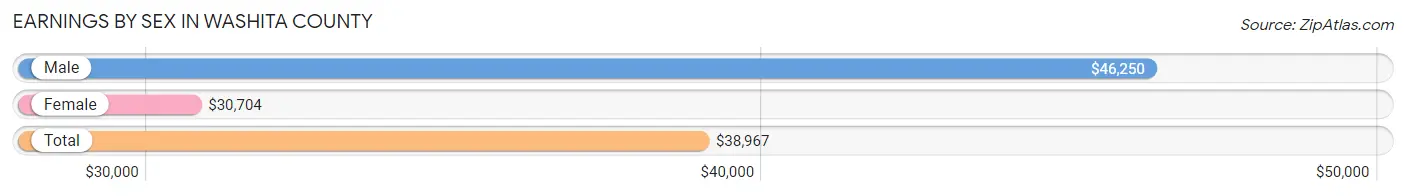
Earnings by Sex in Washita County
Average Earnings in Washita County are $38,967, $46,250 for men and $30,704 for women, a difference of 33.6%.
| Sex | Number | Average Earnings |
| Male | 2,830 (53.1%) | $46,250 |
| Female | 2,500 (46.9%) | $30,704 |
| Total | 5,330 (100.0%) | $38,967 |
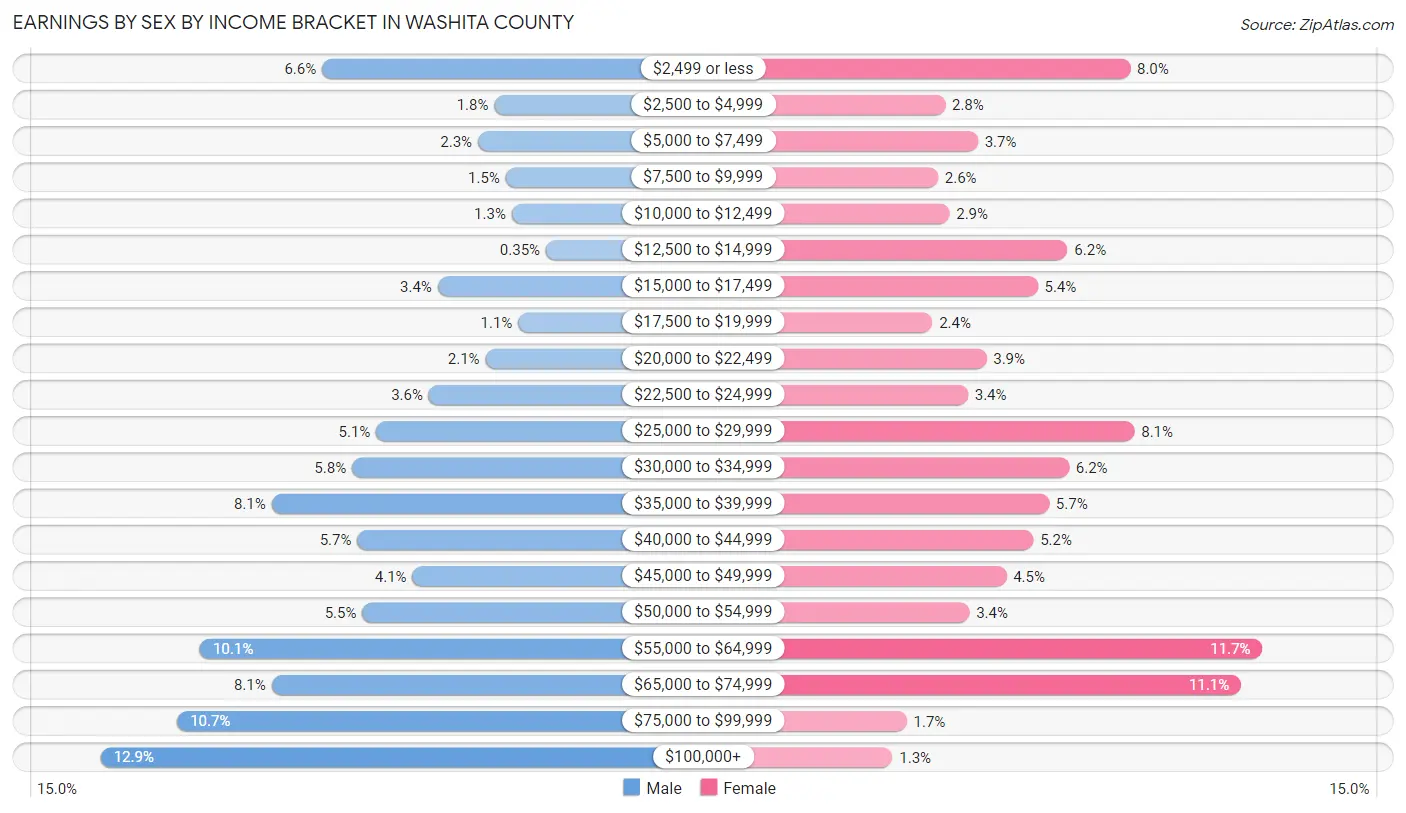
Earnings by Sex by Income Bracket in Washita County
The most common earnings brackets in Washita County are $100,000+ for men (364 | 12.9%) and $55,000 to $64,999 for women (292 | 11.7%).
| Income | Male | Female |
| $2,499 or less | 188 (6.6%) | 199 (8.0%) |
| $2,500 to $4,999 | 51 (1.8%) | 69 (2.8%) |
| $5,000 to $7,499 | 64 (2.3%) | 92 (3.7%) |
| $7,500 to $9,999 | 42 (1.5%) | 64 (2.6%) |
| $10,000 to $12,499 | 37 (1.3%) | 72 (2.9%) |
| $12,500 to $14,999 | 10 (0.4%) | 155 (6.2%) |
| $15,000 to $17,499 | 96 (3.4%) | 134 (5.4%) |
| $17,500 to $19,999 | 32 (1.1%) | 60 (2.4%) |
| $20,000 to $22,499 | 58 (2.1%) | 98 (3.9%) |
| $22,500 to $24,999 | 103 (3.6%) | 85 (3.4%) |
| $25,000 to $29,999 | 145 (5.1%) | 202 (8.1%) |
| $30,000 to $34,999 | 164 (5.8%) | 156 (6.2%) |
| $35,000 to $39,999 | 228 (8.1%) | 142 (5.7%) |
| $40,000 to $44,999 | 160 (5.7%) | 131 (5.2%) |
| $45,000 to $49,999 | 116 (4.1%) | 112 (4.5%) |
| $50,000 to $54,999 | 156 (5.5%) | 86 (3.4%) |
| $55,000 to $64,999 | 285 (10.1%) | 292 (11.7%) |
| $65,000 to $74,999 | 228 (8.1%) | 277 (11.1%) |
| $75,000 to $99,999 | 303 (10.7%) | 42 (1.7%) |
| $100,000+ | 364 (12.9%) | 32 (1.3%) |
| Total | 2,830 (100.0%) | 2,500 (100.0%) |
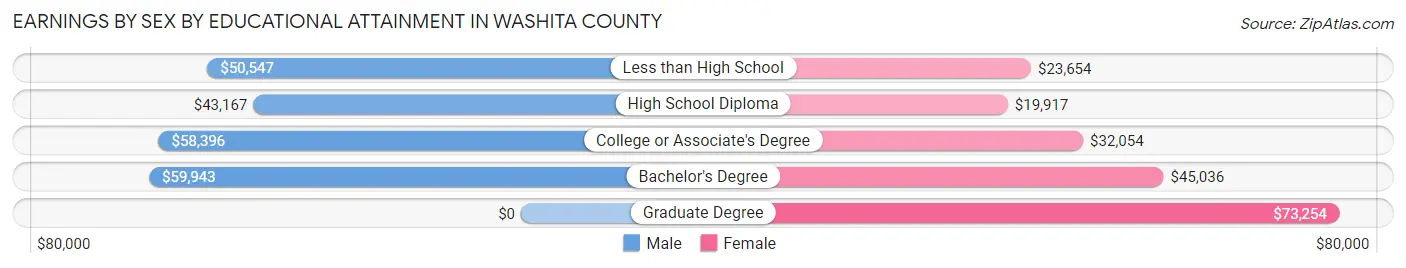
Earnings by Sex by Educational Attainment in Washita County
Average earnings in Washita County are $50,125 for men and $35,854 for women, a difference of 28.5%. Men with an educational attainment of bachelor's degree enjoy the highest average annual earnings of $59,943, while those with high school diploma education earn the least with $43,167. Women with an educational attainment of graduate degree earn the most with the average annual earnings of $73,254, while those with high school diploma education have the smallest earnings of $19,917.
| Educational Attainment | Male Income | Female Income |
| Less than High School | $50,547 | $23,654 |
| High School Diploma | $43,167 | $19,917 |
| College or Associate's Degree | $58,396 | $32,054 |
| Bachelor's Degree | $59,943 | $45,036 |
| Graduate Degree | - | - |
| Total | $50,125 | $35,854 |
Family Income in Washita County
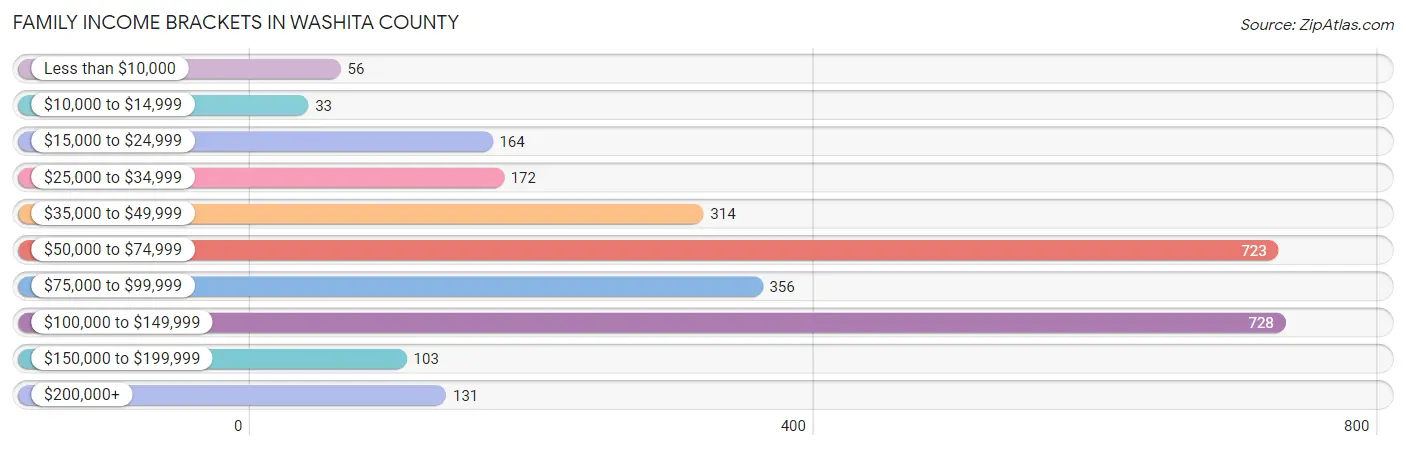
Family Income Brackets in Washita County
According to the Washita County family income data, there are 728 families falling into the $100,000 to $149,999 income range, which is the most common income bracket and makes up 26.2% of all families. Conversely, the $10,000 to $14,999 income bracket is the least frequent group with only 33 families (1.2%) belonging to this category.
| Income Bracket | # Families | % Families |
| Less than $10,000 | 56 | 2.0% |
| $10,000 to $14,999 | 33 | 1.2% |
| $15,000 to $24,999 | 164 | 5.9% |
| $25,000 to $34,999 | 172 | 6.2% |
| $35,000 to $49,999 | 314 | 11.3% |
| $50,000 to $74,999 | 723 | 26.0% |
| $75,000 to $99,999 | 356 | 12.8% |
| $100,000 to $149,999 | 728 | 26.2% |
| $150,000 to $199,999 | 103 | 3.7% |
| $200,000+ | 131 | 4.7% |
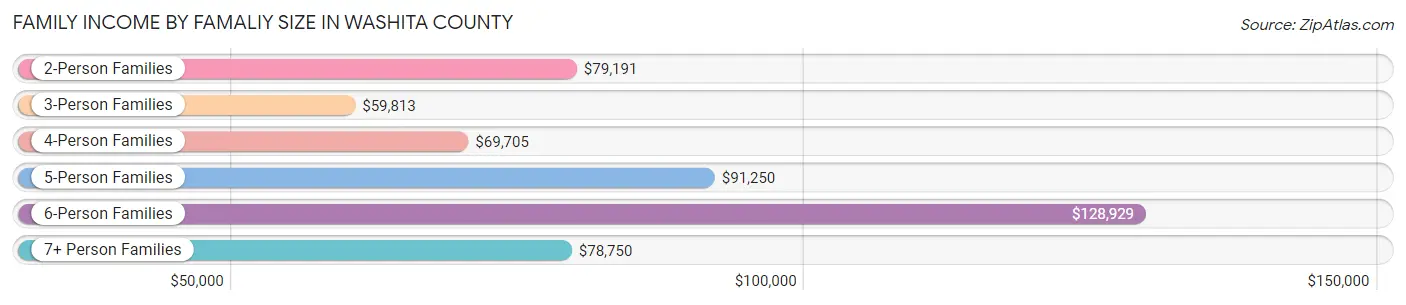
Family Income by Famaliy Size in Washita County
6-person families (38 | 1.4%) account for the highest median family income in Washita County with $128,929 per family, while 2-person families (1,441 | 51.8%) have the highest median income of $39,596 per family member.
| Income Bracket | # Families | Median Income |
| 2-Person Families | 1,441 (51.8%) | $79,191 |
| 3-Person Families | 628 (22.6%) | $59,813 |
| 4-Person Families | 443 (15.9%) | $69,705 |
| 5-Person Families | 216 (7.8%) | $91,250 |
| 6-Person Families | 38 (1.4%) | $128,929 |
| 7+ Person Families | 14 (0.5%) | $78,750 |
| Total | 2,780 (100.0%) | $69,790 |
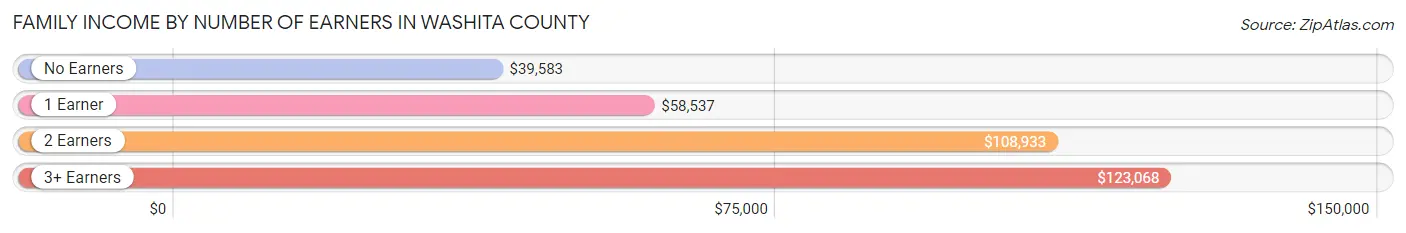
Family Income by Number of Earners in Washita County
The median family income in Washita County is $69,790, with families comprising 3+ earners (71) having the highest median family income of $123,068, while families with no earners (399) have the lowest median family income of $39,583, accounting for 2.5% and 14.3% of families, respectively.
| Number of Earners | # Families | Median Income |
| No Earners | 399 (14.3%) | $39,583 |
| 1 Earner | 975 (35.1%) | $58,537 |
| 2 Earners | 1,335 (48.0%) | $108,933 |
| 3+ Earners | 71 (2.5%) | $123,068 |
| Total | 2,780 (100.0%) | $69,790 |
Household Income in Washita County
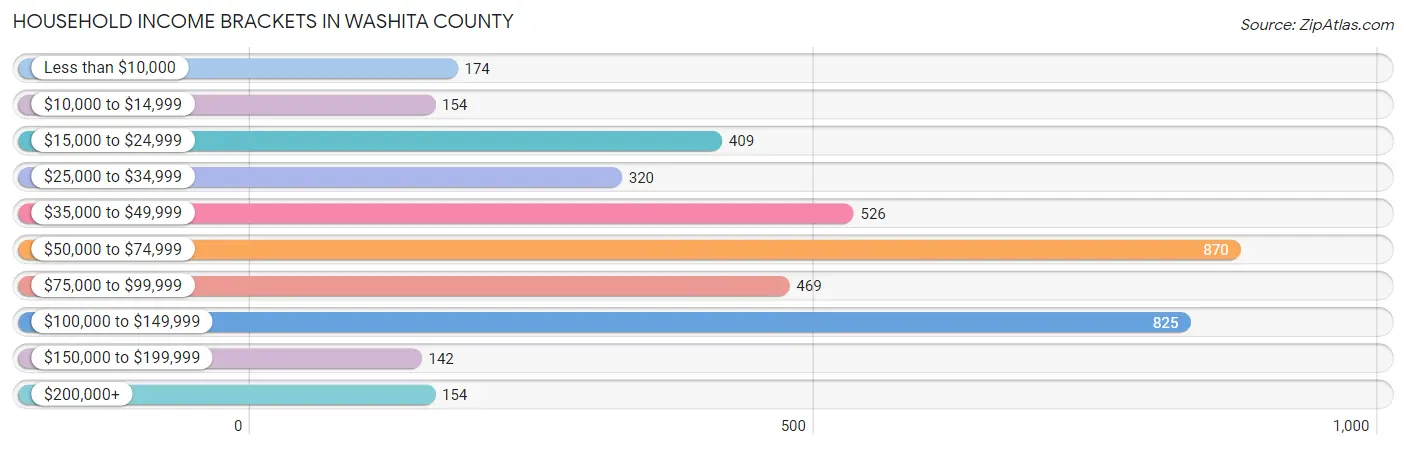
Household Income Brackets in Washita County
With 870 households falling in the category, the $50,000 to $74,999 income range is the most frequent in Washita County, accounting for 21.5% of all households. In contrast, only 142 households (3.5%) fall into the $150,000 to $199,999 income bracket, making it the least populous group.
| Income Bracket | # Households | % Households |
| Less than $10,000 | 174 | 4.3% |
| $10,000 to $14,999 | 154 | 3.8% |
| $15,000 to $24,999 | 409 | 10.1% |
| $25,000 to $34,999 | 320 | 7.9% |
| $35,000 to $49,999 | 526 | 13.0% |
| $50,000 to $74,999 | 870 | 21.5% |
| $75,000 to $99,999 | 469 | 11.6% |
| $100,000 to $149,999 | 825 | 20.4% |
| $150,000 to $199,999 | 142 | 3.5% |
| $200,000+ | 154 | 3.8% |
Household Income by Householder Age in Washita County
The median household income in Washita County is $60,600, with the highest median household income of $67,951 found in the 25 to 44 years age bracket for the primary householder. A total of 1,151 households (28.4%) fall into this category. Meanwhile, the 15 to 24 years age bracket for the primary householder has the lowest median household income of $36,900, with 162 households (4.0%) in this group.
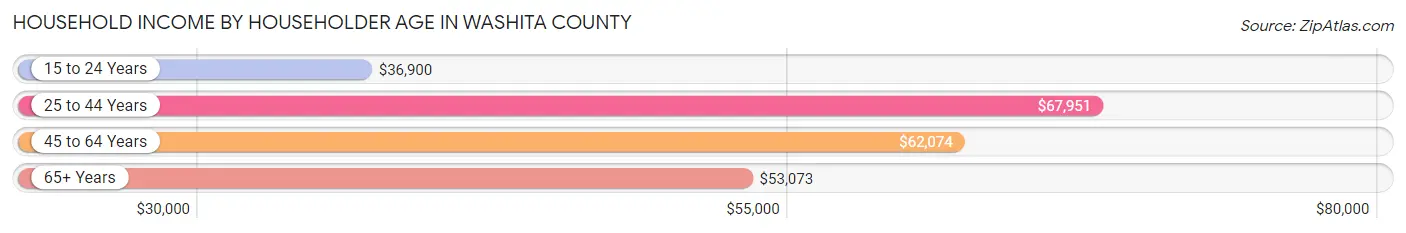
| Income Bracket | # Households | Median Income |
| 15 to 24 Years | 162 (4.0%) | $36,900 |
| 25 to 44 Years | 1,151 (28.4%) | $67,951 |
| 45 to 64 Years | 1,440 (35.6%) | $62,074 |
| 65+ Years | 1,293 (32.0%) | $53,073 |
| Total | 4,046 (100.0%) | $60,600 |
Poverty in Washita County
Income Below Poverty by Sex and Age in Washita County
With 11.1% poverty level for males and 14.0% for females among the residents of Washita County, under 5 year old males and 5 year old females are the most vulnerable to poverty, with 88 males (25.8%) and 10 females (26.3%) in their respective age groups living below the poverty level.
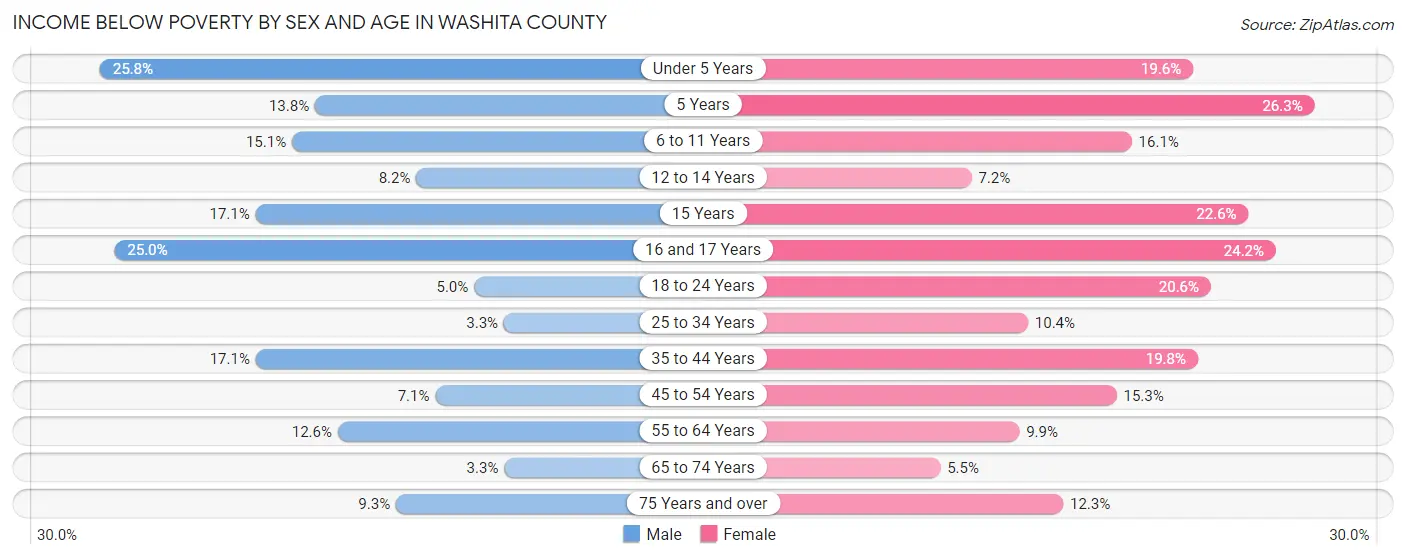
| Age Bracket | Male | Female |
| Under 5 Years | 88 (25.8%) | 53 (19.6%) |
| 5 Years | 26 (13.8%) | 10 (26.3%) |
| 6 to 11 Years | 60 (15.1%) | 71 (16.1%) |
| 12 to 14 Years | 14 (8.2%) | 20 (7.2%) |
| 15 Years | 12 (17.1%) | 24 (22.6%) |
| 16 and 17 Years | 34 (25.0%) | 29 (24.2%) |
| 18 to 24 Years | 17 (5.0%) | 90 (20.5%) |
| 25 to 34 Years | 22 (3.3%) | 58 (10.4%) |
| 35 to 44 Years | 111 (17.1%) | 134 (19.8%) |
| 45 to 54 Years | 43 (7.1%) | 88 (15.3%) |
| 55 to 64 Years | 107 (12.6%) | 75 (9.9%) |
| 65 to 74 Years | 17 (3.3%) | 32 (5.5%) |
| 75 Years and over | 30 (9.3%) | 60 (12.3%) |
| Total | 581 (11.1%) | 744 (14.0%) |
Income Above Poverty by Sex and Age in Washita County
According to the poverty statistics in Washita County, males aged 65 to 74 years and females aged 65 to 74 years are the age groups that are most secure financially, with 96.7% of males and 94.5% of females in these age groups living above the poverty line.
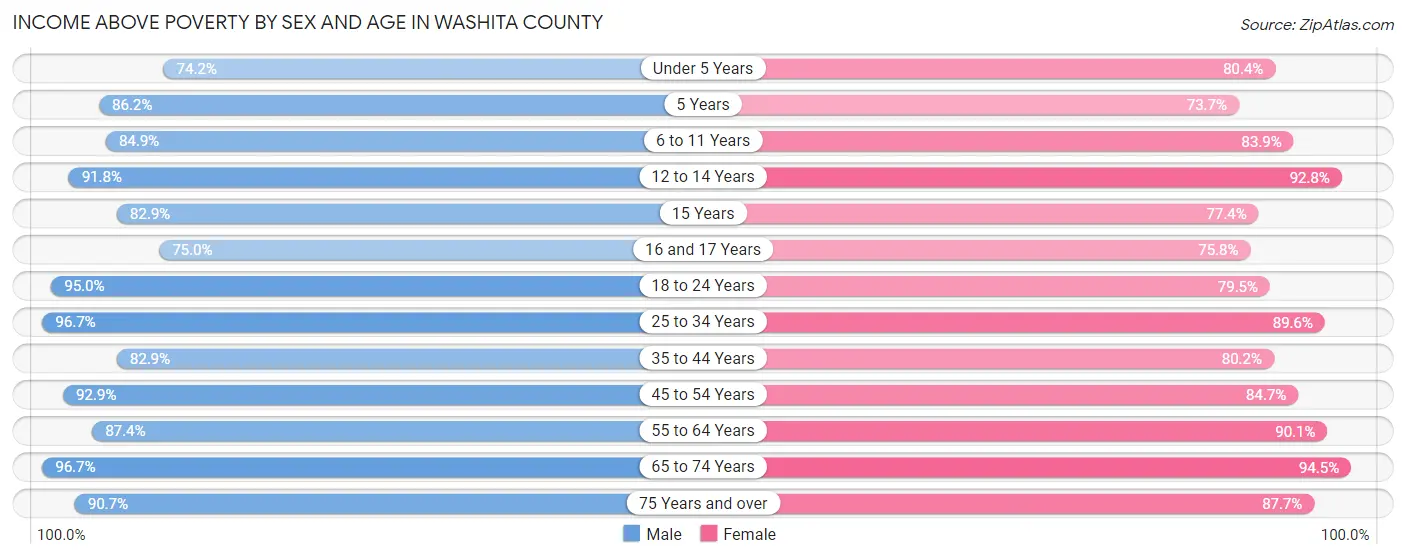
| Age Bracket | Male | Female |
| Under 5 Years | 253 (74.2%) | 218 (80.4%) |
| 5 Years | 162 (86.2%) | 28 (73.7%) |
| 6 to 11 Years | 337 (84.9%) | 369 (83.9%) |
| 12 to 14 Years | 157 (91.8%) | 257 (92.8%) |
| 15 Years | 58 (82.9%) | 82 (77.4%) |
| 16 and 17 Years | 102 (75.0%) | 91 (75.8%) |
| 18 to 24 Years | 325 (95.0%) | 348 (79.4%) |
| 25 to 34 Years | 642 (96.7%) | 502 (89.6%) |
| 35 to 44 Years | 537 (82.9%) | 542 (80.2%) |
| 45 to 54 Years | 560 (92.9%) | 487 (84.7%) |
| 55 to 64 Years | 745 (87.4%) | 684 (90.1%) |
| 65 to 74 Years | 499 (96.7%) | 552 (94.5%) |
| 75 Years and over | 292 (90.7%) | 427 (87.7%) |
| Total | 4,669 (88.9%) | 4,587 (86.0%) |
Income Below Poverty Among Married-Couple Families in Washita County
The poverty statistics for married-couple families in Washita County show that 2.6% or 58 of the total 2,186 families live below the poverty line. Families with 1 or 2 children have the highest poverty rate of 3.9%, comprising of 25 families. On the other hand, families with 5 or more children have the lowest poverty rate of 0.0%, which includes 0 families.
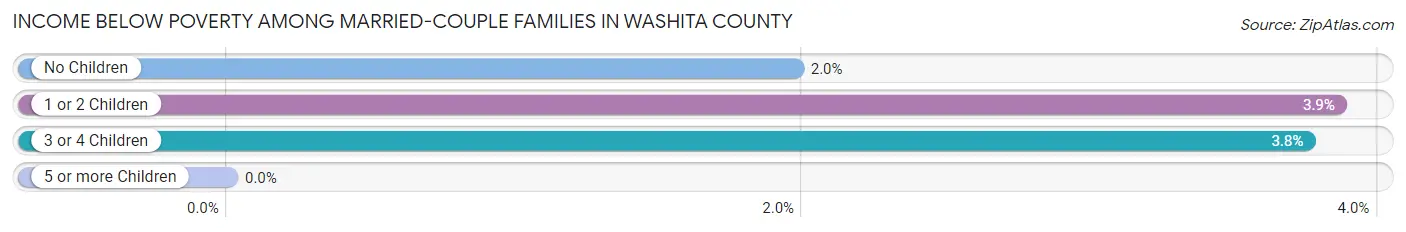
| Children | Above Poverty | Below Poverty |
| No Children | 1,344 (98.0%) | 27 (2.0%) |
| 1 or 2 Children | 622 (96.1%) | 25 (3.9%) |
| 3 or 4 Children | 154 (96.3%) | 6 (3.7%) |
| 5 or more Children | 8 (100.0%) | 0 (0.0%) |
| Total | 2,128 (97.4%) | 58 (2.6%) |
Income Below Poverty Among Single-Parent Households in Washita County
According to the poverty data in Washita County, 6.4% or 12 single-father households and 31.5% or 128 single-mother households are living below the poverty line. Among single-father households, those with 3 or 4 children have the highest poverty rate, with 4 households (28.6%) experiencing poverty. Likewise, among single-mother households, those with 5 or more children have the highest poverty rate, with 3 households (100.0%) falling below the poverty line.
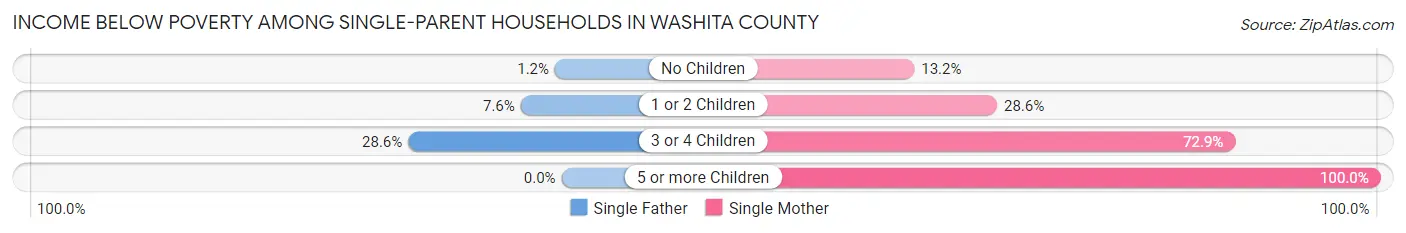
| Children | Single Father | Single Mother |
| No Children | 1 (1.2%) | 10 (13.2%) |
| 1 or 2 Children | 7 (7.6%) | 80 (28.6%) |
| 3 or 4 Children | 4 (28.6%) | 35 (72.9%) |
| 5 or more Children | 0 (0.0%) | 3 (100.0%) |
| Total | 12 (6.4%) | 128 (31.5%) |
Income Below Poverty Among Married-Couple vs Single-Parent Households in Washita County
The poverty data for Washita County shows that 58 of the married-couple family households (2.6%) and 140 of the single-parent households (23.6%) are living below the poverty level. Within the married-couple family households, those with 1 or 2 children have the highest poverty rate, with 25 households (3.9%) falling below the poverty line. Among the single-parent households, those with 5 or more children have the highest poverty rate, with 3 household (100.0%) living below poverty.
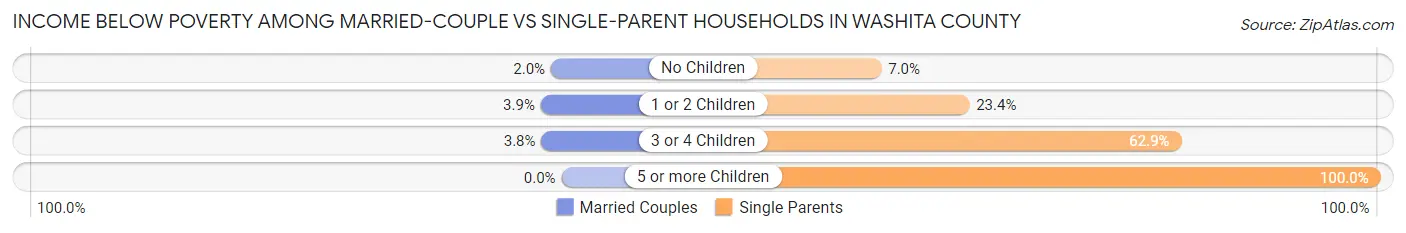
| Children | Married-Couple Families | Single-Parent Households |
| No Children | 27 (2.0%) | 11 (7.0%) |
| 1 or 2 Children | 25 (3.9%) | 87 (23.4%) |
| 3 or 4 Children | 6 (3.7%) | 39 (62.9%) |
| 5 or more Children | 0 (0.0%) | 3 (100.0%) |
| Total | 58 (2.6%) | 140 (23.6%) |
Race in Washita County
The most populous races in Washita County are White / Caucasian (9,371 | 85.7%), Hispanic or Latino (1,151 | 10.5%), and Two or more Races (901 | 8.2%).
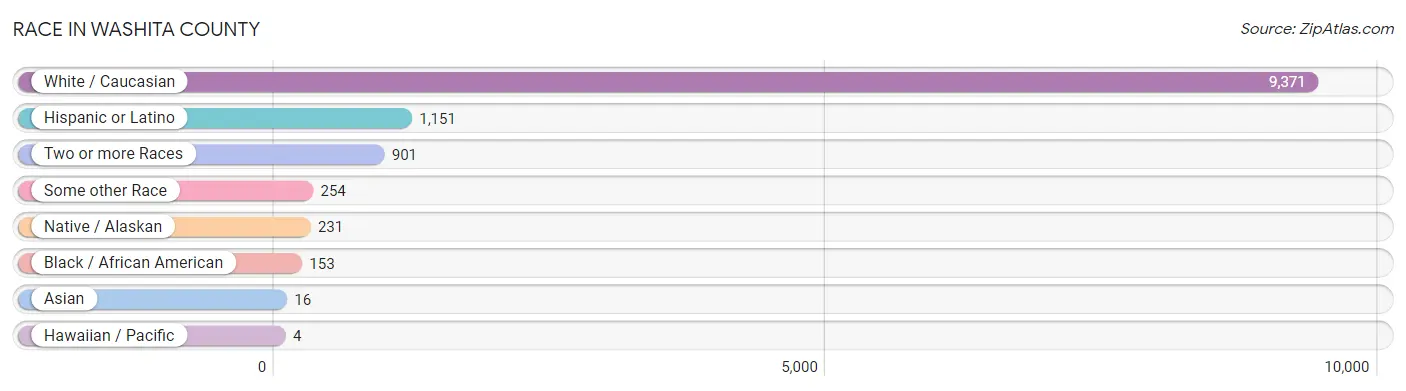
| Race | # Population | % Population |
| Asian | 16 | 0.2% |
| Black / African American | 153 | 1.4% |
| Hawaiian / Pacific | 4 | 0.0% |
| Hispanic or Latino | 1,151 | 10.5% |
| Native / Alaskan | 231 | 2.1% |
| White / Caucasian | 9,371 | 85.7% |
| Two or more Races | 901 | 8.2% |
| Some other Race | 254 | 2.3% |
| Total | 10,930 | 100.0% |
Ancestry in Washita County
The most populous ancestries reported in Washita County are German (2,069 | 18.9%), American (1,666 | 15.2%), Irish (1,426 | 13.1%), Mexican (1,007 | 9.2%), and English (719 | 6.6%), together accounting for 63.0% of all Washita County residents.
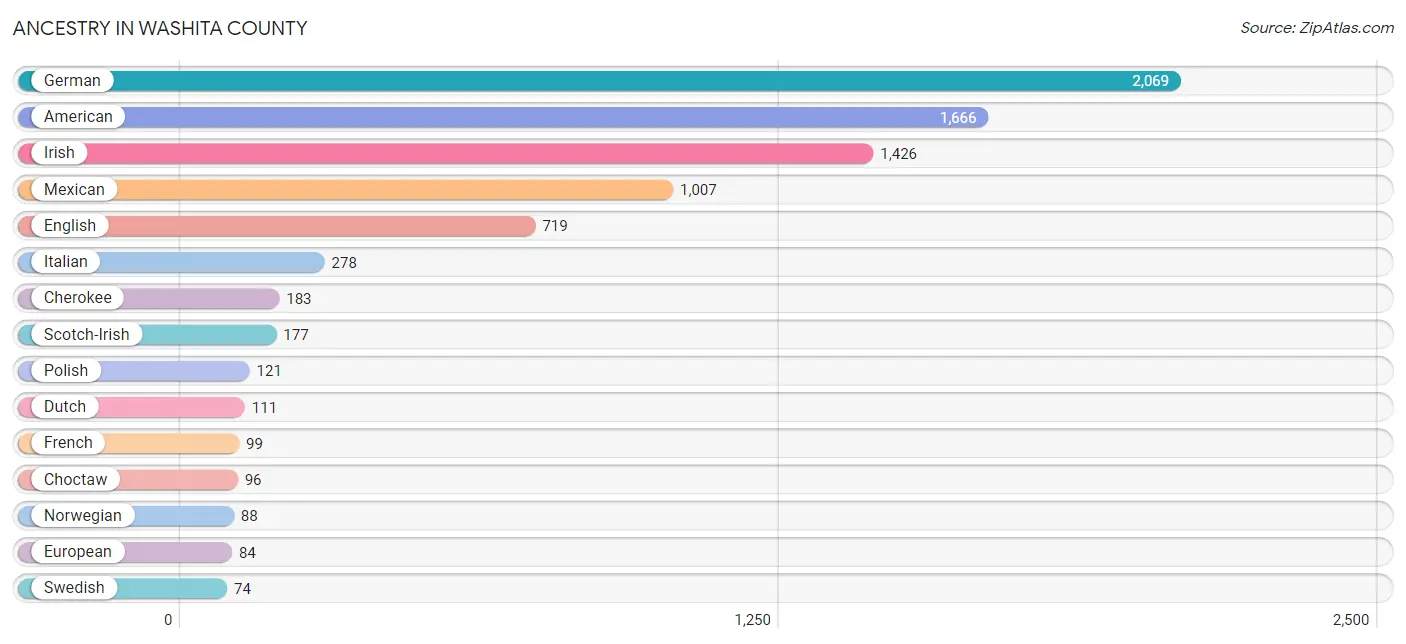
| Ancestry | # Population | % Population |
| African | 1 | 0.0% |
| American | 1,666 | 15.2% |
| Apache | 39 | 0.4% |
| Arapaho | 1 | 0.0% |
| Belgian | 1 | 0.0% |
| Bhutanese | 7 | 0.1% |
| Blackfeet | 9 | 0.1% |
| British | 13 | 0.1% |
| Cajun | 2 | 0.0% |
| Cherokee | 183 | 1.7% |
| Cheyenne | 15 | 0.1% |
| Chickasaw | 11 | 0.1% |
| Chinese | 13 | 0.1% |
| Chippewa | 30 | 0.3% |
| Choctaw | 96 | 0.9% |
| Comanche | 6 | 0.1% |
| Creek | 48 | 0.4% |
| Cuban | 5 | 0.1% |
| Czech | 61 | 0.6% |
| Czechoslovakian | 3 | 0.0% |
| Danish | 13 | 0.1% |
| Delaware | 2 | 0.0% |
| Dutch | 111 | 1.0% |
| Dutch West Indian | 8 | 0.1% |
| English | 719 | 6.6% |
| European | 84 | 0.8% |
| Finnish | 9 | 0.1% |
| French | 99 | 0.9% |
| French Canadian | 26 | 0.2% |
| German | 2,069 | 18.9% |
| Hungarian | 15 | 0.1% |
| Indian (Asian) | 11 | 0.1% |
| Irish | 1,426 | 13.1% |
| Israeli | 9 | 0.1% |
| Italian | 278 | 2.5% |
| Kiowa | 3 | 0.0% |
| Korean | 7 | 0.1% |
| Malaysian | 5 | 0.1% |
| Mexican | 1,007 | 9.2% |
| Mexican American Indian | 4 | 0.0% |
| Native Hawaiian | 11 | 0.1% |
| Northern European | 24 | 0.2% |
| Norwegian | 88 | 0.8% |
| Osage | 17 | 0.2% |
| Pennsylvania German | 2 | 0.0% |
| Polish | 121 | 1.1% |
| Portuguese | 15 | 0.1% |
| Potawatomi | 4 | 0.0% |
| Puerto Rican | 4 | 0.0% |
| Russian | 49 | 0.4% |
| Scandinavian | 11 | 0.1% |
| Scotch-Irish | 177 | 1.6% |
| Scottish | 65 | 0.6% |
| Seminole | 5 | 0.1% |
| Spaniard | 10 | 0.1% |
| Spanish | 16 | 0.2% |
| Sri Lankan | 6 | 0.1% |
| Subsaharan African | 1 | 0.0% |
| Swedish | 74 | 0.7% |
| Swiss | 14 | 0.1% |
| Thai | 38 | 0.4% |
| Turkish | 5 | 0.1% |
| Welsh | 30 | 0.3% | View All 63 Rows |
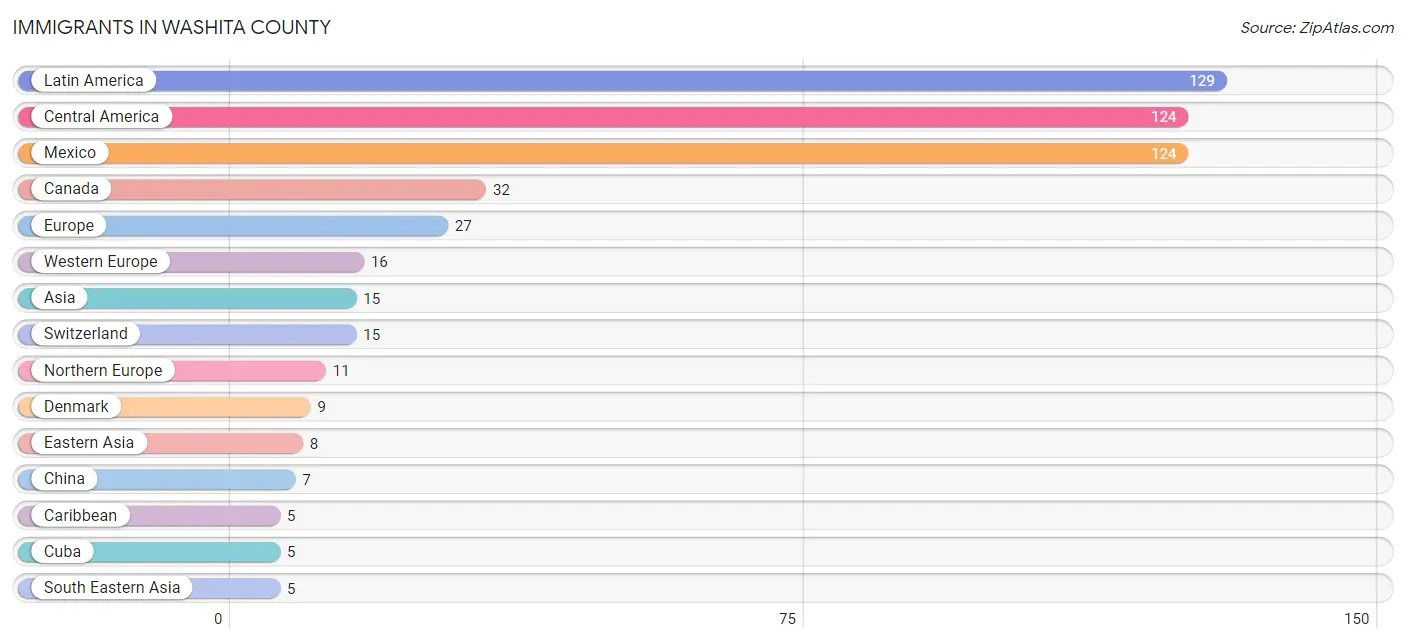
Immigrants in Washita County
The most numerous immigrant groups reported in Washita County came from Latin America (129 | 1.2%), Central America (124 | 1.1%), Mexico (124 | 1.1%), Canada (32 | 0.3%), and Europe (27 | 0.3%), together accounting for 4.0% of all Washita County residents.
| Immigration Origin | # Population | % Population |
| Asia | 15 | 0.1% |
| Canada | 32 | 0.3% |
| Caribbean | 5 | 0.1% |
| Central America | 124 | 1.1% |
| China | 7 | 0.1% |
| Cuba | 5 | 0.1% |
| Denmark | 9 | 0.1% |
| Eastern Asia | 8 | 0.1% |
| England | 2 | 0.0% |
| Europe | 27 | 0.3% |
| Germany | 1 | 0.0% |
| Israel | 2 | 0.0% |
| Japan | 1 | 0.0% |
| Latin America | 129 | 1.2% |
| Mexico | 124 | 1.1% |
| Northern Europe | 11 | 0.1% |
| Philippines | 3 | 0.0% |
| South Eastern Asia | 5 | 0.1% |
| Switzerland | 15 | 0.1% |
| Vietnam | 2 | 0.0% |
| Western Asia | 2 | 0.0% |
| Western Europe | 16 | 0.2% | View All 22 Rows |
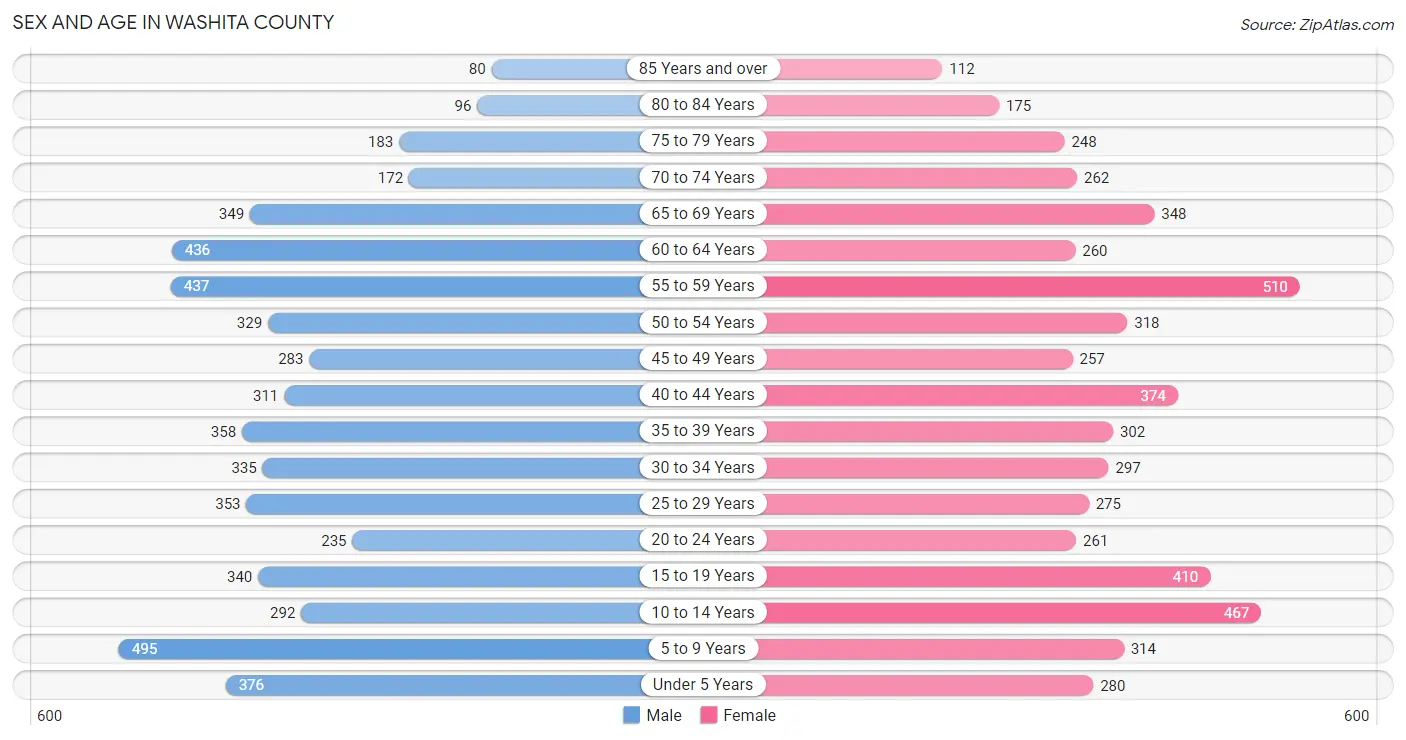
Sex and Age in Washita County
Sex and Age in Washita County
The most populous age groups in Washita County are 5 to 9 Years (495 | 9.1%) for men and 55 to 59 Years (510 | 9.3%) for women.
| Age Bracket | Male | Female |
| Under 5 Years | 376 (6.9%) | 280 (5.1%) |
| 5 to 9 Years | 495 (9.1%) | 314 (5.7%) |
| 10 to 14 Years | 292 (5.3%) | 467 (8.5%) |
| 15 to 19 Years | 340 (6.2%) | 410 (7.5%) |
| 20 to 24 Years | 235 (4.3%) | 261 (4.8%) |
| 25 to 29 Years | 353 (6.5%) | 275 (5.0%) |
| 30 to 34 Years | 335 (6.1%) | 297 (5.4%) |
| 35 to 39 Years | 358 (6.6%) | 302 (5.5%) |
| 40 to 44 Years | 311 (5.7%) | 374 (6.8%) |
| 45 to 49 Years | 283 (5.2%) | 257 (4.7%) |
| 50 to 54 Years | 329 (6.0%) | 318 (5.8%) |
| 55 to 59 Years | 437 (8.0%) | 510 (9.3%) |
| 60 to 64 Years | 436 (8.0%) | 260 (4.8%) |
| 65 to 69 Years | 349 (6.4%) | 348 (6.4%) |
| 70 to 74 Years | 172 (3.2%) | 262 (4.8%) |
| 75 to 79 Years | 183 (3.4%) | 248 (4.5%) |
| 80 to 84 Years | 96 (1.8%) | 175 (3.2%) |
| 85 Years and over | 80 (1.5%) | 112 (2.1%) |
| Total | 5,460 (100.0%) | 5,470 (100.0%) |
Families and Households in Washita County
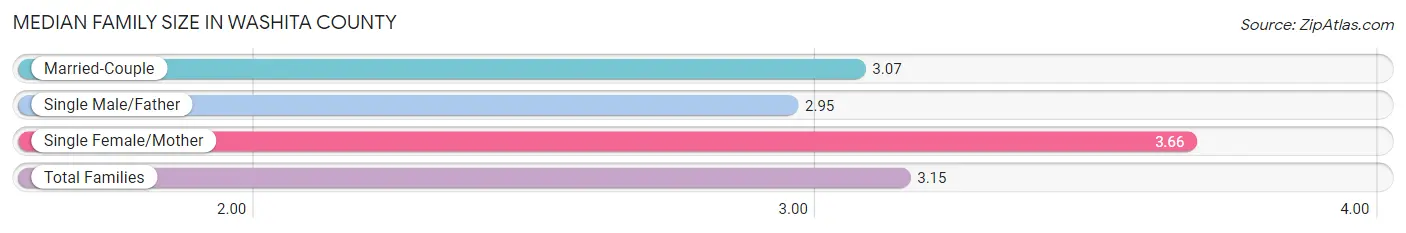
Median Family Size in Washita County
The median family size in Washita County is 3.15 persons per family, with single female/mother families (407 | 14.6%) accounting for the largest median family size of 3.66 persons per family. On the other hand, single male/father families (187 | 6.7%) represent the smallest median family size with 2.95 persons per family.
| Family Type | # Families | Family Size |
| Married-Couple | 2,186 (78.6%) | 3.07 |
| Single Male/Father | 187 (6.7%) | 2.95 |
| Single Female/Mother | 407 (14.6%) | 3.66 |
| Total Families | 2,780 (100.0%) | 3.15 |
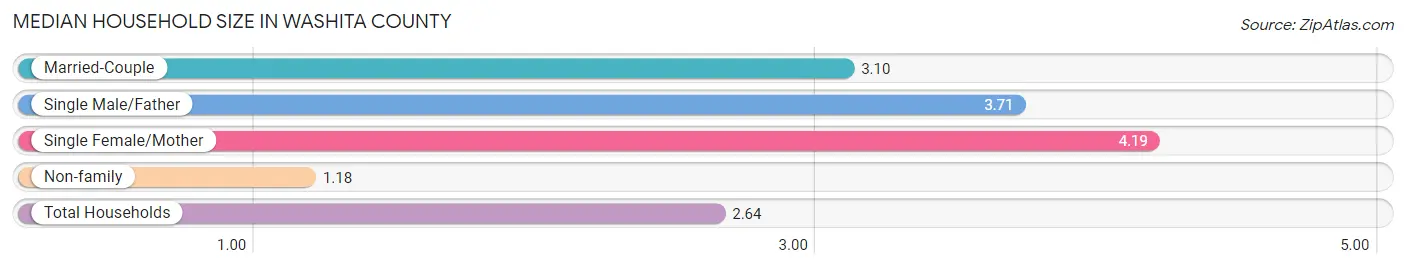
Median Household Size in Washita County
The median household size in Washita County is 2.64 persons per household, with single female/mother households (407 | 10.1%) accounting for the largest median household size of 4.19 persons per household. non-family households (1,266 | 31.3%) represent the smallest median household size with 1.18 persons per household.
| Household Type | # Households | Household Size |
| Married-Couple | 2,186 (54.0%) | 3.10 |
| Single Male/Father | 187 (4.6%) | 3.71 |
| Single Female/Mother | 407 (10.1%) | 4.19 |
| Non-family | 1,266 (31.3%) | 1.18 |
| Total Households | 4,046 (100.0%) | 2.64 |
Household Size by Marriage Status in Washita County
Out of a total of 4,046 households in Washita County, 2,780 (68.7%) are family households, while 1,266 (31.3%) are nonfamily households. The most numerous type of family households are 2-person households, comprising 1,349, and the most common type of nonfamily households are 1-person households, comprising 1,116.
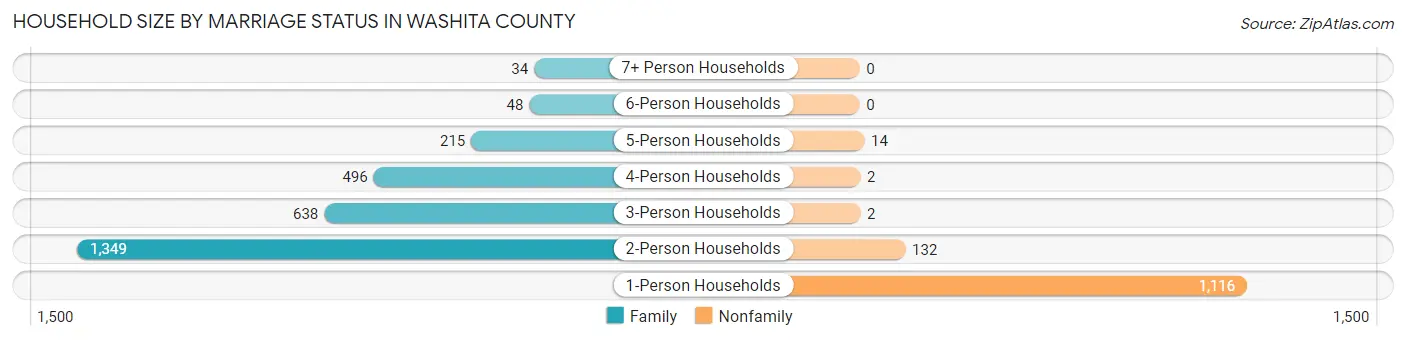
| Household Size | Family Households | Nonfamily Households |
| 1-Person Households | - | 1,116 (27.6%) |
| 2-Person Households | 1,349 (33.3%) | 132 (3.3%) |
| 3-Person Households | 638 (15.8%) | 2 (0.1%) |
| 4-Person Households | 496 (12.3%) | 2 (0.1%) |
| 5-Person Households | 215 (5.3%) | 14 (0.4%) |
| 6-Person Households | 48 (1.2%) | 0 (0.0%) |
| 7+ Person Households | 34 (0.8%) | 0 (0.0%) |
| Total | 2,780 (68.7%) | 1,266 (31.3%) |
Female Fertility in Washita County
Fertility by Age in Washita County
Average fertility rate in Washita County is 39.0 births per 1,000 women. Women in the age bracket of 20 to 34 years have the highest fertility rate with 77.0 births per 1,000 women. Women in the age bracket of 20 to 34 years acount for 71.1% of all women with births.
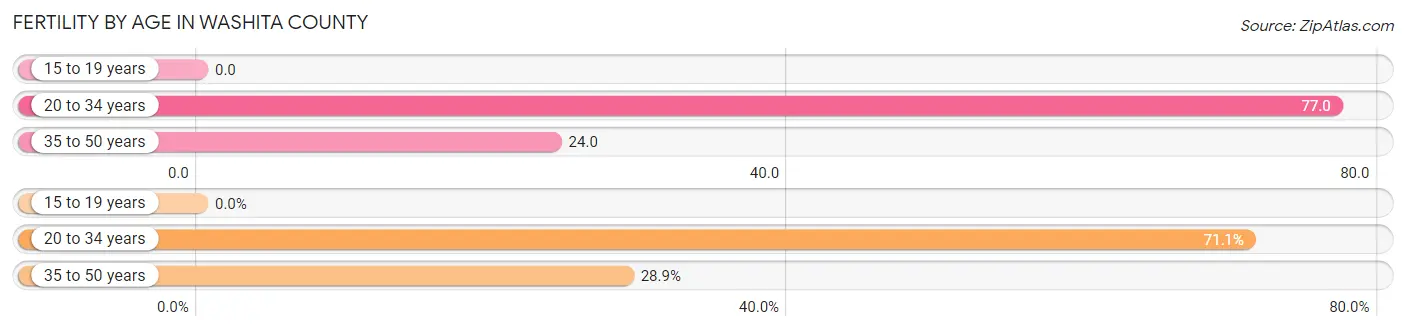
| Age Bracket | Women with Births | Births / 1,000 Women |
| 15 to 19 years | 0 (0.0%) | 0.0 |
| 20 to 34 years | 64 (71.1%) | 77.0 |
| 35 to 50 years | 26 (28.9%) | 24.0 |
| Total | 90 (100.0%) | 39.0 |
Fertility by Age by Marriage Status in Washita County
45.6% of women with births (90) in Washita County are married. The highest percentage of unmarried women with births falls into 20 to 34 years age bracket with 59.4% of them unmarried at the time of birth, while the lowest percentage of unmarried women with births belong to 35 to 50 years age bracket with 42.3% of them unmarried.
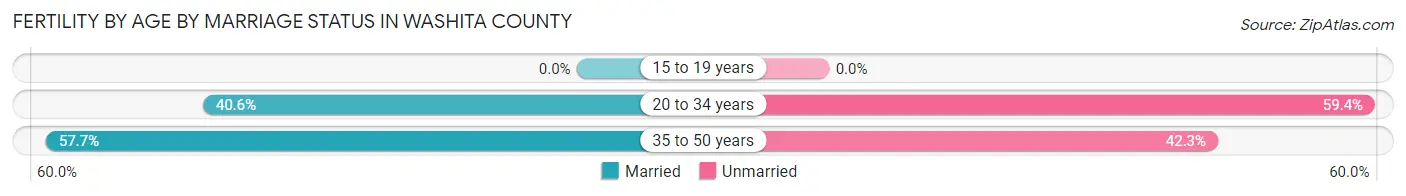
| Age Bracket | Married | Unmarried |
| 15 to 19 years | 0 (0.0%) | 0 (0.0%) |
| 20 to 34 years | 26 (40.6%) | 38 (59.4%) |
| 35 to 50 years | 15 (57.7%) | 11 (42.3%) |
| Total | 41 (45.6%) | 49 (54.4%) |
Fertility by Education in Washita County
Average fertility rate in Washita County is 39.0 births per 1,000 women. Women with the education attainment of graduate degree have the highest fertility rate of 78.0 births per 1,000 women, while women with the education attainment of college or associate's degree have the lowest fertility at 31.0 births per 1,000 women. Women with the education attainment of high school diploma represent 28.9% of all women with births.
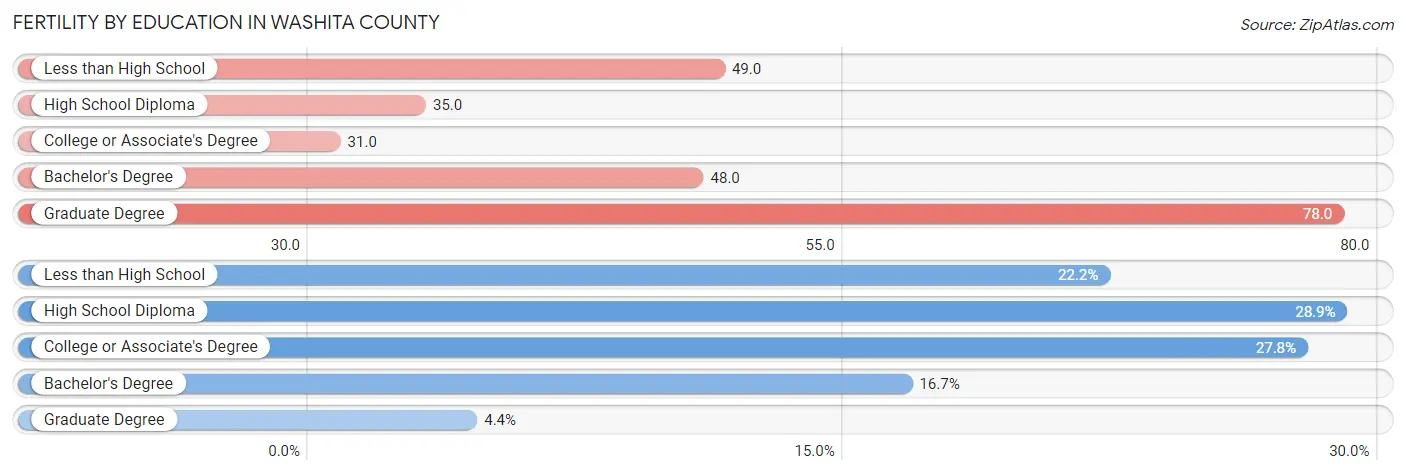
| Educational Attainment | Women with Births | Births / 1,000 Women |
| Less than High School | 20 (22.2%) | 49.0 |
| High School Diploma | 26 (28.9%) | 35.0 |
| College or Associate's Degree | 25 (27.8%) | 31.0 |
| Bachelor's Degree | 15 (16.7%) | 48.0 |
| Graduate Degree | 4 (4.4%) | 78.0 |
| Total | 90 (100.0%) | 39.0 |
Fertility by Education by Marriage Status in Washita County
54.4% of women with births in Washita County are unmarried. Women with the educational attainment of graduate degree are most likely to be married with 100.0% of them married at childbirth, while women with the educational attainment of bachelor's degree are least likely to be married with 93.3% of them unmarried at childbirth.
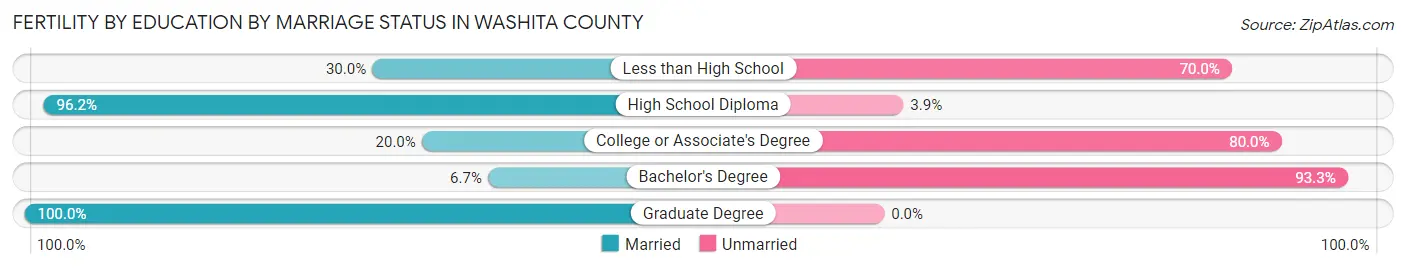
| Educational Attainment | Married | Unmarried |
| Less than High School | 6 (30.0%) | 14 (70.0%) |
| High School Diploma | 25 (96.2%) | 1 (3.8%) |
| College or Associate's Degree | 5 (20.0%) | 20 (80.0%) |
| Bachelor's Degree | 1 (6.7%) | 14 (93.3%) |
| Graduate Degree | 4 (100.0%) | 0 (0.0%) |
| Total | 41 (45.6%) | 49 (54.4%) |
Employment Characteristics in Washita County
Employment by Class of Employer in Washita County
Among the 4,710 employed individuals in Washita County, private company employees (2,772 | 58.9%), state government employees (382 | 8.1%), and local government employees (364 | 7.7%) make up the most common classes of employment.
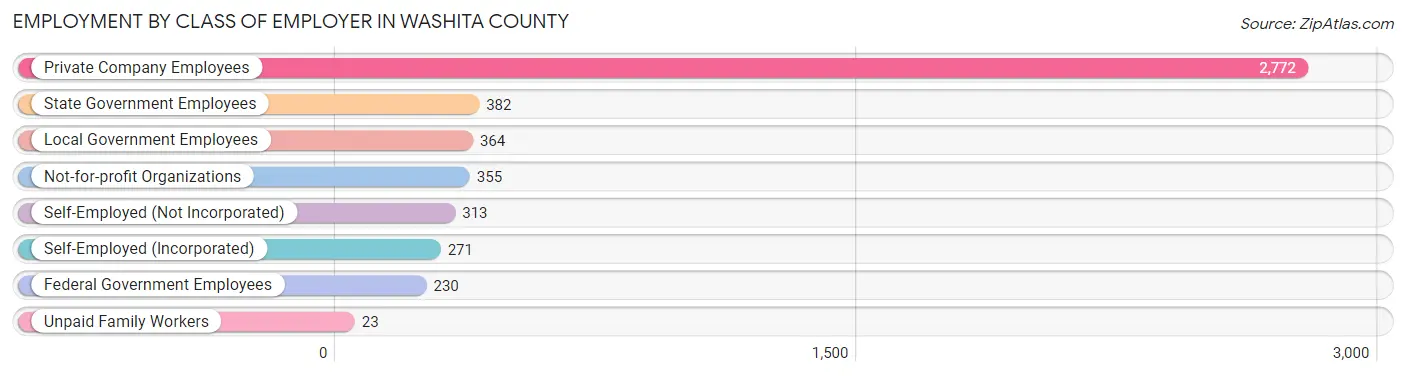
| Employer Class | # Employees | % Employees |
| Private Company Employees | 2,772 | 58.9% |
| Self-Employed (Incorporated) | 271 | 5.8% |
| Self-Employed (Not Incorporated) | 313 | 6.7% |
| Not-for-profit Organizations | 355 | 7.5% |
| Local Government Employees | 364 | 7.7% |
| State Government Employees | 382 | 8.1% |
| Federal Government Employees | 230 | 4.9% |
| Unpaid Family Workers | 23 | 0.5% |
| Total | 4,710 | 100.0% |
Employment Status by Age in Washita County
According to the labor force statistics for Washita County, out of the total population over 16 years of age (8,523), 59.4% or 5,063 individuals are in the labor force, with 5.8% or 294 of them unemployed. The age group with the highest labor force participation rate is 30 to 34 years, with 86.4% or 546 individuals in the labor force. Within the labor force, the 16 to 19 years age range has the highest percentage of unemployed individuals, with 15.0% or 39 of them being unemployed.
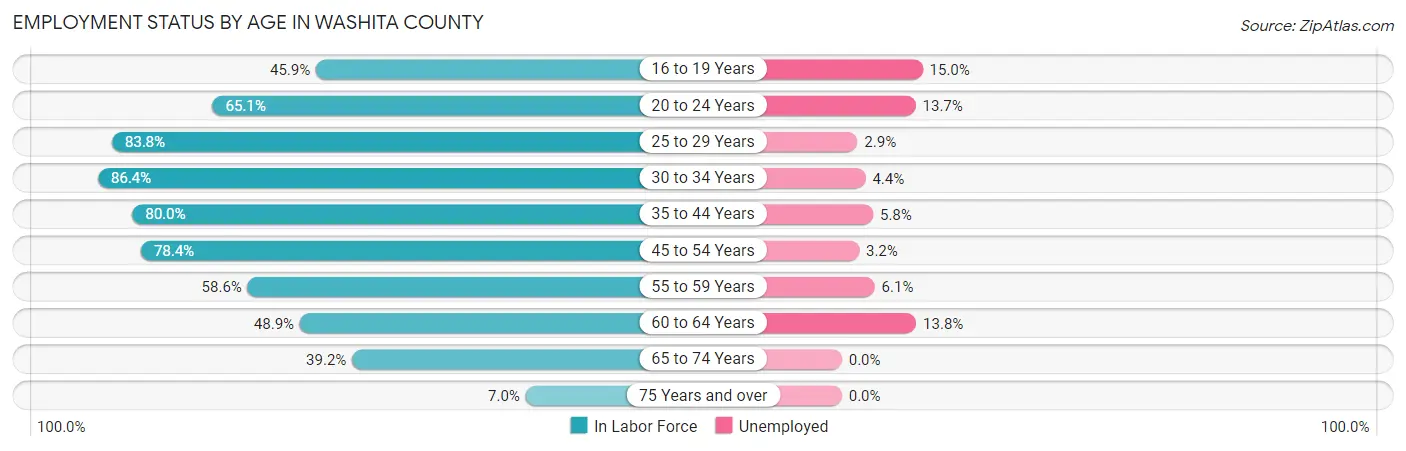
| Age Bracket | In Labor Force | Unemployed |
| 16 to 19 Years | 260 (45.9%) | 39 (15.0%) |
| 20 to 24 Years | 323 (65.1%) | 44 (13.7%) |
| 25 to 29 Years | 526 (83.8%) | 15 (2.9%) |
| 30 to 34 Years | 546 (86.4%) | 24 (4.4%) |
| 35 to 44 Years | 1,076 (80.0%) | 62 (5.8%) |
| 45 to 54 Years | 931 (78.4%) | 30 (3.2%) |
| 55 to 59 Years | 555 (58.6%) | 34 (6.1%) |
| 60 to 64 Years | 340 (48.9%) | 47 (13.8%) |
| 65 to 74 Years | 443 (39.2%) | 0 (0.0%) |
| 75 Years and over | 63 (7.0%) | 0 (0.0%) |
| Total | 5,063 (59.4%) | 294 (5.8%) |
Employment Status by Educational Attainment in Washita County
According to labor force statistics for Washita County, 73.1% of individuals (3,973) out of the total population between 25 and 64 years of age (5,435) are in the labor force, with 5.3% or 211 of them being unemployed. The group with the highest labor force participation rate are those with the educational attainment of bachelor's degree or higher, with 86.2% or 784 individuals in the labor force. Within the labor force, individuals with college / associate degree education have the highest percentage of unemployment, with 7.8% or 104 of them being unemployed.
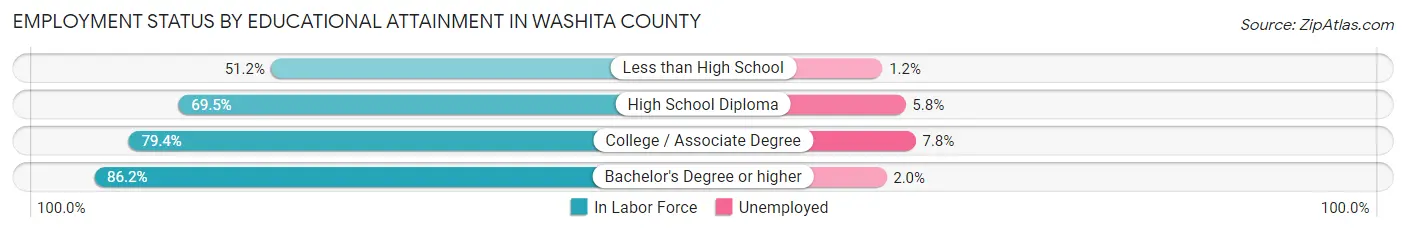
| Educational Attainment | In Labor Force | Unemployed |
| Less than High School | 335 (51.2%) | 8 (1.2%) |
| High School Diploma | 1,525 (69.5%) | 127 (5.8%) |
| College / Associate Degree | 1,332 (79.4%) | 131 (7.8%) |
| Bachelor's Degree or higher | 784 (86.2%) | 18 (2.0%) |
| Total | 3,973 (73.1%) | 288 (5.3%) |
Employment Occupations by Sex in Washita County
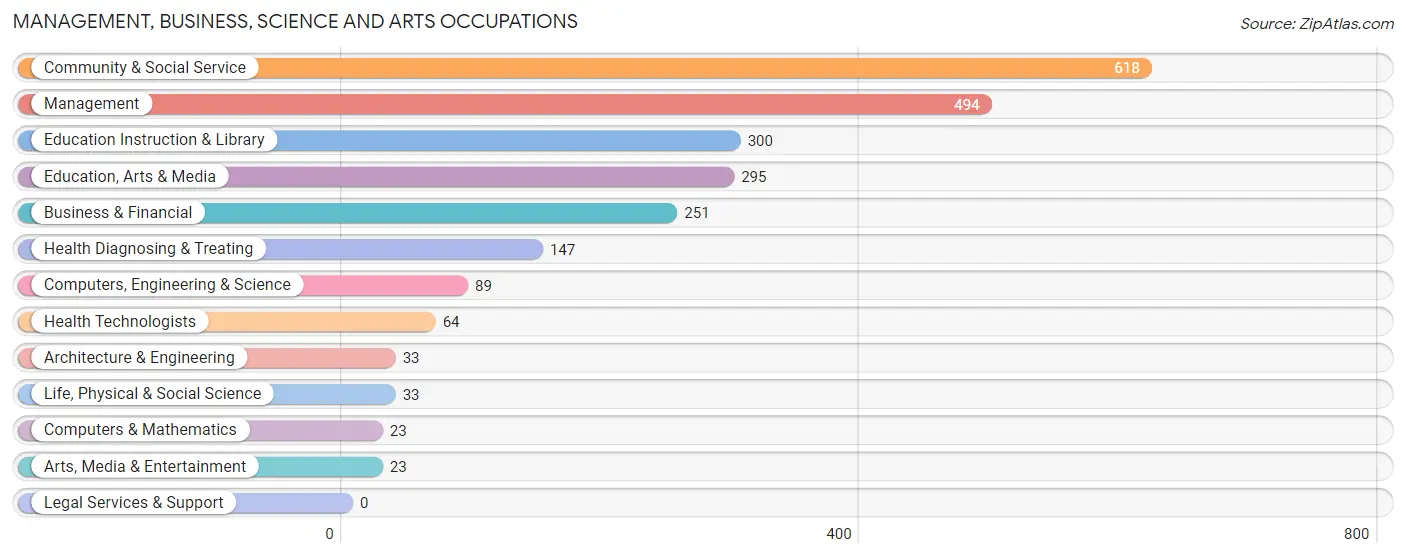
Management, Business, Science and Arts Occupations
The most common Management, Business, Science and Arts occupations in Washita County are Community & Social Service (618 | 13.0%), Management (494 | 10.4%), Education Instruction & Library (300 | 6.3%), Education, Arts & Media (295 | 6.2%), and Business & Financial (251 | 5.3%).
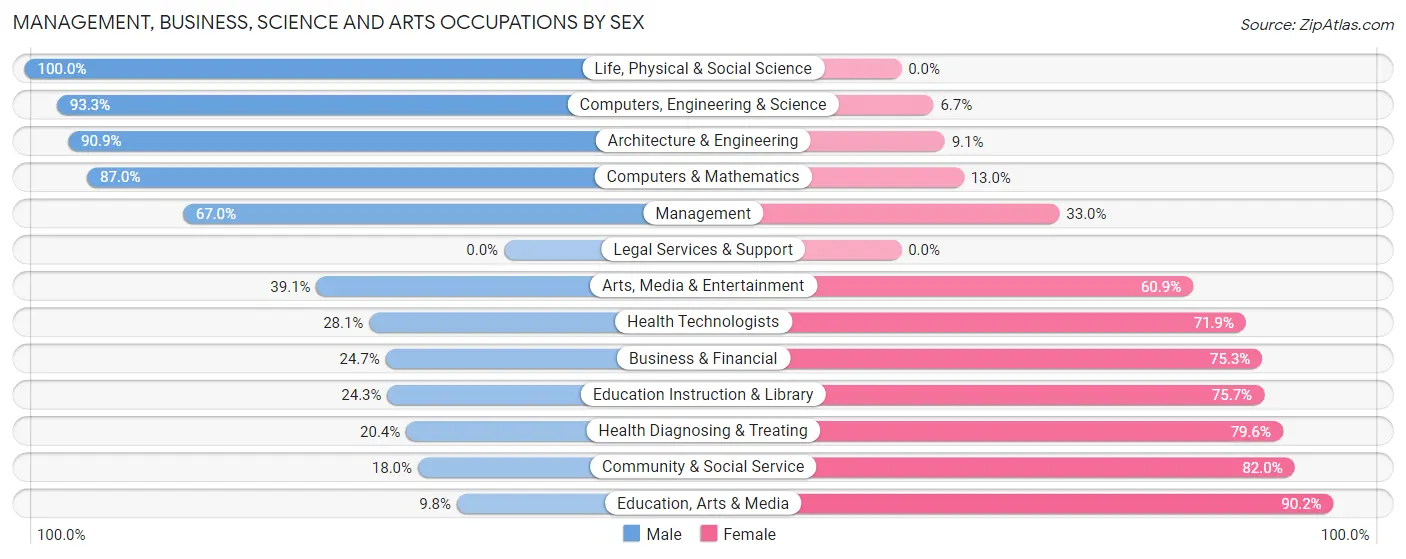
Management, Business, Science and Arts Occupations by Sex
Within the Management, Business, Science and Arts occupations in Washita County, the most male-oriented occupations are Life, Physical & Social Science (100.0%), Computers, Engineering & Science (93.3%), and Architecture & Engineering (90.9%), while the most female-oriented occupations are Education, Arts & Media (90.2%), Community & Social Service (82.0%), and Health Diagnosing & Treating (79.6%).
| Occupation | Male | Female |
| Management | 331 (67.0%) | 163 (33.0%) |
| Business & Financial | 62 (24.7%) | 189 (75.3%) |
| Computers, Engineering & Science | 83 (93.3%) | 6 (6.7%) |
| Computers & Mathematics | 20 (87.0%) | 3 (13.0%) |
| Architecture & Engineering | 30 (90.9%) | 3 (9.1%) |
| Life, Physical & Social Science | 33 (100.0%) | 0 (0.0%) |
| Community & Social Service | 111 (18.0%) | 507 (82.0%) |
| Education, Arts & Media | 29 (9.8%) | 266 (90.2%) |
| Legal Services & Support | 0 (0.0%) | 0 (0.0%) |
| Education Instruction & Library | 73 (24.3%) | 227 (75.7%) |
| Arts, Media & Entertainment | 9 (39.1%) | 14 (60.9%) |
| Health Diagnosing & Treating | 30 (20.4%) | 117 (79.6%) |
| Health Technologists | 18 (28.1%) | 46 (71.9%) |
| Total (Category) | 617 (38.6%) | 982 (61.4%) |
| Total (Overall) | 2,563 (53.9%) | 2,196 (46.1%) |
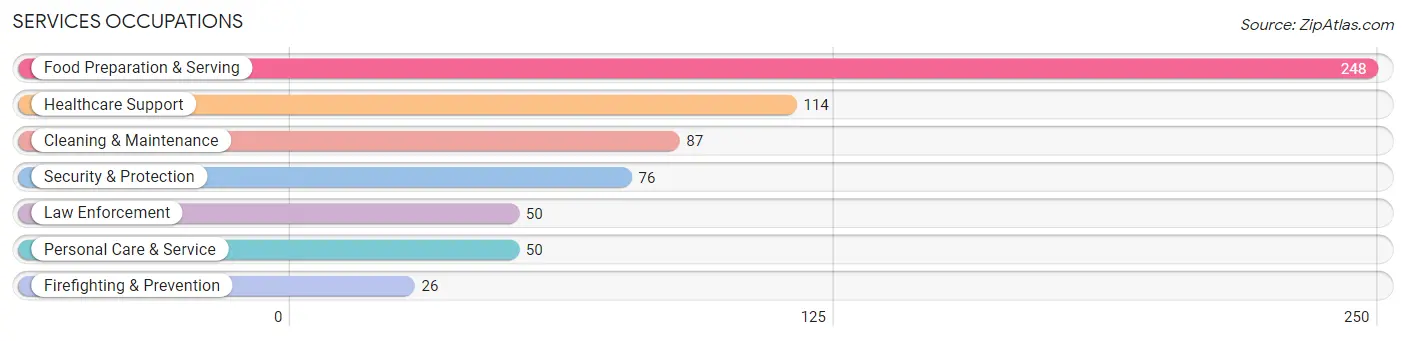
Services Occupations
The most common Services occupations in Washita County are Food Preparation & Serving (248 | 5.2%), Healthcare Support (114 | 2.4%), Cleaning & Maintenance (87 | 1.8%), Security & Protection (76 | 1.6%), and Law Enforcement (50 | 1.1%).
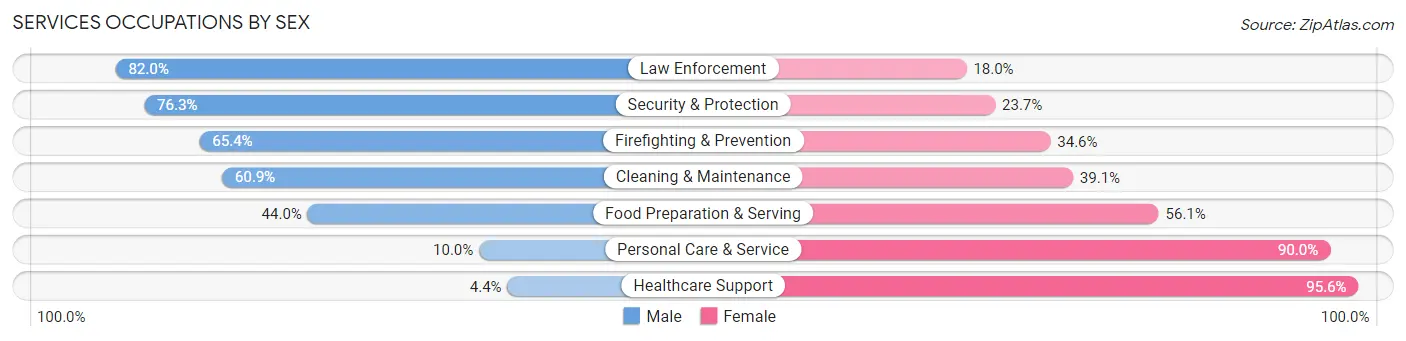
Services Occupations by Sex
Within the Services occupations in Washita County, the most male-oriented occupations are Law Enforcement (82.0%), Security & Protection (76.3%), and Firefighting & Prevention (65.4%), while the most female-oriented occupations are Healthcare Support (95.6%), Personal Care & Service (90.0%), and Food Preparation & Serving (56.0%).
| Occupation | Male | Female |
| Healthcare Support | 5 (4.4%) | 109 (95.6%) |
| Security & Protection | 58 (76.3%) | 18 (23.7%) |
| Firefighting & Prevention | 17 (65.4%) | 9 (34.6%) |
| Law Enforcement | 41 (82.0%) | 9 (18.0%) |
| Food Preparation & Serving | 109 (44.0%) | 139 (56.0%) |
| Cleaning & Maintenance | 53 (60.9%) | 34 (39.1%) |
| Personal Care & Service | 5 (10.0%) | 45 (90.0%) |
| Total (Category) | 230 (40.0%) | 345 (60.0%) |
| Total (Overall) | 2,563 (53.9%) | 2,196 (46.1%) |
Sales and Office Occupations
The most common Sales and Office occupations in Washita County are Office & Administration (473 | 9.9%), and Sales & Related (434 | 9.1%).
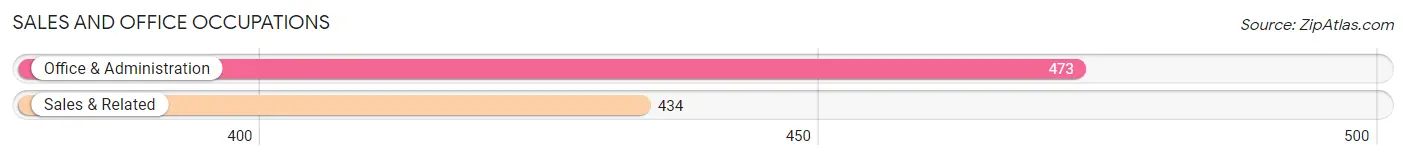
Sales and Office Occupations by Sex
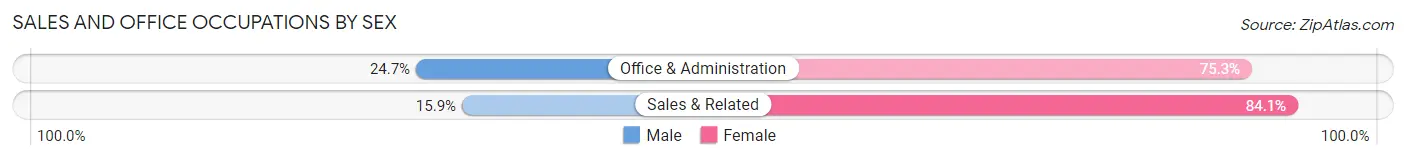
| Occupation | Male | Female |
| Sales & Related | 69 (15.9%) | 365 (84.1%) |
| Office & Administration | 117 (24.7%) | 356 (75.3%) |
| Total (Category) | 186 (20.5%) | 721 (79.5%) |
| Total (Overall) | 2,563 (53.9%) | 2,196 (46.1%) |
Natural Resources, Construction and Maintenance Occupations
The most common Natural Resources, Construction and Maintenance occupations in Washita County are Construction & Extraction (435 | 9.1%), Installation, Maintenance & Repair (374 | 7.9%), and Farming, Fishing & Forestry (54 | 1.1%).
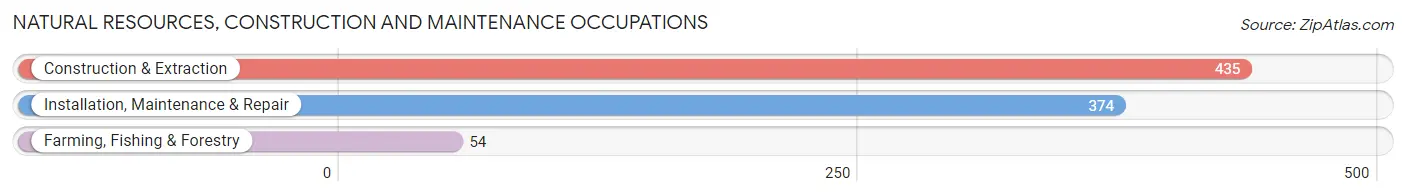
Natural Resources, Construction and Maintenance Occupations by Sex
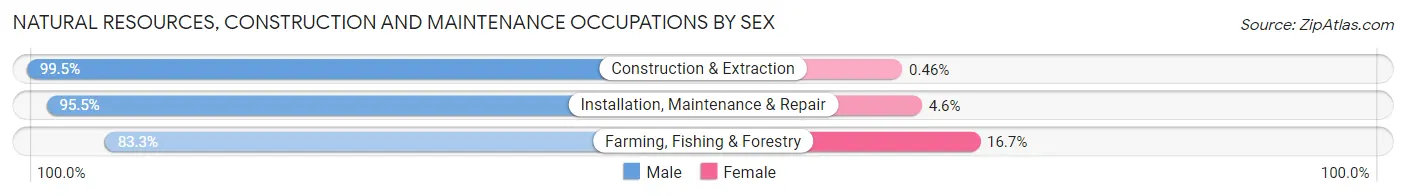
| Occupation | Male | Female |
| Farming, Fishing & Forestry | 45 (83.3%) | 9 (16.7%) |
| Construction & Extraction | 433 (99.5%) | 2 (0.5%) |
| Installation, Maintenance & Repair | 357 (95.5%) | 17 (4.5%) |
| Total (Category) | 835 (96.8%) | 28 (3.2%) |
| Total (Overall) | 2,563 (53.9%) | 2,196 (46.1%) |
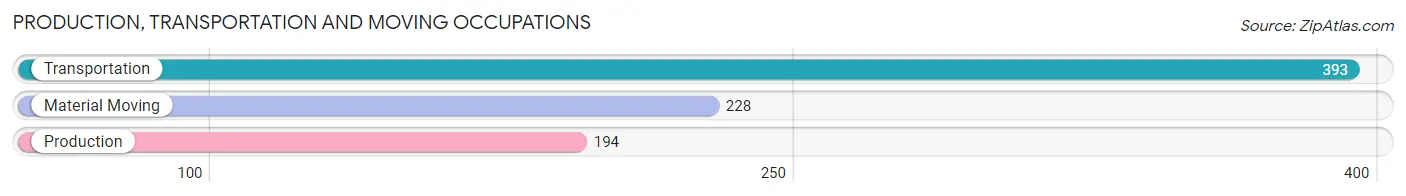
Production, Transportation and Moving Occupations
The most common Production, Transportation and Moving occupations in Washita County are Transportation (393 | 8.3%), Material Moving (228 | 4.8%), and Production (194 | 4.1%).
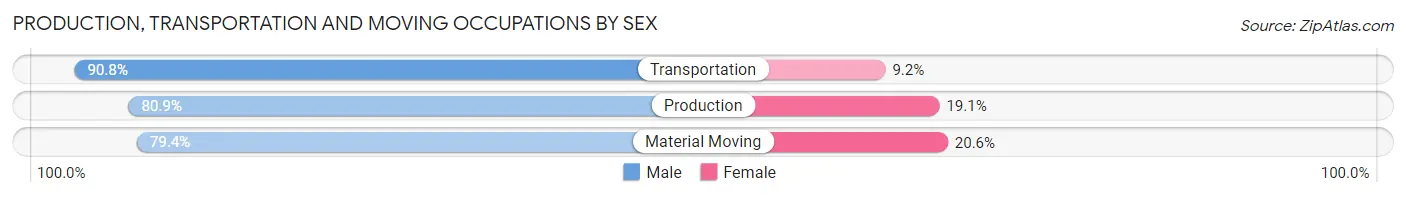
Production, Transportation and Moving Occupations by Sex
| Occupation | Male | Female |
| Production | 157 (80.9%) | 37 (19.1%) |
| Transportation | 357 (90.8%) | 36 (9.2%) |
| Material Moving | 181 (79.4%) | 47 (20.6%) |
| Total (Category) | 695 (85.3%) | 120 (14.7%) |
| Total (Overall) | 2,563 (53.9%) | 2,196 (46.1%) |
Employment Industries by Sex in Washita County
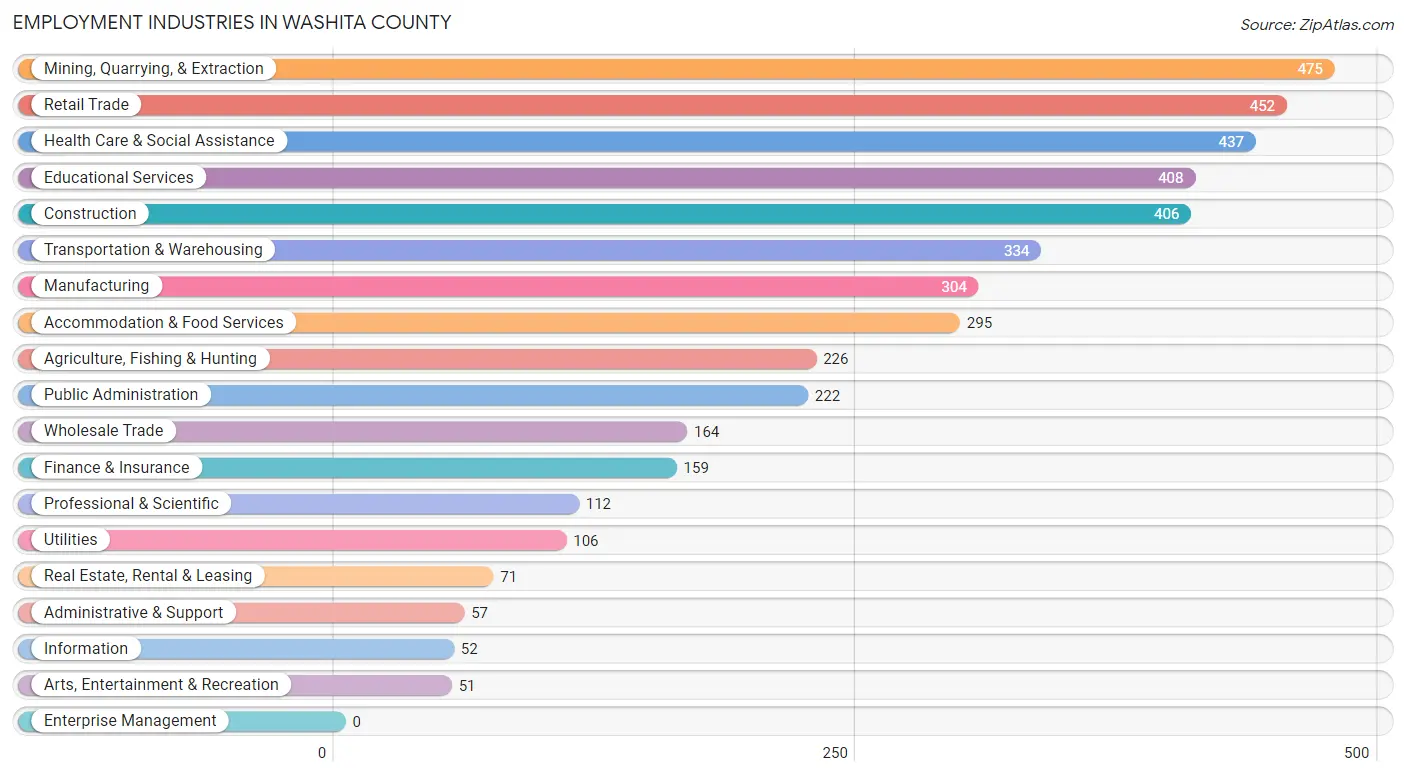
Employment Industries in Washita County
The major employment industries in Washita County include Mining, Quarrying, & Extraction (475 | 10.0%), Retail Trade (452 | 9.5%), Health Care & Social Assistance (437 | 9.2%), Educational Services (408 | 8.6%), and Construction (406 | 8.5%).
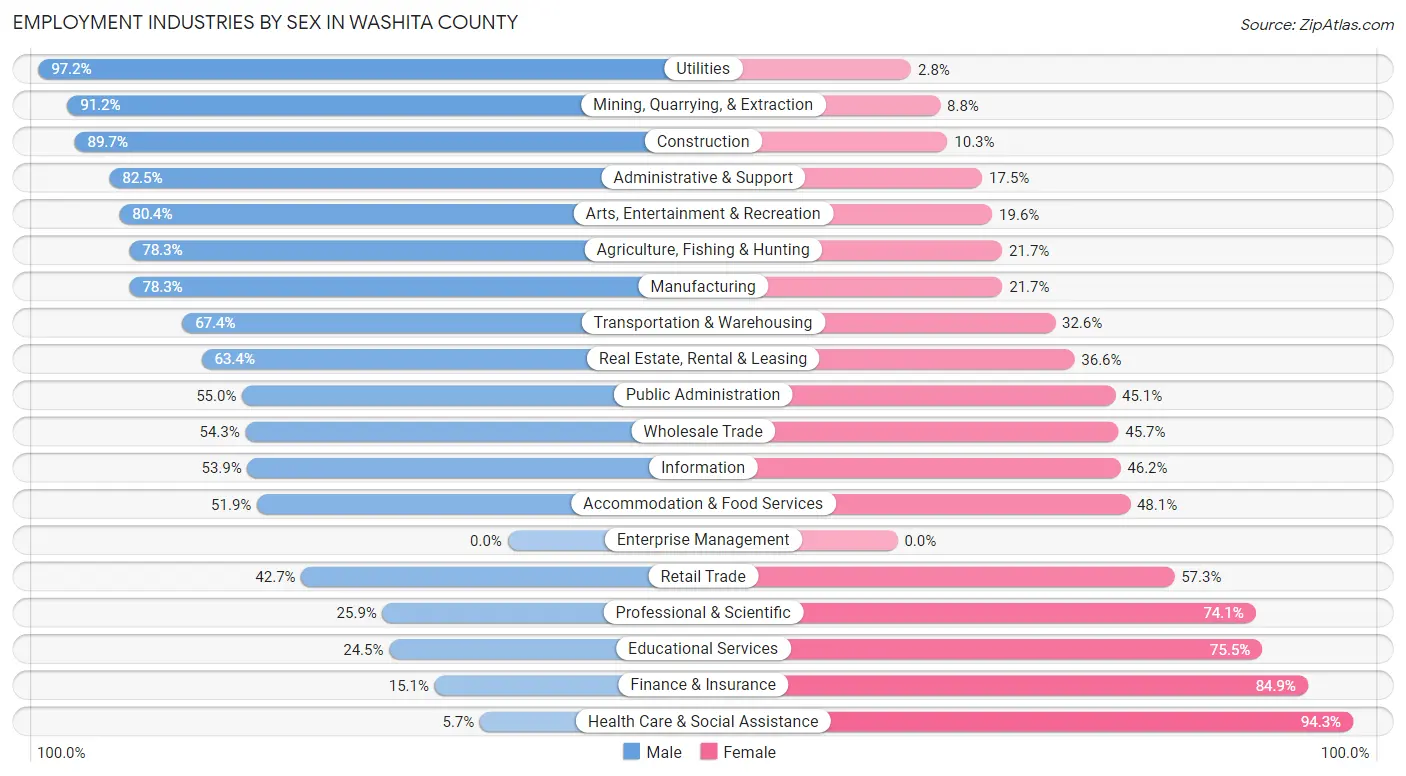
Employment Industries by Sex in Washita County
The Washita County industries that see more men than women are Utilities (97.2%), Mining, Quarrying, & Extraction (91.2%), and Construction (89.7%), whereas the industries that tend to have a higher number of women are Health Care & Social Assistance (94.3%), Finance & Insurance (84.9%), and Educational Services (75.5%).
| Industry | Male | Female |
| Agriculture, Fishing & Hunting | 177 (78.3%) | 49 (21.7%) |
| Mining, Quarrying, & Extraction | 433 (91.2%) | 42 (8.8%) |
| Construction | 364 (89.7%) | 42 (10.3%) |
| Manufacturing | 238 (78.3%) | 66 (21.7%) |
| Wholesale Trade | 89 (54.3%) | 75 (45.7%) |
| Retail Trade | 193 (42.7%) | 259 (57.3%) |
| Transportation & Warehousing | 225 (67.4%) | 109 (32.6%) |
| Utilities | 103 (97.2%) | 3 (2.8%) |
| Information | 28 (53.8%) | 24 (46.2%) |
| Finance & Insurance | 24 (15.1%) | 135 (84.9%) |
| Real Estate, Rental & Leasing | 45 (63.4%) | 26 (36.6%) |
| Professional & Scientific | 29 (25.9%) | 83 (74.1%) |
| Enterprise Management | 0 (0.0%) | 0 (0.0%) |
| Administrative & Support | 47 (82.5%) | 10 (17.5%) |
| Educational Services | 100 (24.5%) | 308 (75.5%) |
| Health Care & Social Assistance | 25 (5.7%) | 412 (94.3%) |
| Arts, Entertainment & Recreation | 41 (80.4%) | 10 (19.6%) |
| Accommodation & Food Services | 153 (51.9%) | 142 (48.1%) |
| Public Administration | 122 (54.9%) | 100 (45.1%) |
| Total | 2,563 (53.9%) | 2,196 (46.1%) |
Education in Washita County
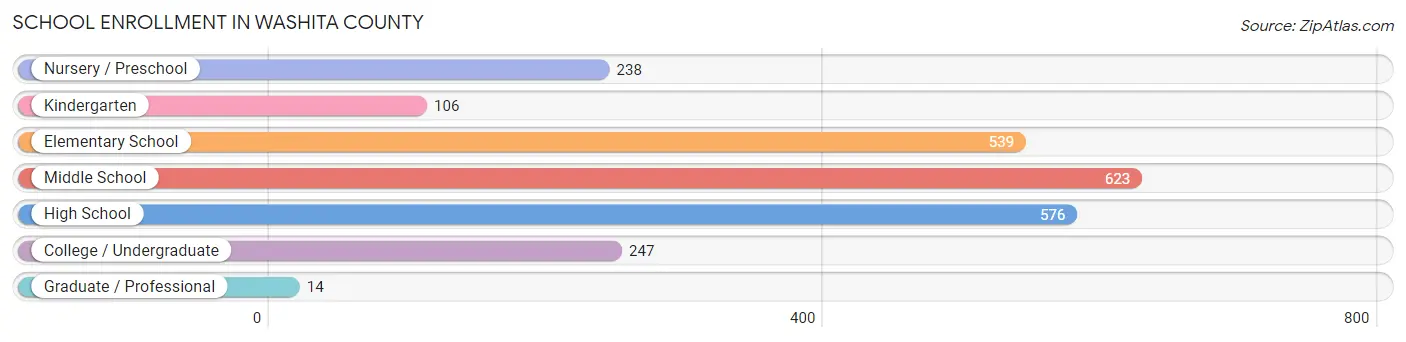
School Enrollment in Washita County
The most common levels of schooling among the 2,343 students in Washita County are middle school (623 | 26.6%), high school (576 | 24.6%), and elementary school (539 | 23.0%).
| School Level | # Students | % Students |
| Nursery / Preschool | 238 | 10.2% |
| Kindergarten | 106 | 4.5% |
| Elementary School | 539 | 23.0% |
| Middle School | 623 | 26.6% |
| High School | 576 | 24.6% |
| College / Undergraduate | 247 | 10.5% |
| Graduate / Professional | 14 | 0.6% |
| Total | 2,343 | 100.0% |
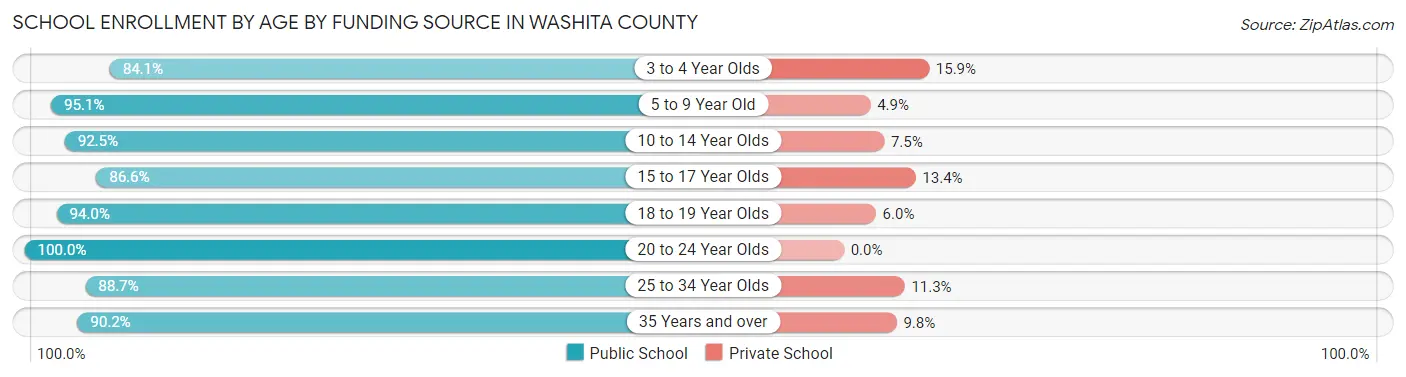
School Enrollment by Age by Funding Source in Washita County
Out of a total of 2,343 students who are enrolled in schools in Washita County, 187 (8.0%) attend a private institution, while the remaining 2,156 (92.0%) are enrolled in public schools. The age group of 3 to 4 year olds has the highest likelihood of being enrolled in private schools, with 10 (15.9% in the age bracket) enrolled. Conversely, the age group of 20 to 24 year olds has the lowest likelihood of being enrolled in a private school, with 38 (100.0% in the age bracket) attending a public institution.
| Age Bracket | Public School | Private School |
| 3 to 4 Year Olds | 53 (84.1%) | 10 (15.9%) |
| 5 to 9 Year Old | 673 (95.1%) | 35 (4.9%) |
| 10 to 14 Year Olds | 654 (92.5%) | 53 (7.5%) |
| 15 to 17 Year Olds | 376 (86.6%) | 58 (13.4%) |
| 18 to 19 Year Olds | 205 (94.0%) | 13 (6.0%) |
| 20 to 24 Year Olds | 38 (100.0%) | 0 (0.0%) |
| 25 to 34 Year Olds | 47 (88.7%) | 6 (11.3%) |
| 35 Years and over | 110 (90.2%) | 12 (9.8%) |
| Total | 2,156 (92.0%) | 187 (8.0%) |
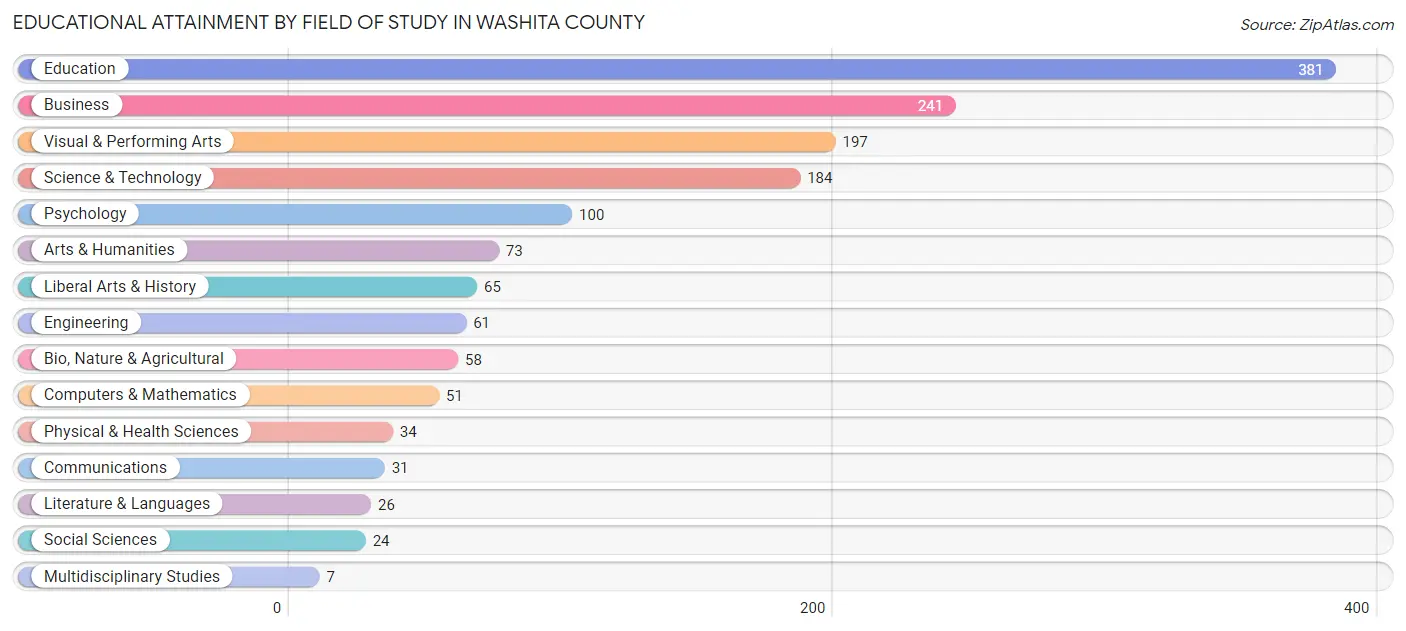
Educational Attainment by Field of Study in Washita County
Education (381 | 24.8%), business (241 | 15.7%), visual & performing arts (197 | 12.9%), science & technology (184 | 12.0%), and psychology (100 | 6.5%) are the most common fields of study among 1,533 individuals in Washita County who have obtained a bachelor's degree or higher.
| Field of Study | # Graduates | % Graduates |
| Computers & Mathematics | 51 | 3.3% |
| Bio, Nature & Agricultural | 58 | 3.8% |
| Physical & Health Sciences | 34 | 2.2% |
| Psychology | 100 | 6.5% |
| Social Sciences | 24 | 1.6% |
| Engineering | 61 | 4.0% |
| Multidisciplinary Studies | 7 | 0.5% |
| Science & Technology | 184 | 12.0% |
| Business | 241 | 15.7% |
| Education | 381 | 24.8% |
| Literature & Languages | 26 | 1.7% |
| Liberal Arts & History | 65 | 4.2% |
| Visual & Performing Arts | 197 | 12.9% |
| Communications | 31 | 2.0% |
| Arts & Humanities | 73 | 4.8% |
| Total | 1,533 | 100.0% |
Transportation & Commute in Washita County
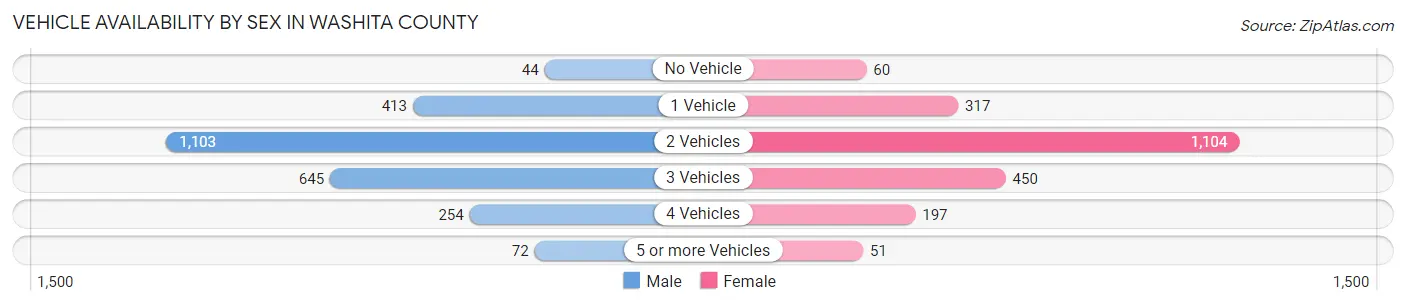
Vehicle Availability by Sex in Washita County
The most prevalent vehicle ownership categories in Washita County are males with 2 vehicles (1,103, accounting for 43.6%) and females with 2 vehicles (1,104, making up 50.6%).
| Vehicles Available | Male | Female |
| No Vehicle | 44 (1.7%) | 60 (2.8%) |
| 1 Vehicle | 413 (16.3%) | 317 (14.5%) |
| 2 Vehicles | 1,103 (43.6%) | 1,104 (50.7%) |
| 3 Vehicles | 645 (25.5%) | 450 (20.6%) |
| 4 Vehicles | 254 (10.0%) | 197 (9.0%) |
| 5 or more Vehicles | 72 (2.8%) | 51 (2.3%) |
| Total | 2,531 (100.0%) | 2,179 (100.0%) |
Commute Time in Washita County
The most frequently occuring commute durations in Washita County are less than 5 minutes (698 commuters, 15.5%), 20 to 24 minutes (672 commuters, 15.0%), and 15 to 19 minutes (583 commuters, 13.0%).
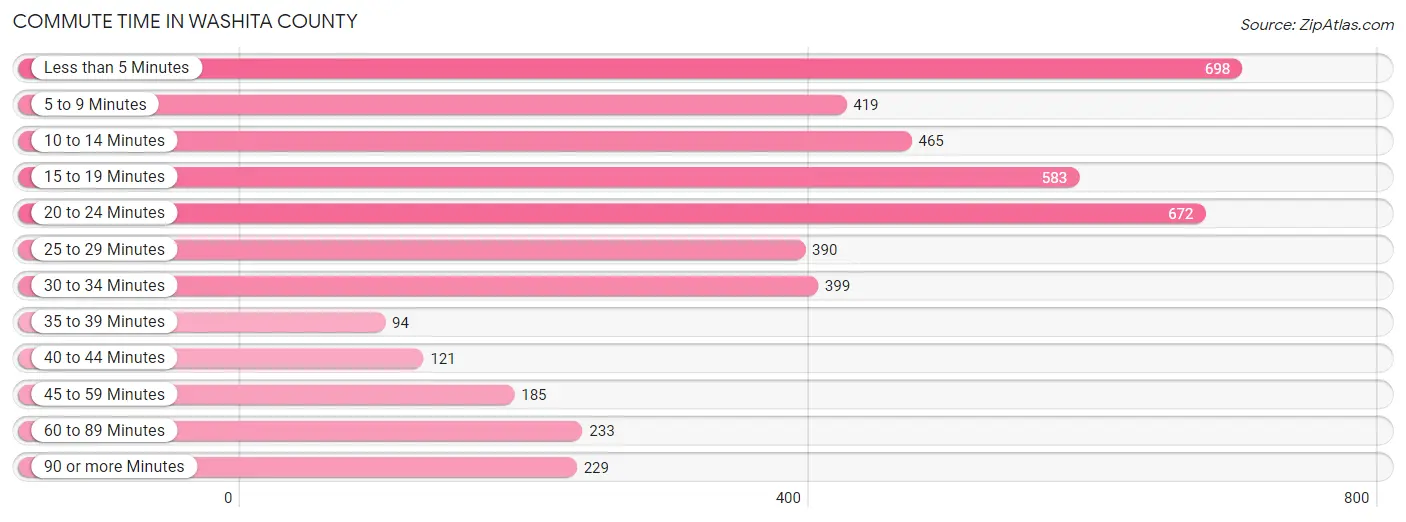
| Commute Time | # Commuters | % Commuters |
| Less than 5 Minutes | 698 | 15.5% |
| 5 to 9 Minutes | 419 | 9.3% |
| 10 to 14 Minutes | 465 | 10.4% |
| 15 to 19 Minutes | 583 | 13.0% |
| 20 to 24 Minutes | 672 | 15.0% |
| 25 to 29 Minutes | 390 | 8.7% |
| 30 to 34 Minutes | 399 | 8.9% |
| 35 to 39 Minutes | 94 | 2.1% |
| 40 to 44 Minutes | 121 | 2.7% |
| 45 to 59 Minutes | 185 | 4.1% |
| 60 to 89 Minutes | 233 | 5.2% |
| 90 or more Minutes | 229 | 5.1% |
Commute Time by Sex in Washita County
The most common commute times in Washita County are 15 to 19 minutes (298 commuters, 12.4%) for males and less than 5 minutes (472 commuters, 22.6%) for females.
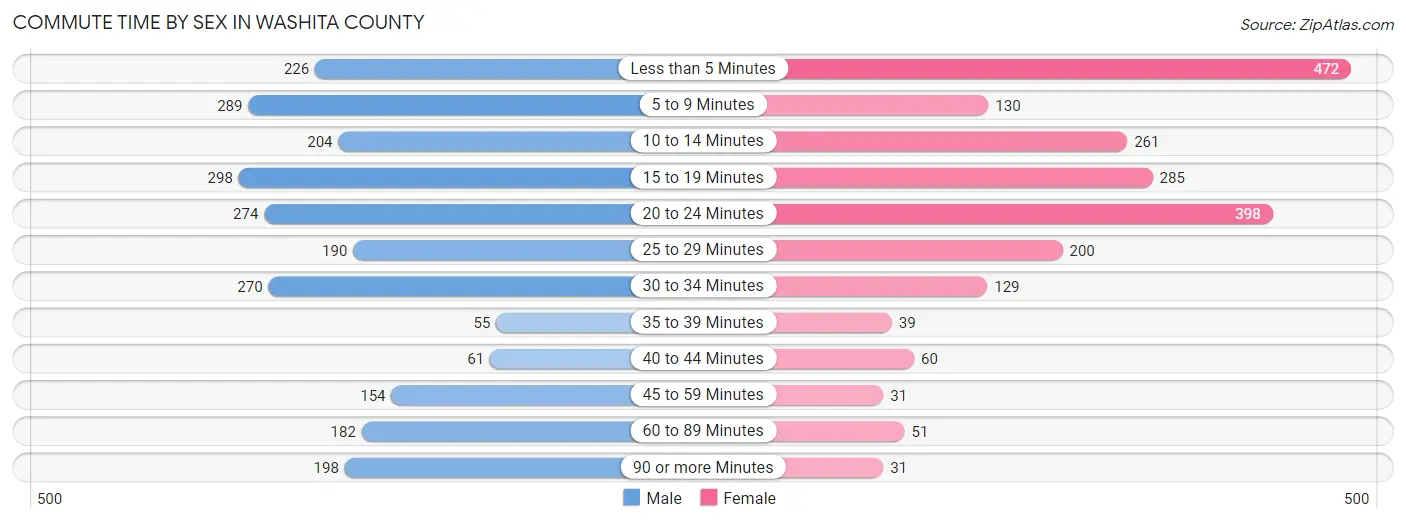
| Commute Time | Male | Female |
| Less than 5 Minutes | 226 (9.4%) | 472 (22.6%) |
| 5 to 9 Minutes | 289 (12.0%) | 130 (6.2%) |
| 10 to 14 Minutes | 204 (8.5%) | 261 (12.5%) |
| 15 to 19 Minutes | 298 (12.4%) | 285 (13.7%) |
| 20 to 24 Minutes | 274 (11.4%) | 398 (19.1%) |
| 25 to 29 Minutes | 190 (7.9%) | 200 (9.6%) |
| 30 to 34 Minutes | 270 (11.3%) | 129 (6.2%) |
| 35 to 39 Minutes | 55 (2.3%) | 39 (1.9%) |
| 40 to 44 Minutes | 61 (2.5%) | 60 (2.9%) |
| 45 to 59 Minutes | 154 (6.4%) | 31 (1.5%) |
| 60 to 89 Minutes | 182 (7.6%) | 51 (2.4%) |
| 90 or more Minutes | 198 (8.3%) | 31 (1.5%) |
Time of Departure to Work by Sex in Washita County
The most frequent times of departure to work in Washita County are 7:00 AM to 7:29 AM (521, 21.7%) for males and 7:00 AM to 7:29 AM (490, 23.5%) for females.
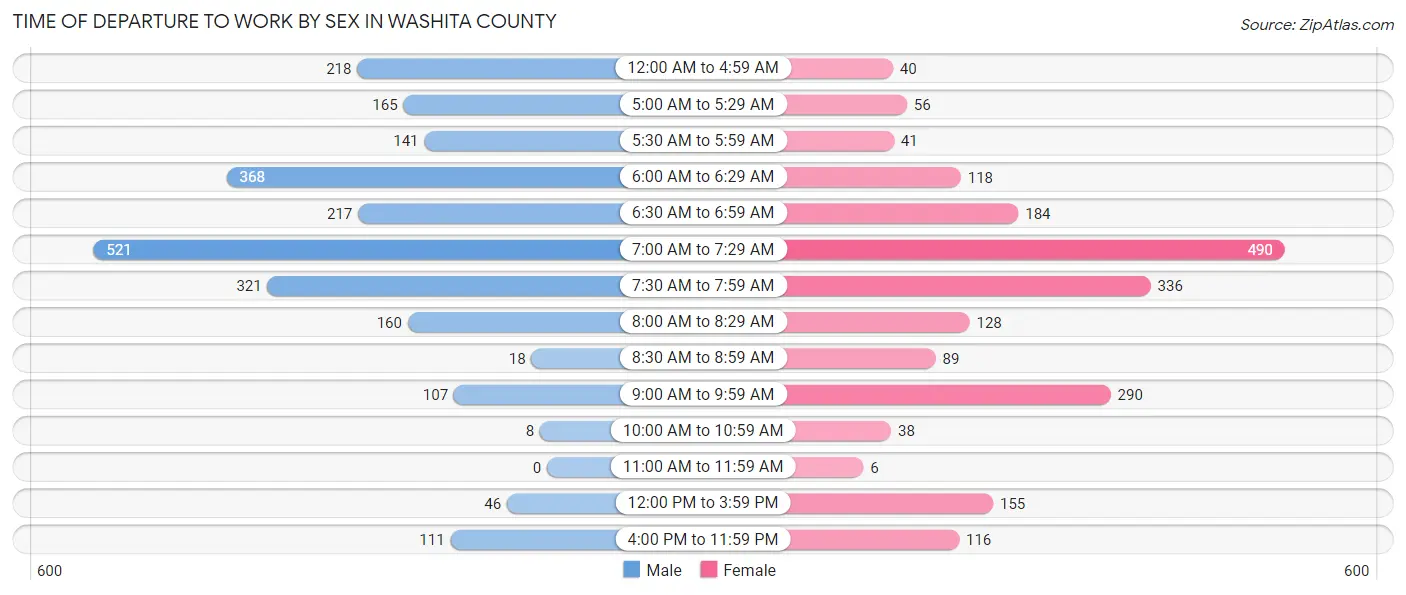
| Time of Departure | Male | Female |
| 12:00 AM to 4:59 AM | 218 (9.1%) | 40 (1.9%) |
| 5:00 AM to 5:29 AM | 165 (6.9%) | 56 (2.7%) |
| 5:30 AM to 5:59 AM | 141 (5.9%) | 41 (2.0%) |
| 6:00 AM to 6:29 AM | 368 (15.3%) | 118 (5.7%) |
| 6:30 AM to 6:59 AM | 217 (9.0%) | 184 (8.8%) |
| 7:00 AM to 7:29 AM | 521 (21.7%) | 490 (23.5%) |
| 7:30 AM to 7:59 AM | 321 (13.4%) | 336 (16.1%) |
| 8:00 AM to 8:29 AM | 160 (6.7%) | 128 (6.1%) |
| 8:30 AM to 8:59 AM | 18 (0.7%) | 89 (4.3%) |
| 9:00 AM to 9:59 AM | 107 (4.5%) | 290 (13.9%) |
| 10:00 AM to 10:59 AM | 8 (0.3%) | 38 (1.8%) |
| 11:00 AM to 11:59 AM | 0 (0.0%) | 6 (0.3%) |
| 12:00 PM to 3:59 PM | 46 (1.9%) | 155 (7.4%) |
| 4:00 PM to 11:59 PM | 111 (4.6%) | 116 (5.6%) |
| Total | 2,401 (100.0%) | 2,087 (100.0%) |
Housing Occupancy in Washita County
Occupancy by Ownership in Washita County
Of the total 4,046 dwellings in Washita County, owner-occupied units account for 3,033 (75.0%), while renter-occupied units make up 1,013 (25.0%).
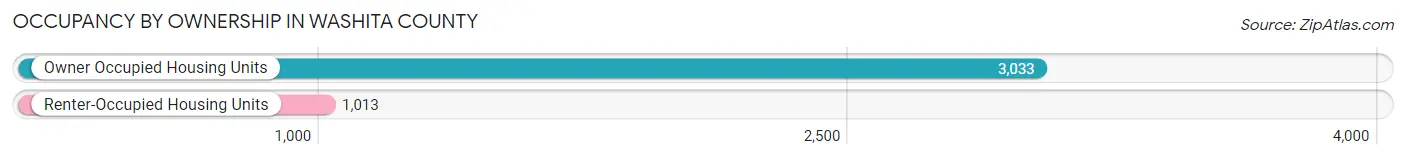
| Occupancy | # Housing Units | % Housing Units |
| Owner Occupied Housing Units | 3,033 | 75.0% |
| Renter-Occupied Housing Units | 1,013 | 25.0% |
| Total Occupied Housing Units | 4,046 | 100.0% |
Occupancy by Household Size in Washita County
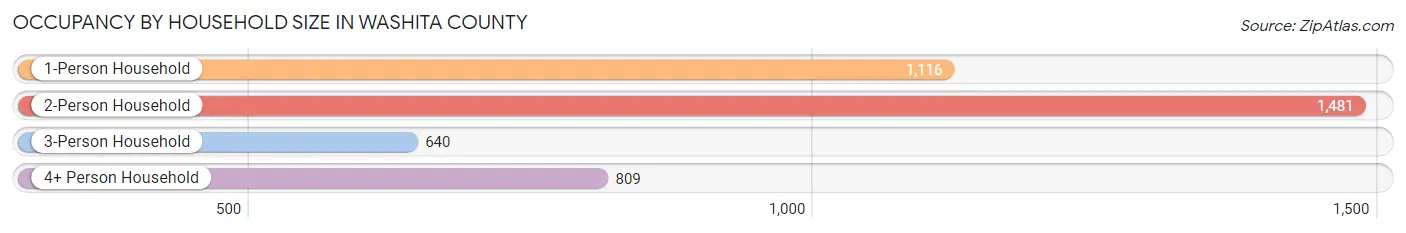
| Household Size | # Housing Units | % Housing Units |
| 1-Person Household | 1,116 | 27.6% |
| 2-Person Household | 1,481 | 36.6% |
| 3-Person Household | 640 | 15.8% |
| 4+ Person Household | 809 | 20.0% |
| Total Housing Units | 4,046 | 100.0% |
Occupancy by Ownership by Household Size in Washita County
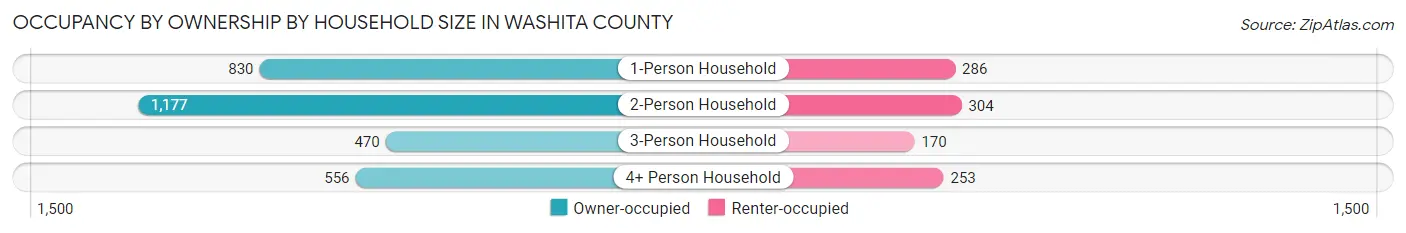
| Household Size | Owner-occupied | Renter-occupied |
| 1-Person Household | 830 (74.4%) | 286 (25.6%) |
| 2-Person Household | 1,177 (79.5%) | 304 (20.5%) |
| 3-Person Household | 470 (73.4%) | 170 (26.6%) |
| 4+ Person Household | 556 (68.7%) | 253 (31.3%) |
| Total Housing Units | 3,033 (75.0%) | 1,013 (25.0%) |
Occupancy by Educational Attainment in Washita County
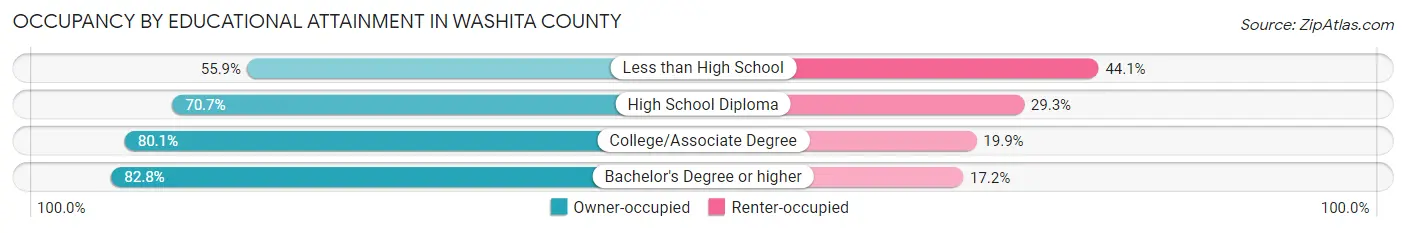
| Household Size | Owner-occupied | Renter-occupied |
| Less than High School | 217 (55.9%) | 171 (44.1%) |
| High School Diploma | 1,050 (70.7%) | 435 (29.3%) |
| College/Associate Degree | 992 (80.1%) | 246 (19.9%) |
| Bachelor's Degree or higher | 774 (82.8%) | 161 (17.2%) |
Occupancy by Age of Householder in Washita County
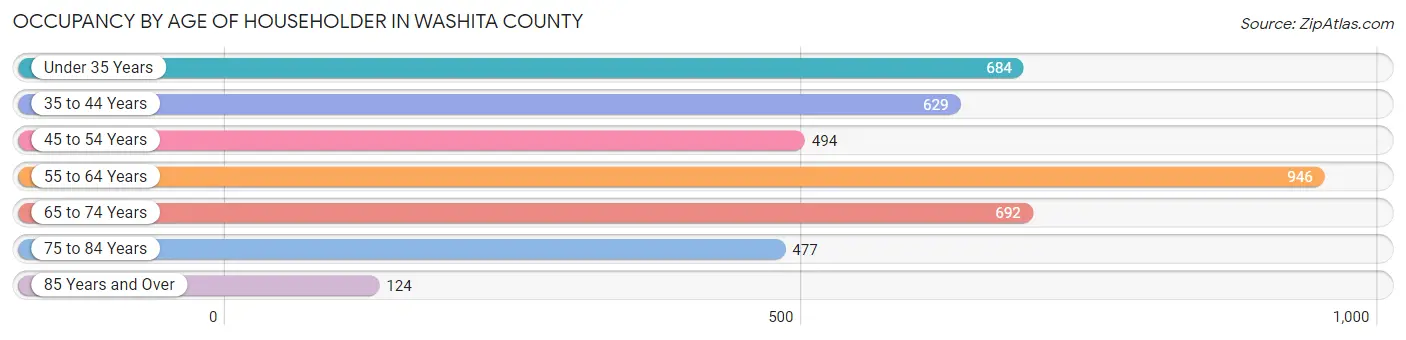
| Age Bracket | # Households | % Households |
| Under 35 Years | 684 | 16.9% |
| 35 to 44 Years | 629 | 15.5% |
| 45 to 54 Years | 494 | 12.2% |
| 55 to 64 Years | 946 | 23.4% |
| 65 to 74 Years | 692 | 17.1% |
| 75 to 84 Years | 477 | 11.8% |
| 85 Years and Over | 124 | 3.1% |
| Total | 4,046 | 100.0% |
Housing Finances in Washita County
Median Income by Occupancy in Washita County
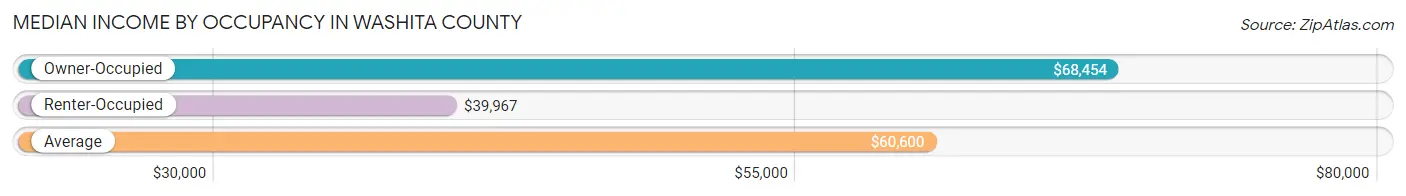
| Occupancy Type | # Households | Median Income |
| Owner-Occupied | 3,033 (75.0%) | $68,454 |
| Renter-Occupied | 1,013 (25.0%) | $39,967 |
| Average | 4,046 (100.0%) | $60,600 |
Occupancy by Householder Income Bracket in Washita County
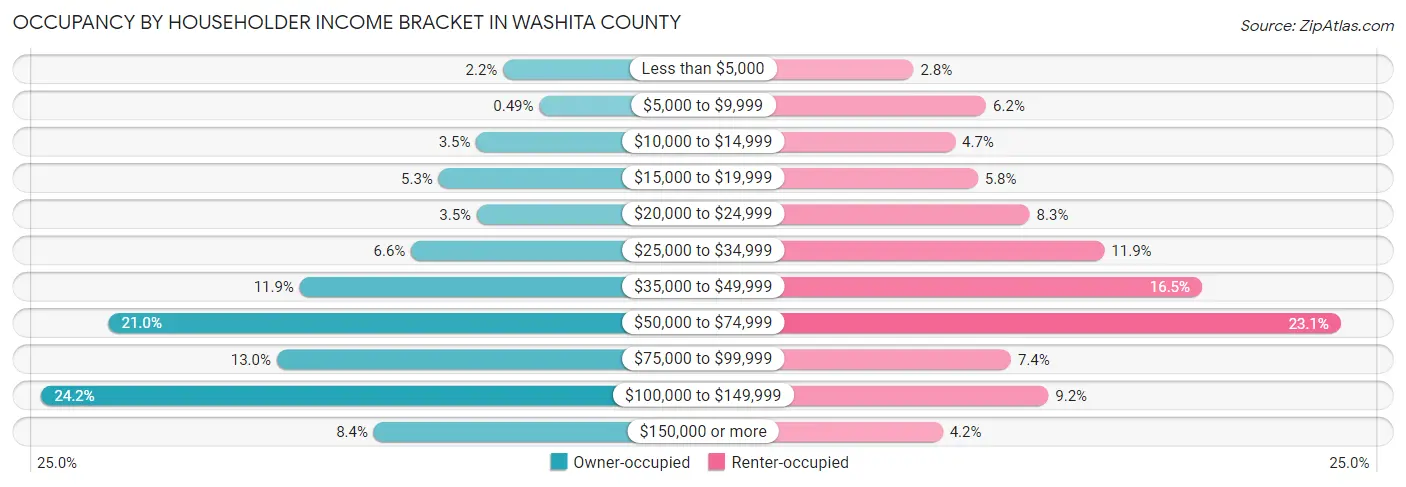
| Income Bracket | Owner-occupied | Renter-occupied |
| Less than $5,000 | 67 (2.2%) | 28 (2.8%) |
| $5,000 to $9,999 | 15 (0.5%) | 63 (6.2%) |
| $10,000 to $14,999 | 106 (3.5%) | 48 (4.7%) |
| $15,000 to $19,999 | 160 (5.3%) | 59 (5.8%) |
| $20,000 to $24,999 | 105 (3.5%) | 84 (8.3%) |
| $25,000 to $34,999 | 200 (6.6%) | 120 (11.8%) |
| $35,000 to $49,999 | 361 (11.9%) | 167 (16.5%) |
| $50,000 to $74,999 | 637 (21.0%) | 234 (23.1%) |
| $75,000 to $99,999 | 394 (13.0%) | 75 (7.4%) |
| $100,000 to $149,999 | 734 (24.2%) | 93 (9.2%) |
| $150,000 or more | 254 (8.4%) | 42 (4.2%) |
| Total | 3,033 (100.0%) | 1,013 (100.0%) |
Monthly Housing Cost Tiers in Washita County
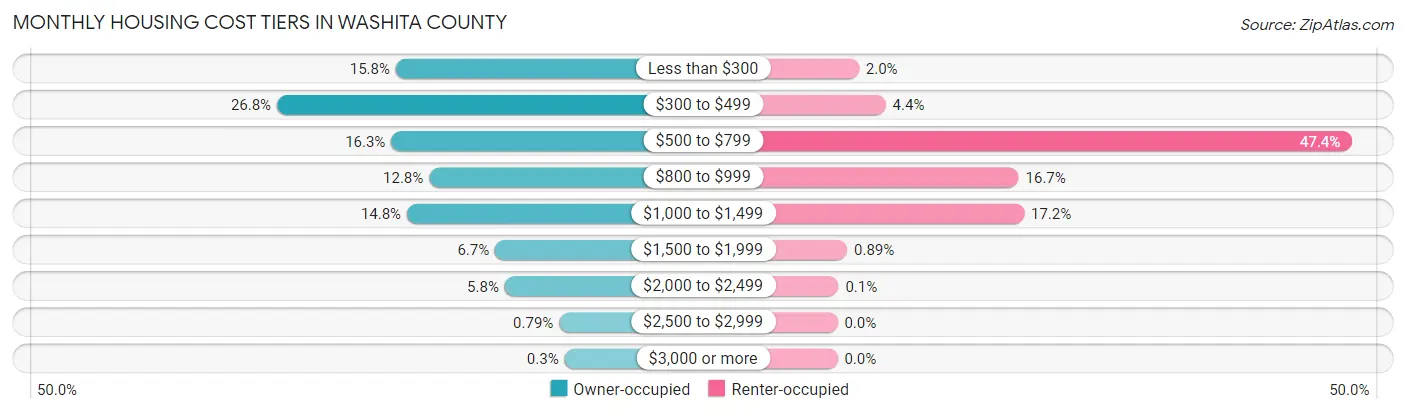
| Monthly Cost | Owner-occupied | Renter-occupied |
| Less than $300 | 480 (15.8%) | 20 (2.0%) |
| $300 to $499 | 812 (26.8%) | 45 (4.4%) |
| $500 to $799 | 493 (16.3%) | 480 (47.4%) |
| $800 to $999 | 387 (12.8%) | 169 (16.7%) |
| $1,000 to $1,499 | 449 (14.8%) | 174 (17.2%) |
| $1,500 to $1,999 | 203 (6.7%) | 9 (0.9%) |
| $2,000 to $2,499 | 176 (5.8%) | 1 (0.1%) |
| $2,500 to $2,999 | 24 (0.8%) | 0 (0.0%) |
| $3,000 or more | 9 (0.3%) | 0 (0.0%) |
| Total | 3,033 (100.0%) | 1,013 (100.0%) |
Physical Housing Characteristics in Washita County
Housing Structures in Washita County
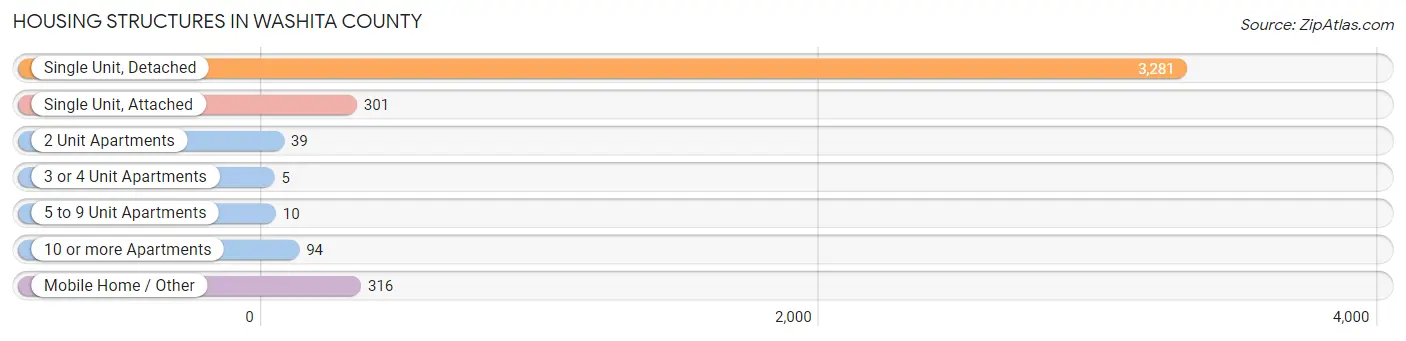
| Structure Type | # Housing Units | % Housing Units |
| Single Unit, Detached | 3,281 | 81.1% |
| Single Unit, Attached | 301 | 7.4% |
| 2 Unit Apartments | 39 | 1.0% |
| 3 or 4 Unit Apartments | 5 | 0.1% |
| 5 to 9 Unit Apartments | 10 | 0.3% |
| 10 or more Apartments | 94 | 2.3% |
| Mobile Home / Other | 316 | 7.8% |
| Total | 4,046 | 100.0% |
Housing Structures by Occupancy in Washita County
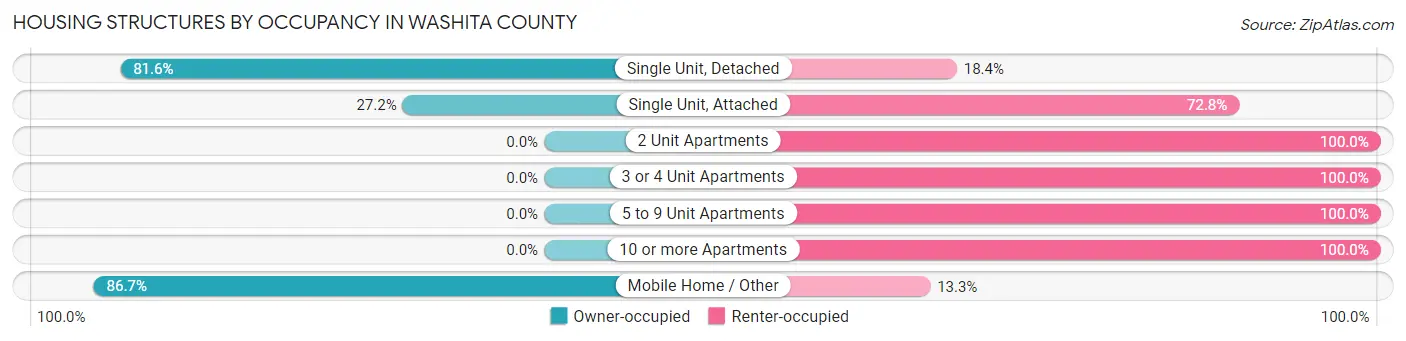
| Structure Type | Owner-occupied | Renter-occupied |
| Single Unit, Detached | 2,677 (81.6%) | 604 (18.4%) |
| Single Unit, Attached | 82 (27.2%) | 219 (72.8%) |
| 2 Unit Apartments | 0 (0.0%) | 39 (100.0%) |
| 3 or 4 Unit Apartments | 0 (0.0%) | 5 (100.0%) |
| 5 to 9 Unit Apartments | 0 (0.0%) | 10 (100.0%) |
| 10 or more Apartments | 0 (0.0%) | 94 (100.0%) |
| Mobile Home / Other | 274 (86.7%) | 42 (13.3%) |
| Total | 3,033 (75.0%) | 1,013 (25.0%) |
Housing Structures by Number of Rooms in Washita County
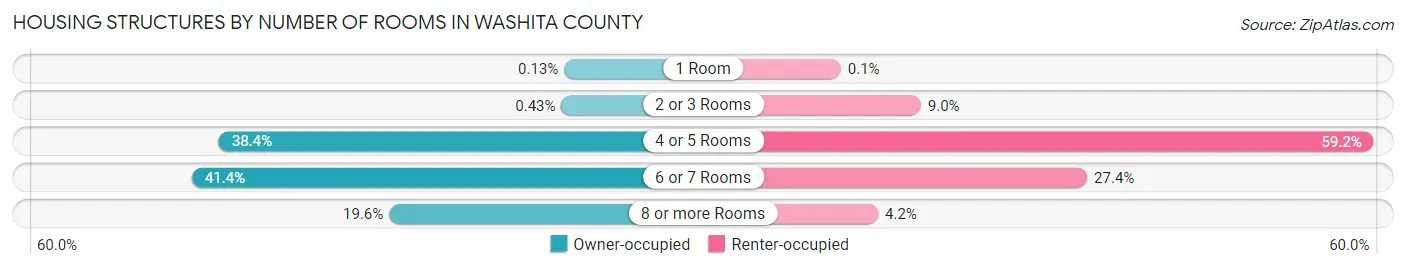
| Number of Rooms | Owner-occupied | Renter-occupied |
| 1 Room | 4 (0.1%) | 1 (0.1%) |
| 2 or 3 Rooms | 13 (0.4%) | 91 (9.0%) |
| 4 or 5 Rooms | 1,166 (38.4%) | 600 (59.2%) |
| 6 or 7 Rooms | 1,257 (41.4%) | 278 (27.4%) |
| 8 or more Rooms | 593 (19.6%) | 43 (4.2%) |
| Total | 3,033 (100.0%) | 1,013 (100.0%) |
Housing Structure by Heating Type in Washita County
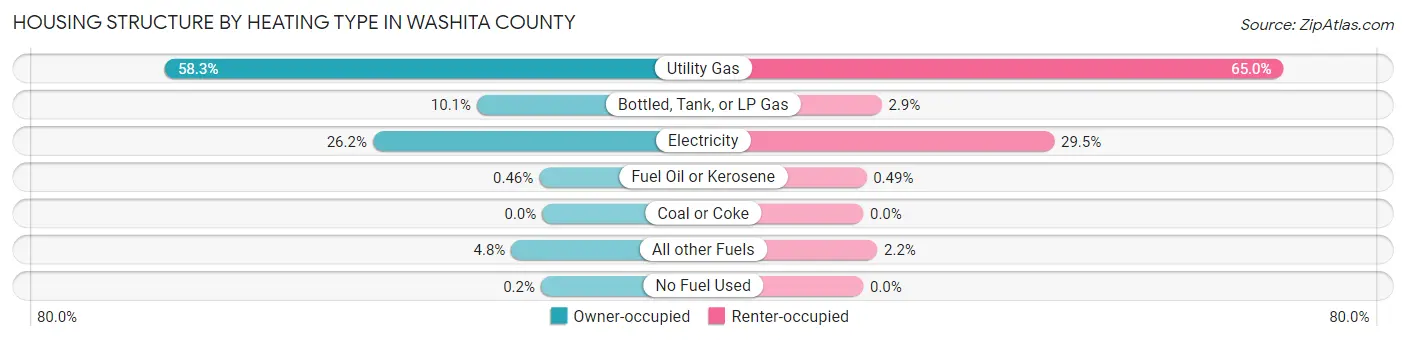
| Heating Type | Owner-occupied | Renter-occupied |
| Utility Gas | 1,768 (58.3%) | 658 (65.0%) |
| Bottled, Tank, or LP Gas | 306 (10.1%) | 29 (2.9%) |
| Electricity | 794 (26.2%) | 299 (29.5%) |
| Fuel Oil or Kerosene | 14 (0.5%) | 5 (0.5%) |
| Coal or Coke | 0 (0.0%) | 0 (0.0%) |
| All other Fuels | 145 (4.8%) | 22 (2.2%) |
| No Fuel Used | 6 (0.2%) | 0 (0.0%) |
| Total | 3,033 (100.0%) | 1,013 (100.0%) |
Household Vehicle Usage in Washita County
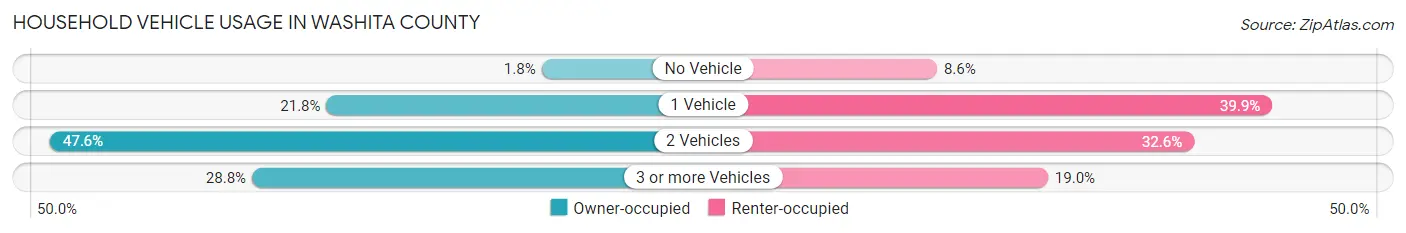
| Vehicles per Household | Owner-occupied | Renter-occupied |
| No Vehicle | 53 (1.8%) | 87 (8.6%) |
| 1 Vehicle | 662 (21.8%) | 404 (39.9%) |
| 2 Vehicles | 1,445 (47.6%) | 330 (32.6%) |
| 3 or more Vehicles | 873 (28.8%) | 192 (19.0%) |
| Total | 3,033 (100.0%) | 1,013 (100.0%) |
Real Estate & Mortgages in Washita County
Real Estate and Mortgage Overview in Washita County
| Characteristic | Without Mortgage | With Mortgage |
| Housing Units | 1,817 | 1,216 |
| Median Property Value | $97,800 | $112,500 |
| Median Household Income | $57,620 | $132 |
| Monthly Housing Costs | $386 | $9 |
| Real Estate Taxes | $459 | $40 |
Property Value by Mortgage Status in Washita County
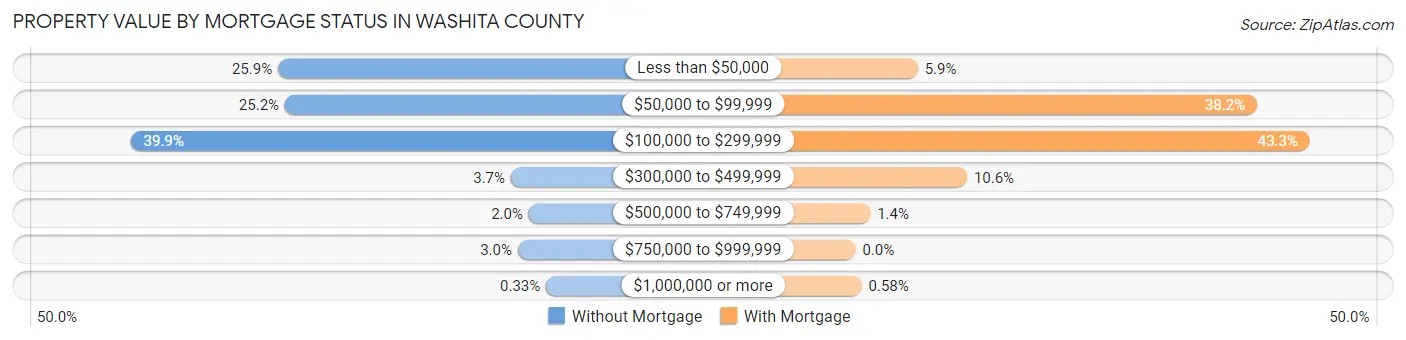
| Property Value | Without Mortgage | With Mortgage |
| Less than $50,000 | 470 (25.9%) | 72 (5.9%) |
| $50,000 to $99,999 | 458 (25.2%) | 465 (38.2%) |
| $100,000 to $299,999 | 725 (39.9%) | 526 (43.3%) |
| $300,000 to $499,999 | 67 (3.7%) | 129 (10.6%) |
| $500,000 to $749,999 | 36 (2.0%) | 17 (1.4%) |
| $750,000 to $999,999 | 55 (3.0%) | 0 (0.0%) |
| $1,000,000 or more | 6 (0.3%) | 7 (0.6%) |
| Total | 1,817 (100.0%) | 1,216 (100.0%) |
Household Income by Mortgage Status in Washita County
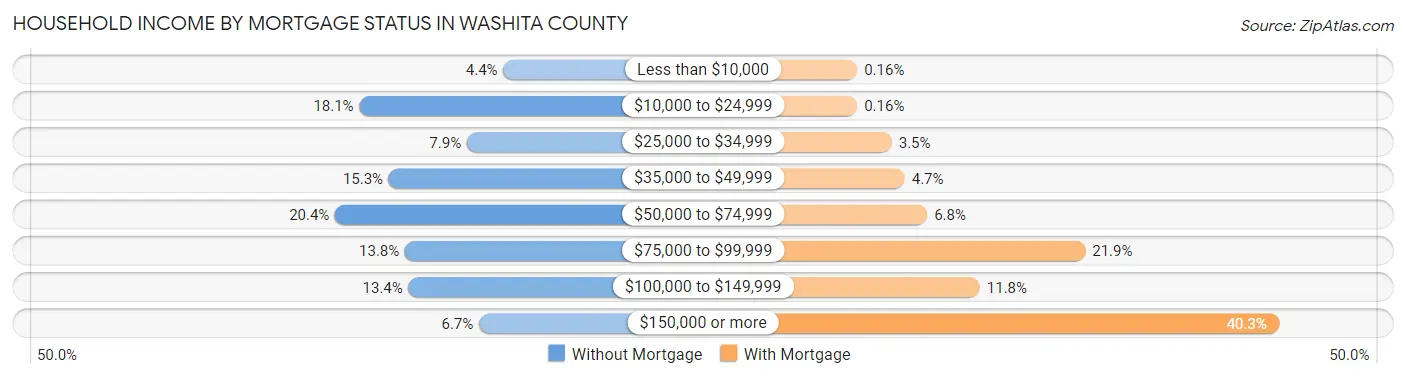
| Household Income | Without Mortgage | With Mortgage |
| Less than $10,000 | 80 (4.4%) | 2 (0.2%) |
| $10,000 to $24,999 | 329 (18.1%) | 2 (0.2%) |
| $25,000 to $34,999 | 143 (7.9%) | 42 (3.5%) |
| $35,000 to $49,999 | 278 (15.3%) | 57 (4.7%) |
| $50,000 to $74,999 | 371 (20.4%) | 83 (6.8%) |
| $75,000 to $99,999 | 250 (13.8%) | 266 (21.9%) |
| $100,000 to $149,999 | 244 (13.4%) | 144 (11.8%) |
| $150,000 or more | 122 (6.7%) | 490 (40.3%) |
| Total | 1,817 (100.0%) | 1,216 (100.0%) |
Property Value to Household Income Ratio in Washita County
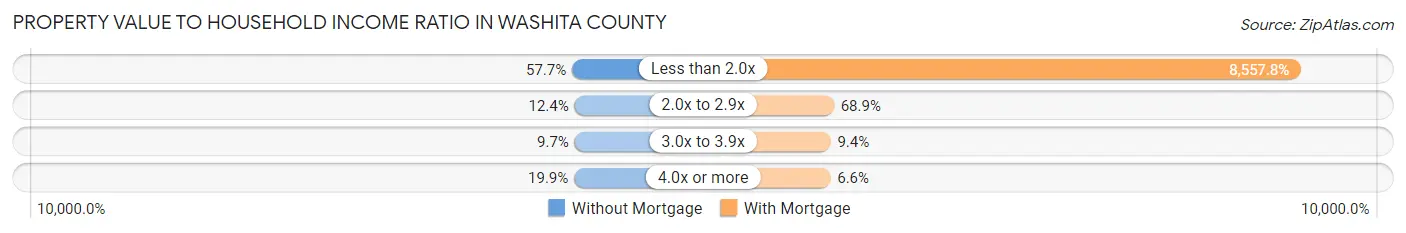
| Value-to-Income Ratio | Without Mortgage | With Mortgage |
| Less than 2.0x | 1,049 (57.7%) | 104,063 (8,557.8%) |
| 2.0x to 2.9x | 226 (12.4%) | 838 (68.9%) |
| 3.0x to 3.9x | 177 (9.7%) | 114 (9.4%) |
| 4.0x or more | 361 (19.9%) | 80 (6.6%) |
| Total | 1,817 (100.0%) | 1,216 (100.0%) |
Real Estate Taxes by Mortgage Status in Washita County
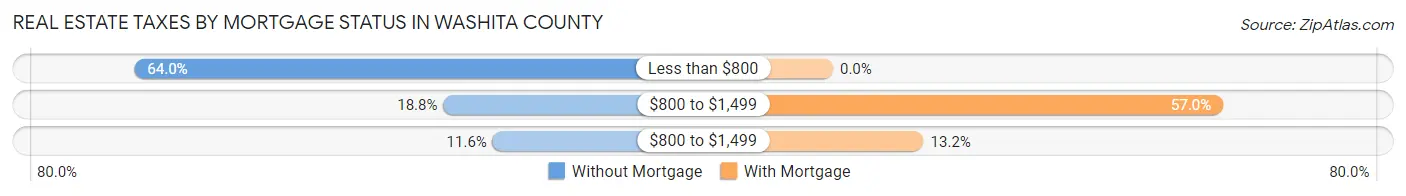
| Property Taxes | Without Mortgage | With Mortgage |
| Less than $800 | 1,162 (63.9%) | 0 (0.0%) |
| $800 to $1,499 | 342 (18.8%) | 693 (57.0%) |
| $800 to $1,499 | 211 (11.6%) | 161 (13.2%) |
| Total | 1,817 (100.0%) | 1,216 (100.0%) |
Health & Disability in Washita County
Health Insurance Coverage by Age in Washita County
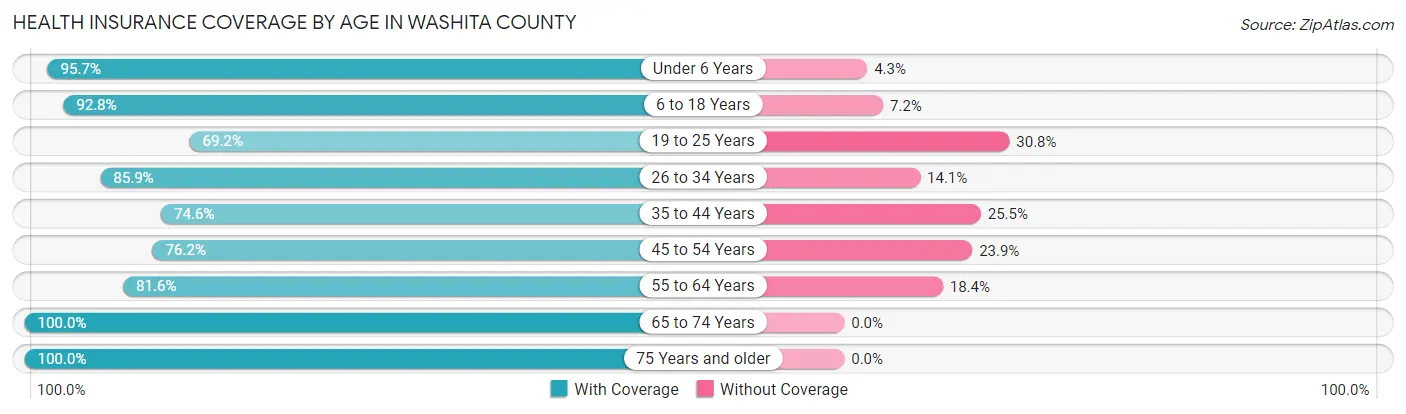
| Age Bracket | With Coverage | Without Coverage |
| Under 6 Years | 850 (95.7%) | 38 (4.3%) |
| 6 to 18 Years | 1,806 (92.8%) | 141 (7.2%) |
| 19 to 25 Years | 488 (69.2%) | 217 (30.8%) |
| 26 to 34 Years | 941 (85.9%) | 155 (14.1%) |
| 35 to 44 Years | 987 (74.6%) | 337 (25.5%) |
| 45 to 54 Years | 897 (76.1%) | 281 (23.8%) |
| 55 to 64 Years | 1,315 (81.6%) | 296 (18.4%) |
| 65 to 74 Years | 1,100 (100.0%) | 0 (0.0%) |
| 75 Years and older | 809 (100.0%) | 0 (0.0%) |
| Total | 9,193 (86.3%) | 1,465 (13.8%) |
Health Insurance Coverage by Citizenship Status in Washita County
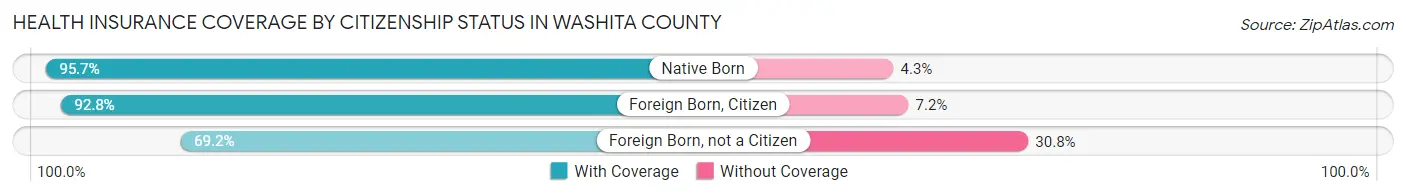
| Citizenship Status | With Coverage | Without Coverage |
| Native Born | 850 (95.7%) | 38 (4.3%) |
| Foreign Born, Citizen | 1,806 (92.8%) | 141 (7.2%) |
| Foreign Born, not a Citizen | 488 (69.2%) | 217 (30.8%) |
Health Insurance Coverage by Household Income in Washita County
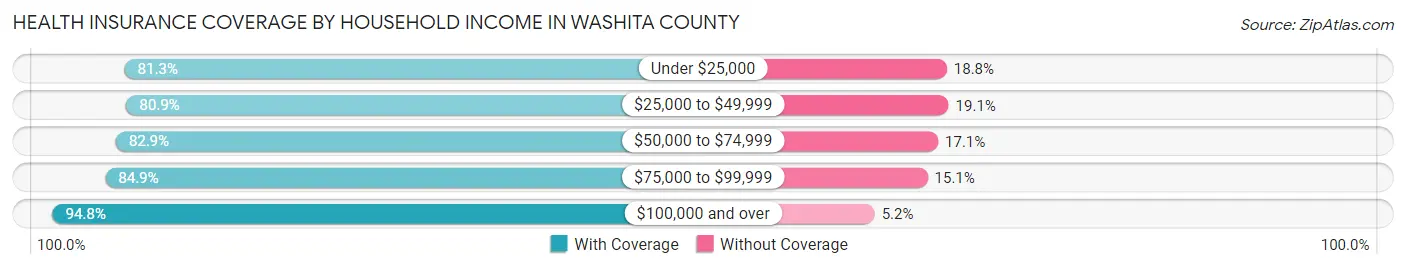
| Household Income | With Coverage | Without Coverage |
| Under $25,000 | 1,027 (81.2%) | 237 (18.8%) |
| $25,000 to $49,999 | 1,658 (80.9%) | 391 (19.1%) |
| $50,000 to $74,999 | 2,190 (82.9%) | 452 (17.1%) |
| $75,000 to $99,999 | 1,188 (84.9%) | 212 (15.1%) |
| $100,000 and over | 3,130 (94.8%) | 173 (5.2%) |
Public vs Private Health Insurance Coverage by Age in Washita County
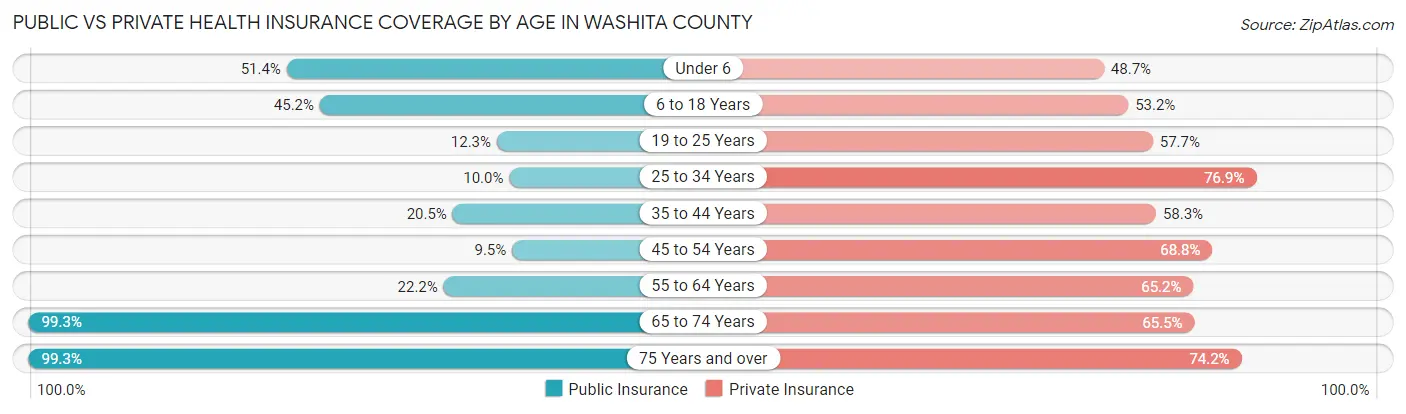
| Age Bracket | Public Insurance | Private Insurance |
| Under 6 | 456 (51.3%) | 432 (48.6%) |
| 6 to 18 Years | 880 (45.2%) | 1,035 (53.2%) |
| 19 to 25 Years | 87 (12.3%) | 407 (57.7%) |
| 25 to 34 Years | 110 (10.0%) | 843 (76.9%) |
| 35 to 44 Years | 272 (20.5%) | 772 (58.3%) |
| 45 to 54 Years | 112 (9.5%) | 810 (68.8%) |
| 55 to 64 Years | 358 (22.2%) | 1,051 (65.2%) |
| 65 to 74 Years | 1,092 (99.3%) | 720 (65.4%) |
| 75 Years and over | 803 (99.3%) | 600 (74.2%) |
| Total | 4,170 (39.1%) | 6,670 (62.6%) |
Disability Status by Sex by Age in Washita County
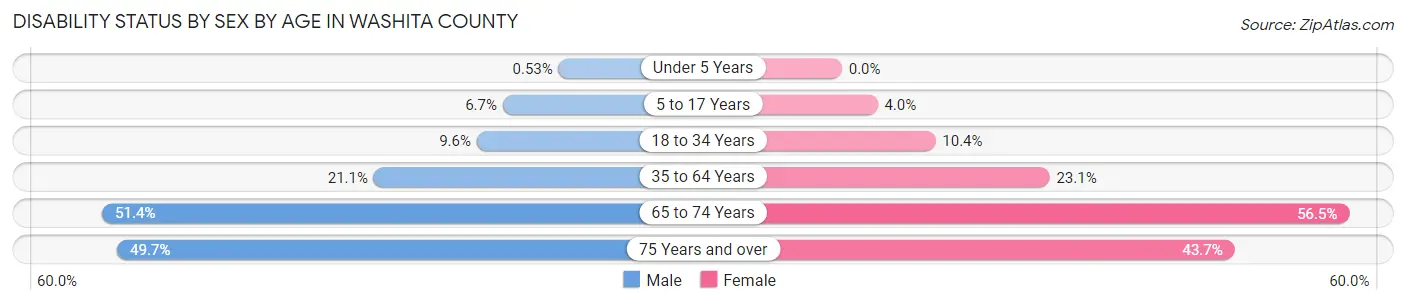
| Age Bracket | Male | Female |
| Under 5 Years | 2 (0.5%) | 0 (0.0%) |
| 5 to 17 Years | 66 (6.7%) | 40 (4.0%) |
| 18 to 34 Years | 96 (9.6%) | 104 (10.4%) |
| 35 to 64 Years | 444 (21.1%) | 465 (23.1%) |
| 65 to 74 Years | 265 (51.4%) | 330 (56.5%) |
| 75 Years and over | 160 (49.7%) | 213 (43.7%) |
Disability Class by Sex by Age in Washita County
Disability Class: Hearing Difficulty
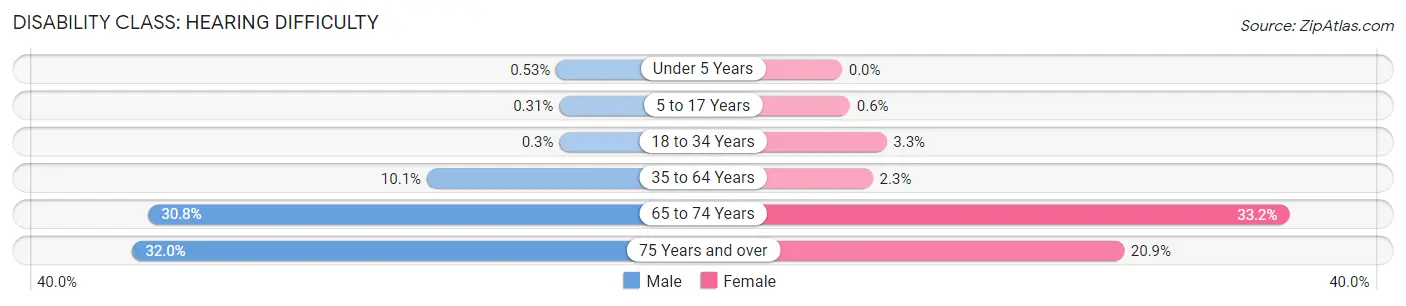
| Age Bracket | Male | Female |
| Under 5 Years | 2 (0.5%) | 0 (0.0%) |
| 5 to 17 Years | 3 (0.3%) | 6 (0.6%) |
| 18 to 34 Years | 3 (0.3%) | 33 (3.3%) |
| 35 to 64 Years | 213 (10.1%) | 46 (2.3%) |
| 65 to 74 Years | 159 (30.8%) | 194 (33.2%) |
| 75 Years and over | 103 (32.0%) | 102 (20.9%) |
Disability Class: Vision Difficulty
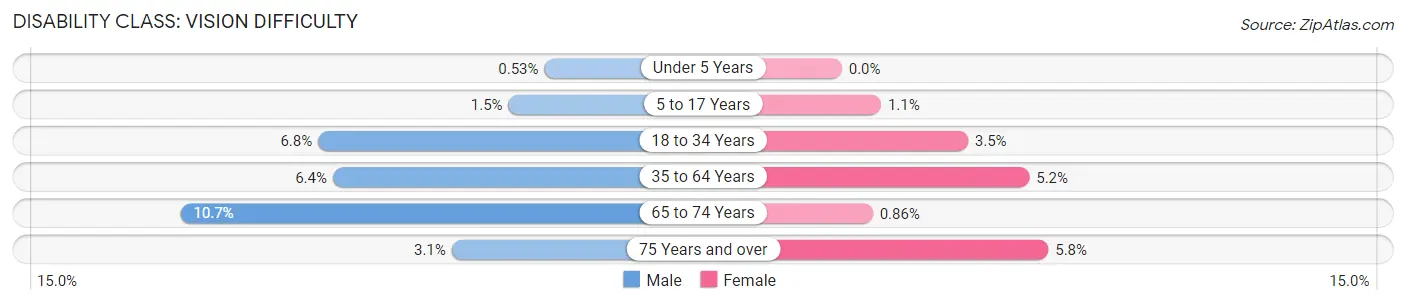
| Age Bracket | Male | Female |
| Under 5 Years | 2 (0.5%) | 0 (0.0%) |
| 5 to 17 Years | 15 (1.5%) | 11 (1.1%) |
| 18 to 34 Years | 68 (6.8%) | 35 (3.5%) |
| 35 to 64 Years | 135 (6.4%) | 105 (5.2%) |
| 65 to 74 Years | 55 (10.7%) | 5 (0.9%) |
| 75 Years and over | 10 (3.1%) | 28 (5.8%) |
Disability Class: Cognitive Difficulty
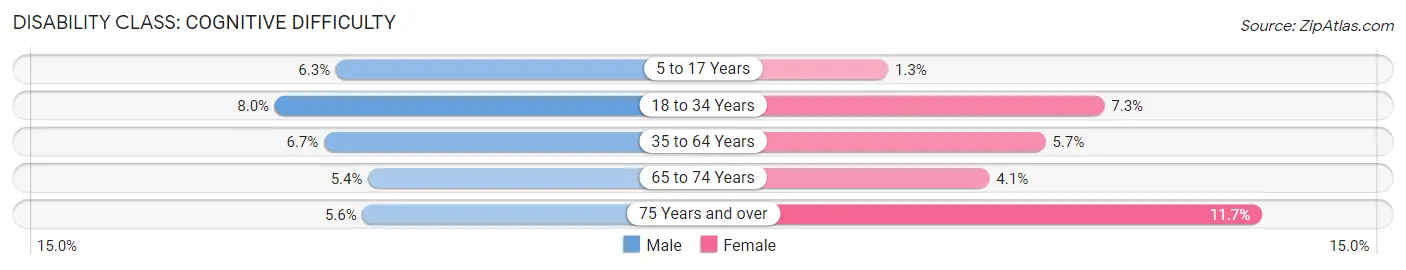
| Age Bracket | Male | Female |
| 5 to 17 Years | 62 (6.3%) | 13 (1.3%) |
| 18 to 34 Years | 80 (8.0%) | 73 (7.3%) |
| 35 to 64 Years | 140 (6.7%) | 114 (5.7%) |
| 65 to 74 Years | 28 (5.4%) | 24 (4.1%) |
| 75 Years and over | 18 (5.6%) | 57 (11.7%) |
Disability Class: Ambulatory Difficulty
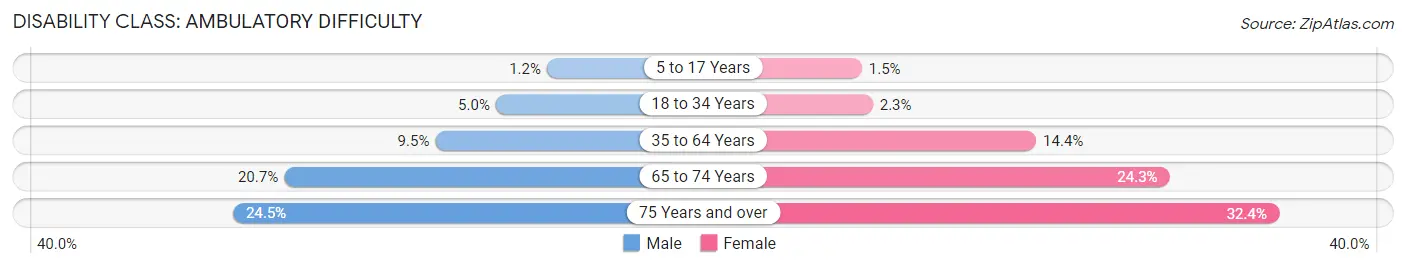
| Age Bracket | Male | Female |
| 5 to 17 Years | 12 (1.2%) | 15 (1.5%) |
| 18 to 34 Years | 50 (5.0%) | 23 (2.3%) |
| 35 to 64 Years | 200 (9.5%) | 290 (14.4%) |
| 65 to 74 Years | 107 (20.7%) | 142 (24.3%) |
| 75 Years and over | 79 (24.5%) | 158 (32.4%) |
Disability Class: Self-Care Difficulty
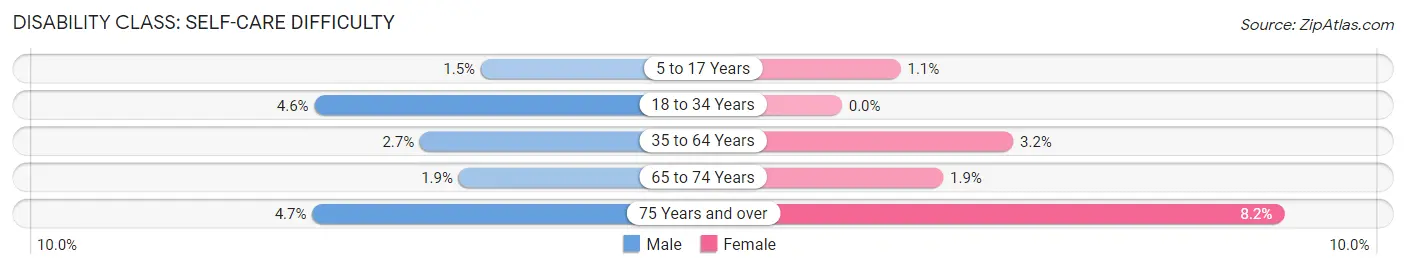
| Age Bracket | Male | Female |
| 5 to 17 Years | 15 (1.5%) | 11 (1.1%) |
| 18 to 34 Years | 46 (4.6%) | 0 (0.0%) |
| 35 to 64 Years | 56 (2.7%) | 64 (3.2%) |
| 65 to 74 Years | 10 (1.9%) | 11 (1.9%) |
| 75 Years and over | 15 (4.7%) | 40 (8.2%) |
Technology Access in Washita County
Computing Device Access in Washita County
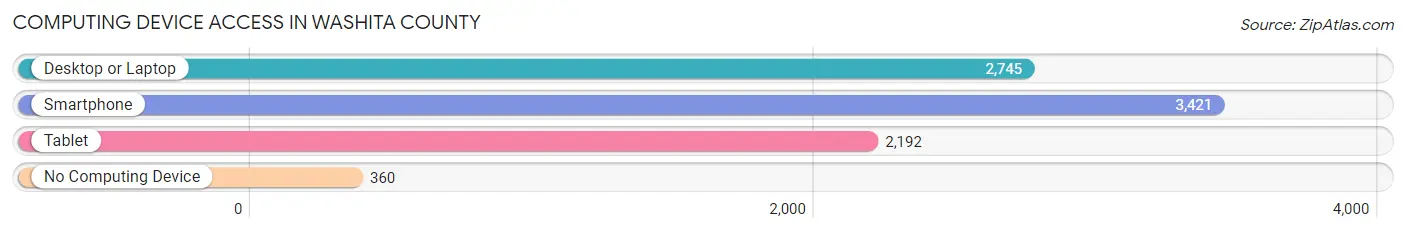
| Device Type | # Households | % Households |
| Desktop or Laptop | 2,745 | 67.8% |
| Smartphone | 3,421 | 84.6% |
| Tablet | 2,192 | 54.2% |
| No Computing Device | 360 | 8.9% |
| Total | 4,046 | 100.0% |
Internet Access in Washita County
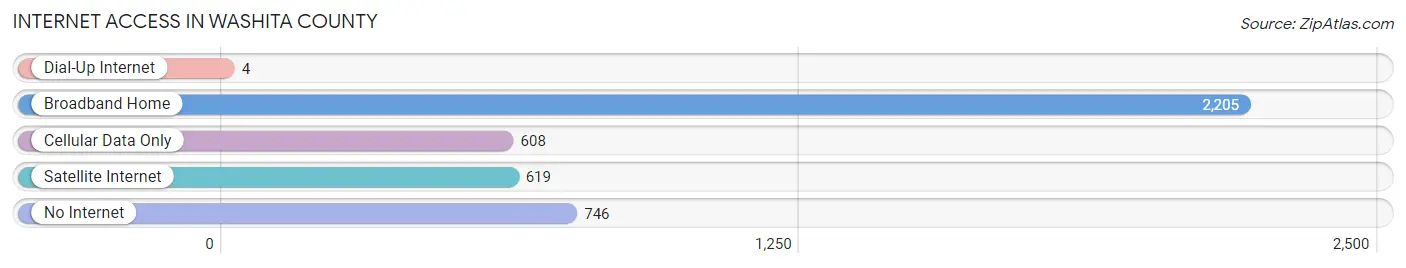
| Internet Type | # Households | % Households |
| Dial-Up Internet | 4 | 0.1% |
| Broadband Home | 2,205 | 54.5% |
| Cellular Data Only | 608 | 15.0% |
| Satellite Internet | 619 | 15.3% |
| No Internet | 746 | 18.4% |
| Total | 4,046 | 100.0% |
Washita County Summary
Washita County is located in the southwestern part of Oklahoma, and is bordered by Custer County to the north, Caddo County to the east, Kiowa County to the south, and Beckham County to the west. The county seat is Cordell, and the largest city is Burns Flat. The county was created in 1907 from part of Custer County, and was named for the Washita River, which flows through the county.
Geography
Washita County covers an area of 1,072 square miles, and is mostly flat, with some rolling hills in the western part of the county. The Washita River flows through the county, and there are several small lakes and reservoirs, including Lake Washita, Lake Cordell, and Lake Washita State Park. The county is mostly rural, with some small towns and villages scattered throughout. The county is part of the Anadarko Basin, and is located in the Red Bed Plains physiographic region.
Demographics
As of the 2010 census, there were 11,629 people, 4,541 households, and 3,097 families living in the county. The population density was 11 people per square mile. The racial makeup of the county was 79.2% White, 1.2% African American, 14.2% Native American, 0.3% Asian, 0.1% Pacific Islander, 0.7% from other races, and 4.3% from two or more races. Hispanic or Latino of any race were 3.2% of the population.
The median income for a household in the county was $31,945, and the median income for a family was $37,917. The per capita income for the county was $15,945. About 17.2% of families and 21.2% of the population were below the poverty line, including 28.2% of those under age 18 and 14.2% of those age 65 or over.
Economy
The economy of Washita County is largely based on agriculture, with wheat, sorghum, and hay being the main crops. Cattle and poultry are also important to the local economy. Oil and gas production is also a major industry in the county, and there are several oil and gas wells in the area. The county is also home to several manufacturing companies, including a plastics plant and a metal fabrication plant.
The county is served by several highways, including Interstate 40, US Highway 183, and State Highway 44. The nearest airport is in Clinton, about 30 miles away. The county is also served by several school districts, including Cordell Public Schools, Burns Flat-Dill City Public Schools, and Sentinel Public Schools.
Washita County is a rural county with a strong agricultural base. The county has a diverse economy, with oil and gas production, manufacturing, and agriculture all playing important roles. The county is served by several highways and school districts, and is home to several small towns and villages.
Common Questions
What is Per Capita Income in Washita County?
Per Capita income in Washita County is $31,421.
What is the Median Family Income in Washita County?
Median Family Income in Washita County is $69,790.
What is the Median Household income in Washita County?
Median Household Income in Washita County is $60,600.
What is Income or Wage Gap in Washita County?
Income or Wage Gap in Washita County is 33.6%.
Women in Washita County earn 66.4 cents for every dollar earned by a man.
What is Family Income Deficit in Washita County?
Family Income Deficit in Washita County is $10,136.
Families that are below poverty line in Washita County earn $10,136 less on average than the poverty threshold level.
What is Inequality or Gini Index in Washita County?
Inequality or Gini Index in Washita County is 0.42.
What is the Total Population of Washita County?
Total Population of Washita County is 10,930.
What is the Total Male Population of Washita County?
Total Male Population of Washita County is 5,460.
What is the Total Female Population of Washita County?
Total Female Population of Washita County is 5,470.
What is the Ratio of Males per 100 Females in Washita County?
There are 99.82 Males per 100 Females in Washita County.
What is the Ratio of Females per 100 Males in Washita County?
There are 100.18 Females per 100 Males in Washita County.
What is the Median Population Age in Washita County?
Median Population Age in Washita County is 40.4 Years.
What is the Average Family Size in Washita County
Average Family Size in Washita County is 3.1 People.
What is the Average Household Size in Washita County
Average Household Size in Washita County is 2.6 People.
How Large is the Labor Force in Washita County?
There are 5,063 People in the Labor Forcein in Washita County.
What is the Percentage of People in the Labor Force in Washita County?
59.4% of People are in the Labor Force in Washita County.
What is the Unemployment Rate in Washita County?
Unemployment Rate in Washita County is 5.8%.