Tillman County, OK Map & Demographics
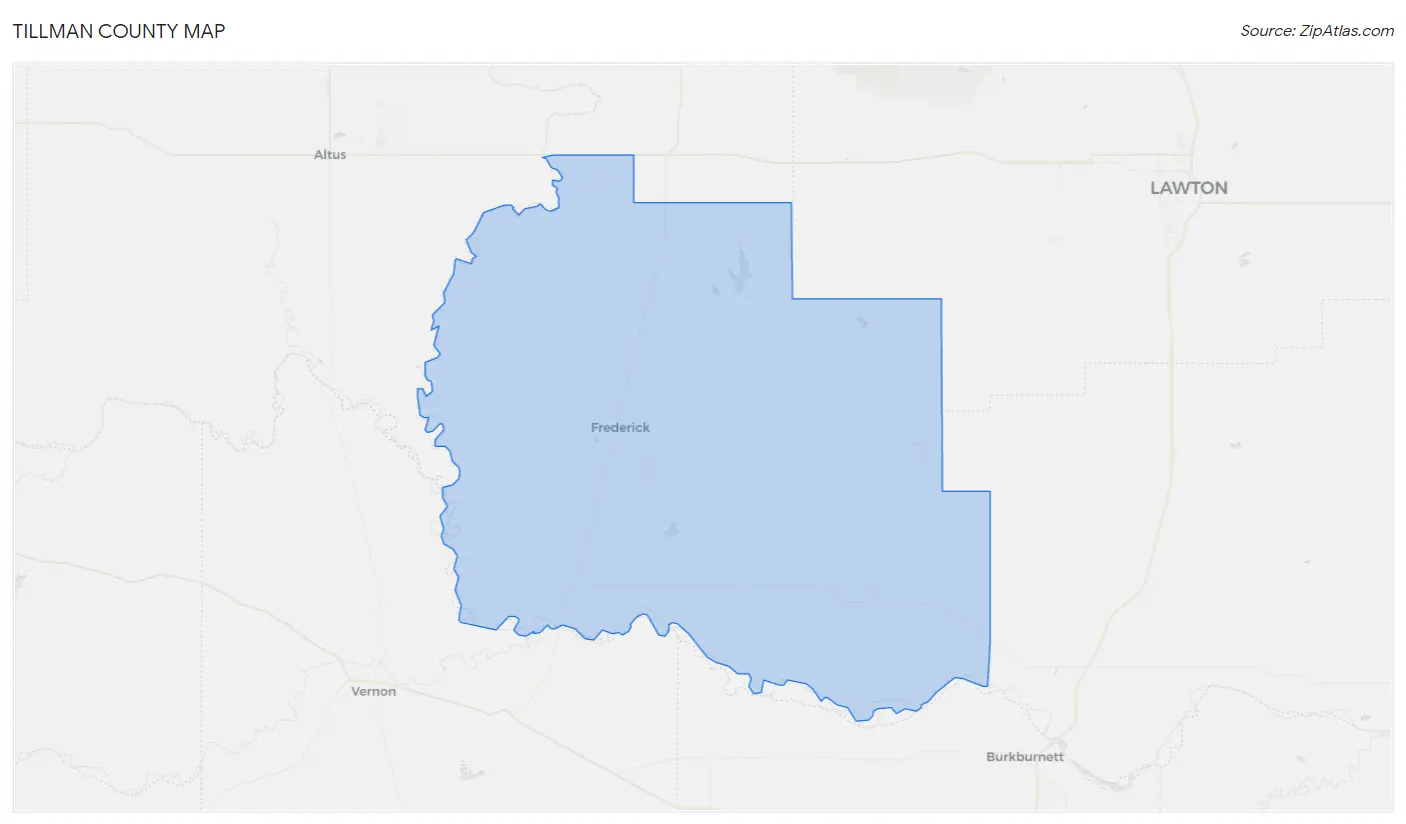
Tillman County Map
Tillman County Overview
$23,729
PER CAPITA INCOME
$57,353
AVG FAMILY INCOME
$46,306
AVG HOUSEHOLD INCOME
16.6%
WAGE / INCOME GAP [ % ]
83.4¢/ $1
WAGE / INCOME GAP [ $ ]
$11,955
FAMILY INCOME DEFICIT
0.43
INEQUALITY / GINI INDEX
7,013
TOTAL POPULATION
3,477
MALE POPULATION
3,536
FEMALE POPULATION
98.33
MALES / 100 FEMALES
101.70
FEMALES / 100 MALES
40.8
MEDIAN AGE
3.4
AVG FAMILY SIZE
2.6
AVG HOUSEHOLD SIZE
2,968
LABOR FORCE [ PEOPLE ]
53.3%
PERCENT IN LABOR FORCE
5.9%
UNEMPLOYMENT RATE
Tillman County Area Codes
Income in Tillman County
Income Overview in Tillman County
Per Capita Income in Tillman County is $23,729, while median incomes of families and households are $57,353 and $46,306 respectively.
| Characteristic | Number | Measure |
| Per Capita Income | 7,013 | $23,729 |
| Median Family Income | 1,616 | $57,353 |
| Mean Family Income | 1,616 | $69,584 |
| Median Household Income | 2,595 | $46,306 |
| Mean Household Income | 2,595 | $59,156 |
| Income Deficit | 1,616 | $11,955 |
| Wage / Income Gap (%) | 7,013 | 16.55% |
| Wage / Income Gap ($) | 7,013 | 83.45¢ per $1 |
| Gini / Inequality Index | 7,013 | 0.43 |
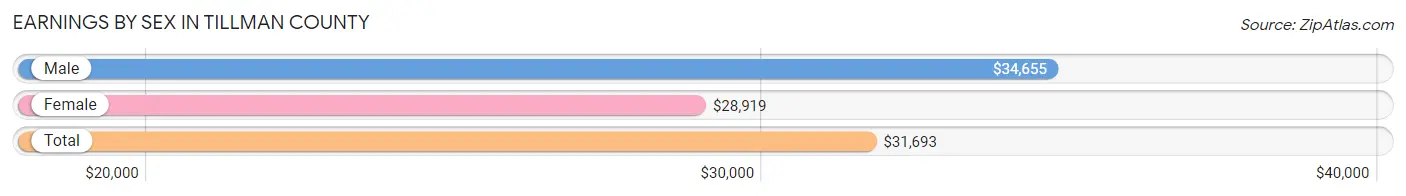
Earnings by Sex in Tillman County
Average Earnings in Tillman County are $31,693, $34,655 for men and $28,919 for women, a difference of 16.6%.
| Sex | Number | Average Earnings |
| Male | 1,724 (53.8%) | $34,655 |
| Female | 1,483 (46.2%) | $28,919 |
| Total | 3,207 (100.0%) | $31,693 |
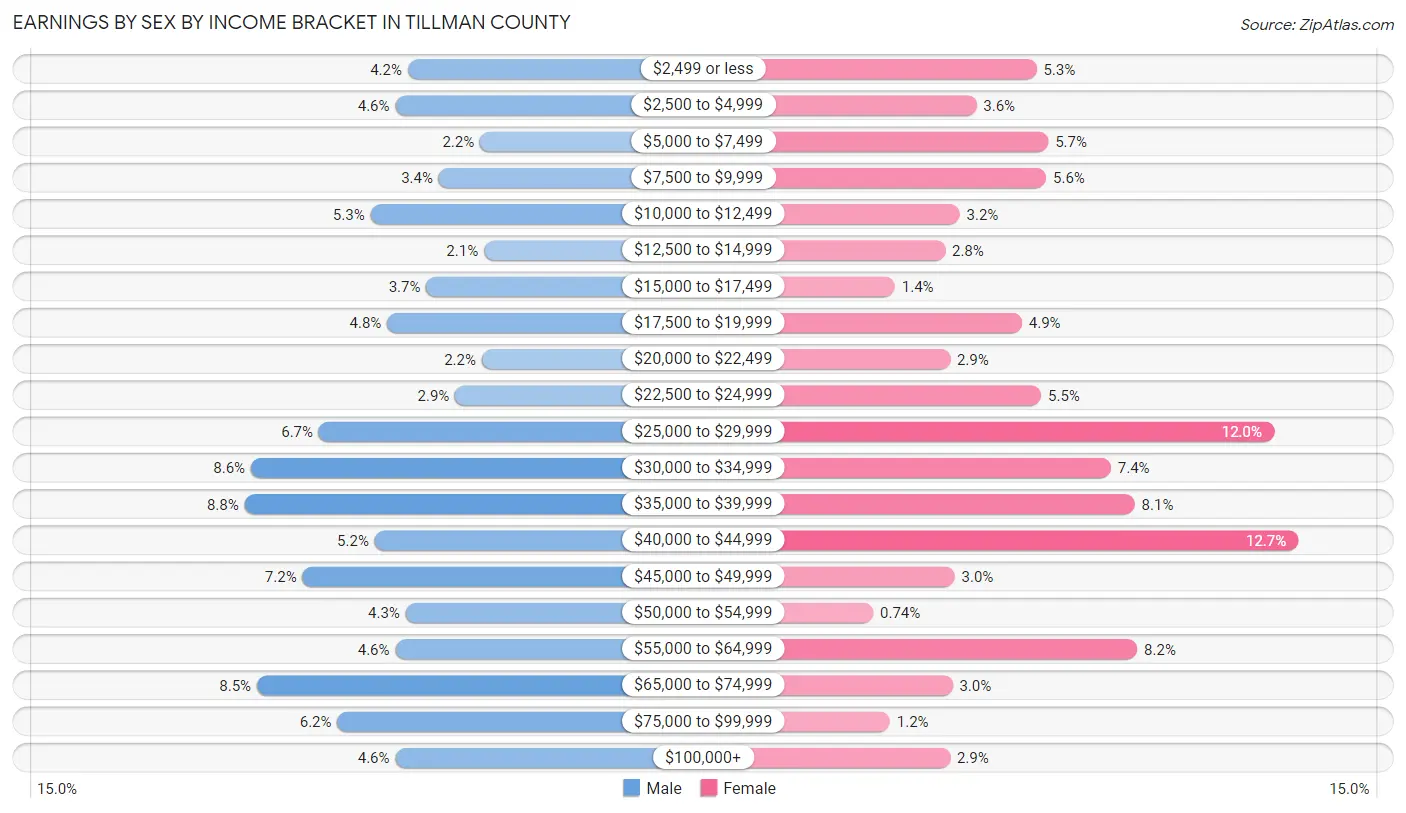
Earnings by Sex by Income Bracket in Tillman County
The most common earnings brackets in Tillman County are $35,000 to $39,999 for men (152 | 8.8%) and $40,000 to $44,999 for women (188 | 12.7%).
| Income | Male | Female |
| $2,499 or less | 73 (4.2%) | 79 (5.3%) |
| $2,500 to $4,999 | 79 (4.6%) | 54 (3.6%) |
| $5,000 to $7,499 | 38 (2.2%) | 84 (5.7%) |
| $7,500 to $9,999 | 58 (3.4%) | 83 (5.6%) |
| $10,000 to $12,499 | 91 (5.3%) | 47 (3.2%) |
| $12,500 to $14,999 | 36 (2.1%) | 41 (2.8%) |
| $15,000 to $17,499 | 64 (3.7%) | 20 (1.3%) |
| $17,500 to $19,999 | 83 (4.8%) | 73 (4.9%) |
| $20,000 to $22,499 | 37 (2.1%) | 43 (2.9%) |
| $22,500 to $24,999 | 50 (2.9%) | 81 (5.5%) |
| $25,000 to $29,999 | 116 (6.7%) | 178 (12.0%) |
| $30,000 to $34,999 | 149 (8.6%) | 110 (7.4%) |
| $35,000 to $39,999 | 152 (8.8%) | 120 (8.1%) |
| $40,000 to $44,999 | 89 (5.2%) | 188 (12.7%) |
| $45,000 to $49,999 | 124 (7.2%) | 45 (3.0%) |
| $50,000 to $54,999 | 74 (4.3%) | 11 (0.7%) |
| $55,000 to $64,999 | 79 (4.6%) | 121 (8.2%) |
| $65,000 to $74,999 | 146 (8.5%) | 44 (3.0%) |
| $75,000 to $99,999 | 107 (6.2%) | 18 (1.2%) |
| $100,000+ | 79 (4.6%) | 43 (2.9%) |
| Total | 1,724 (100.0%) | 1,483 (100.0%) |
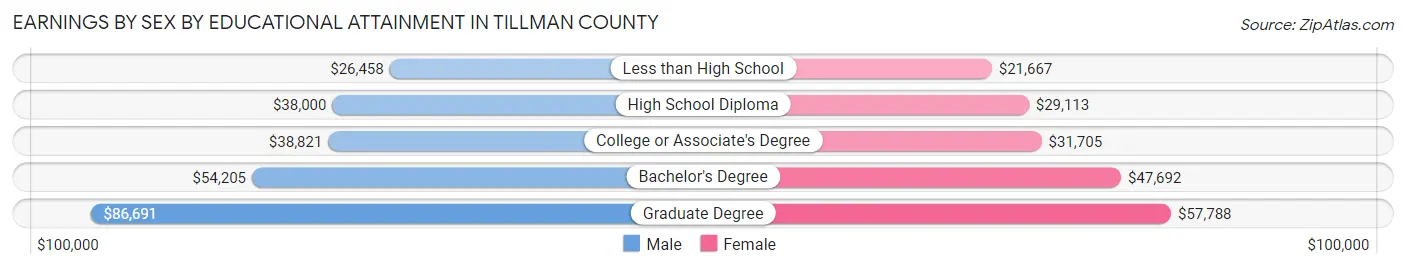
Earnings by Sex by Educational Attainment in Tillman County
Average earnings in Tillman County are $38,329 for men and $32,247 for women, a difference of 15.9%. Men with an educational attainment of graduate degree enjoy the highest average annual earnings of $86,691, while those with less than high school education earn the least with $26,458. Women with an educational attainment of graduate degree earn the most with the average annual earnings of $57,788, while those with less than high school education have the smallest earnings of $21,667.
| Educational Attainment | Male Income | Female Income |
| Less than High School | $26,458 | $21,667 |
| High School Diploma | $38,000 | $29,113 |
| College or Associate's Degree | $38,821 | $31,705 |
| Bachelor's Degree | $54,205 | $47,692 |
| Graduate Degree | $86,691 | $57,788 |
| Total | $38,329 | $32,247 |
Family Income in Tillman County
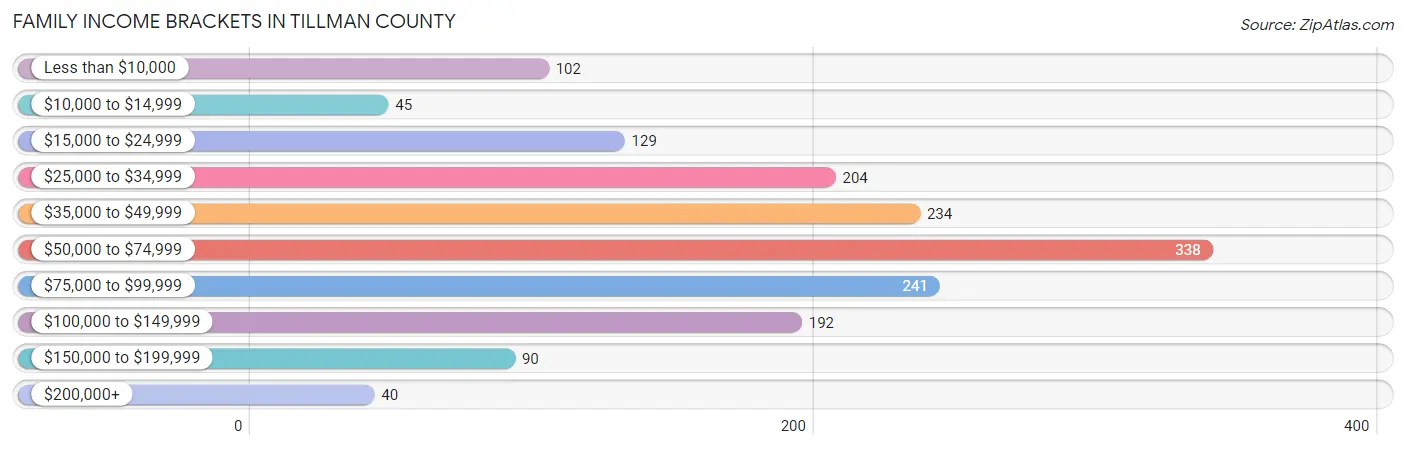
Family Income Brackets in Tillman County
According to the Tillman County family income data, there are 338 families falling into the $50,000 to $74,999 income range, which is the most common income bracket and makes up 20.9% of all families. Conversely, the $200,000+ income bracket is the least frequent group with only 40 families (2.5%) belonging to this category.
| Income Bracket | # Families | % Families |
| Less than $10,000 | 102 | 6.3% |
| $10,000 to $14,999 | 45 | 2.8% |
| $15,000 to $24,999 | 129 | 8.0% |
| $25,000 to $34,999 | 204 | 12.6% |
| $35,000 to $49,999 | 234 | 14.5% |
| $50,000 to $74,999 | 338 | 20.9% |
| $75,000 to $99,999 | 241 | 14.9% |
| $100,000 to $149,999 | 192 | 11.9% |
| $150,000 to $199,999 | 90 | 5.6% |
| $200,000+ | 40 | 2.5% |
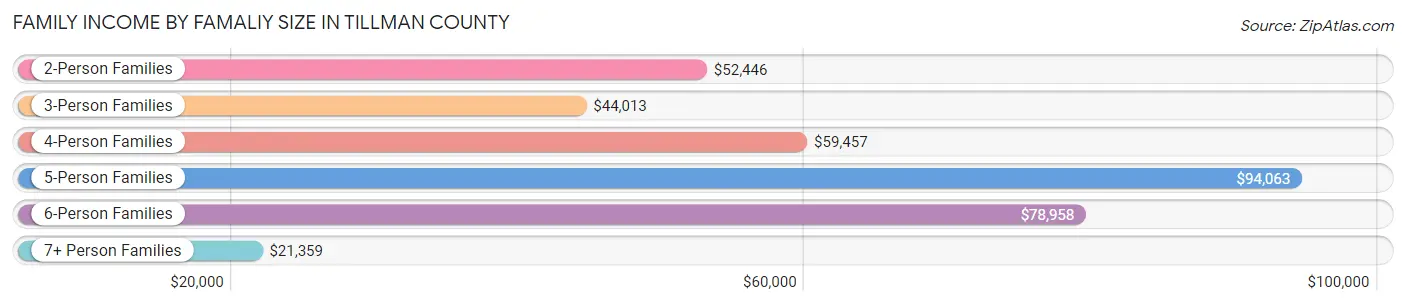
Family Income by Famaliy Size in Tillman County
5-person families (108 | 6.7%) account for the highest median family income in Tillman County with $94,063 per family, while 2-person families (711 | 44.0%) have the highest median income of $26,223 per family member.
| Income Bracket | # Families | Median Income |
| 2-Person Families | 711 (44.0%) | $52,446 |
| 3-Person Families | 369 (22.8%) | $44,013 |
| 4-Person Families | 312 (19.3%) | $59,457 |
| 5-Person Families | 108 (6.7%) | $94,063 |
| 6-Person Families | 67 (4.2%) | $78,958 |
| 7+ Person Families | 49 (3.0%) | $21,359 |
| Total | 1,616 (100.0%) | $57,353 |
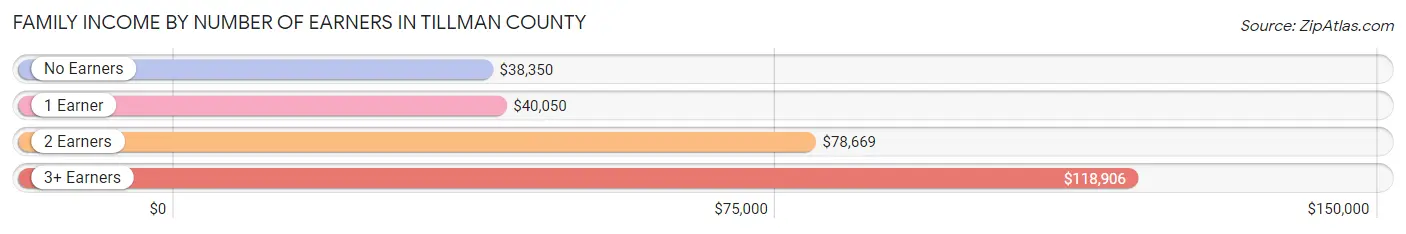
Family Income by Number of Earners in Tillman County
The median family income in Tillman County is $57,353, with families comprising 3+ earners (177) having the highest median family income of $118,906, while families with no earners (317) have the lowest median family income of $38,350, accounting for 11.0% and 19.6% of families, respectively.
| Number of Earners | # Families | Median Income |
| No Earners | 317 (19.6%) | $38,350 |
| 1 Earner | 587 (36.3%) | $40,050 |
| 2 Earners | 535 (33.1%) | $78,669 |
| 3+ Earners | 177 (11.0%) | $118,906 |
| Total | 1,616 (100.0%) | $57,353 |
Household Income in Tillman County
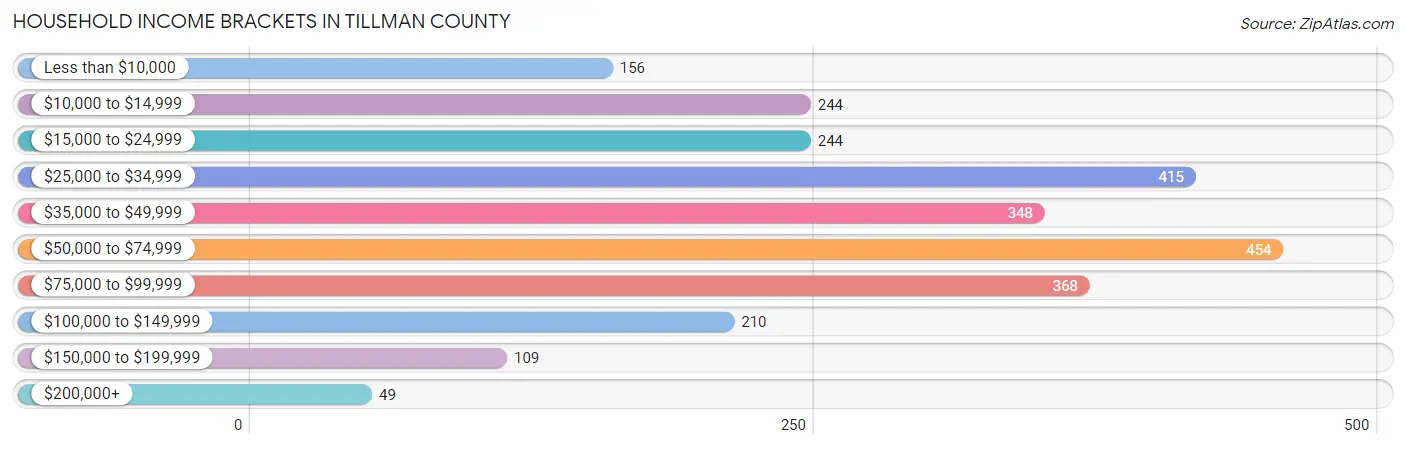
Household Income Brackets in Tillman County
With 454 households falling in the category, the $50,000 to $74,999 income range is the most frequent in Tillman County, accounting for 17.5% of all households. In contrast, only 49 households (1.9%) fall into the $200,000+ income bracket, making it the least populous group.
| Income Bracket | # Households | % Households |
| Less than $10,000 | 156 | 6.0% |
| $10,000 to $14,999 | 244 | 9.4% |
| $15,000 to $24,999 | 244 | 9.4% |
| $25,000 to $34,999 | 415 | 16.0% |
| $35,000 to $49,999 | 348 | 13.4% |
| $50,000 to $74,999 | 454 | 17.5% |
| $75,000 to $99,999 | 368 | 14.2% |
| $100,000 to $149,999 | 210 | 8.1% |
| $150,000 to $199,999 | 109 | 4.2% |
| $200,000+ | 49 | 1.9% |
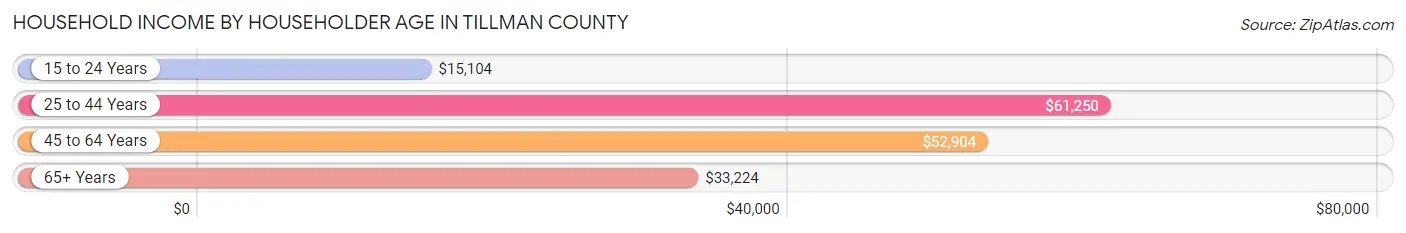
Household Income by Householder Age in Tillman County
The median household income in Tillman County is $46,306, with the highest median household income of $61,250 found in the 25 to 44 years age bracket for the primary householder. A total of 531 households (20.5%) fall into this category. Meanwhile, the 15 to 24 years age bracket for the primary householder has the lowest median household income of $15,104, with 113 households (4.3%) in this group.
| Income Bracket | # Households | Median Income |
| 15 to 24 Years | 113 (4.3%) | $15,104 |
| 25 to 44 Years | 531 (20.5%) | $61,250 |
| 45 to 64 Years | 1,027 (39.6%) | $52,904 |
| 65+ Years | 924 (35.6%) | $33,224 |
| Total | 2,595 (100.0%) | $46,306 |
Poverty in Tillman County
Income Below Poverty by Sex and Age in Tillman County
With 15.7% poverty level for males and 18.1% for females among the residents of Tillman County, under 5 year old males and 5 year old females are the most vulnerable to poverty, with 106 males (45.1%) and 16 females (66.7%) in their respective age groups living below the poverty level.
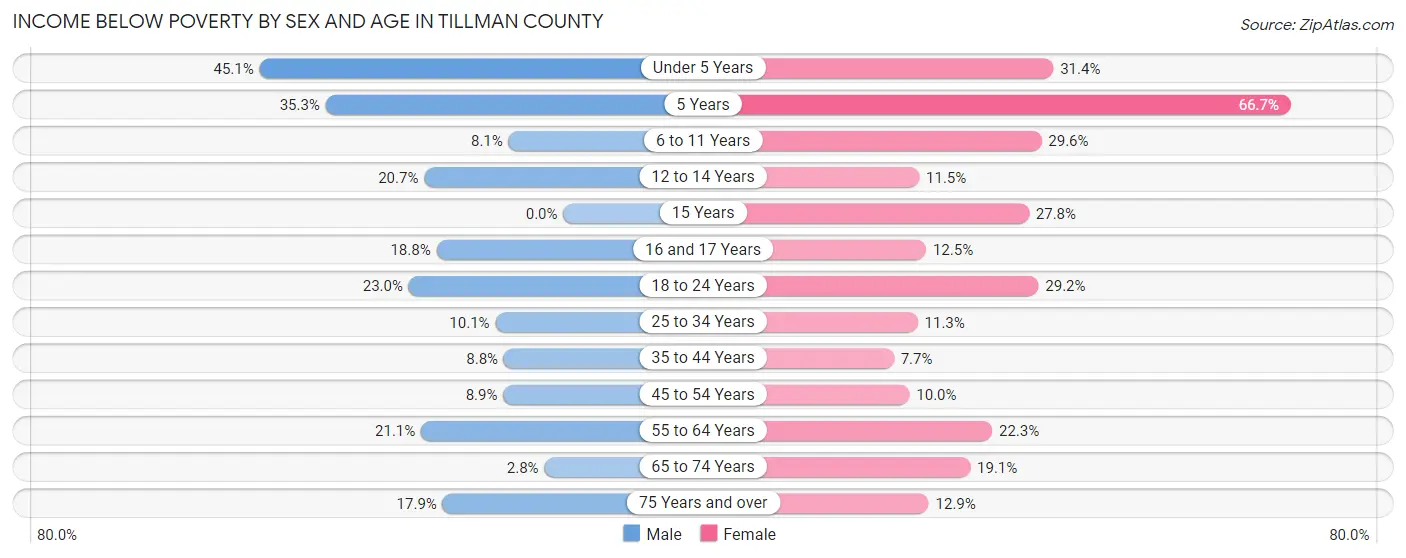
| Age Bracket | Male | Female |
| Under 5 Years | 106 (45.1%) | 54 (31.4%) |
| 5 Years | 24 (35.3%) | 16 (66.7%) |
| 6 to 11 Years | 20 (8.1%) | 80 (29.6%) |
| 12 to 14 Years | 25 (20.7%) | 21 (11.5%) |
| 15 Years | 0 (0.0%) | 20 (27.8%) |
| 16 and 17 Years | 13 (18.8%) | 14 (12.5%) |
| 18 to 24 Years | 67 (23.0%) | 87 (29.2%) |
| 25 to 34 Years | 34 (10.1%) | 42 (11.3%) |
| 35 to 44 Years | 30 (8.8%) | 28 (7.7%) |
| 45 to 54 Years | 37 (8.9%) | 39 (10.0%) |
| 55 to 64 Years | 102 (21.1%) | 108 (22.3%) |
| 65 to 74 Years | 11 (2.8%) | 84 (19.1%) |
| 75 Years and over | 43 (17.9%) | 41 (12.9%) |
| Total | 512 (15.7%) | 634 (18.1%) |
Income Above Poverty by Sex and Age in Tillman County
According to the poverty statistics in Tillman County, males aged 15 years and females aged 35 to 44 years are the age groups that are most secure financially, with 100.0% of males and 92.3% of females in these age groups living above the poverty line.
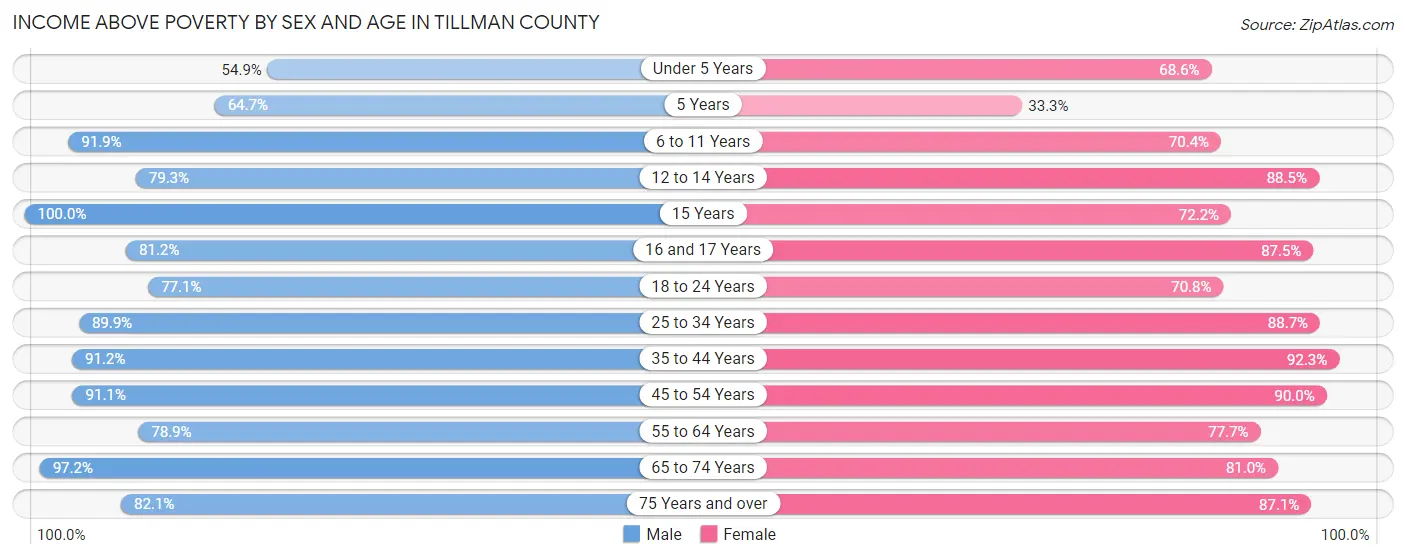
| Age Bracket | Male | Female |
| Under 5 Years | 129 (54.9%) | 118 (68.6%) |
| 5 Years | 44 (64.7%) | 8 (33.3%) |
| 6 to 11 Years | 226 (91.9%) | 190 (70.4%) |
| 12 to 14 Years | 96 (79.3%) | 162 (88.5%) |
| 15 Years | 32 (100.0%) | 52 (72.2%) |
| 16 and 17 Years | 56 (81.2%) | 98 (87.5%) |
| 18 to 24 Years | 225 (77.0%) | 211 (70.8%) |
| 25 to 34 Years | 303 (89.9%) | 331 (88.7%) |
| 35 to 44 Years | 310 (91.2%) | 335 (92.3%) |
| 45 to 54 Years | 378 (91.1%) | 350 (90.0%) |
| 55 to 64 Years | 381 (78.9%) | 376 (77.7%) |
| 65 to 74 Years | 380 (97.2%) | 357 (80.9%) |
| 75 Years and over | 197 (82.1%) | 277 (87.1%) |
| Total | 2,757 (84.3%) | 2,865 (81.9%) |
Income Below Poverty Among Married-Couple Families in Tillman County
The poverty statistics for married-couple families in Tillman County show that 8.8% or 103 of the total 1,169 families live below the poverty line. Families with 5 or more children have the highest poverty rate of 100.0%, comprising of 30 families. On the other hand, families with 3 or 4 children have the lowest poverty rate of 1.9%, which includes 2 families.
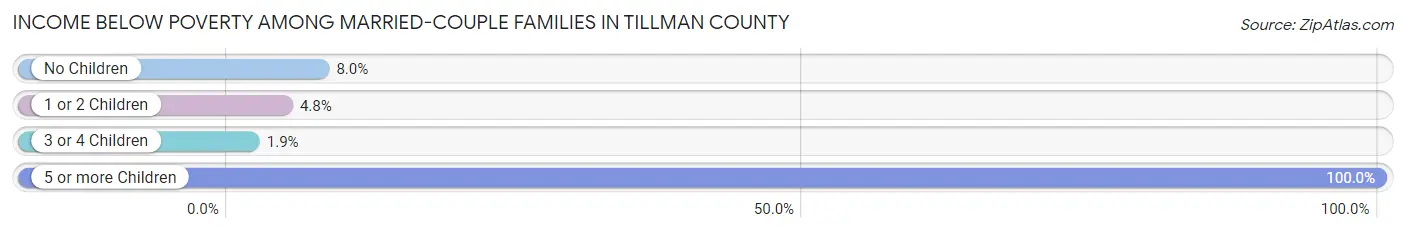
| Children | Above Poverty | Below Poverty |
| No Children | 624 (92.0%) | 54 (8.0%) |
| 1 or 2 Children | 339 (95.2%) | 17 (4.8%) |
| 3 or 4 Children | 103 (98.1%) | 2 (1.9%) |
| 5 or more Children | 0 (0.0%) | 30 (100.0%) |
| Total | 1,066 (91.2%) | 103 (8.8%) |
Income Below Poverty Among Single-Parent Households in Tillman County
According to the poverty data in Tillman County, 9.3% or 14 single-father households and 39.1% or 116 single-mother households are living below the poverty line. Among single-father households, those with 5 or more children have the highest poverty rate, with 4 households (100.0%) experiencing poverty. Likewise, among single-mother households, those with 3 or 4 children have the highest poverty rate, with 16 households (100.0%) falling below the poverty line.
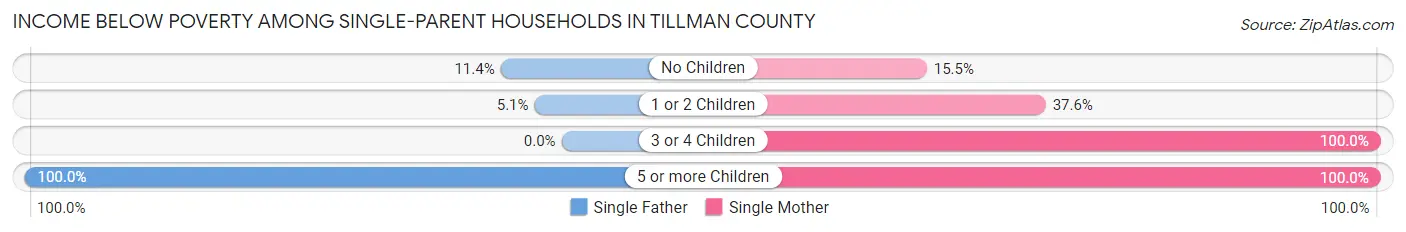
| Children | Single Father | Single Mother |
| No Children | 5 (11.4%) | 11 (15.5%) |
| 1 or 2 Children | 5 (5.1%) | 73 (37.6%) |
| 3 or 4 Children | 0 (0.0%) | 16 (100.0%) |
| 5 or more Children | 4 (100.0%) | 16 (100.0%) |
| Total | 14 (9.3%) | 116 (39.1%) |
Income Below Poverty Among Married-Couple vs Single-Parent Households in Tillman County
The poverty data for Tillman County shows that 103 of the married-couple family households (8.8%) and 130 of the single-parent households (29.1%) are living below the poverty level. Within the married-couple family households, those with 5 or more children have the highest poverty rate, with 30 households (100.0%) falling below the poverty line. Among the single-parent households, those with 5 or more children have the highest poverty rate, with 20 household (100.0%) living below poverty.
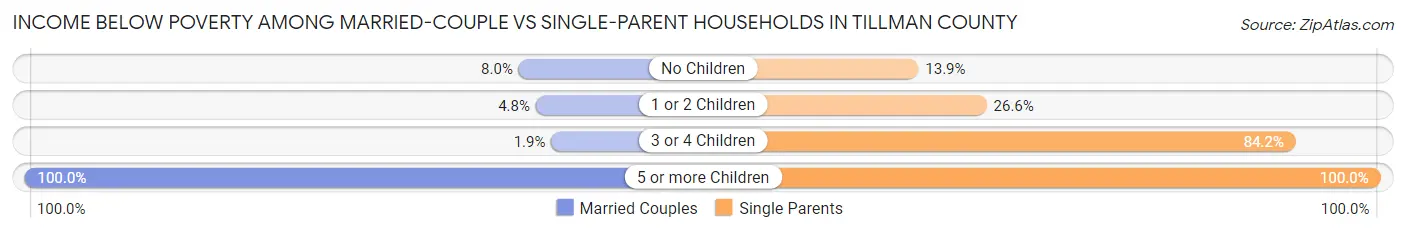
| Children | Married-Couple Families | Single-Parent Households |
| No Children | 54 (8.0%) | 16 (13.9%) |
| 1 or 2 Children | 17 (4.8%) | 78 (26.6%) |
| 3 or 4 Children | 2 (1.9%) | 16 (84.2%) |
| 5 or more Children | 30 (100.0%) | 20 (100.0%) |
| Total | 103 (8.8%) | 130 (29.1%) |
Race in Tillman County
The most populous races in Tillman County are White / Caucasian (4,622 | 65.9%), Hispanic or Latino (2,006 | 28.6%), and Some other Race (1,000 | 14.3%).
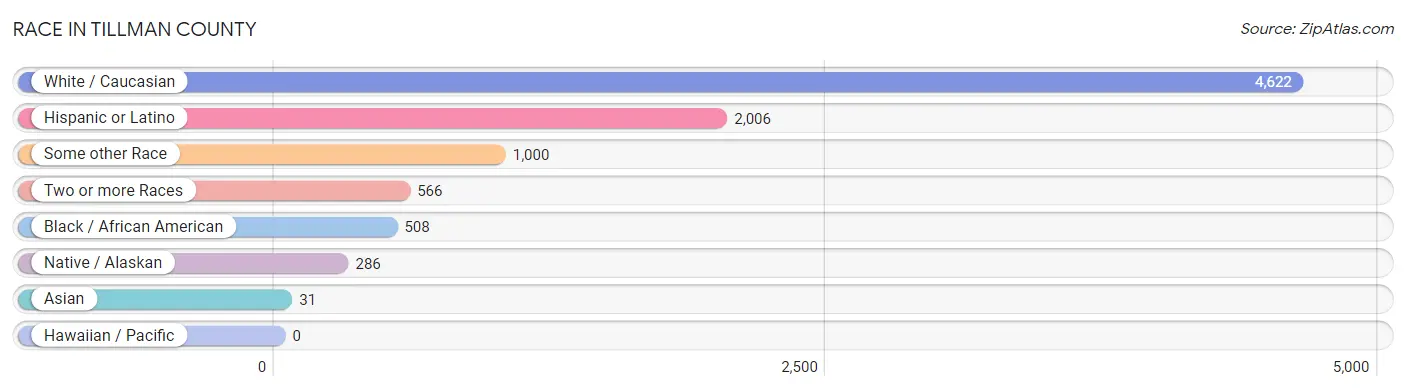
| Race | # Population | % Population |
| Asian | 31 | 0.4% |
| Black / African American | 508 | 7.2% |
| Hawaiian / Pacific | 0 | 0.0% |
| Hispanic or Latino | 2,006 | 28.6% |
| Native / Alaskan | 286 | 4.1% |
| White / Caucasian | 4,622 | 65.9% |
| Two or more Races | 566 | 8.1% |
| Some other Race | 1,000 | 14.3% |
| Total | 7,013 | 100.0% |
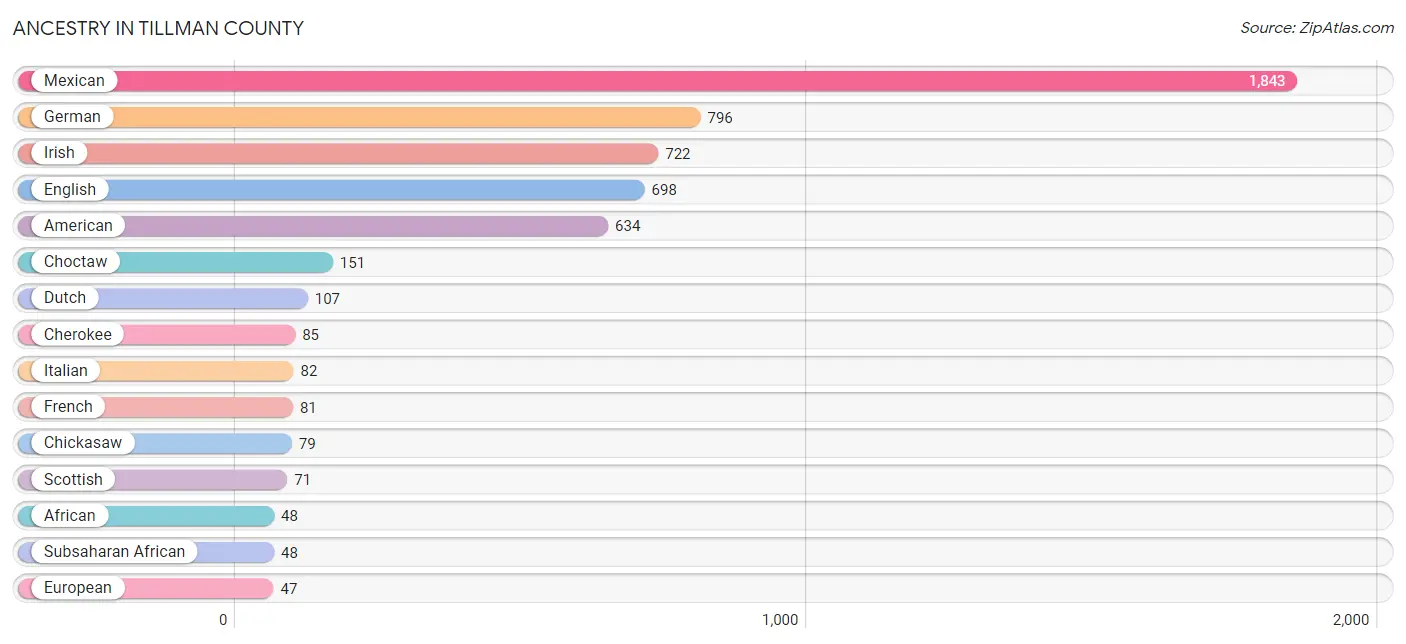
Ancestry in Tillman County
The most populous ancestries reported in Tillman County are Mexican (1,843 | 26.3%), German (796 | 11.4%), Irish (722 | 10.3%), English (698 | 10.0%), and American (634 | 9.0%), together accounting for 66.9% of all Tillman County residents.
| Ancestry | # Population | % Population |
| African | 48 | 0.7% |
| American | 634 | 9.0% |
| Apache | 20 | 0.3% |
| Arab | 29 | 0.4% |
| Austrian | 15 | 0.2% |
| Blackfeet | 12 | 0.2% |
| British | 32 | 0.5% |
| Burmese | 4 | 0.1% |
| Celtic | 23 | 0.3% |
| Central American | 4 | 0.1% |
| Cherokee | 85 | 1.2% |
| Chickasaw | 79 | 1.1% |
| Choctaw | 151 | 2.1% |
| Comanche | 8 | 0.1% |
| Creek | 4 | 0.1% |
| Czech | 1 | 0.0% |
| Czechoslovakian | 2 | 0.0% |
| Danish | 2 | 0.0% |
| Dutch | 107 | 1.5% |
| Dutch West Indian | 23 | 0.3% |
| Egyptian | 17 | 0.2% |
| English | 698 | 10.0% |
| European | 47 | 0.7% |
| French | 81 | 1.1% |
| French American Indian | 1 | 0.0% |
| German | 796 | 11.4% |
| Greek | 2 | 0.0% |
| Irish | 722 | 10.3% |
| Iroquois | 14 | 0.2% |
| Italian | 82 | 1.2% |
| Kiowa | 2 | 0.0% |
| Korean | 3 | 0.0% |
| Lebanese | 4 | 0.1% |
| Mexican | 1,843 | 26.3% |
| Mexican American Indian | 45 | 0.6% |
| Native Hawaiian | 1 | 0.0% |
| Norwegian | 38 | 0.5% |
| Osage | 2 | 0.0% |
| Pakistani | 32 | 0.5% |
| Panamanian | 4 | 0.1% |
| Polish | 23 | 0.3% |
| Portuguese | 27 | 0.4% |
| Puerto Rican | 15 | 0.2% |
| Scandinavian | 8 | 0.1% |
| Scotch-Irish | 25 | 0.4% |
| Scottish | 71 | 1.0% |
| Seminole | 8 | 0.1% |
| Sioux | 2 | 0.0% |
| Spaniard | 36 | 0.5% |
| Spanish American Indian | 10 | 0.1% |
| Subsaharan African | 48 | 0.7% |
| Swedish | 43 | 0.6% |
| Swiss | 12 | 0.2% |
| Ukrainian | 2 | 0.0% |
| Welsh | 12 | 0.2% | View All 55 Rows |
Immigrants in Tillman County
The most numerous immigrant groups reported in Tillman County came from Central America (268 | 3.8%), Latin America (268 | 3.8%), Mexico (268 | 3.8%), Asia (31 | 0.4%), and Europe (26 | 0.4%), together accounting for 12.3% of all Tillman County residents.
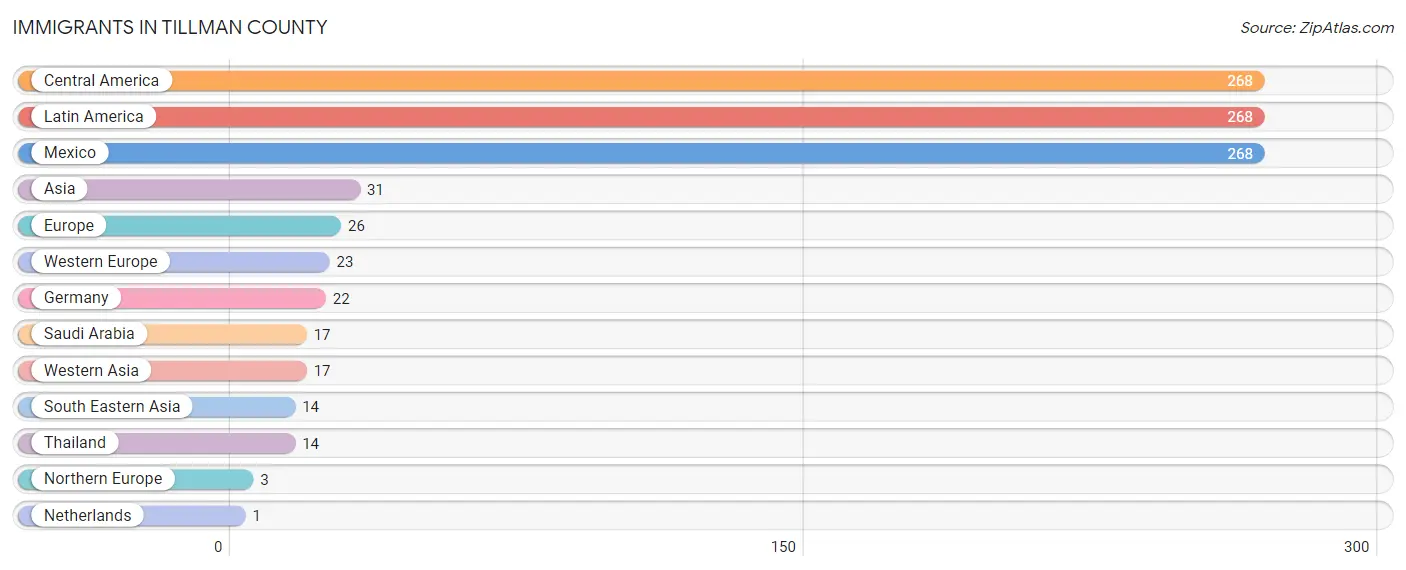
| Immigration Origin | # Population | % Population |
| Asia | 31 | 0.4% |
| Central America | 268 | 3.8% |
| Europe | 26 | 0.4% |
| Germany | 22 | 0.3% |
| Latin America | 268 | 3.8% |
| Mexico | 268 | 3.8% |
| Netherlands | 1 | 0.0% |
| Northern Europe | 3 | 0.0% |
| Saudi Arabia | 17 | 0.2% |
| South Eastern Asia | 14 | 0.2% |
| Thailand | 14 | 0.2% |
| Western Asia | 17 | 0.2% |
| Western Europe | 23 | 0.3% | View All 13 Rows |
Sex and Age in Tillman County
Sex and Age in Tillman County
The most populous age groups in Tillman County are 15 to 19 Years (329 | 9.5%) for men and 10 to 14 Years (294 | 8.3%) for women.
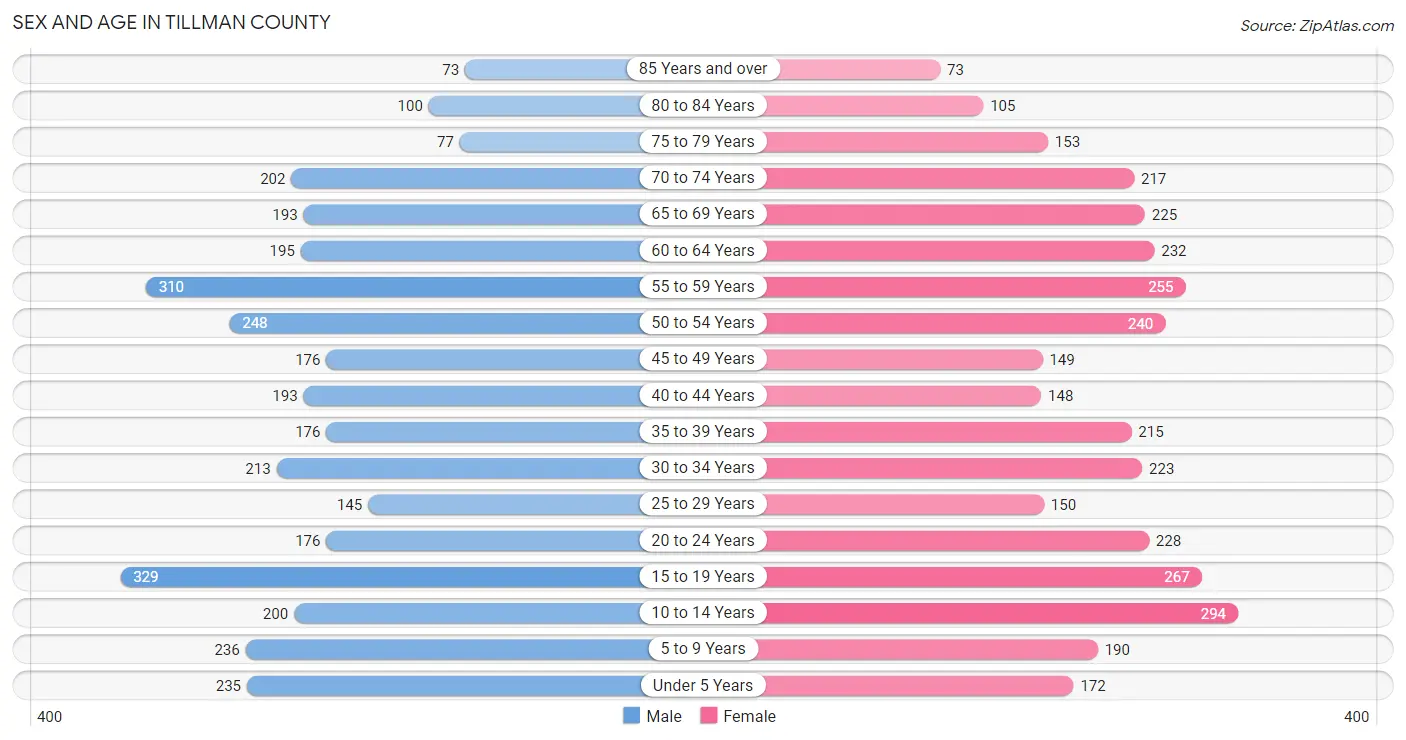
| Age Bracket | Male | Female |
| Under 5 Years | 235 (6.8%) | 172 (4.9%) |
| 5 to 9 Years | 236 (6.8%) | 190 (5.4%) |
| 10 to 14 Years | 200 (5.8%) | 294 (8.3%) |
| 15 to 19 Years | 329 (9.5%) | 267 (7.5%) |
| 20 to 24 Years | 176 (5.1%) | 228 (6.5%) |
| 25 to 29 Years | 145 (4.2%) | 150 (4.2%) |
| 30 to 34 Years | 213 (6.1%) | 223 (6.3%) |
| 35 to 39 Years | 176 (5.1%) | 215 (6.1%) |
| 40 to 44 Years | 193 (5.6%) | 148 (4.2%) |
| 45 to 49 Years | 176 (5.1%) | 149 (4.2%) |
| 50 to 54 Years | 248 (7.1%) | 240 (6.8%) |
| 55 to 59 Years | 310 (8.9%) | 255 (7.2%) |
| 60 to 64 Years | 195 (5.6%) | 232 (6.6%) |
| 65 to 69 Years | 193 (5.6%) | 225 (6.4%) |
| 70 to 74 Years | 202 (5.8%) | 217 (6.1%) |
| 75 to 79 Years | 77 (2.2%) | 153 (4.3%) |
| 80 to 84 Years | 100 (2.9%) | 105 (3.0%) |
| 85 Years and over | 73 (2.1%) | 73 (2.1%) |
| Total | 3,477 (100.0%) | 3,536 (100.0%) |
Families and Households in Tillman County
Median Family Size in Tillman County
The median family size in Tillman County is 3.43 persons per family, with single female/mother families (297 | 18.4%) accounting for the largest median family size of 3.89 persons per family. On the other hand, single male/father families (150 | 9.3%) represent the smallest median family size with 2.61 persons per family.
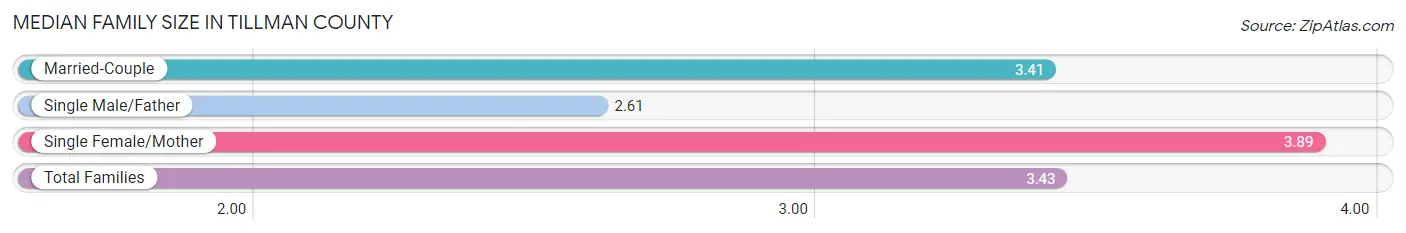
| Family Type | # Families | Family Size |
| Married-Couple | 1,169 (72.3%) | 3.41 |
| Single Male/Father | 150 (9.3%) | 2.61 |
| Single Female/Mother | 297 (18.4%) | 3.89 |
| Total Families | 1,616 (100.0%) | 3.43 |
Median Household Size in Tillman County
The median household size in Tillman County is 2.60 persons per household, with single female/mother households (297 | 11.5%) accounting for the largest median household size of 4.11 persons per household. non-family households (979 | 37.7%) represent the smallest median household size with 1.08 persons per household.
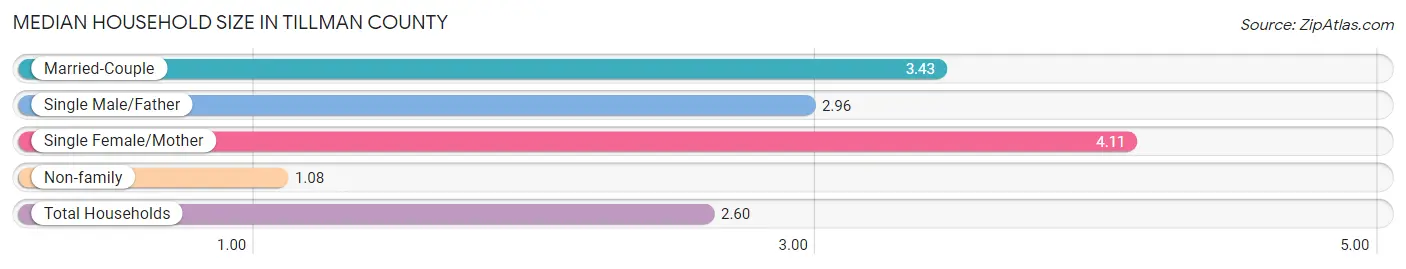
| Household Type | # Households | Household Size |
| Married-Couple | 1,169 (45.1%) | 3.43 |
| Single Male/Father | 150 (5.8%) | 2.96 |
| Single Female/Mother | 297 (11.5%) | 4.11 |
| Non-family | 979 (37.7%) | 1.08 |
| Total Households | 2,595 (100.0%) | 2.60 |
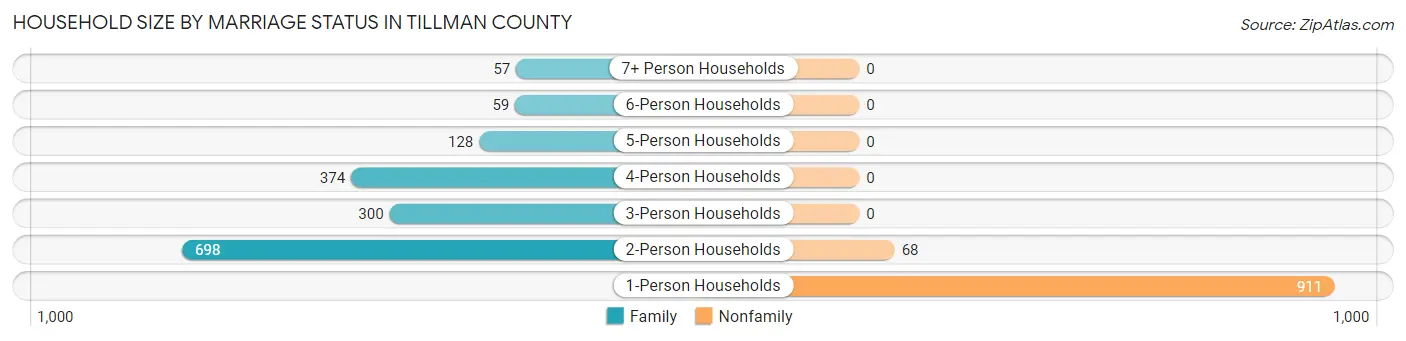
Household Size by Marriage Status in Tillman County
Out of a total of 2,595 households in Tillman County, 1,616 (62.3%) are family households, while 979 (37.7%) are nonfamily households. The most numerous type of family households are 2-person households, comprising 698, and the most common type of nonfamily households are 1-person households, comprising 911.
| Household Size | Family Households | Nonfamily Households |
| 1-Person Households | - | 911 (35.1%) |
| 2-Person Households | 698 (26.9%) | 68 (2.6%) |
| 3-Person Households | 300 (11.6%) | 0 (0.0%) |
| 4-Person Households | 374 (14.4%) | 0 (0.0%) |
| 5-Person Households | 128 (4.9%) | 0 (0.0%) |
| 6-Person Households | 59 (2.3%) | 0 (0.0%) |
| 7+ Person Households | 57 (2.2%) | 0 (0.0%) |
| Total | 1,616 (62.3%) | 979 (37.7%) |
Female Fertility in Tillman County
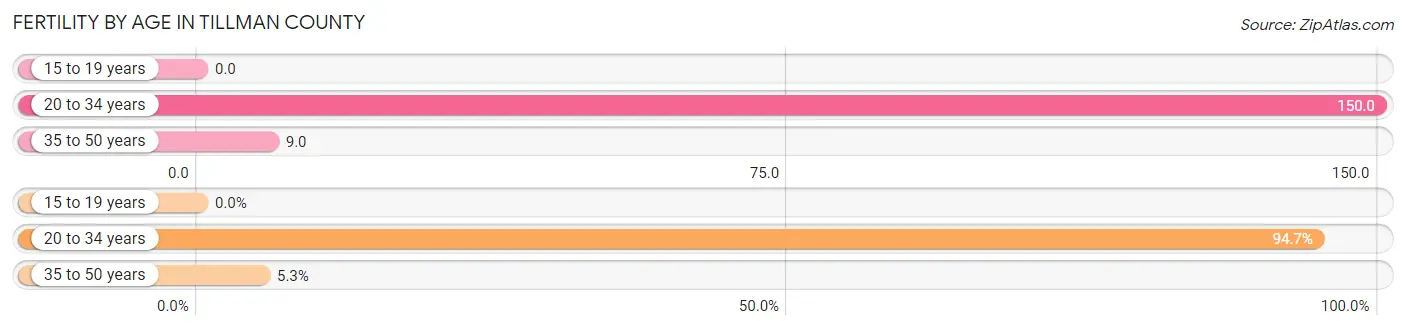
Fertility by Age in Tillman County
Average fertility rate in Tillman County is 67.0 births per 1,000 women. Women in the age bracket of 20 to 34 years have the highest fertility rate with 150.0 births per 1,000 women. Women in the age bracket of 20 to 34 years acount for 94.7% of all women with births.
| Age Bracket | Women with Births | Births / 1,000 Women |
| 15 to 19 years | 0 (0.0%) | 0.0 |
| 20 to 34 years | 90 (94.7%) | 150.0 |
| 35 to 50 years | 5 (5.3%) | 9.0 |
| Total | 95 (100.0%) | 67.0 |
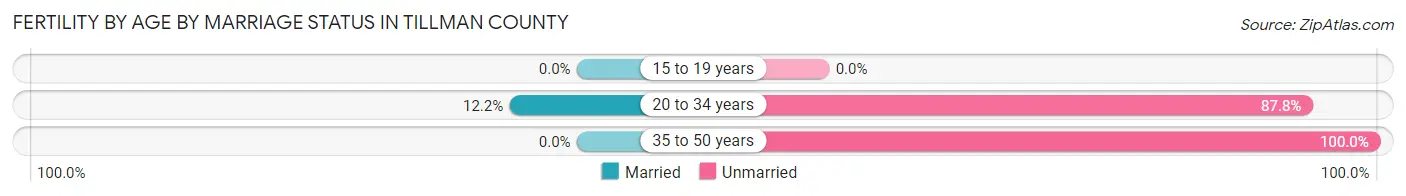
Fertility by Age by Marriage Status in Tillman County
11.6% of women with births (95) in Tillman County are married. The highest percentage of unmarried women with births falls into 35 to 50 years age bracket with 100.0% of them unmarried at the time of birth, while the lowest percentage of unmarried women with births belong to 20 to 34 years age bracket with 87.8% of them unmarried.
| Age Bracket | Married | Unmarried |
| 15 to 19 years | 0 (0.0%) | 0 (0.0%) |
| 20 to 34 years | 11 (12.2%) | 79 (87.8%) |
| 35 to 50 years | 0 (0.0%) | 5 (100.0%) |
| Total | 11 (11.6%) | 84 (88.4%) |
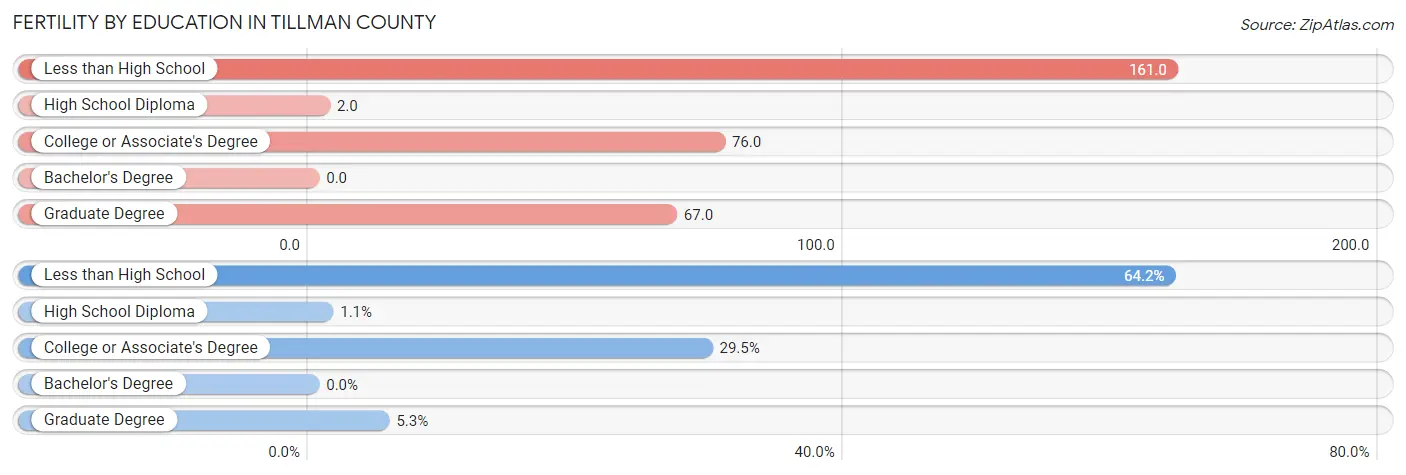
Fertility by Education in Tillman County
| Educational Attainment | Women with Births | Births / 1,000 Women |
| Less than High School | 61 (64.2%) | 161.0 |
| High School Diploma | 1 (1.1%) | 2.0 |
| College or Associate's Degree | 28 (29.5%) | 76.0 |
| Bachelor's Degree | 0 (0.0%) | 0.0 |
| Graduate Degree | 5 (5.3%) | 67.0 |
| Total | 95 (100.0%) | 67.0 |
Fertility by Education by Marriage Status in Tillman County
88.4% of women with births in Tillman County are unmarried. Women with the educational attainment of college or associate's degree are most likely to be married with 39.3% of them married at childbirth, while women with the educational attainment of less than high school are least likely to be married with 100.0% of them unmarried at childbirth.
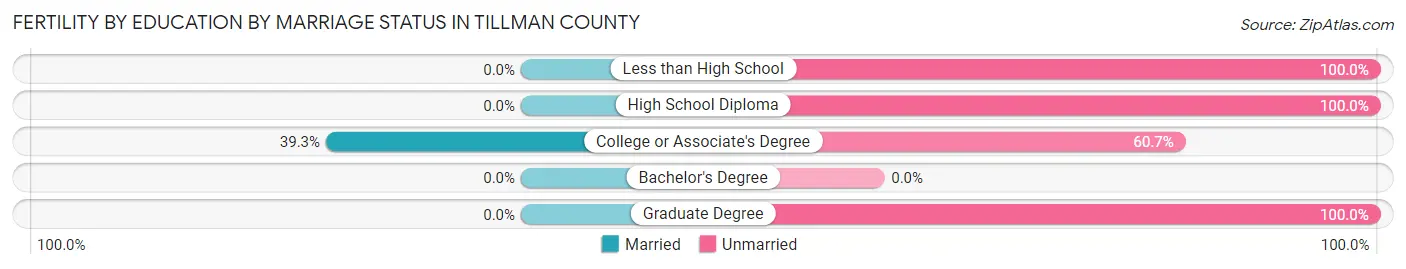
| Educational Attainment | Married | Unmarried |
| Less than High School | 0 (0.0%) | 61 (100.0%) |
| High School Diploma | 0 (0.0%) | 1 (100.0%) |
| College or Associate's Degree | 11 (39.3%) | 17 (60.7%) |
| Bachelor's Degree | 0 (0.0%) | 0 (0.0%) |
| Graduate Degree | 0 (0.0%) | 5 (100.0%) |
| Total | 11 (11.6%) | 84 (88.4%) |
Employment Characteristics in Tillman County
Employment by Class of Employer in Tillman County
Among the 2,709 employed individuals in Tillman County, private company employees (1,697 | 62.6%), local government employees (283 | 10.4%), and state government employees (190 | 7.0%) make up the most common classes of employment.
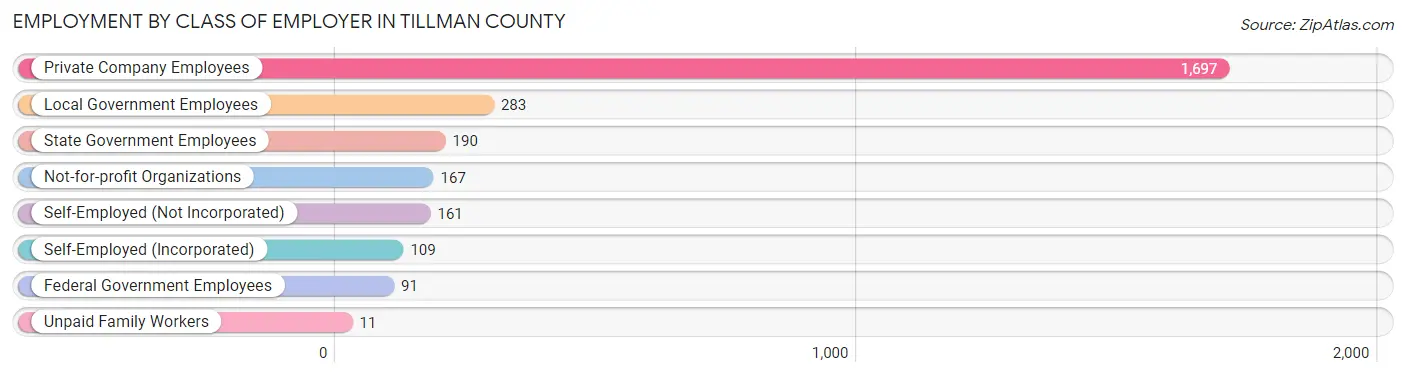
| Employer Class | # Employees | % Employees |
| Private Company Employees | 1,697 | 62.6% |
| Self-Employed (Incorporated) | 109 | 4.0% |
| Self-Employed (Not Incorporated) | 161 | 5.9% |
| Not-for-profit Organizations | 167 | 6.2% |
| Local Government Employees | 283 | 10.4% |
| State Government Employees | 190 | 7.0% |
| Federal Government Employees | 91 | 3.4% |
| Unpaid Family Workers | 11 | 0.4% |
| Total | 2,709 | 100.0% |
Employment Status by Age in Tillman County
According to the labor force statistics for Tillman County, out of the total population over 16 years of age (5,568), 53.3% or 2,968 individuals are in the labor force, with 5.9% or 175 of them unemployed. The age group with the highest labor force participation rate is 30 to 34 years, with 83.9% or 366 individuals in the labor force. Within the labor force, the 45 to 54 years age range has the highest percentage of unemployed individuals, with 11.0% or 70 of them being unemployed.
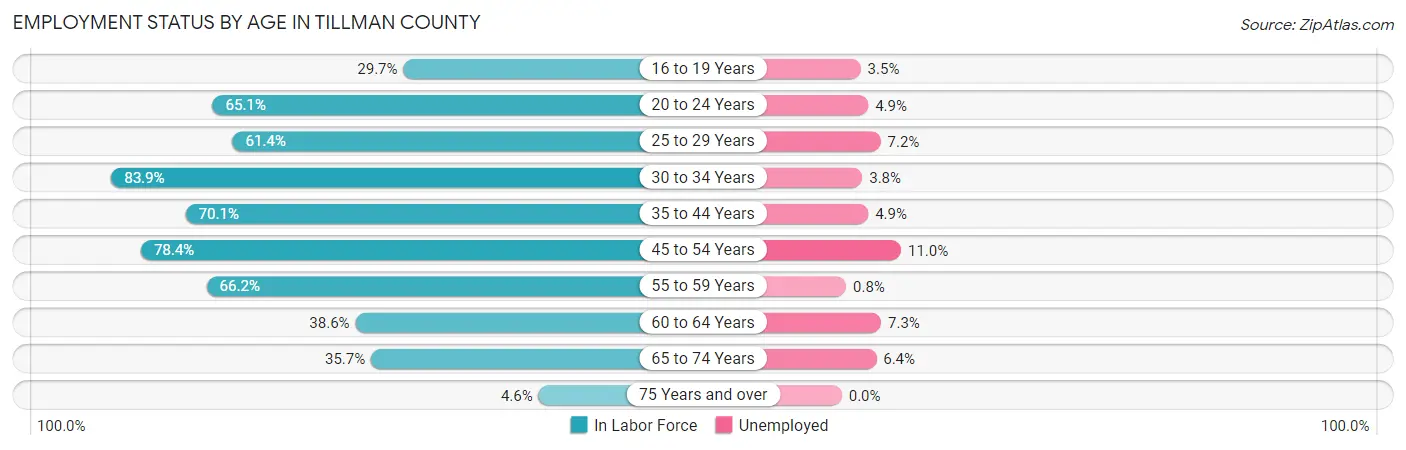
| Age Bracket | In Labor Force | Unemployed |
| 16 to 19 Years | 142 (29.7%) | 5 (3.5%) |
| 20 to 24 Years | 263 (65.1%) | 13 (4.9%) |
| 25 to 29 Years | 181 (61.4%) | 13 (7.2%) |
| 30 to 34 Years | 366 (83.9%) | 14 (3.8%) |
| 35 to 44 Years | 513 (70.1%) | 25 (4.9%) |
| 45 to 54 Years | 637 (78.4%) | 70 (11.0%) |
| 55 to 59 Years | 374 (66.2%) | 3 (0.8%) |
| 60 to 64 Years | 165 (38.6%) | 12 (7.3%) |
| 65 to 74 Years | 299 (35.7%) | 19 (6.4%) |
| 75 Years and over | 27 (4.6%) | 0 (0.0%) |
| Total | 2,968 (53.3%) | 175 (5.9%) |
Employment Status by Educational Attainment in Tillman County
According to labor force statistics for Tillman County, 68.4% of individuals (2,235) out of the total population between 25 and 64 years of age (3,268) are in the labor force, with 6.1% or 136 of them being unemployed. The group with the highest labor force participation rate are those with the educational attainment of bachelor's degree or higher, with 83.7% or 430 individuals in the labor force. Within the labor force, individuals with less than high school education have the highest percentage of unemployment, with 22.1% or 85 of them being unemployed.
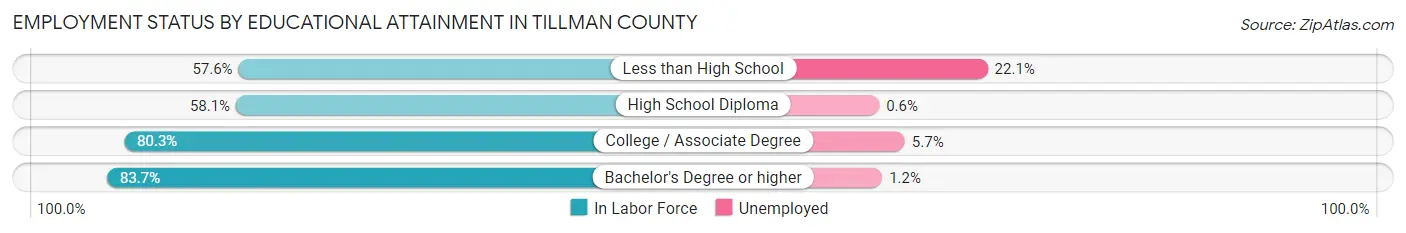
| Educational Attainment | In Labor Force | Unemployed |
| Less than High School | 384 (57.6%) | 147 (22.1%) |
| High School Diploma | 664 (58.1%) | 7 (0.6%) |
| College / Associate Degree | 758 (80.3%) | 54 (5.7%) |
| Bachelor's Degree or higher | 430 (83.7%) | 6 (1.2%) |
| Total | 2,235 (68.4%) | 199 (6.1%) |
Employment Occupations by Sex in Tillman County
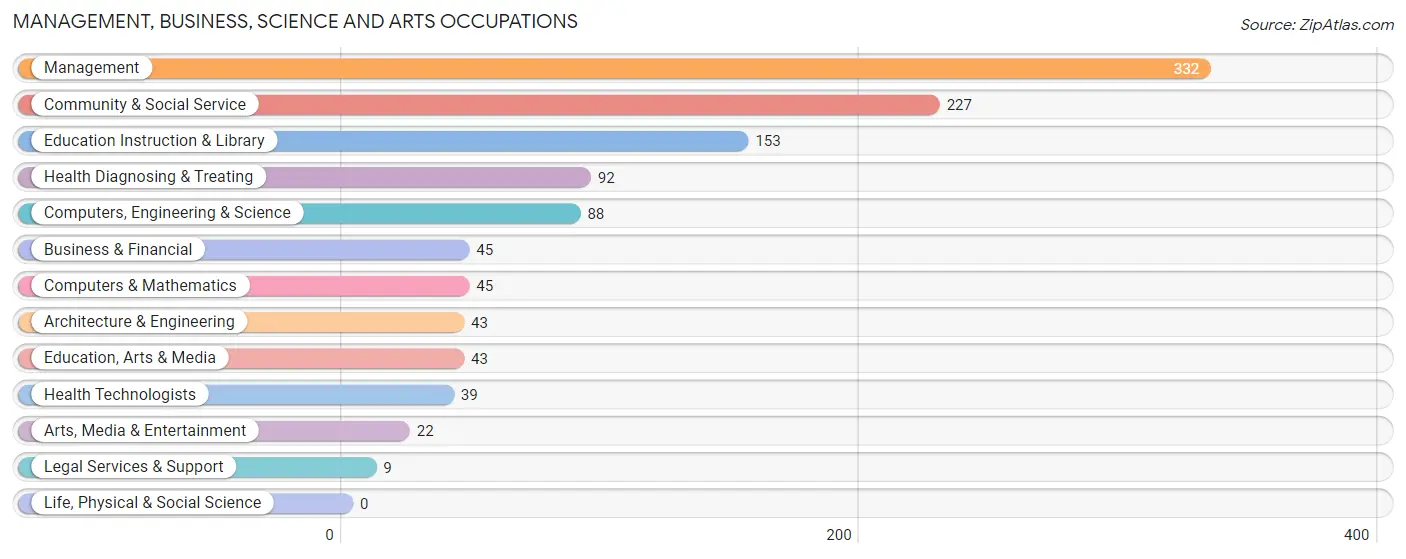
Management, Business, Science and Arts Occupations
The most common Management, Business, Science and Arts occupations in Tillman County are Management (332 | 11.9%), Community & Social Service (227 | 8.1%), Education Instruction & Library (153 | 5.5%), Health Diagnosing & Treating (92 | 3.3%), and Computers, Engineering & Science (88 | 3.2%).
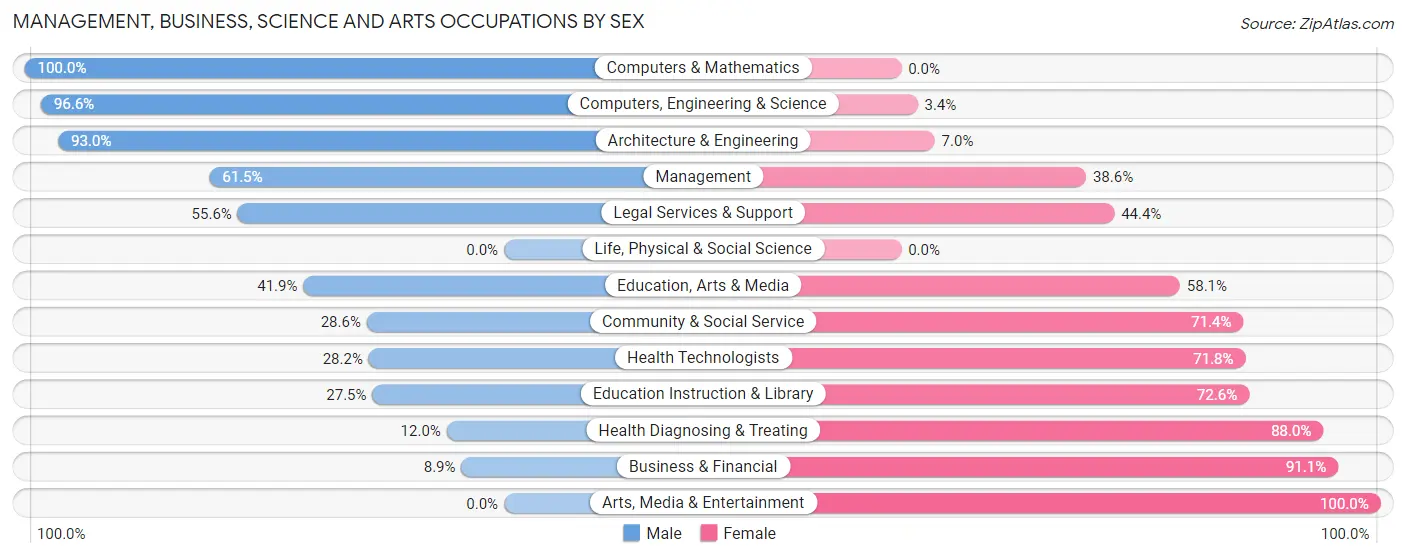
Management, Business, Science and Arts Occupations by Sex
Within the Management, Business, Science and Arts occupations in Tillman County, the most male-oriented occupations are Computers & Mathematics (100.0%), Computers, Engineering & Science (96.6%), and Architecture & Engineering (93.0%), while the most female-oriented occupations are Arts, Media & Entertainment (100.0%), Business & Financial (91.1%), and Health Diagnosing & Treating (88.0%).
| Occupation | Male | Female |
| Management | 204 (61.5%) | 128 (38.6%) |
| Business & Financial | 4 (8.9%) | 41 (91.1%) |
| Computers, Engineering & Science | 85 (96.6%) | 3 (3.4%) |
| Computers & Mathematics | 45 (100.0%) | 0 (0.0%) |
| Architecture & Engineering | 40 (93.0%) | 3 (7.0%) |
| Life, Physical & Social Science | 0 (0.0%) | 0 (0.0%) |
| Community & Social Service | 65 (28.6%) | 162 (71.4%) |
| Education, Arts & Media | 18 (41.9%) | 25 (58.1%) |
| Legal Services & Support | 5 (55.6%) | 4 (44.4%) |
| Education Instruction & Library | 42 (27.5%) | 111 (72.6%) |
| Arts, Media & Entertainment | 0 (0.0%) | 22 (100.0%) |
| Health Diagnosing & Treating | 11 (12.0%) | 81 (88.0%) |
| Health Technologists | 11 (28.2%) | 28 (71.8%) |
| Total (Category) | 369 (47.1%) | 415 (52.9%) |
| Total (Overall) | 1,552 (55.6%) | 1,241 (44.4%) |
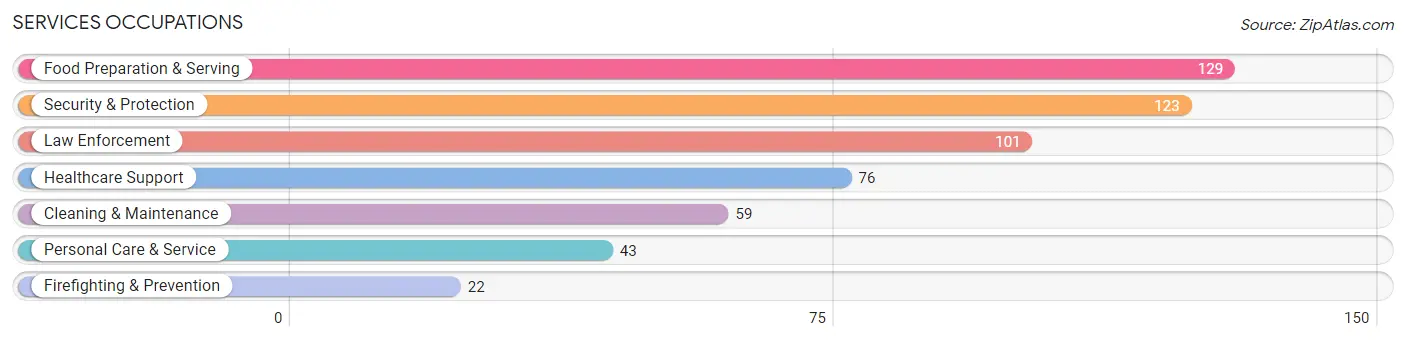
Services Occupations
The most common Services occupations in Tillman County are Food Preparation & Serving (129 | 4.6%), Security & Protection (123 | 4.4%), Law Enforcement (101 | 3.6%), Healthcare Support (76 | 2.7%), and Cleaning & Maintenance (59 | 2.1%).
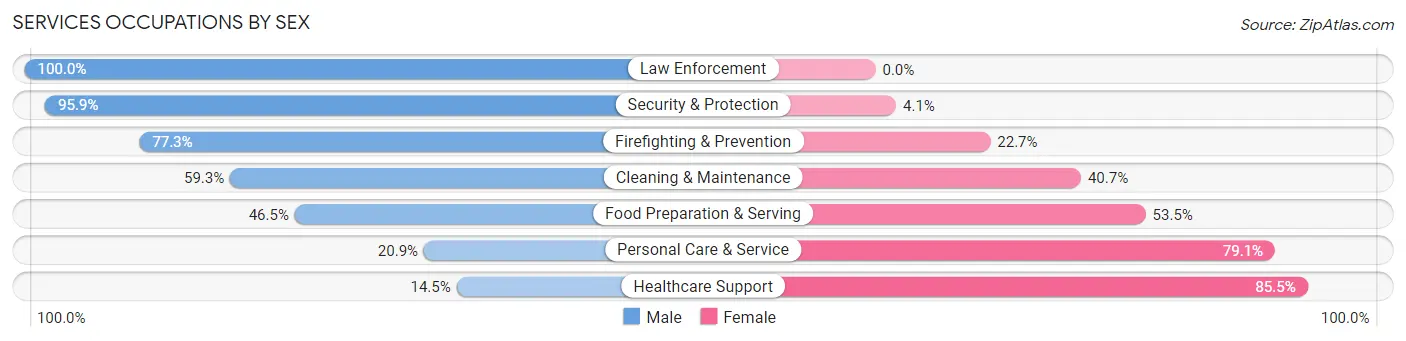
Services Occupations by Sex
Within the Services occupations in Tillman County, the most male-oriented occupations are Law Enforcement (100.0%), Security & Protection (95.9%), and Firefighting & Prevention (77.3%), while the most female-oriented occupations are Healthcare Support (85.5%), Personal Care & Service (79.1%), and Food Preparation & Serving (53.5%).
| Occupation | Male | Female |
| Healthcare Support | 11 (14.5%) | 65 (85.5%) |
| Security & Protection | 118 (95.9%) | 5 (4.1%) |
| Firefighting & Prevention | 17 (77.3%) | 5 (22.7%) |
| Law Enforcement | 101 (100.0%) | 0 (0.0%) |
| Food Preparation & Serving | 60 (46.5%) | 69 (53.5%) |
| Cleaning & Maintenance | 35 (59.3%) | 24 (40.7%) |
| Personal Care & Service | 9 (20.9%) | 34 (79.1%) |
| Total (Category) | 233 (54.2%) | 197 (45.8%) |
| Total (Overall) | 1,552 (55.6%) | 1,241 (44.4%) |
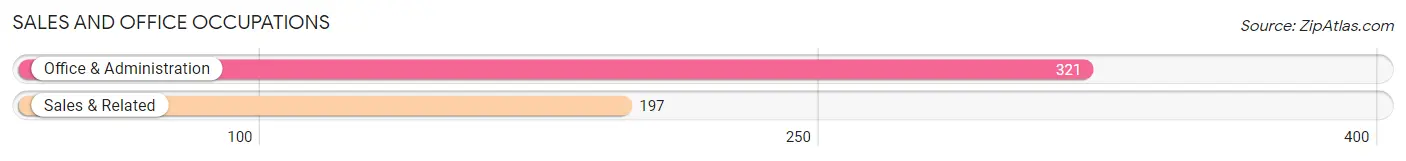
Sales and Office Occupations
The most common Sales and Office occupations in Tillman County are Office & Administration (321 | 11.5%), and Sales & Related (197 | 7.0%).
Sales and Office Occupations by Sex

| Occupation | Male | Female |
| Sales & Related | 99 (50.2%) | 98 (49.7%) |
| Office & Administration | 52 (16.2%) | 269 (83.8%) |
| Total (Category) | 151 (29.1%) | 367 (70.9%) |
| Total (Overall) | 1,552 (55.6%) | 1,241 (44.4%) |
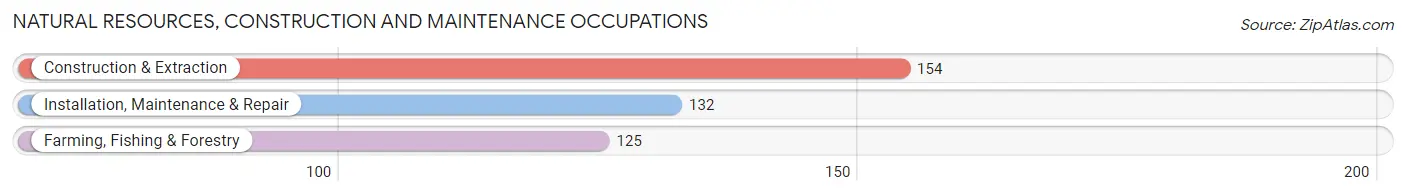
Natural Resources, Construction and Maintenance Occupations
The most common Natural Resources, Construction and Maintenance occupations in Tillman County are Construction & Extraction (154 | 5.5%), Installation, Maintenance & Repair (132 | 4.7%), and Farming, Fishing & Forestry (125 | 4.5%).
Natural Resources, Construction and Maintenance Occupations by Sex
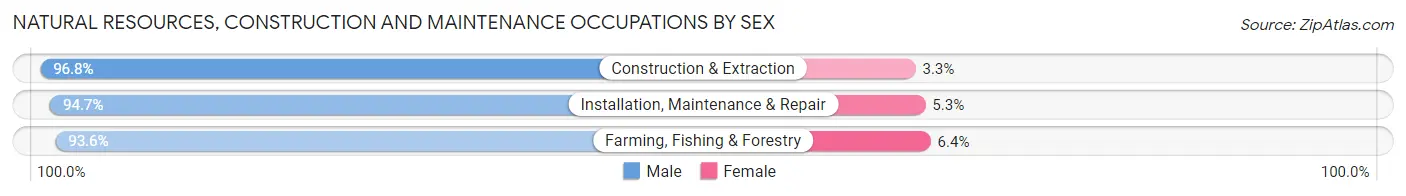
| Occupation | Male | Female |
| Farming, Fishing & Forestry | 117 (93.6%) | 8 (6.4%) |
| Construction & Extraction | 149 (96.8%) | 5 (3.3%) |
| Installation, Maintenance & Repair | 125 (94.7%) | 7 (5.3%) |
| Total (Category) | 391 (95.1%) | 20 (4.9%) |
| Total (Overall) | 1,552 (55.6%) | 1,241 (44.4%) |
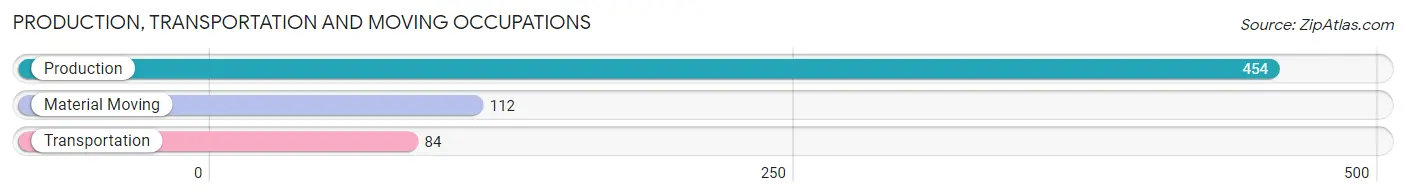
Production, Transportation and Moving Occupations
The most common Production, Transportation and Moving occupations in Tillman County are Production (454 | 16.3%), Material Moving (112 | 4.0%), and Transportation (84 | 3.0%).
Production, Transportation and Moving Occupations by Sex
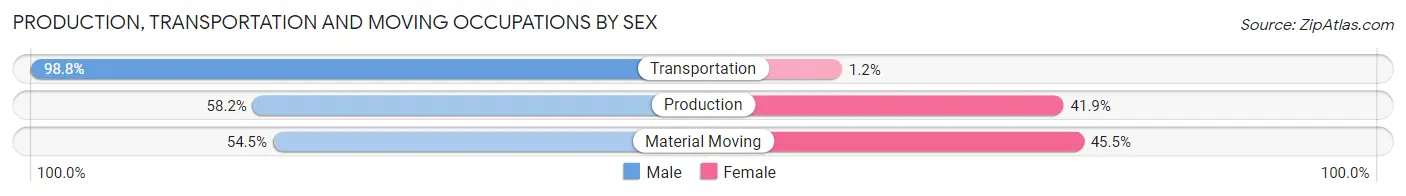
| Occupation | Male | Female |
| Production | 264 (58.2%) | 190 (41.8%) |
| Transportation | 83 (98.8%) | 1 (1.2%) |
| Material Moving | 61 (54.5%) | 51 (45.5%) |
| Total (Category) | 408 (62.8%) | 242 (37.2%) |
| Total (Overall) | 1,552 (55.6%) | 1,241 (44.4%) |
Employment Industries by Sex in Tillman County
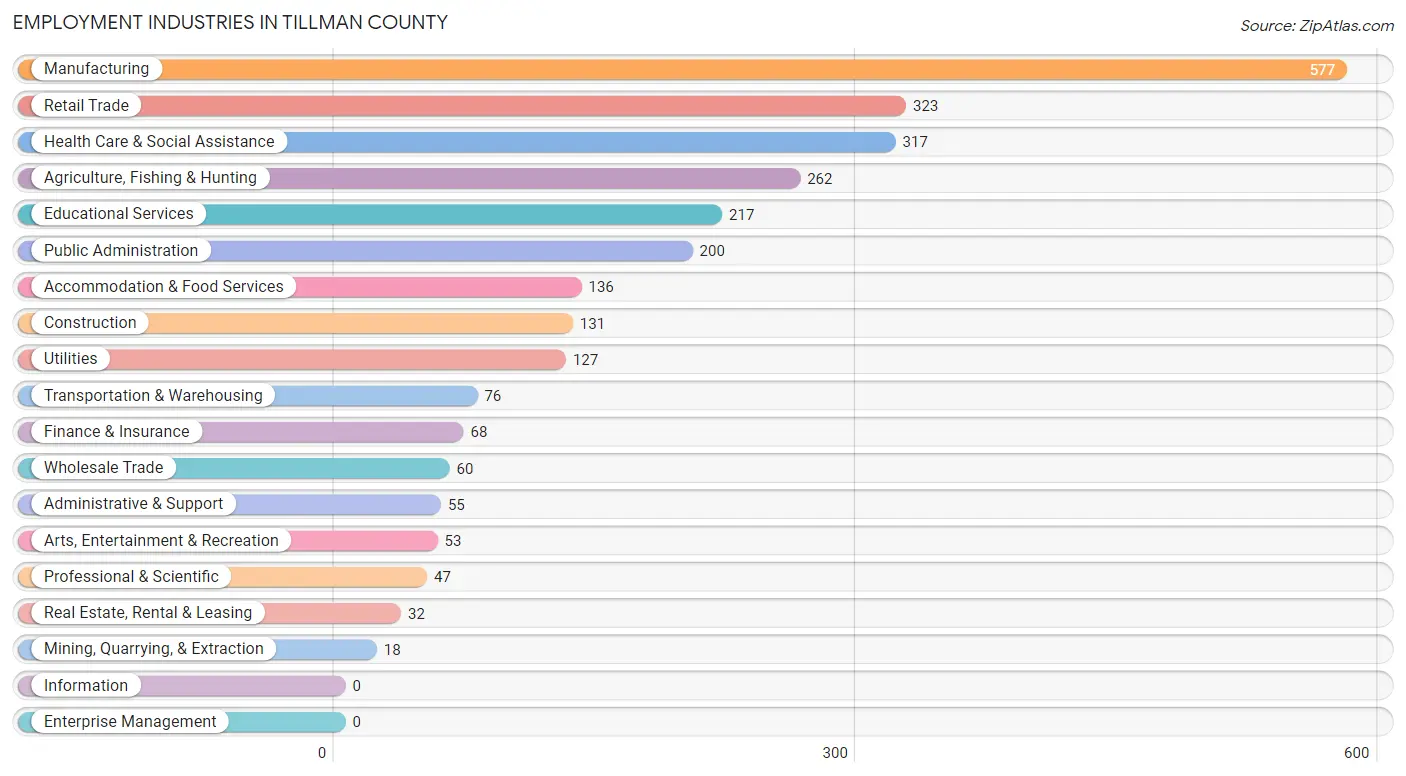
Employment Industries in Tillman County
The major employment industries in Tillman County include Manufacturing (577 | 20.7%), Retail Trade (323 | 11.6%), Health Care & Social Assistance (317 | 11.4%), Agriculture, Fishing & Hunting (262 | 9.4%), and Educational Services (217 | 7.8%).
Employment Industries by Sex in Tillman County
The Tillman County industries that see more men than women are Agriculture, Fishing & Hunting (94.7%), Construction (93.9%), and Professional & Scientific (85.1%), whereas the industries that tend to have a higher number of women are Health Care & Social Assistance (84.5%), Arts, Entertainment & Recreation (79.2%), and Educational Services (73.7%).
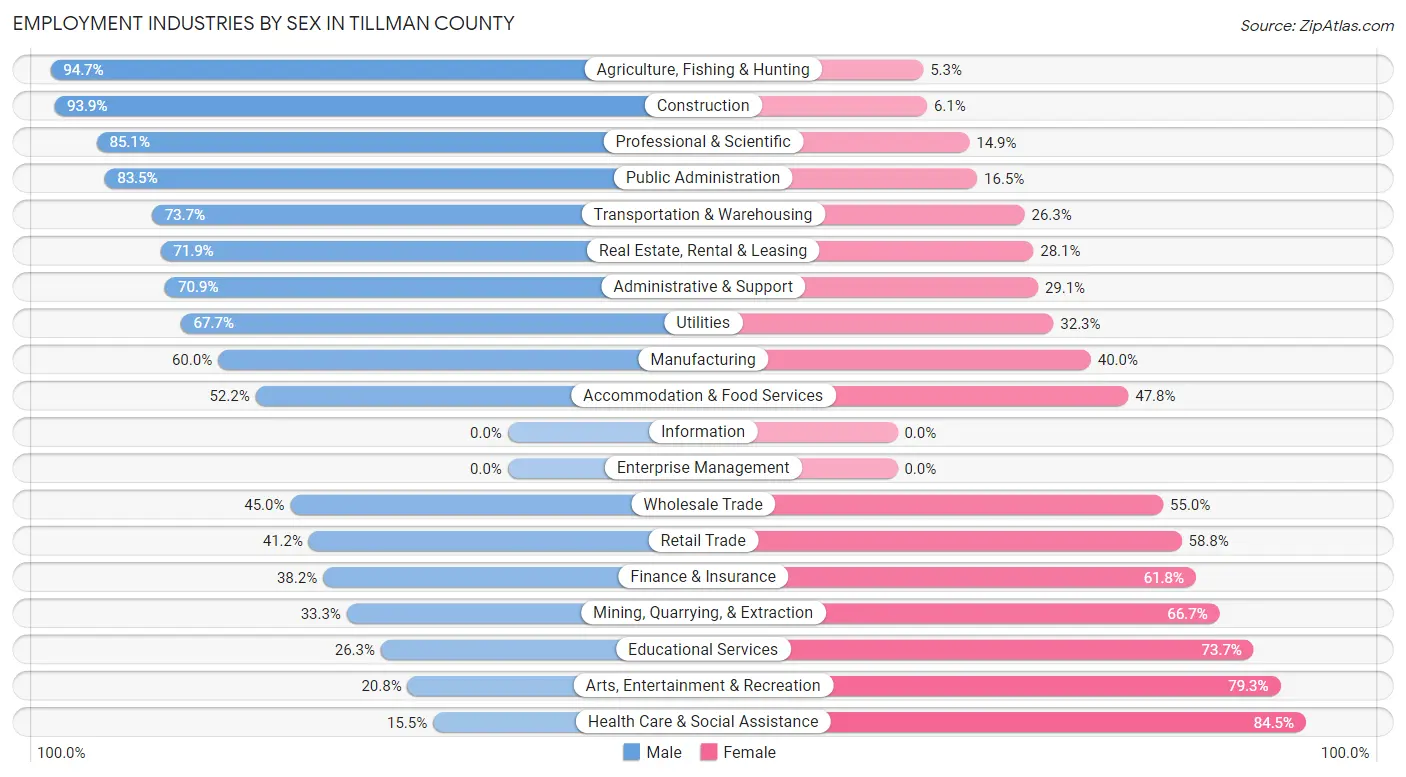
| Industry | Male | Female |
| Agriculture, Fishing & Hunting | 248 (94.7%) | 14 (5.3%) |
| Mining, Quarrying, & Extraction | 6 (33.3%) | 12 (66.7%) |
| Construction | 123 (93.9%) | 8 (6.1%) |
| Manufacturing | 346 (60.0%) | 231 (40.0%) |
| Wholesale Trade | 27 (45.0%) | 33 (55.0%) |
| Retail Trade | 133 (41.2%) | 190 (58.8%) |
| Transportation & Warehousing | 56 (73.7%) | 20 (26.3%) |
| Utilities | 86 (67.7%) | 41 (32.3%) |
| Information | 0 (0.0%) | 0 (0.0%) |
| Finance & Insurance | 26 (38.2%) | 42 (61.8%) |
| Real Estate, Rental & Leasing | 23 (71.9%) | 9 (28.1%) |
| Professional & Scientific | 40 (85.1%) | 7 (14.9%) |
| Enterprise Management | 0 (0.0%) | 0 (0.0%) |
| Administrative & Support | 39 (70.9%) | 16 (29.1%) |
| Educational Services | 57 (26.3%) | 160 (73.7%) |
| Health Care & Social Assistance | 49 (15.5%) | 268 (84.5%) |
| Arts, Entertainment & Recreation | 11 (20.7%) | 42 (79.2%) |
| Accommodation & Food Services | 71 (52.2%) | 65 (47.8%) |
| Public Administration | 167 (83.5%) | 33 (16.5%) |
| Total | 1,552 (55.6%) | 1,241 (44.4%) |
Education in Tillman County
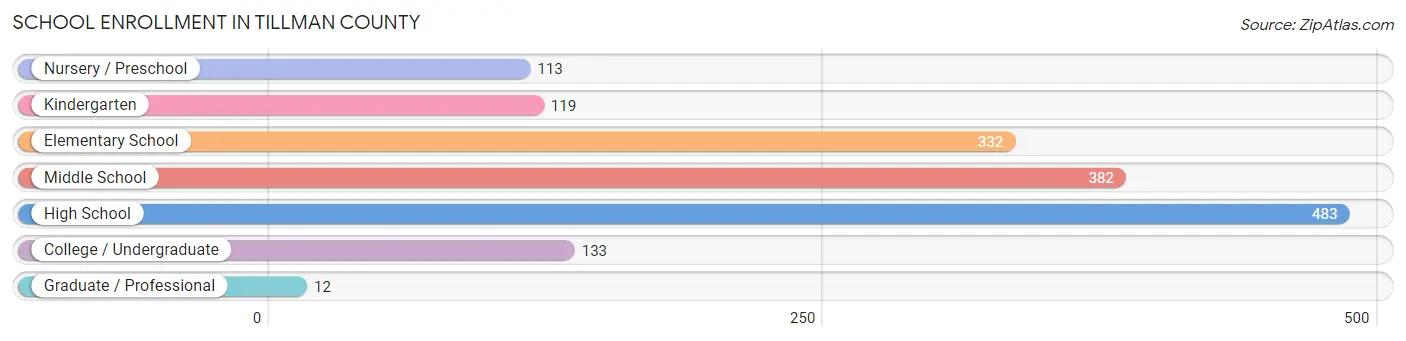
School Enrollment in Tillman County
The most common levels of schooling among the 1,574 students in Tillman County are high school (483 | 30.7%), middle school (382 | 24.3%), and elementary school (332 | 21.1%).
| School Level | # Students | % Students |
| Nursery / Preschool | 113 | 7.2% |
| Kindergarten | 119 | 7.6% |
| Elementary School | 332 | 21.1% |
| Middle School | 382 | 24.3% |
| High School | 483 | 30.7% |
| College / Undergraduate | 133 | 8.5% |
| Graduate / Professional | 12 | 0.8% |
| Total | 1,574 | 100.0% |
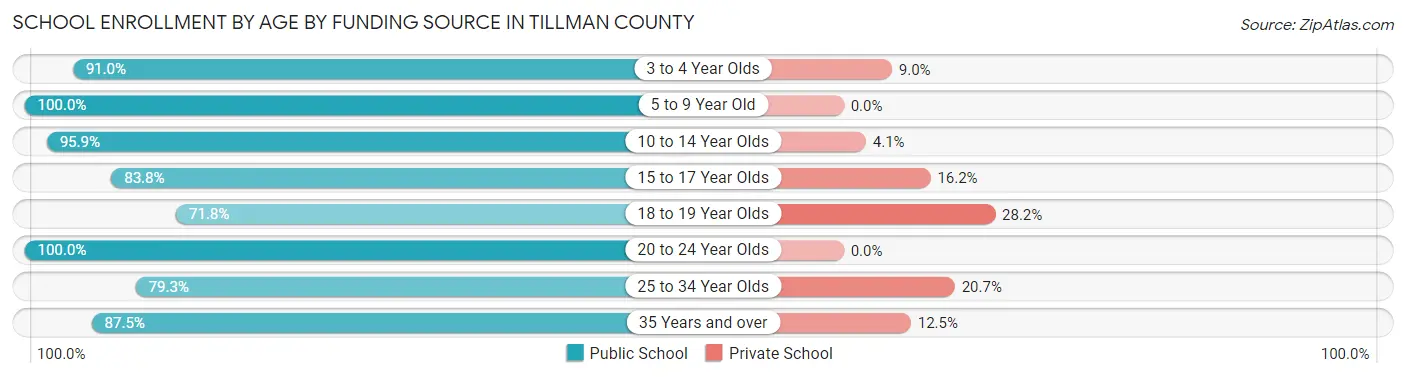
School Enrollment by Age by Funding Source in Tillman County
Out of a total of 1,574 students who are enrolled in schools in Tillman County, 127 (8.1%) attend a private institution, while the remaining 1,447 (91.9%) are enrolled in public schools. The age group of 18 to 19 year olds has the highest likelihood of being enrolled in private schools, with 33 (28.2% in the age bracket) enrolled. Conversely, the age group of 5 to 9 year old has the lowest likelihood of being enrolled in a private school, with 412 (100.0% in the age bracket) attending a public institution.
| Age Bracket | Public School | Private School |
| 3 to 4 Year Olds | 71 (91.0%) | 7 (9.0%) |
| 5 to 9 Year Old | 412 (100.0%) | 0 (0.0%) |
| 10 to 14 Year Olds | 464 (95.9%) | 20 (4.1%) |
| 15 to 17 Year Olds | 301 (83.8%) | 58 (16.2%) |
| 18 to 19 Year Olds | 84 (71.8%) | 33 (28.2%) |
| 20 to 24 Year Olds | 71 (100.0%) | 0 (0.0%) |
| 25 to 34 Year Olds | 23 (79.3%) | 6 (20.7%) |
| 35 Years and over | 21 (87.5%) | 3 (12.5%) |
| Total | 1,447 (91.9%) | 127 (8.1%) |
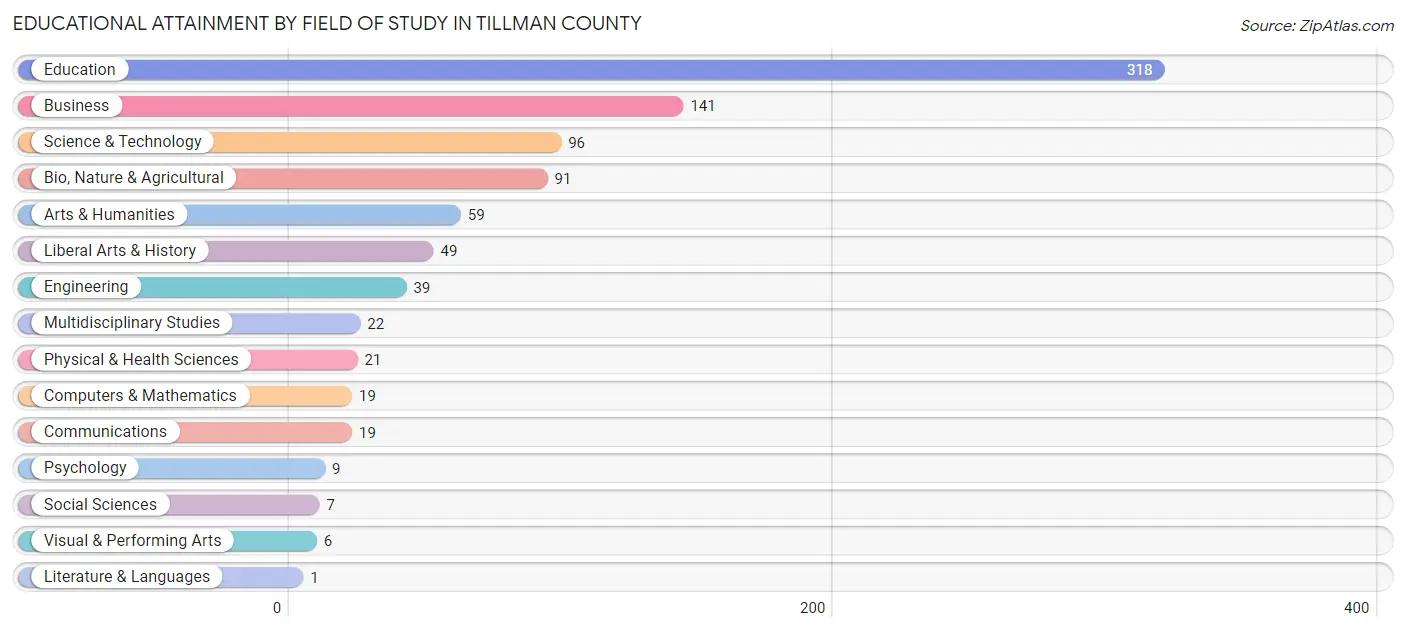
Educational Attainment by Field of Study in Tillman County
Education (318 | 35.4%), business (141 | 15.7%), science & technology (96 | 10.7%), bio, nature & agricultural (91 | 10.1%), and arts & humanities (59 | 6.6%) are the most common fields of study among 897 individuals in Tillman County who have obtained a bachelor's degree or higher.
| Field of Study | # Graduates | % Graduates |
| Computers & Mathematics | 19 | 2.1% |
| Bio, Nature & Agricultural | 91 | 10.1% |
| Physical & Health Sciences | 21 | 2.3% |
| Psychology | 9 | 1.0% |
| Social Sciences | 7 | 0.8% |
| Engineering | 39 | 4.3% |
| Multidisciplinary Studies | 22 | 2.5% |
| Science & Technology | 96 | 10.7% |
| Business | 141 | 15.7% |
| Education | 318 | 35.4% |
| Literature & Languages | 1 | 0.1% |
| Liberal Arts & History | 49 | 5.5% |
| Visual & Performing Arts | 6 | 0.7% |
| Communications | 19 | 2.1% |
| Arts & Humanities | 59 | 6.6% |
| Total | 897 | 100.0% |
Transportation & Commute in Tillman County
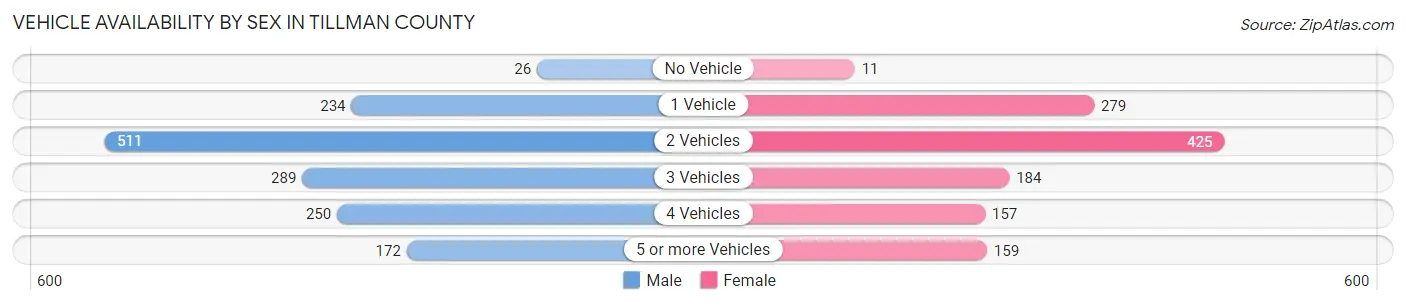
Vehicle Availability by Sex in Tillman County
The most prevalent vehicle ownership categories in Tillman County are males with 2 vehicles (511, accounting for 34.5%) and females with 2 vehicles (425, making up 42.1%).
| Vehicles Available | Male | Female |
| No Vehicle | 26 (1.8%) | 11 (0.9%) |
| 1 Vehicle | 234 (15.8%) | 279 (23.0%) |
| 2 Vehicles | 511 (34.5%) | 425 (35.0%) |
| 3 Vehicles | 289 (19.5%) | 184 (15.1%) |
| 4 Vehicles | 250 (16.9%) | 157 (12.9%) |
| 5 or more Vehicles | 172 (11.6%) | 159 (13.1%) |
| Total | 1,482 (100.0%) | 1,215 (100.0%) |
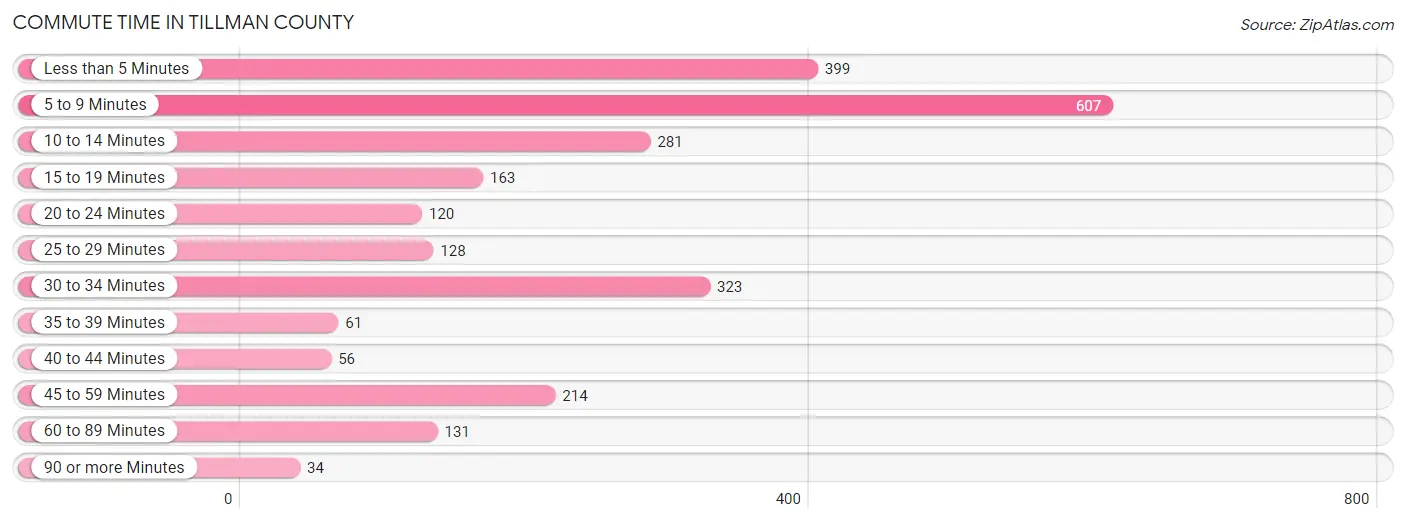
Commute Time in Tillman County
The most frequently occuring commute durations in Tillman County are 5 to 9 minutes (607 commuters, 24.1%), less than 5 minutes (399 commuters, 15.9%), and 30 to 34 minutes (323 commuters, 12.8%).
| Commute Time | # Commuters | % Commuters |
| Less than 5 Minutes | 399 | 15.9% |
| 5 to 9 Minutes | 607 | 24.1% |
| 10 to 14 Minutes | 281 | 11.2% |
| 15 to 19 Minutes | 163 | 6.5% |
| 20 to 24 Minutes | 120 | 4.8% |
| 25 to 29 Minutes | 128 | 5.1% |
| 30 to 34 Minutes | 323 | 12.8% |
| 35 to 39 Minutes | 61 | 2.4% |
| 40 to 44 Minutes | 56 | 2.2% |
| 45 to 59 Minutes | 214 | 8.5% |
| 60 to 89 Minutes | 131 | 5.2% |
| 90 or more Minutes | 34 | 1.3% |
Commute Time by Sex in Tillman County
The most common commute times in Tillman County are 5 to 9 minutes (277 commuters, 20.2%) for males and 5 to 9 minutes (330 commuters, 28.8%) for females.
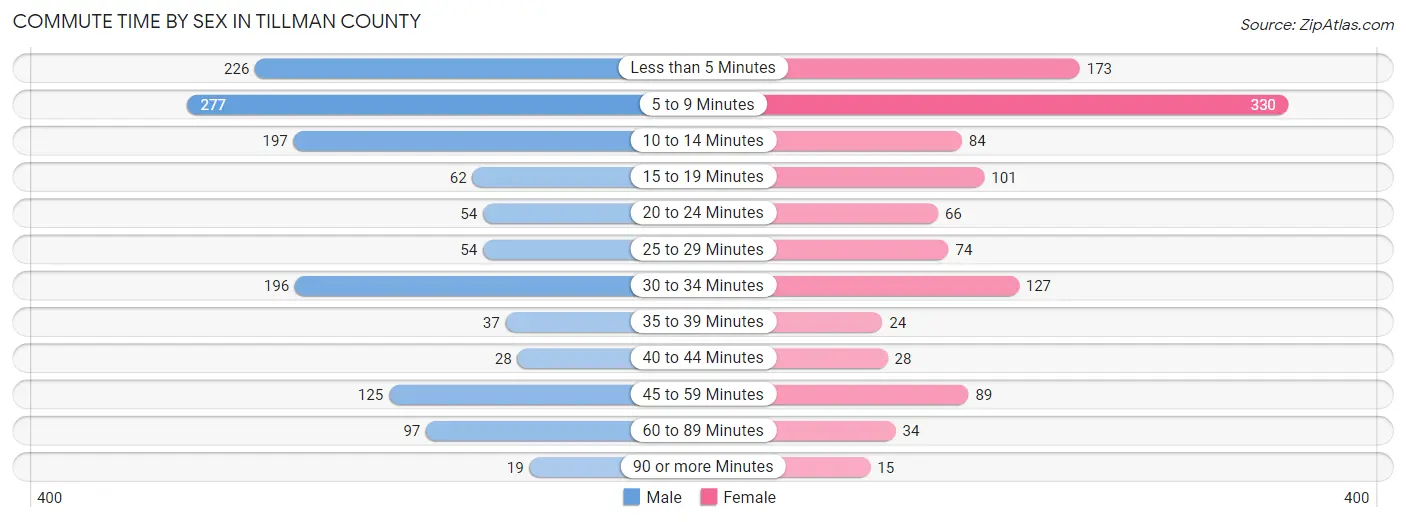
| Commute Time | Male | Female |
| Less than 5 Minutes | 226 (16.5%) | 173 (15.1%) |
| 5 to 9 Minutes | 277 (20.2%) | 330 (28.8%) |
| 10 to 14 Minutes | 197 (14.4%) | 84 (7.3%) |
| 15 to 19 Minutes | 62 (4.5%) | 101 (8.8%) |
| 20 to 24 Minutes | 54 (3.9%) | 66 (5.8%) |
| 25 to 29 Minutes | 54 (3.9%) | 74 (6.5%) |
| 30 to 34 Minutes | 196 (14.3%) | 127 (11.1%) |
| 35 to 39 Minutes | 37 (2.7%) | 24 (2.1%) |
| 40 to 44 Minutes | 28 (2.0%) | 28 (2.5%) |
| 45 to 59 Minutes | 125 (9.1%) | 89 (7.8%) |
| 60 to 89 Minutes | 97 (7.1%) | 34 (3.0%) |
| 90 or more Minutes | 19 (1.4%) | 15 (1.3%) |
Time of Departure to Work by Sex in Tillman County
The most frequent times of departure to work in Tillman County are 7:00 AM to 7:29 AM (330, 24.0%) for males and 7:30 AM to 7:59 AM (254, 22.2%) for females.
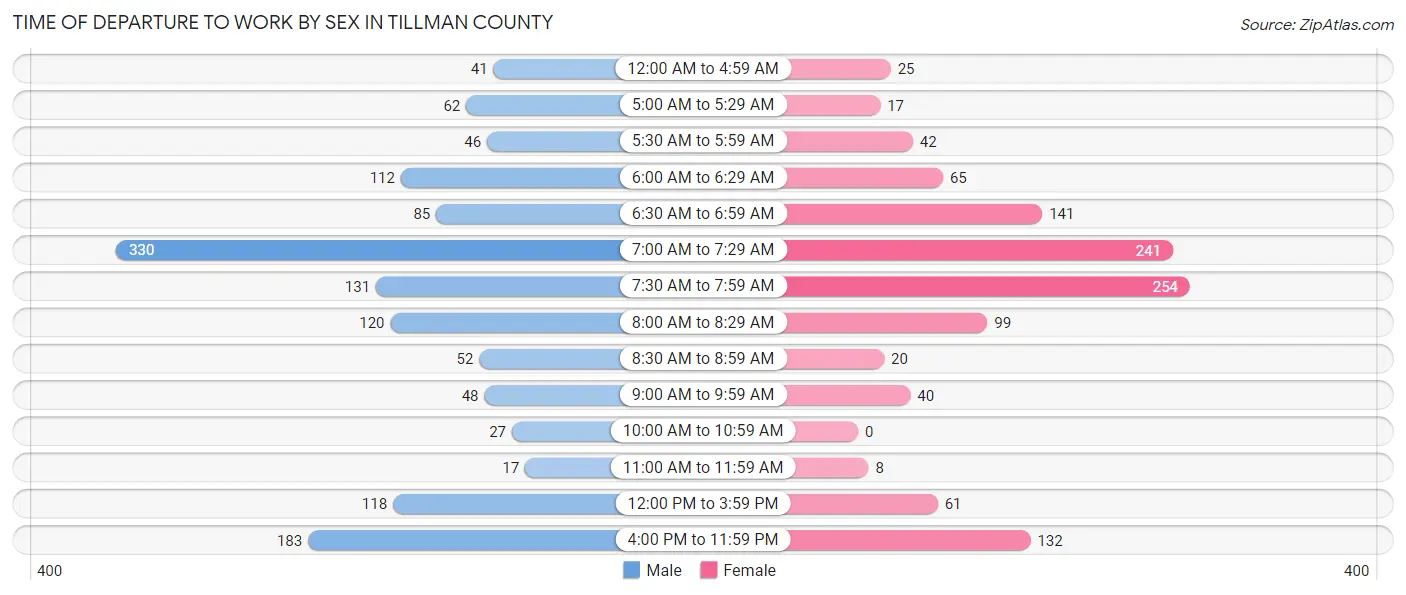
| Time of Departure | Male | Female |
| 12:00 AM to 4:59 AM | 41 (3.0%) | 25 (2.2%) |
| 5:00 AM to 5:29 AM | 62 (4.5%) | 17 (1.5%) |
| 5:30 AM to 5:59 AM | 46 (3.4%) | 42 (3.7%) |
| 6:00 AM to 6:29 AM | 112 (8.2%) | 65 (5.7%) |
| 6:30 AM to 6:59 AM | 85 (6.2%) | 141 (12.3%) |
| 7:00 AM to 7:29 AM | 330 (24.0%) | 241 (21.0%) |
| 7:30 AM to 7:59 AM | 131 (9.6%) | 254 (22.2%) |
| 8:00 AM to 8:29 AM | 120 (8.7%) | 99 (8.6%) |
| 8:30 AM to 8:59 AM | 52 (3.8%) | 20 (1.8%) |
| 9:00 AM to 9:59 AM | 48 (3.5%) | 40 (3.5%) |
| 10:00 AM to 10:59 AM | 27 (2.0%) | 0 (0.0%) |
| 11:00 AM to 11:59 AM | 17 (1.2%) | 8 (0.7%) |
| 12:00 PM to 3:59 PM | 118 (8.6%) | 61 (5.3%) |
| 4:00 PM to 11:59 PM | 183 (13.3%) | 132 (11.5%) |
| Total | 1,372 (100.0%) | 1,145 (100.0%) |
Housing Occupancy in Tillman County
Occupancy by Ownership in Tillman County
Of the total 2,595 dwellings in Tillman County, owner-occupied units account for 1,899 (73.2%), while renter-occupied units make up 696 (26.8%).
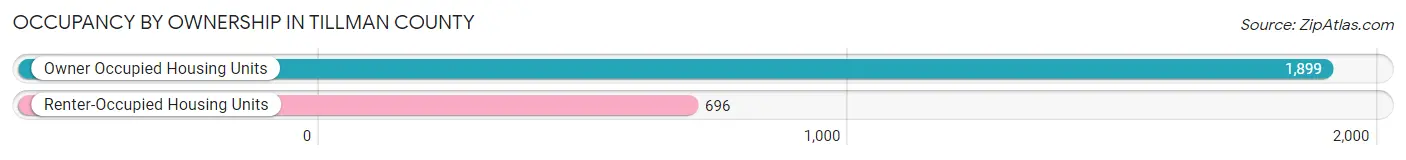
| Occupancy | # Housing Units | % Housing Units |
| Owner Occupied Housing Units | 1,899 | 73.2% |
| Renter-Occupied Housing Units | 696 | 26.8% |
| Total Occupied Housing Units | 2,595 | 100.0% |
Occupancy by Household Size in Tillman County
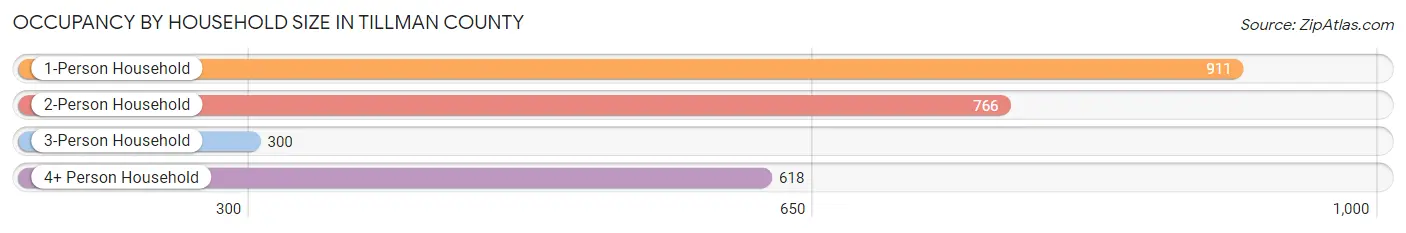
| Household Size | # Housing Units | % Housing Units |
| 1-Person Household | 911 | 35.1% |
| 2-Person Household | 766 | 29.5% |
| 3-Person Household | 300 | 11.6% |
| 4+ Person Household | 618 | 23.8% |
| Total Housing Units | 2,595 | 100.0% |
Occupancy by Ownership by Household Size in Tillman County
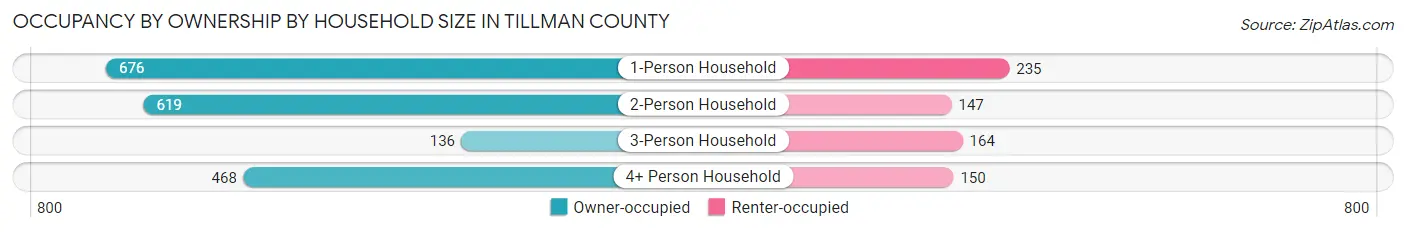
| Household Size | Owner-occupied | Renter-occupied |
| 1-Person Household | 676 (74.2%) | 235 (25.8%) |
| 2-Person Household | 619 (80.8%) | 147 (19.2%) |
| 3-Person Household | 136 (45.3%) | 164 (54.7%) |
| 4+ Person Household | 468 (75.7%) | 150 (24.3%) |
| Total Housing Units | 1,899 (73.2%) | 696 (26.8%) |
Occupancy by Educational Attainment in Tillman County
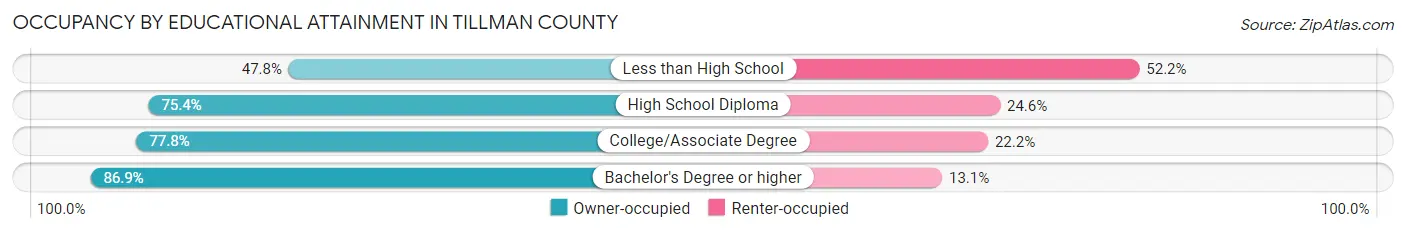
| Household Size | Owner-occupied | Renter-occupied |
| Less than High School | 230 (47.8%) | 251 (52.2%) |
| High School Diploma | 728 (75.4%) | 237 (24.6%) |
| College/Associate Degree | 495 (77.8%) | 141 (22.2%) |
| Bachelor's Degree or higher | 446 (86.9%) | 67 (13.1%) |
Occupancy by Age of Householder in Tillman County
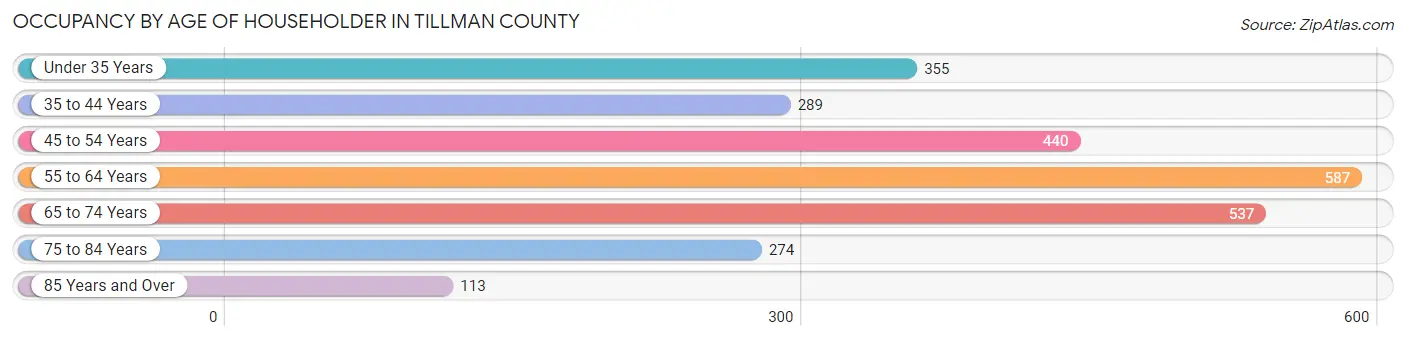
| Age Bracket | # Households | % Households |
| Under 35 Years | 355 | 13.7% |
| 35 to 44 Years | 289 | 11.1% |
| 45 to 54 Years | 440 | 17.0% |
| 55 to 64 Years | 587 | 22.6% |
| 65 to 74 Years | 537 | 20.7% |
| 75 to 84 Years | 274 | 10.6% |
| 85 Years and Over | 113 | 4.3% |
| Total | 2,595 | 100.0% |
Housing Finances in Tillman County
Median Income by Occupancy in Tillman County
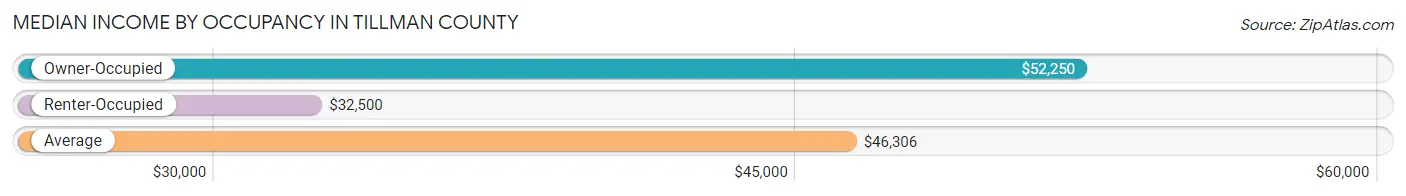
| Occupancy Type | # Households | Median Income |
| Owner-Occupied | 1,899 (73.2%) | $52,250 |
| Renter-Occupied | 696 (26.8%) | $32,500 |
| Average | 2,595 (100.0%) | $46,306 |
Occupancy by Householder Income Bracket in Tillman County
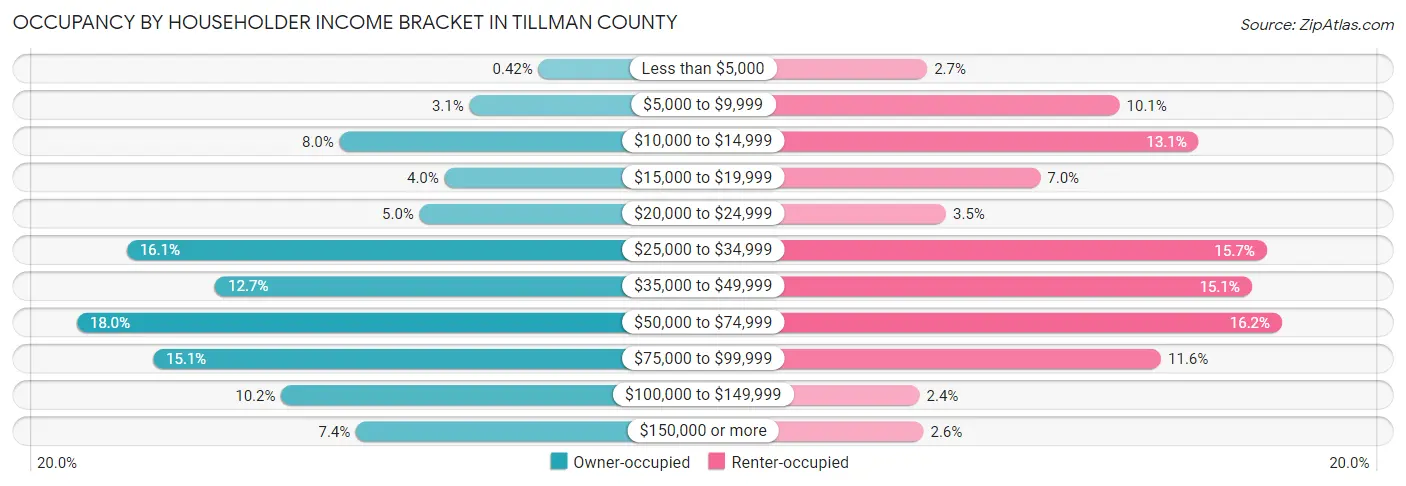
| Income Bracket | Owner-occupied | Renter-occupied |
| Less than $5,000 | 8 (0.4%) | 19 (2.7%) |
| $5,000 to $9,999 | 58 (3.0%) | 70 (10.1%) |
| $10,000 to $14,999 | 152 (8.0%) | 91 (13.1%) |
| $15,000 to $19,999 | 76 (4.0%) | 49 (7.0%) |
| $20,000 to $24,999 | 94 (5.0%) | 24 (3.5%) |
| $25,000 to $34,999 | 306 (16.1%) | 109 (15.7%) |
| $35,000 to $49,999 | 242 (12.7%) | 105 (15.1%) |
| $50,000 to $74,999 | 342 (18.0%) | 113 (16.2%) |
| $75,000 to $99,999 | 287 (15.1%) | 81 (11.6%) |
| $100,000 to $149,999 | 194 (10.2%) | 17 (2.4%) |
| $150,000 or more | 140 (7.4%) | 18 (2.6%) |
| Total | 1,899 (100.0%) | 696 (100.0%) |
Monthly Housing Cost Tiers in Tillman County
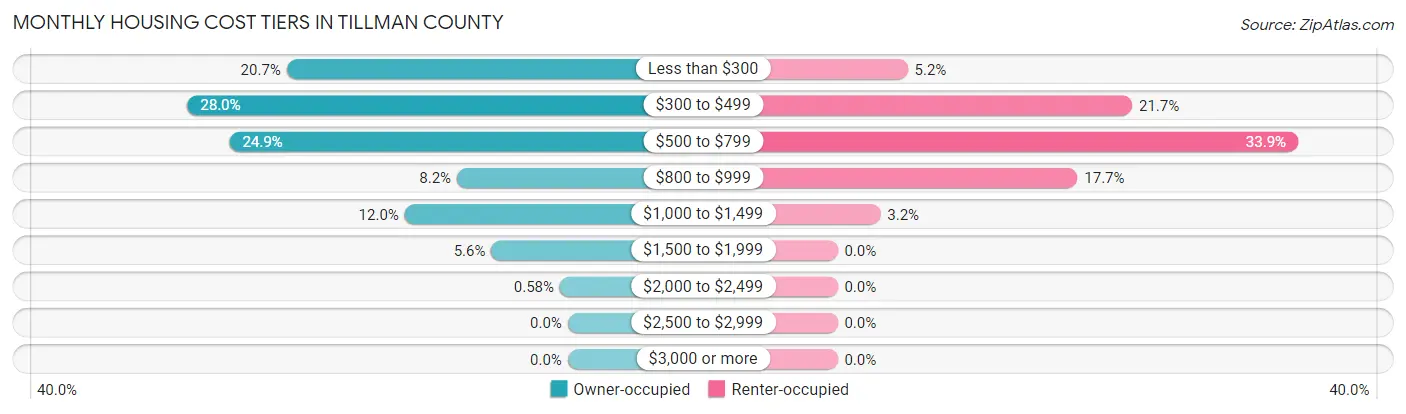
| Monthly Cost | Owner-occupied | Renter-occupied |
| Less than $300 | 393 (20.7%) | 36 (5.2%) |
| $300 to $499 | 532 (28.0%) | 151 (21.7%) |
| $500 to $799 | 473 (24.9%) | 236 (33.9%) |
| $800 to $999 | 155 (8.2%) | 123 (17.7%) |
| $1,000 to $1,499 | 228 (12.0%) | 22 (3.2%) |
| $1,500 to $1,999 | 107 (5.6%) | 0 (0.0%) |
| $2,000 to $2,499 | 11 (0.6%) | 0 (0.0%) |
| $2,500 to $2,999 | 0 (0.0%) | 0 (0.0%) |
| $3,000 or more | 0 (0.0%) | 0 (0.0%) |
| Total | 1,899 (100.0%) | 696 (100.0%) |
Physical Housing Characteristics in Tillman County
Housing Structures in Tillman County
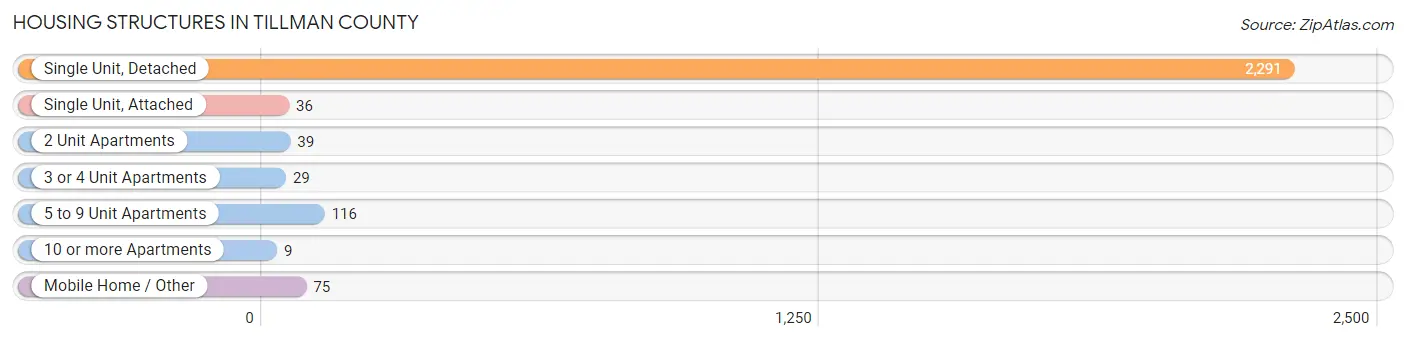
| Structure Type | # Housing Units | % Housing Units |
| Single Unit, Detached | 2,291 | 88.3% |
| Single Unit, Attached | 36 | 1.4% |
| 2 Unit Apartments | 39 | 1.5% |
| 3 or 4 Unit Apartments | 29 | 1.1% |
| 5 to 9 Unit Apartments | 116 | 4.5% |
| 10 or more Apartments | 9 | 0.4% |
| Mobile Home / Other | 75 | 2.9% |
| Total | 2,595 | 100.0% |
Housing Structures by Occupancy in Tillman County
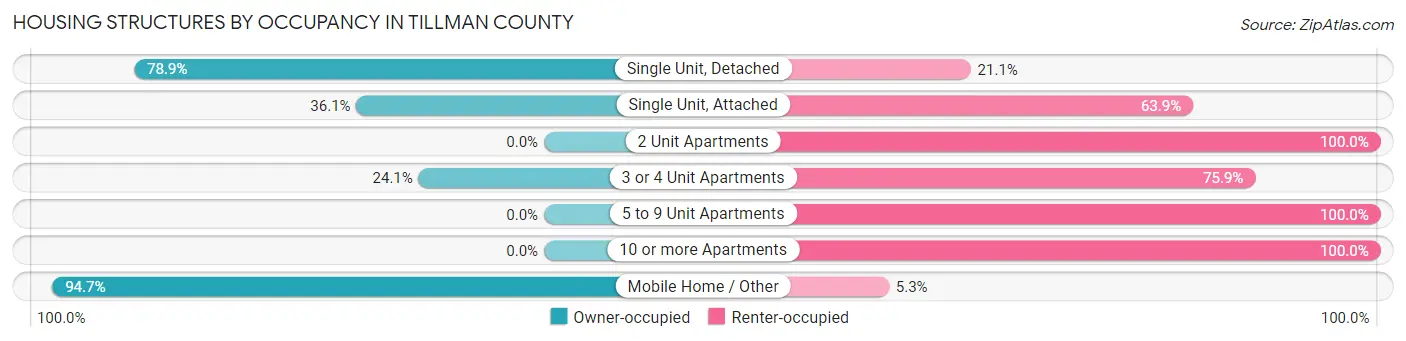
| Structure Type | Owner-occupied | Renter-occupied |
| Single Unit, Detached | 1,808 (78.9%) | 483 (21.1%) |
| Single Unit, Attached | 13 (36.1%) | 23 (63.9%) |
| 2 Unit Apartments | 0 (0.0%) | 39 (100.0%) |
| 3 or 4 Unit Apartments | 7 (24.1%) | 22 (75.9%) |
| 5 to 9 Unit Apartments | 0 (0.0%) | 116 (100.0%) |
| 10 or more Apartments | 0 (0.0%) | 9 (100.0%) |
| Mobile Home / Other | 71 (94.7%) | 4 (5.3%) |
| Total | 1,899 (73.2%) | 696 (26.8%) |
Housing Structures by Number of Rooms in Tillman County
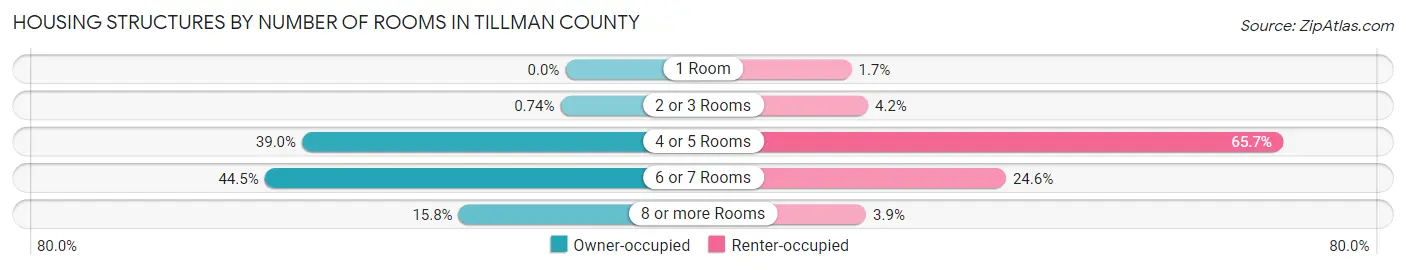
| Number of Rooms | Owner-occupied | Renter-occupied |
| 1 Room | 0 (0.0%) | 12 (1.7%) |
| 2 or 3 Rooms | 14 (0.7%) | 29 (4.2%) |
| 4 or 5 Rooms | 740 (39.0%) | 457 (65.7%) |
| 6 or 7 Rooms | 845 (44.5%) | 171 (24.6%) |
| 8 or more Rooms | 300 (15.8%) | 27 (3.9%) |
| Total | 1,899 (100.0%) | 696 (100.0%) |
Housing Structure by Heating Type in Tillman County
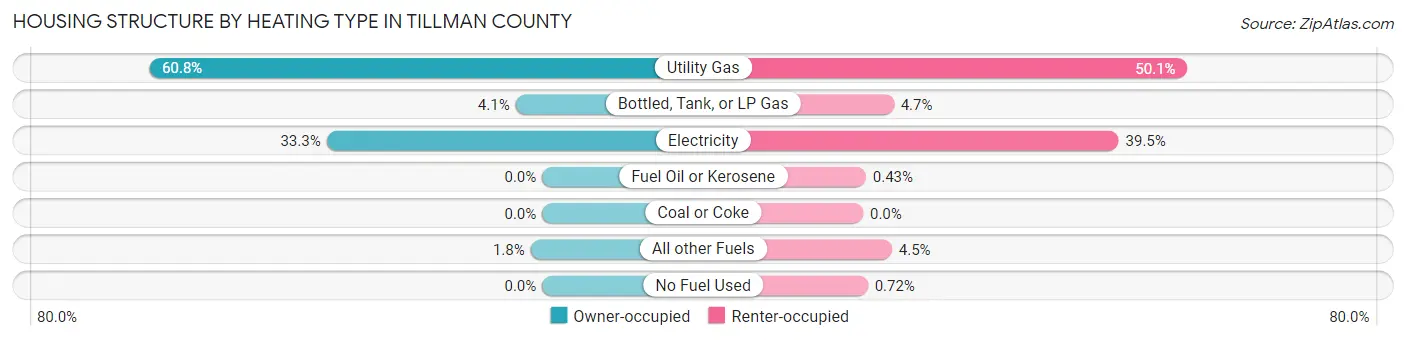
| Heating Type | Owner-occupied | Renter-occupied |
| Utility Gas | 1,154 (60.8%) | 349 (50.1%) |
| Bottled, Tank, or LP Gas | 78 (4.1%) | 33 (4.7%) |
| Electricity | 633 (33.3%) | 275 (39.5%) |
| Fuel Oil or Kerosene | 0 (0.0%) | 3 (0.4%) |
| Coal or Coke | 0 (0.0%) | 0 (0.0%) |
| All other Fuels | 34 (1.8%) | 31 (4.4%) |
| No Fuel Used | 0 (0.0%) | 5 (0.7%) |
| Total | 1,899 (100.0%) | 696 (100.0%) |
Household Vehicle Usage in Tillman County
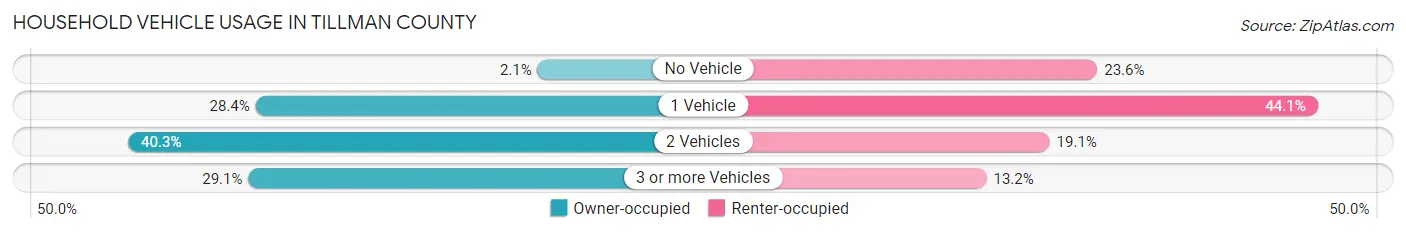
| Vehicles per Household | Owner-occupied | Renter-occupied |
| No Vehicle | 40 (2.1%) | 164 (23.6%) |
| 1 Vehicle | 540 (28.4%) | 307 (44.1%) |
| 2 Vehicles | 766 (40.3%) | 133 (19.1%) |
| 3 or more Vehicles | 553 (29.1%) | 92 (13.2%) |
| Total | 1,899 (100.0%) | 696 (100.0%) |
Real Estate & Mortgages in Tillman County
Real Estate and Mortgage Overview in Tillman County
| Characteristic | Without Mortgage | With Mortgage |
| Housing Units | 1,265 | 634 |
| Median Property Value | $57,300 | $73,800 |
| Median Household Income | $42,022 | $79 |
| Monthly Housing Costs | $396 | $0 |
| Real Estate Taxes | $338 | $0 |
Property Value by Mortgage Status in Tillman County
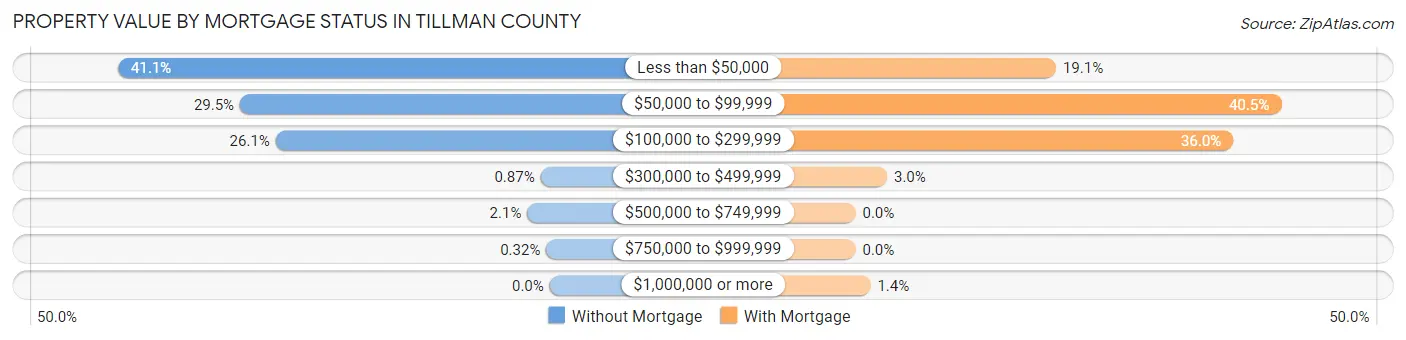
| Property Value | Without Mortgage | With Mortgage |
| Less than $50,000 | 520 (41.1%) | 121 (19.1%) |
| $50,000 to $99,999 | 373 (29.5%) | 257 (40.5%) |
| $100,000 to $299,999 | 330 (26.1%) | 228 (36.0%) |
| $300,000 to $499,999 | 11 (0.9%) | 19 (3.0%) |
| $500,000 to $749,999 | 27 (2.1%) | 0 (0.0%) |
| $750,000 to $999,999 | 4 (0.3%) | 0 (0.0%) |
| $1,000,000 or more | 0 (0.0%) | 9 (1.4%) |
| Total | 1,265 (100.0%) | 634 (100.0%) |
Household Income by Mortgage Status in Tillman County
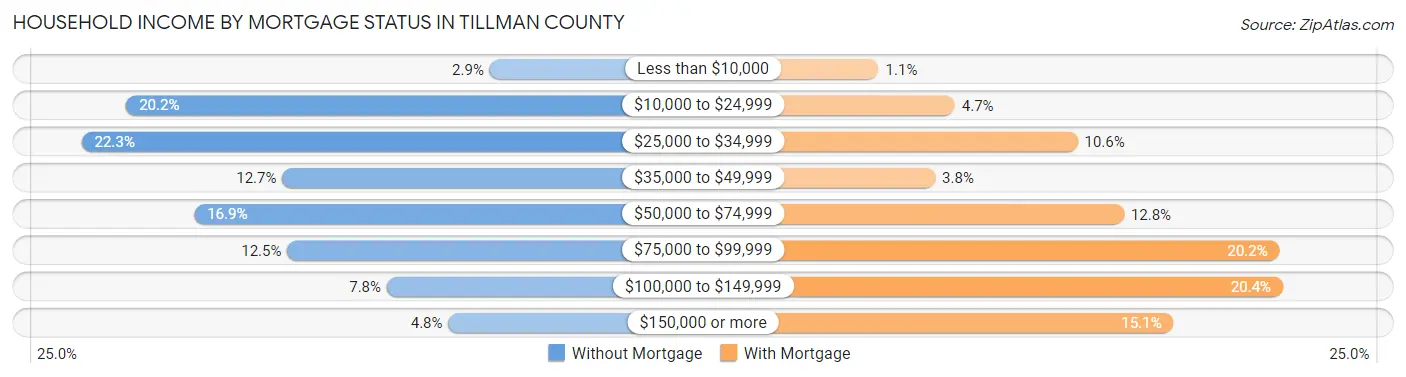
| Household Income | Without Mortgage | With Mortgage |
| Less than $10,000 | 36 (2.9%) | 7 (1.1%) |
| $10,000 to $24,999 | 255 (20.2%) | 30 (4.7%) |
| $25,000 to $34,999 | 282 (22.3%) | 67 (10.6%) |
| $35,000 to $49,999 | 161 (12.7%) | 24 (3.8%) |
| $50,000 to $74,999 | 214 (16.9%) | 81 (12.8%) |
| $75,000 to $99,999 | 158 (12.5%) | 128 (20.2%) |
| $100,000 to $149,999 | 98 (7.7%) | 129 (20.3%) |
| $150,000 or more | 61 (4.8%) | 96 (15.1%) |
| Total | 1,265 (100.0%) | 634 (100.0%) |
Property Value to Household Income Ratio in Tillman County
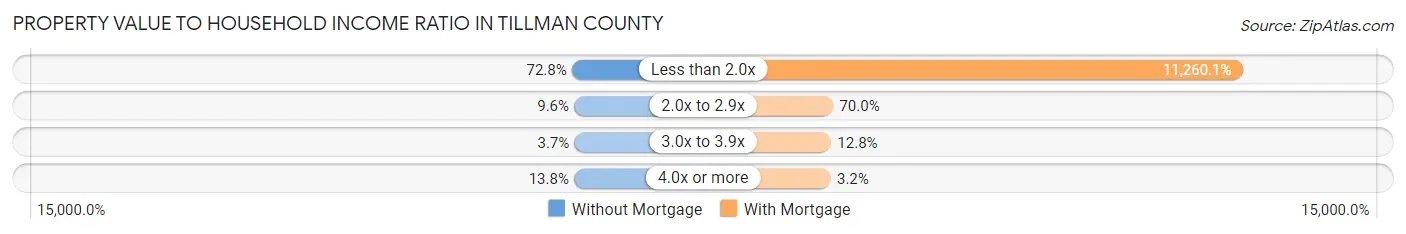
| Value-to-Income Ratio | Without Mortgage | With Mortgage |
| Less than 2.0x | 921 (72.8%) | 71,389 (11,260.1%) |
| 2.0x to 2.9x | 122 (9.6%) | 444 (70.0%) |
| 3.0x to 3.9x | 47 (3.7%) | 81 (12.8%) |
| 4.0x or more | 175 (13.8%) | 20 (3.2%) |
| Total | 1,265 (100.0%) | 634 (100.0%) |
Real Estate Taxes by Mortgage Status in Tillman County
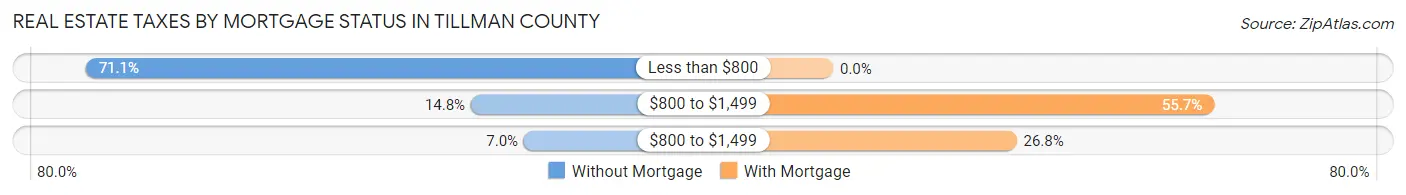
| Property Taxes | Without Mortgage | With Mortgage |
| Less than $800 | 899 (71.1%) | 0 (0.0%) |
| $800 to $1,499 | 187 (14.8%) | 353 (55.7%) |
| $800 to $1,499 | 89 (7.0%) | 170 (26.8%) |
| Total | 1,265 (100.0%) | 634 (100.0%) |
Health & Disability in Tillman County
Health Insurance Coverage by Age in Tillman County
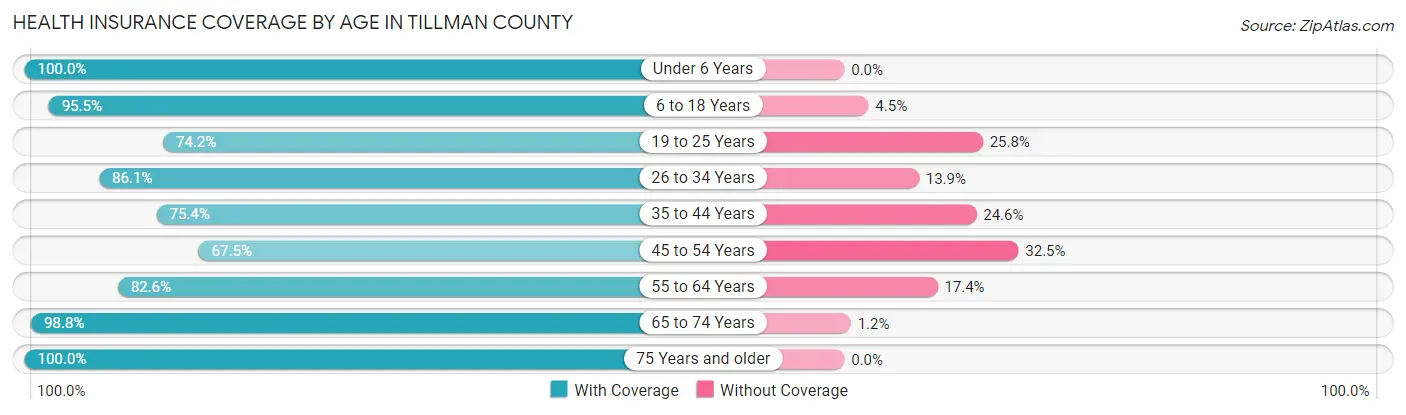
| Age Bracket | With Coverage | Without Coverage |
| Under 6 Years | 499 (100.0%) | 0 (0.0%) |
| 6 to 18 Years | 1,145 (95.5%) | 54 (4.5%) |
| 19 to 25 Years | 414 (74.2%) | 144 (25.8%) |
| 26 to 34 Years | 558 (86.1%) | 90 (13.9%) |
| 35 to 44 Years | 530 (75.4%) | 173 (24.6%) |
| 45 to 54 Years | 543 (67.5%) | 261 (32.5%) |
| 55 to 64 Years | 799 (82.6%) | 168 (17.4%) |
| 65 to 74 Years | 822 (98.8%) | 10 (1.2%) |
| 75 Years and older | 558 (100.0%) | 0 (0.0%) |
| Total | 5,868 (86.7%) | 900 (13.3%) |
Health Insurance Coverage by Citizenship Status in Tillman County
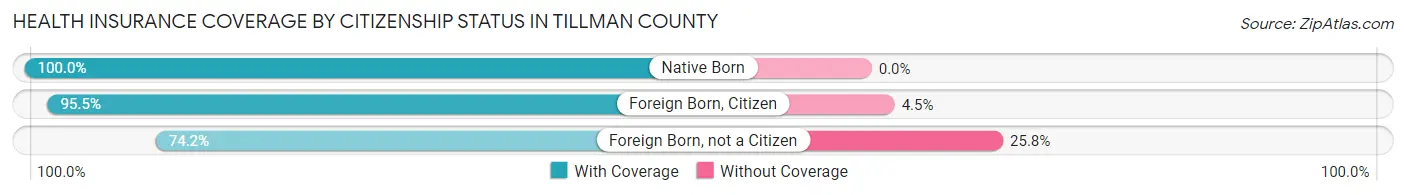
| Citizenship Status | With Coverage | Without Coverage |
| Native Born | 499 (100.0%) | 0 (0.0%) |
| Foreign Born, Citizen | 1,145 (95.5%) | 54 (4.5%) |
| Foreign Born, not a Citizen | 414 (74.2%) | 144 (25.8%) |
Health Insurance Coverage by Household Income in Tillman County
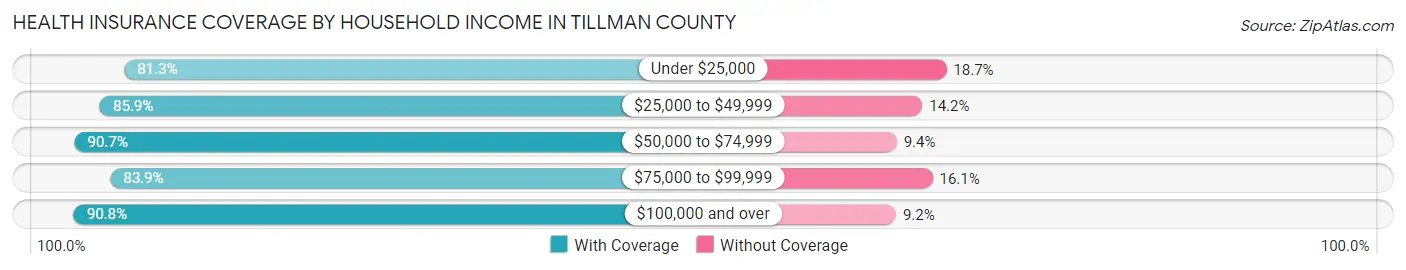
| Household Income | With Coverage | Without Coverage |
| Under $25,000 | 1,002 (81.3%) | 230 (18.7%) |
| $25,000 to $49,999 | 1,383 (85.9%) | 228 (14.1%) |
| $50,000 to $74,999 | 1,193 (90.6%) | 123 (9.3%) |
| $75,000 to $99,999 | 988 (83.9%) | 189 (16.1%) |
| $100,000 and over | 1,270 (90.8%) | 129 (9.2%) |
Public vs Private Health Insurance Coverage by Age in Tillman County
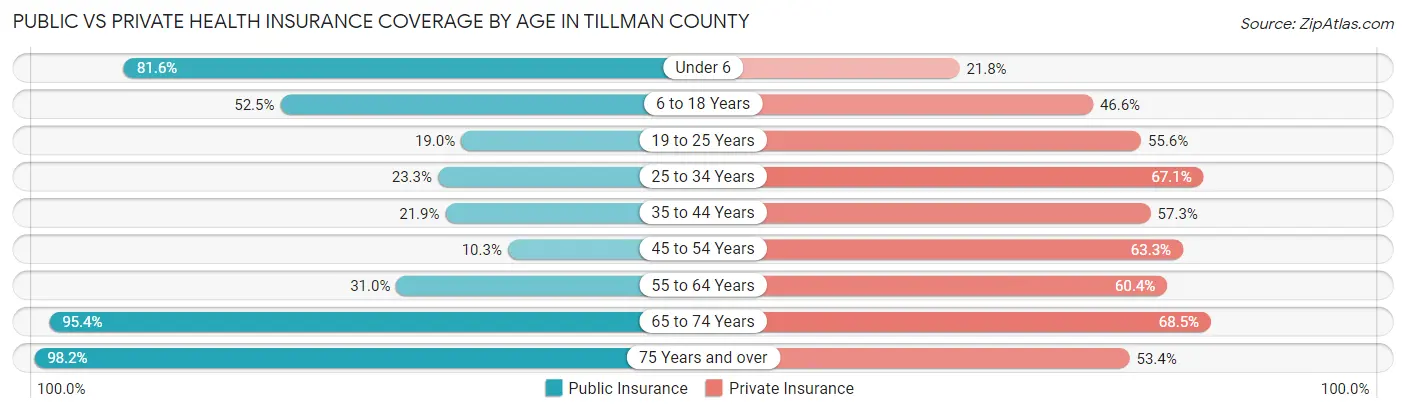
| Age Bracket | Public Insurance | Private Insurance |
| Under 6 | 407 (81.6%) | 109 (21.8%) |
| 6 to 18 Years | 630 (52.5%) | 559 (46.6%) |
| 19 to 25 Years | 106 (19.0%) | 310 (55.6%) |
| 25 to 34 Years | 151 (23.3%) | 435 (67.1%) |
| 35 to 44 Years | 154 (21.9%) | 403 (57.3%) |
| 45 to 54 Years | 83 (10.3%) | 509 (63.3%) |
| 55 to 64 Years | 300 (31.0%) | 584 (60.4%) |
| 65 to 74 Years | 794 (95.4%) | 570 (68.5%) |
| 75 Years and over | 548 (98.2%) | 298 (53.4%) |
| Total | 3,173 (46.9%) | 3,777 (55.8%) |
Disability Status by Sex by Age in Tillman County
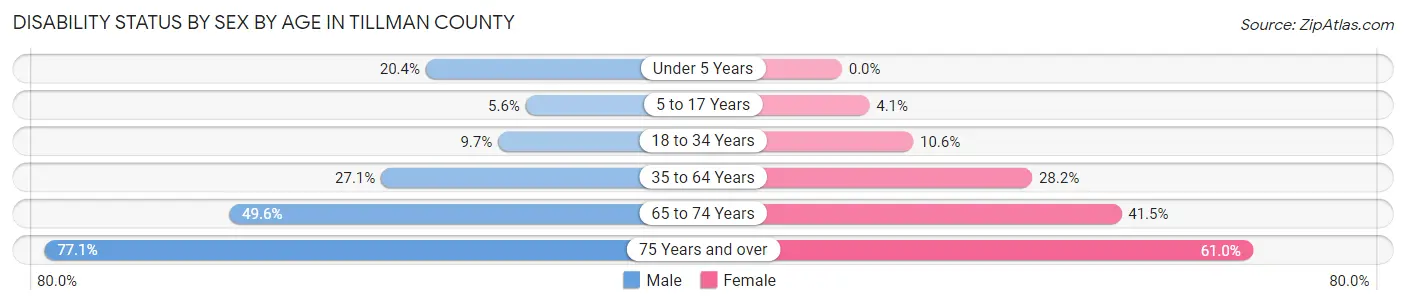
| Age Bracket | Male | Female |
| Under 5 Years | 48 (20.4%) | 0 (0.0%) |
| 5 to 17 Years | 30 (5.6%) | 27 (4.1%) |
| 18 to 34 Years | 61 (9.7%) | 71 (10.6%) |
| 35 to 64 Years | 335 (27.1%) | 349 (28.2%) |
| 65 to 74 Years | 194 (49.6%) | 183 (41.5%) |
| 75 Years and over | 185 (77.1%) | 194 (61.0%) |
Disability Class by Sex by Age in Tillman County
Disability Class: Hearing Difficulty
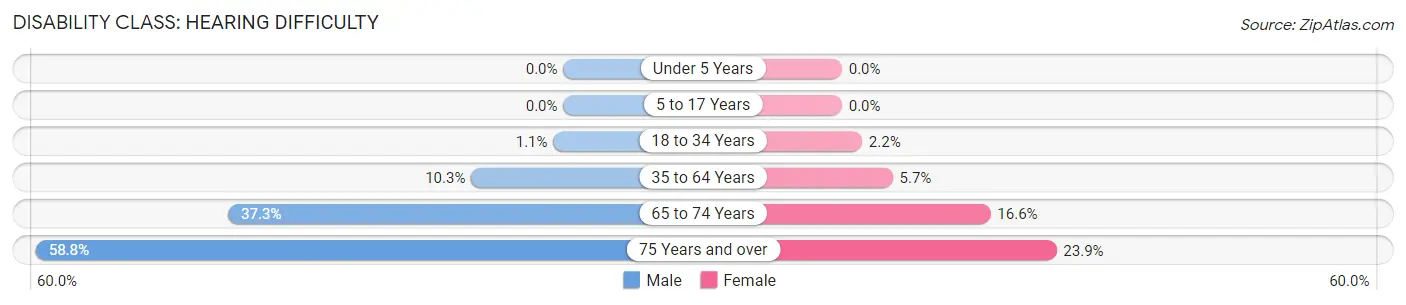
| Age Bracket | Male | Female |
| Under 5 Years | 0 (0.0%) | 0 (0.0%) |
| 5 to 17 Years | 0 (0.0%) | 0 (0.0%) |
| 18 to 34 Years | 7 (1.1%) | 15 (2.2%) |
| 35 to 64 Years | 127 (10.3%) | 70 (5.7%) |
| 65 to 74 Years | 146 (37.3%) | 73 (16.6%) |
| 75 Years and over | 141 (58.8%) | 76 (23.9%) |
Disability Class: Vision Difficulty
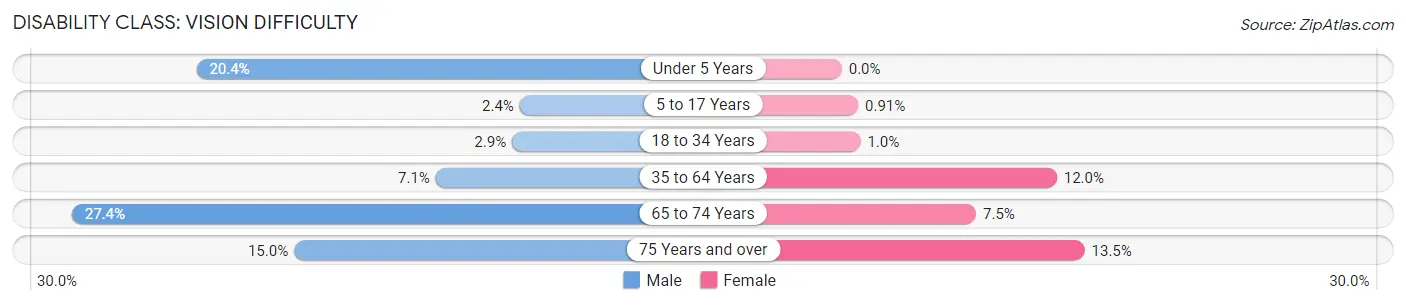
| Age Bracket | Male | Female |
| Under 5 Years | 48 (20.4%) | 0 (0.0%) |
| 5 to 17 Years | 13 (2.4%) | 6 (0.9%) |
| 18 to 34 Years | 18 (2.9%) | 7 (1.0%) |
| 35 to 64 Years | 88 (7.1%) | 148 (12.0%) |
| 65 to 74 Years | 107 (27.4%) | 33 (7.5%) |
| 75 Years and over | 36 (15.0%) | 43 (13.5%) |
Disability Class: Cognitive Difficulty
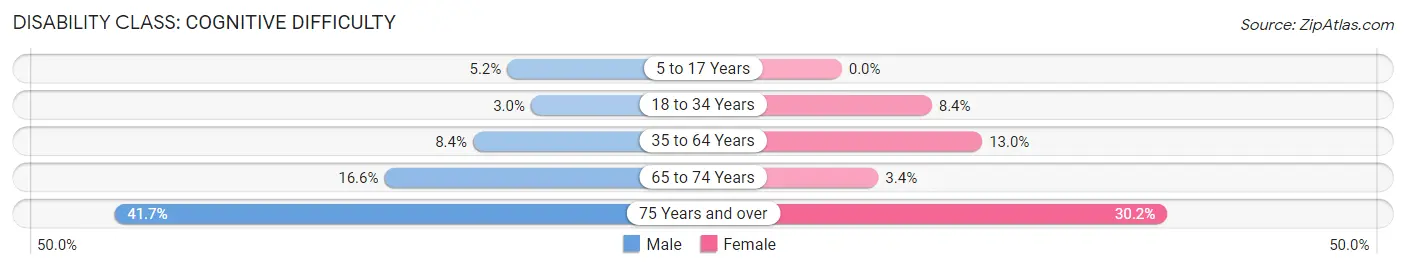
| Age Bracket | Male | Female |
| 5 to 17 Years | 28 (5.2%) | 0 (0.0%) |
| 18 to 34 Years | 19 (3.0%) | 56 (8.4%) |
| 35 to 64 Years | 104 (8.4%) | 161 (13.0%) |
| 65 to 74 Years | 65 (16.6%) | 15 (3.4%) |
| 75 Years and over | 100 (41.7%) | 96 (30.2%) |
Disability Class: Ambulatory Difficulty
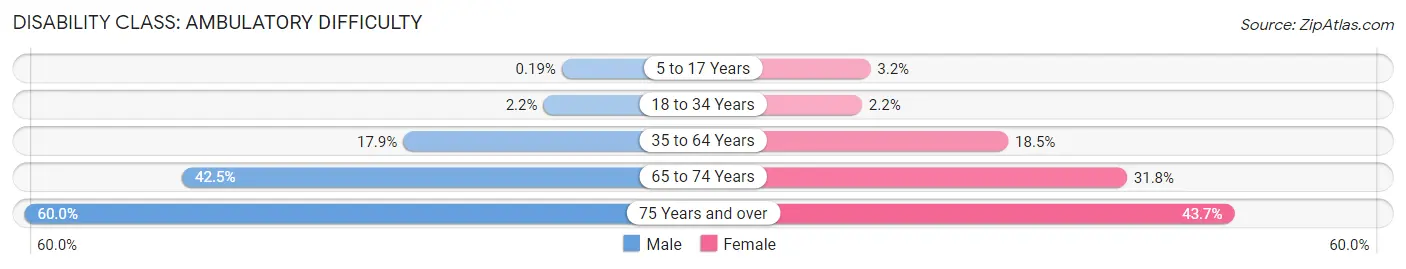
| Age Bracket | Male | Female |
| 5 to 17 Years | 1 (0.2%) | 21 (3.2%) |
| 18 to 34 Years | 14 (2.2%) | 15 (2.2%) |
| 35 to 64 Years | 221 (17.8%) | 229 (18.5%) |
| 65 to 74 Years | 166 (42.5%) | 140 (31.8%) |
| 75 Years and over | 144 (60.0%) | 139 (43.7%) |
Disability Class: Self-Care Difficulty
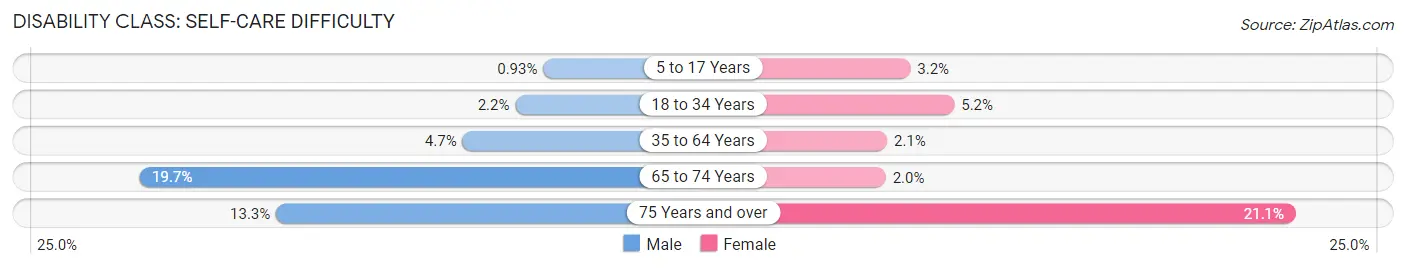
| Age Bracket | Male | Female |
| 5 to 17 Years | 5 (0.9%) | 21 (3.2%) |
| 18 to 34 Years | 14 (2.2%) | 35 (5.2%) |
| 35 to 64 Years | 58 (4.7%) | 26 (2.1%) |
| 65 to 74 Years | 77 (19.7%) | 9 (2.0%) |
| 75 Years and over | 32 (13.3%) | 67 (21.1%) |
Technology Access in Tillman County
Computing Device Access in Tillman County
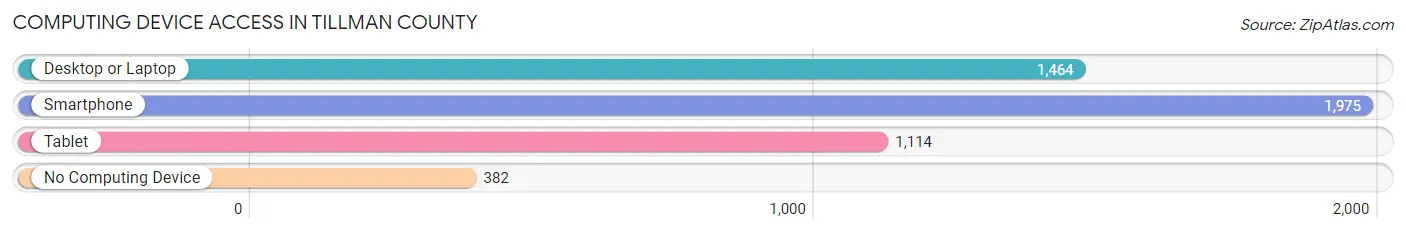
| Device Type | # Households | % Households |
| Desktop or Laptop | 1,464 | 56.4% |
| Smartphone | 1,975 | 76.1% |
| Tablet | 1,114 | 42.9% |
| No Computing Device | 382 | 14.7% |
| Total | 2,595 | 100.0% |
Internet Access in Tillman County
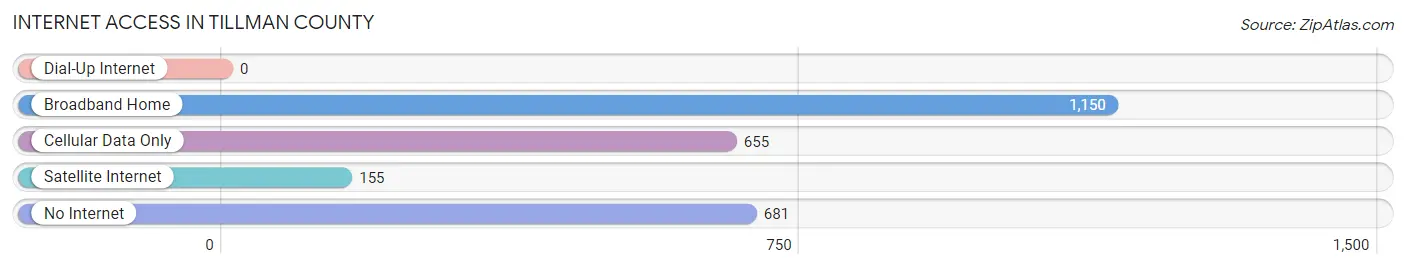
| Internet Type | # Households | % Households |
| Dial-Up Internet | 0 | 0.0% |
| Broadband Home | 1,150 | 44.3% |
| Cellular Data Only | 655 | 25.2% |
| Satellite Internet | 155 | 6.0% |
| No Internet | 681 | 26.2% |
| Total | 2,595 | 100.0% |
Tillman County Summary
Tillman County is located in southwestern Oklahoma, and is bordered by Cotton County to the north, Jackson County to the east, Greer County to the south, and Harmon County to the west. The county seat is Frederick, and the county was named for Robert M. Tillman, a former Oklahoma state senator. As of the 2010 census, the population of Tillman County was 7,992.
Geography
Tillman County covers an area of 845 square miles, and is located in the Red Bed Plains region of Oklahoma. The terrain is mostly flat, with some rolling hills in the northern part of the county. The county is drained by the North Fork of the Red River, which flows through the center of the county. The county is also home to several small lakes, including Lake Frederick, Lake Tipton, and Lake Kemp.
Climate
Tillman County has a humid subtropical climate, with hot summers and mild winters. The average annual temperature is 64°F, and the average annual precipitation is 33 inches.
Economy
Tillman County’s economy is largely based on agriculture. The county’s main crops are wheat, sorghum, corn, and hay. Livestock production is also important, with cattle, hogs, and poultry being the main animals raised. The county also has some oil and gas production, as well as some manufacturing.
Demographics
As of the 2010 census, the population of Tillman County was 7,992, with a population density of 9.4 people per square mile. The racial makeup of the county was 87.3% White, 0.7% African American, 8.2% Native American, 0.2% Asian, 0.1% Pacific Islander, 0.7% from other races, and 2.9% from two or more races. Hispanic or Latino of any race were 3.2% of the population.
The median income for a household in the county was $31,945, and the median income for a family was $37,917. The per capita income for the county was $15,845. About 16.2% of the population was below the poverty line.
Education
Tillman County is served by the Tillman County Public Schools, which includes four elementary schools, one middle school, and one high school. The county also has one private school, Frederick Christian Academy.
Conclusion
Tillman County is a rural county located in southwestern Oklahoma. The county is largely agricultural, with wheat, sorghum, corn, and hay being the main crops. The county also has some oil and gas production, as well as some manufacturing. The population of Tillman County is 7,992, and the county is served by the Tillman County Public Schools.
Common Questions
What is Per Capita Income in Tillman County?
Per Capita income in Tillman County is $23,729.
What is the Median Family Income in Tillman County?
Median Family Income in Tillman County is $57,353.
What is the Median Household income in Tillman County?
Median Household Income in Tillman County is $46,306.
What is Income or Wage Gap in Tillman County?
Income or Wage Gap in Tillman County is 16.6%.
Women in Tillman County earn 83.4 cents for every dollar earned by a man.
What is Family Income Deficit in Tillman County?
Family Income Deficit in Tillman County is $11,955.
Families that are below poverty line in Tillman County earn $11,955 less on average than the poverty threshold level.
What is Inequality or Gini Index in Tillman County?
Inequality or Gini Index in Tillman County is 0.43.
What is the Total Population of Tillman County?
Total Population of Tillman County is 7,013.
What is the Total Male Population of Tillman County?
Total Male Population of Tillman County is 3,477.
What is the Total Female Population of Tillman County?
Total Female Population of Tillman County is 3,536.
What is the Ratio of Males per 100 Females in Tillman County?
There are 98.33 Males per 100 Females in Tillman County.
What is the Ratio of Females per 100 Males in Tillman County?
There are 101.70 Females per 100 Males in Tillman County.
What is the Median Population Age in Tillman County?
Median Population Age in Tillman County is 40.8 Years.
What is the Average Family Size in Tillman County
Average Family Size in Tillman County is 3.4 People.
What is the Average Household Size in Tillman County
Average Household Size in Tillman County is 2.6 People.
How Large is the Labor Force in Tillman County?
There are 2,968 People in the Labor Forcein in Tillman County.
What is the Percentage of People in the Labor Force in Tillman County?
53.3% of People are in the Labor Force in Tillman County.
What is the Unemployment Rate in Tillman County?
Unemployment Rate in Tillman County is 5.9%.