Seminole County, OK Map & Demographics
Seminole County Map
Seminole County Overview
$23,137
PER CAPITA INCOME
$51,352
AVG FAMILY INCOME
$43,239
AVG HOUSEHOLD INCOME
29.5%
WAGE / INCOME GAP [ % ]
70.5¢/ $1
WAGE / INCOME GAP [ $ ]
$11,676
FAMILY INCOME DEFICIT
0.46
INEQUALITY / GINI INDEX
23,592
TOTAL POPULATION
11,650
MALE POPULATION
11,942
FEMALE POPULATION
97.55
MALES / 100 FEMALES
102.51
FEMALES / 100 MALES
38.9
MEDIAN AGE
3.3
AVG FAMILY SIZE
2.7
AVG HOUSEHOLD SIZE
9,172
LABOR FORCE [ PEOPLE ]
49.5%
PERCENT IN LABOR FORCE
7.2%
UNEMPLOYMENT RATE
Income in Seminole County
Income Overview in Seminole County
Per Capita Income in Seminole County is $23,137, while median incomes of families and households are $51,352 and $43,239 respectively.
| Characteristic | Number | Measure |
| Per Capita Income | 23,592 | $23,137 |
| Median Family Income | 5,749 | $51,352 |
| Mean Family Income | 5,749 | $66,050 |
| Median Household Income | 8,536 | $43,239 |
| Mean Household Income | 8,536 | $57,878 |
| Income Deficit | 5,749 | $11,676 |
| Wage / Income Gap (%) | 23,592 | 29.53% |
| Wage / Income Gap ($) | 23,592 | 70.47¢ per $1 |
| Gini / Inequality Index | 23,592 | 0.46 |
Earnings by Sex in Seminole County
Average Earnings in Seminole County are $31,422, $36,768 for men and $25,910 for women, a difference of 29.5%.
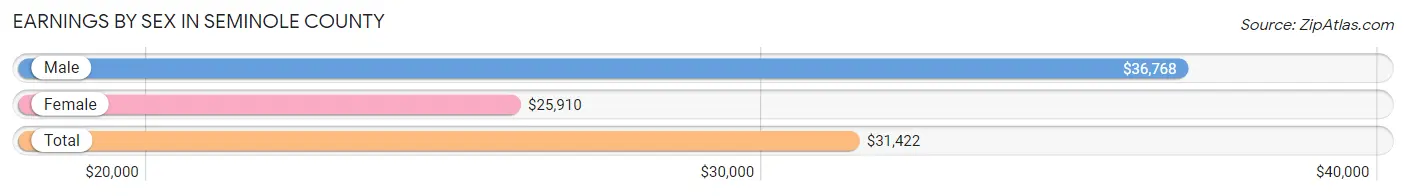
| Sex | Number | Average Earnings |
| Male | 5,181 (53.8%) | $36,768 |
| Female | 4,447 (46.2%) | $25,910 |
| Total | 9,628 (100.0%) | $31,422 |
Earnings by Sex by Income Bracket in Seminole County
The most common earnings brackets in Seminole County are $75,000 to $99,999 for men (484 | 9.3%) and $25,000 to $29,999 for women (427 | 9.6%).
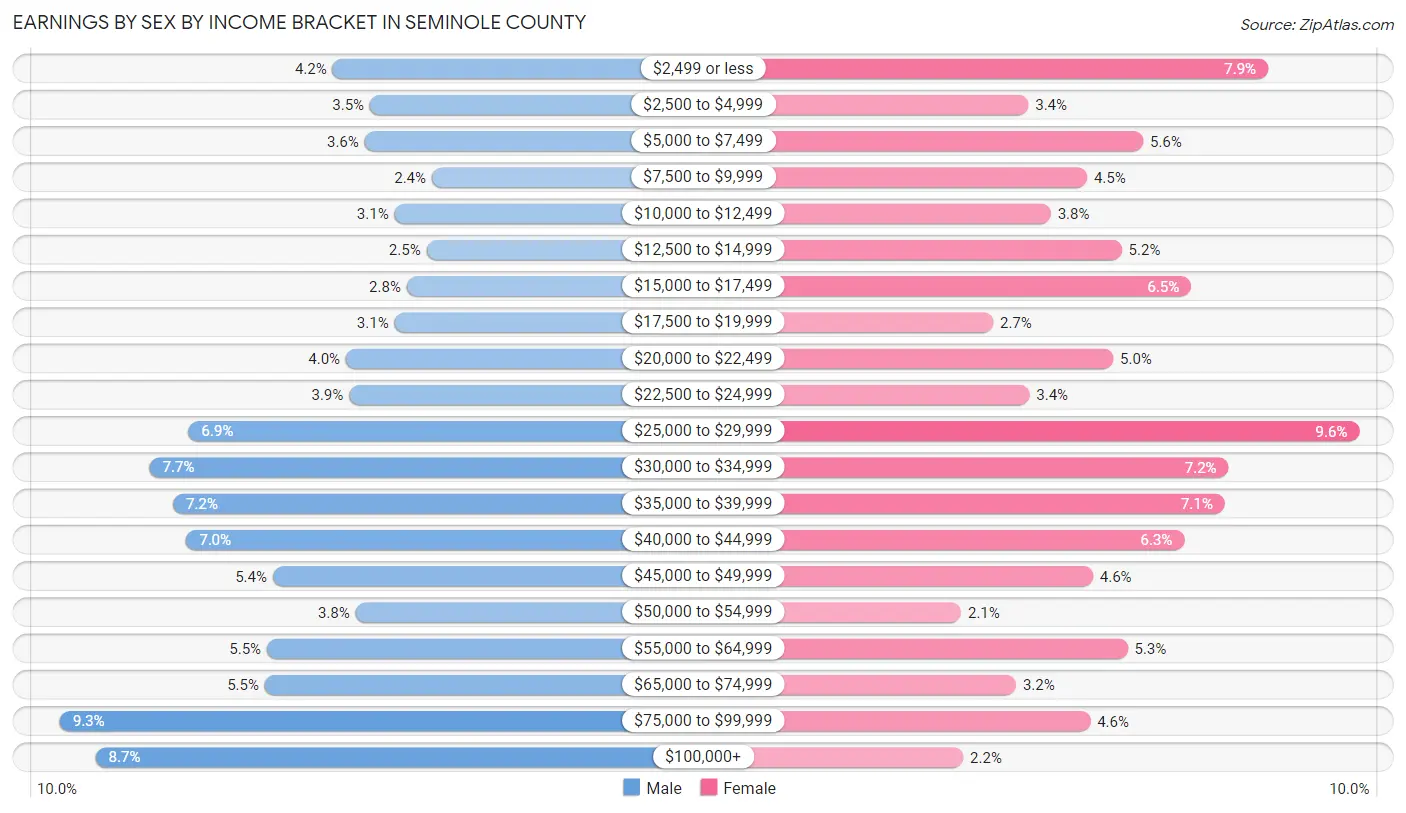
| Income | Male | Female |
| $2,499 or less | 219 (4.2%) | 351 (7.9%) |
| $2,500 to $4,999 | 183 (3.5%) | 151 (3.4%) |
| $5,000 to $7,499 | 188 (3.6%) | 247 (5.6%) |
| $7,500 to $9,999 | 123 (2.4%) | 200 (4.5%) |
| $10,000 to $12,499 | 159 (3.1%) | 170 (3.8%) |
| $12,500 to $14,999 | 128 (2.5%) | 229 (5.1%) |
| $15,000 to $17,499 | 147 (2.8%) | 287 (6.5%) |
| $17,500 to $19,999 | 159 (3.1%) | 122 (2.7%) |
| $20,000 to $22,499 | 206 (4.0%) | 222 (5.0%) |
| $22,500 to $24,999 | 203 (3.9%) | 152 (3.4%) |
| $25,000 to $29,999 | 359 (6.9%) | 427 (9.6%) |
| $30,000 to $34,999 | 397 (7.7%) | 318 (7.1%) |
| $35,000 to $39,999 | 374 (7.2%) | 315 (7.1%) |
| $40,000 to $44,999 | 361 (7.0%) | 281 (6.3%) |
| $45,000 to $49,999 | 277 (5.3%) | 205 (4.6%) |
| $50,000 to $54,999 | 197 (3.8%) | 95 (2.1%) |
| $55,000 to $64,999 | 283 (5.5%) | 234 (5.3%) |
| $65,000 to $74,999 | 285 (5.5%) | 141 (3.2%) |
| $75,000 to $99,999 | 484 (9.3%) | 203 (4.6%) |
| $100,000+ | 449 (8.7%) | 97 (2.2%) |
| Total | 5,181 (100.0%) | 4,447 (100.0%) |
Earnings by Sex by Educational Attainment in Seminole County
Average earnings in Seminole County are $40,163 for men and $30,073 for women, a difference of 25.1%. Men with an educational attainment of graduate degree enjoy the highest average annual earnings of $57,375, while those with less than high school education earn the least with $26,500. Women with an educational attainment of graduate degree earn the most with the average annual earnings of $52,778, while those with less than high school education have the smallest earnings of $19,489.
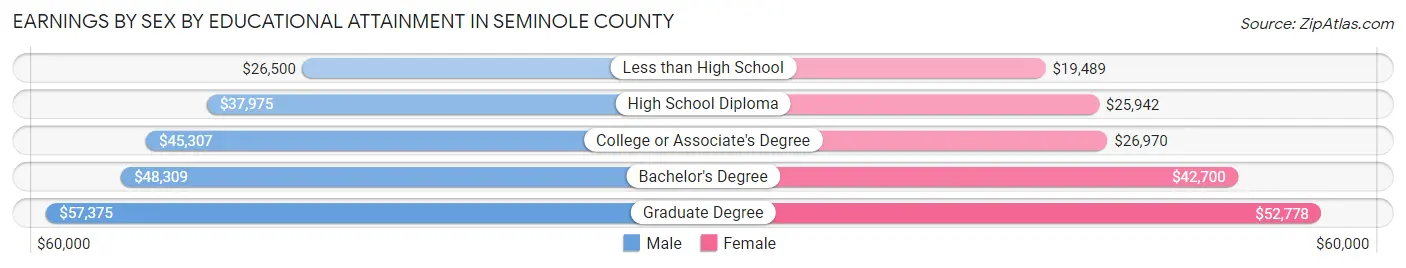
| Educational Attainment | Male Income | Female Income |
| Less than High School | $26,500 | $19,489 |
| High School Diploma | $37,975 | $25,942 |
| College or Associate's Degree | $45,307 | $26,970 |
| Bachelor's Degree | $48,309 | $42,700 |
| Graduate Degree | $57,375 | $52,778 |
| Total | $40,163 | $30,073 |
Family Income in Seminole County
Family Income Brackets in Seminole County
According to the Seminole County family income data, there are 1,133 families falling into the $50,000 to $74,999 income range, which is the most common income bracket and makes up 19.7% of all families. Conversely, the $200,000+ income bracket is the least frequent group with only 138 families (2.4%) belonging to this category.
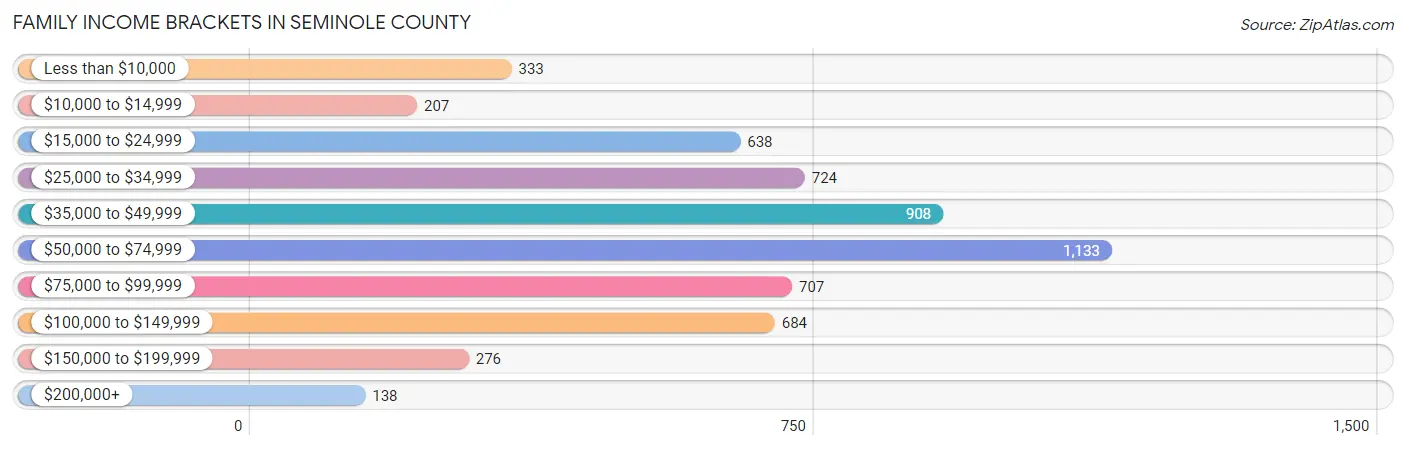
| Income Bracket | # Families | % Families |
| Less than $10,000 | 333 | 5.8% |
| $10,000 to $14,999 | 207 | 3.6% |
| $15,000 to $24,999 | 638 | 11.1% |
| $25,000 to $34,999 | 724 | 12.6% |
| $35,000 to $49,999 | 908 | 15.8% |
| $50,000 to $74,999 | 1,133 | 19.7% |
| $75,000 to $99,999 | 707 | 12.3% |
| $100,000 to $149,999 | 684 | 11.9% |
| $150,000 to $199,999 | 276 | 4.8% |
| $200,000+ | 138 | 2.4% |
Family Income by Famaliy Size in Seminole County
7+ person families (162 | 2.8%) account for the highest median family income in Seminole County with $73,333 per family, while 2-person families (2,692 | 46.8%) have the highest median income of $25,396 per family member.
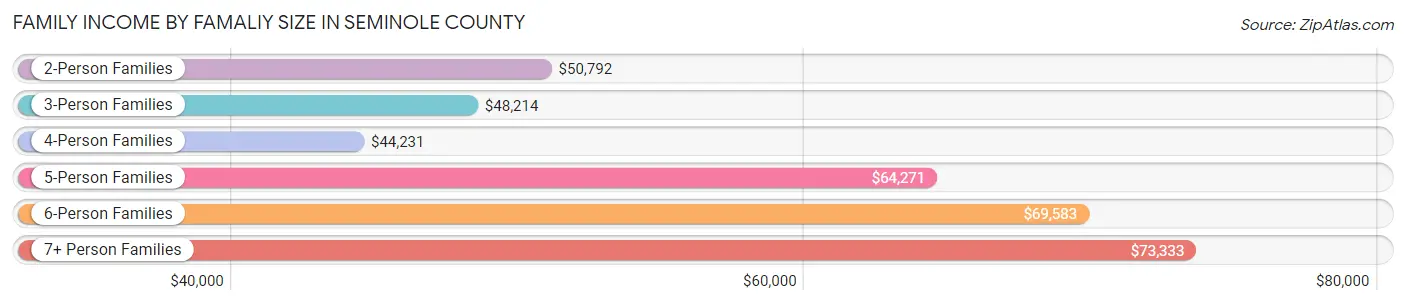
| Income Bracket | # Families | Median Income |
| 2-Person Families | 2,692 (46.8%) | $50,792 |
| 3-Person Families | 1,194 (20.8%) | $48,214 |
| 4-Person Families | 980 (17.1%) | $44,231 |
| 5-Person Families | 488 (8.5%) | $64,271 |
| 6-Person Families | 233 (4.1%) | $69,583 |
| 7+ Person Families | 162 (2.8%) | $73,333 |
| Total | 5,749 (100.0%) | $51,352 |
Family Income by Number of Earners in Seminole County
The median family income in Seminole County is $51,352, with families comprising 3+ earners (371) having the highest median family income of $112,841, while families with no earners (1,480) have the lowest median family income of $27,397, accounting for 6.5% and 25.7% of families, respectively.
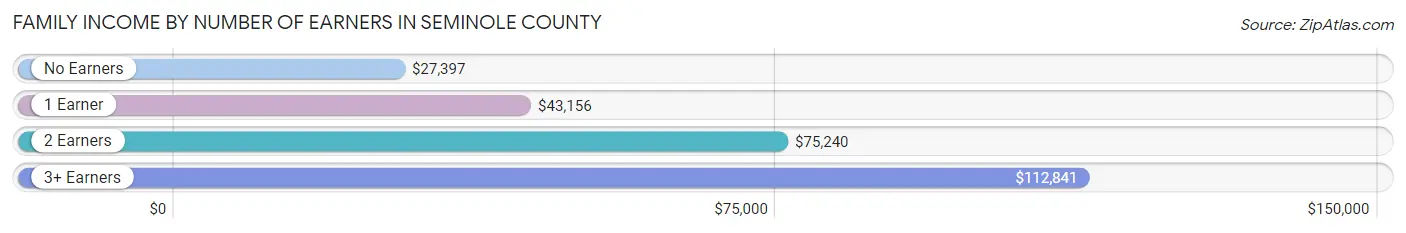
| Number of Earners | # Families | Median Income |
| No Earners | 1,480 (25.7%) | $27,397 |
| 1 Earner | 2,200 (38.3%) | $43,156 |
| 2 Earners | 1,698 (29.5%) | $75,240 |
| 3+ Earners | 371 (6.5%) | $112,841 |
| Total | 5,749 (100.0%) | $51,352 |
Household Income in Seminole County
Household Income Brackets in Seminole County
With 1,554 households falling in the category, the $50,000 to $74,999 income range is the most frequent in Seminole County, accounting for 18.2% of all households. In contrast, only 162 households (1.9%) fall into the $200,000+ income bracket, making it the least populous group.
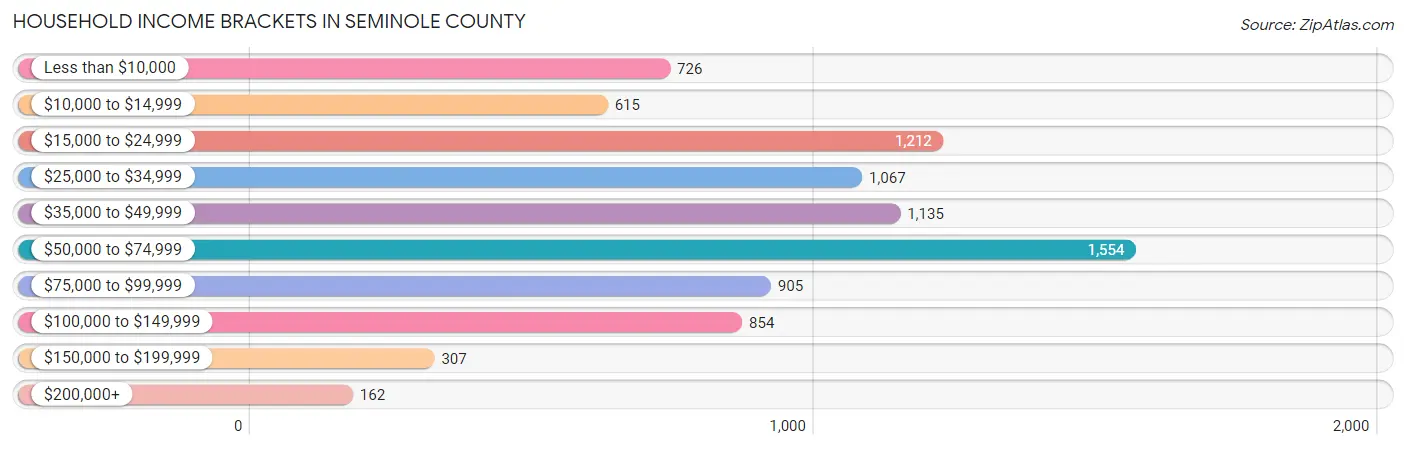
| Income Bracket | # Households | % Households |
| Less than $10,000 | 726 | 8.5% |
| $10,000 to $14,999 | 615 | 7.2% |
| $15,000 to $24,999 | 1,212 | 14.2% |
| $25,000 to $34,999 | 1,067 | 12.5% |
| $35,000 to $49,999 | 1,135 | 13.3% |
| $50,000 to $74,999 | 1,554 | 18.2% |
| $75,000 to $99,999 | 905 | 10.6% |
| $100,000 to $149,999 | 854 | 10.0% |
| $150,000 to $199,999 | 307 | 3.6% |
| $200,000+ | 162 | 1.9% |
Household Income by Householder Age in Seminole County
The median household income in Seminole County is $43,239, with the highest median household income of $47,662 found in the 45 to 64 years age bracket for the primary householder. A total of 3,035 households (35.6%) fall into this category. Meanwhile, the 15 to 24 years age bracket for the primary householder has the lowest median household income of $29,531, with 301 households (3.5%) in this group.
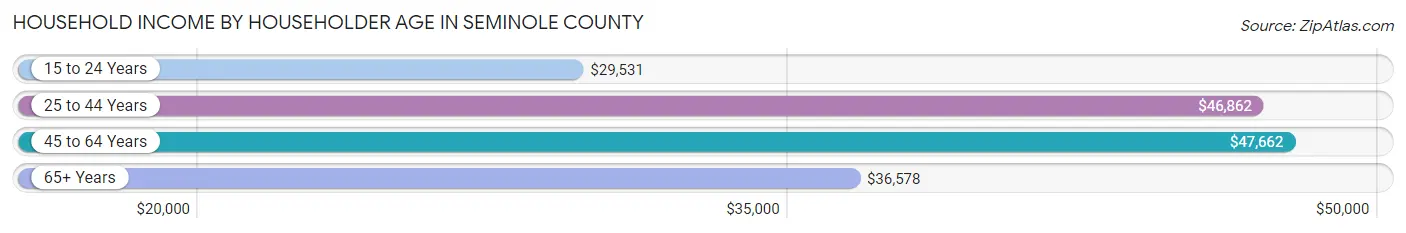
| Income Bracket | # Households | Median Income |
| 15 to 24 Years | 301 (3.5%) | $29,531 |
| 25 to 44 Years | 2,447 (28.7%) | $46,862 |
| 45 to 64 Years | 3,035 (35.6%) | $47,662 |
| 65+ Years | 2,753 (32.3%) | $36,578 |
| Total | 8,536 (100.0%) | $43,239 |
Poverty in Seminole County
Income Below Poverty by Sex and Age in Seminole County
With 20.3% poverty level for males and 25.0% for females among the residents of Seminole County, under 5 year old males and 12 to 14 year old females are the most vulnerable to poverty, with 255 males (36.1%) and 178 females (37.7%) in their respective age groups living below the poverty level.
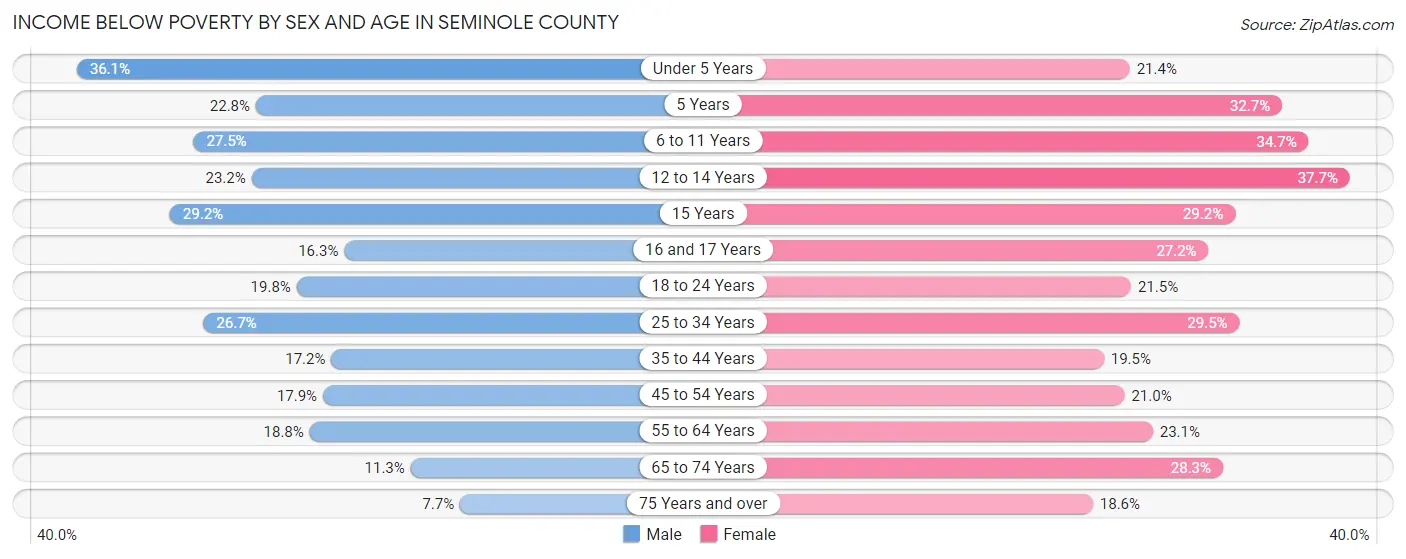
| Age Bracket | Male | Female |
| Under 5 Years | 255 (36.1%) | 146 (21.4%) |
| 5 Years | 29 (22.8%) | 50 (32.7%) |
| 6 to 11 Years | 287 (27.5%) | 316 (34.6%) |
| 12 to 14 Years | 116 (23.2%) | 178 (37.7%) |
| 15 Years | 52 (29.2%) | 54 (29.2%) |
| 16 and 17 Years | 54 (16.3%) | 95 (27.2%) |
| 18 to 24 Years | 215 (19.8%) | 196 (21.5%) |
| 25 to 34 Years | 357 (26.7%) | 390 (29.5%) |
| 35 to 44 Years | 219 (17.2%) | 277 (19.5%) |
| 45 to 54 Years | 246 (17.8%) | 283 (21.0%) |
| 55 to 64 Years | 283 (18.8%) | 362 (23.1%) |
| 65 to 74 Years | 127 (11.3%) | 344 (28.3%) |
| 75 Years and over | 59 (7.7%) | 170 (18.6%) |
| Total | 2,299 (20.3%) | 2,861 (25.0%) |
Income Above Poverty by Sex and Age in Seminole County
According to the poverty statistics in Seminole County, males aged 75 years and over and females aged 75 years and over are the age groups that are most secure financially, with 92.3% of males and 81.4% of females in these age groups living above the poverty line.
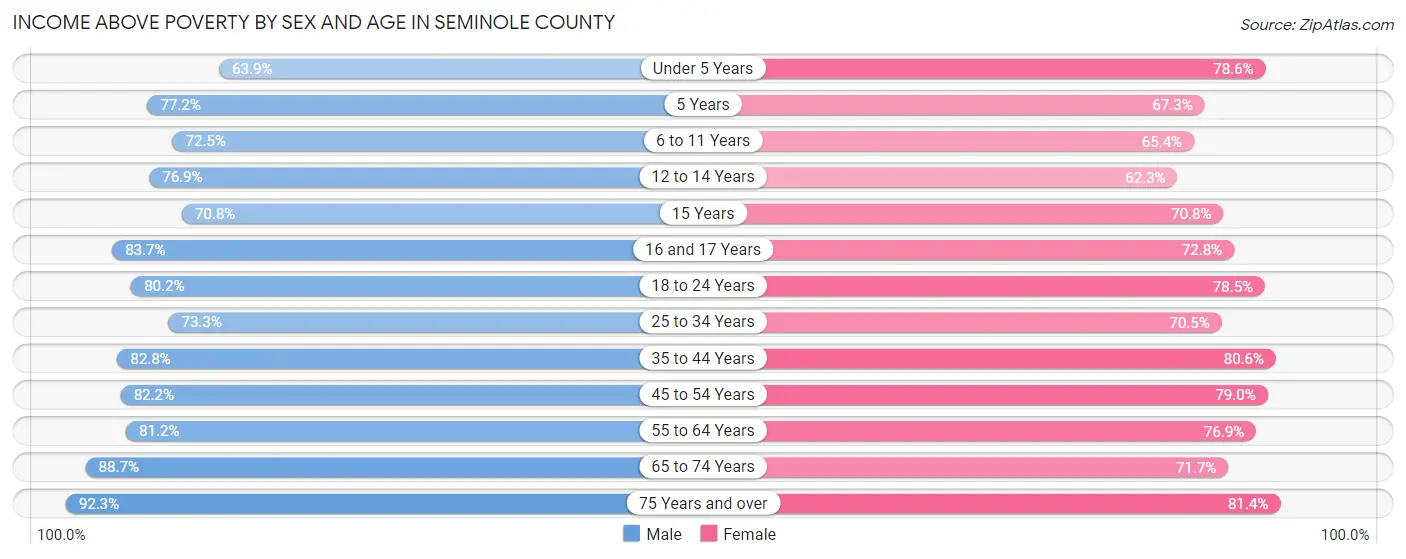
| Age Bracket | Male | Female |
| Under 5 Years | 451 (63.9%) | 537 (78.6%) |
| 5 Years | 98 (77.2%) | 103 (67.3%) |
| 6 to 11 Years | 758 (72.5%) | 596 (65.3%) |
| 12 to 14 Years | 385 (76.8%) | 294 (62.3%) |
| 15 Years | 126 (70.8%) | 131 (70.8%) |
| 16 and 17 Years | 278 (83.7%) | 254 (72.8%) |
| 18 to 24 Years | 871 (80.2%) | 717 (78.5%) |
| 25 to 34 Years | 979 (73.3%) | 931 (70.5%) |
| 35 to 44 Years | 1,052 (82.8%) | 1,147 (80.5%) |
| 45 to 54 Years | 1,132 (82.2%) | 1,065 (79.0%) |
| 55 to 64 Years | 1,219 (81.2%) | 1,206 (76.9%) |
| 65 to 74 Years | 993 (88.7%) | 872 (71.7%) |
| 75 Years and over | 710 (92.3%) | 742 (81.4%) |
| Total | 9,052 (79.7%) | 8,595 (75.0%) |
Income Below Poverty Among Married-Couple Families in Seminole County
The poverty statistics for married-couple families in Seminole County show that 10.9% or 416 of the total 3,810 families live below the poverty line. Families with 5 or more children have the highest poverty rate of 41.1%, comprising of 37 families. On the other hand, families with no children have the lowest poverty rate of 7.1%, which includes 153 families.
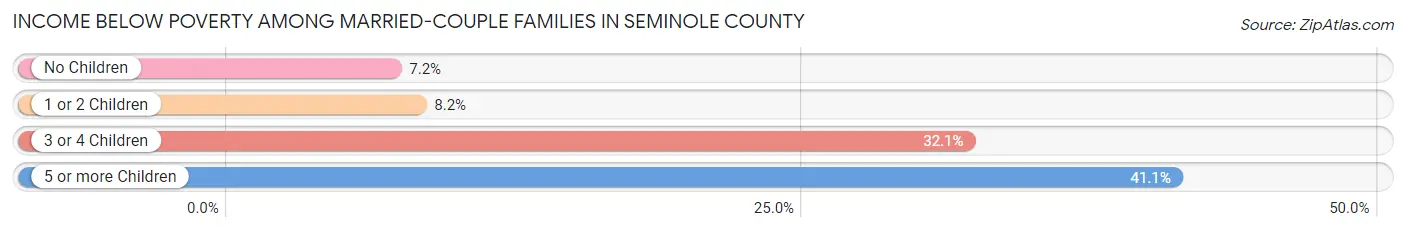
| Children | Above Poverty | Below Poverty |
| No Children | 1,988 (92.8%) | 153 (7.1%) |
| 1 or 2 Children | 1,080 (91.8%) | 97 (8.2%) |
| 3 or 4 Children | 273 (67.9%) | 129 (32.1%) |
| 5 or more Children | 53 (58.9%) | 37 (41.1%) |
| Total | 3,394 (89.1%) | 416 (10.9%) |
Income Below Poverty Among Single-Parent Households in Seminole County
According to the poverty data in Seminole County, 20.0% or 108 single-father households and 44.0% or 616 single-mother households are living below the poverty line. Among single-father households, those with no children have the highest poverty rate, with 60 households (23.0%) experiencing poverty. Likewise, among single-mother households, those with 3 or 4 children have the highest poverty rate, with 114 households (62.0%) falling below the poverty line.
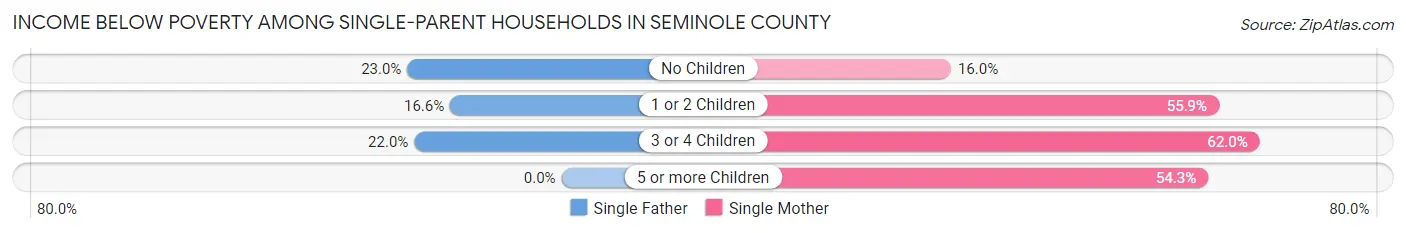
| Children | Single Father | Single Mother |
| No Children | 60 (23.0%) | 71 (16.0%) |
| 1 or 2 Children | 39 (16.6%) | 412 (55.9%) |
| 3 or 4 Children | 9 (22.0%) | 114 (62.0%) |
| 5 or more Children | 0 (0.0%) | 19 (54.3%) |
| Total | 108 (20.0%) | 616 (44.0%) |
Income Below Poverty Among Married-Couple vs Single-Parent Households in Seminole County
The poverty data for Seminole County shows that 416 of the married-couple family households (10.9%) and 724 of the single-parent households (37.3%) are living below the poverty level. Within the married-couple family households, those with 5 or more children have the highest poverty rate, with 37 households (41.1%) falling below the poverty line. Among the single-parent households, those with 3 or 4 children have the highest poverty rate, with 123 household (54.7%) living below poverty.
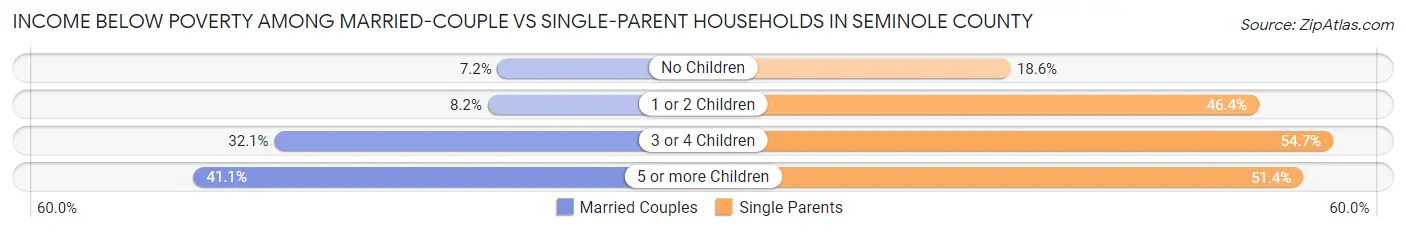
| Children | Married-Couple Families | Single-Parent Households |
| No Children | 153 (7.1%) | 131 (18.6%) |
| 1 or 2 Children | 97 (8.2%) | 451 (46.4%) |
| 3 or 4 Children | 129 (32.1%) | 123 (54.7%) |
| 5 or more Children | 37 (41.1%) | 19 (51.3%) |
| Total | 416 (10.9%) | 724 (37.3%) |
Race in Seminole County
The most populous races in Seminole County are White / Caucasian (15,458 | 65.5%), Native / Alaskan (4,823 | 20.4%), and Two or more Races (2,070 | 8.8%).
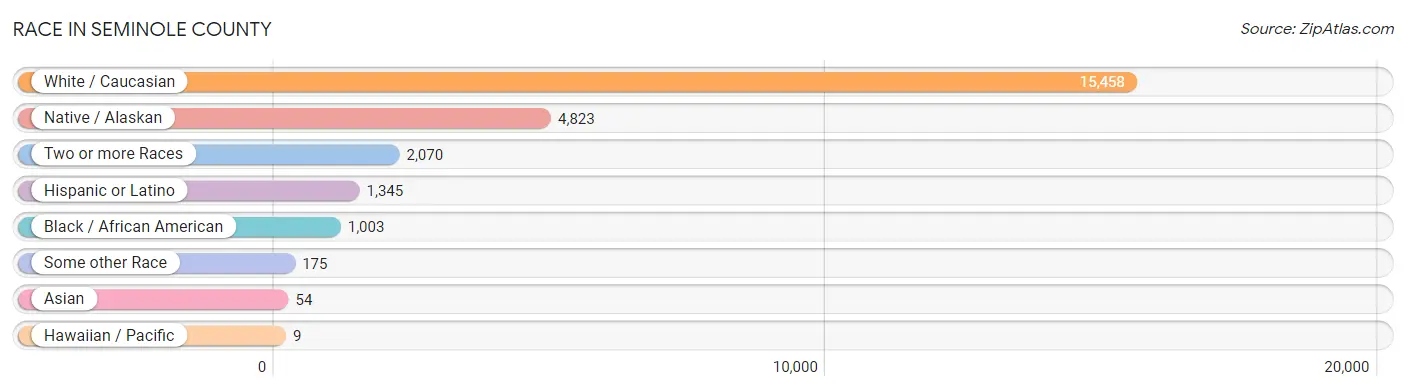
| Race | # Population | % Population |
| Asian | 54 | 0.2% |
| Black / African American | 1,003 | 4.3% |
| Hawaiian / Pacific | 9 | 0.0% |
| Hispanic or Latino | 1,345 | 5.7% |
| Native / Alaskan | 4,823 | 20.4% |
| White / Caucasian | 15,458 | 65.5% |
| Two or more Races | 2,070 | 8.8% |
| Some other Race | 175 | 0.7% |
| Total | 23,592 | 100.0% |
Ancestry in Seminole County
The most populous ancestries reported in Seminole County are American (3,746 | 15.9%), Seminole (2,925 | 12.4%), Irish (1,855 | 7.9%), English (1,756 | 7.4%), and German (1,595 | 6.8%), together accounting for 50.3% of all Seminole County residents.
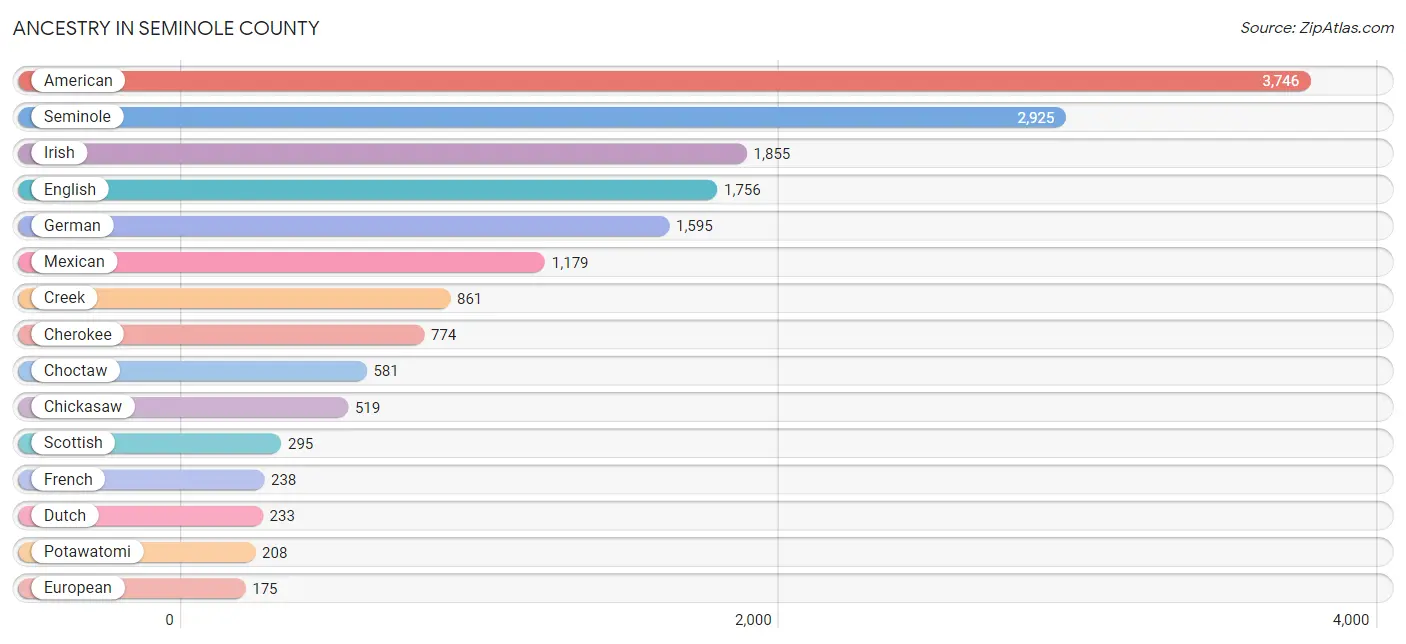
| Ancestry | # Population | % Population |
| African | 70 | 0.3% |
| American | 3,746 | 15.9% |
| Apache | 18 | 0.1% |
| Arab | 7 | 0.0% |
| Arapaho | 38 | 0.2% |
| Australian | 3 | 0.0% |
| Belgian | 8 | 0.0% |
| Bhutanese | 5 | 0.0% |
| Blackfeet | 7 | 0.0% |
| British | 47 | 0.2% |
| Burmese | 18 | 0.1% |
| Canadian | 17 | 0.1% |
| Celtic | 66 | 0.3% |
| Central American | 62 | 0.3% |
| Cherokee | 774 | 3.3% |
| Cheyenne | 3 | 0.0% |
| Chickasaw | 519 | 2.2% |
| Chilean | 5 | 0.0% |
| Chippewa | 3 | 0.0% |
| Choctaw | 581 | 2.5% |
| Comanche | 26 | 0.1% |
| Costa Rican | 7 | 0.0% |
| Creek | 861 | 3.6% |
| Crow | 14 | 0.1% |
| Cuban | 3 | 0.0% |
| Czech | 16 | 0.1% |
| Czechoslovakian | 15 | 0.1% |
| Danish | 32 | 0.1% |
| Dutch | 233 | 1.0% |
| Dutch West Indian | 29 | 0.1% |
| Eastern European | 4 | 0.0% |
| Ecuadorian | 1 | 0.0% |
| English | 1,756 | 7.4% |
| European | 175 | 0.7% |
| Finnish | 7 | 0.0% |
| French | 238 | 1.0% |
| French American Indian | 6 | 0.0% |
| French Canadian | 13 | 0.1% |
| German | 1,595 | 6.8% |
| Guatemalan | 6 | 0.0% |
| Haitian | 10 | 0.0% |
| Honduran | 3 | 0.0% |
| Hungarian | 2 | 0.0% |
| Indian (Asian) | 11 | 0.1% |
| Iranian | 47 | 0.2% |
| Irish | 1,855 | 7.9% |
| Israeli | 18 | 0.1% |
| Italian | 122 | 0.5% |
| Jamaican | 3 | 0.0% |
| Kiowa | 11 | 0.1% |
| Korean | 16 | 0.1% |
| Lebanese | 7 | 0.0% |
| Lithuanian | 2 | 0.0% |
| Mexican | 1,179 | 5.0% |
| Native Hawaiian | 16 | 0.1% |
| Navajo | 11 | 0.1% |
| Northern European | 1 | 0.0% |
| Norwegian | 24 | 0.1% |
| Osage | 3 | 0.0% |
| Panamanian | 5 | 0.0% |
| Polish | 63 | 0.3% |
| Portuguese | 6 | 0.0% |
| Potawatomi | 208 | 0.9% |
| Pueblo | 2 | 0.0% |
| Puerto Rican | 24 | 0.1% |
| Romanian | 1 | 0.0% |
| Russian | 12 | 0.1% |
| Salvadoran | 41 | 0.2% |
| Scandinavian | 27 | 0.1% |
| Scotch-Irish | 113 | 0.5% |
| Scottish | 295 | 1.3% |
| Seminole | 2,925 | 12.4% |
| Shoshone | 1 | 0.0% |
| Sioux | 15 | 0.1% |
| South American | 6 | 0.0% |
| Spaniard | 35 | 0.2% |
| Spanish | 5 | 0.0% |
| Sri Lankan | 1 | 0.0% |
| Subsaharan African | 70 | 0.3% |
| Swedish | 134 | 0.6% |
| Swiss | 5 | 0.0% |
| Thai | 12 | 0.1% |
| Trinidadian and Tobagonian | 5 | 0.0% |
| Ukrainian | 34 | 0.1% |
| Welsh | 28 | 0.1% |
| Yugoslavian | 13 | 0.1% | View All 86 Rows |
Immigrants in Seminole County
The most numerous immigrant groups reported in Seminole County came from Latin America (291 | 1.2%), Central America (285 | 1.2%), Mexico (259 | 1.1%), Asia (133 | 0.6%), and Europe (61 | 0.3%), together accounting for 4.4% of all Seminole County residents.
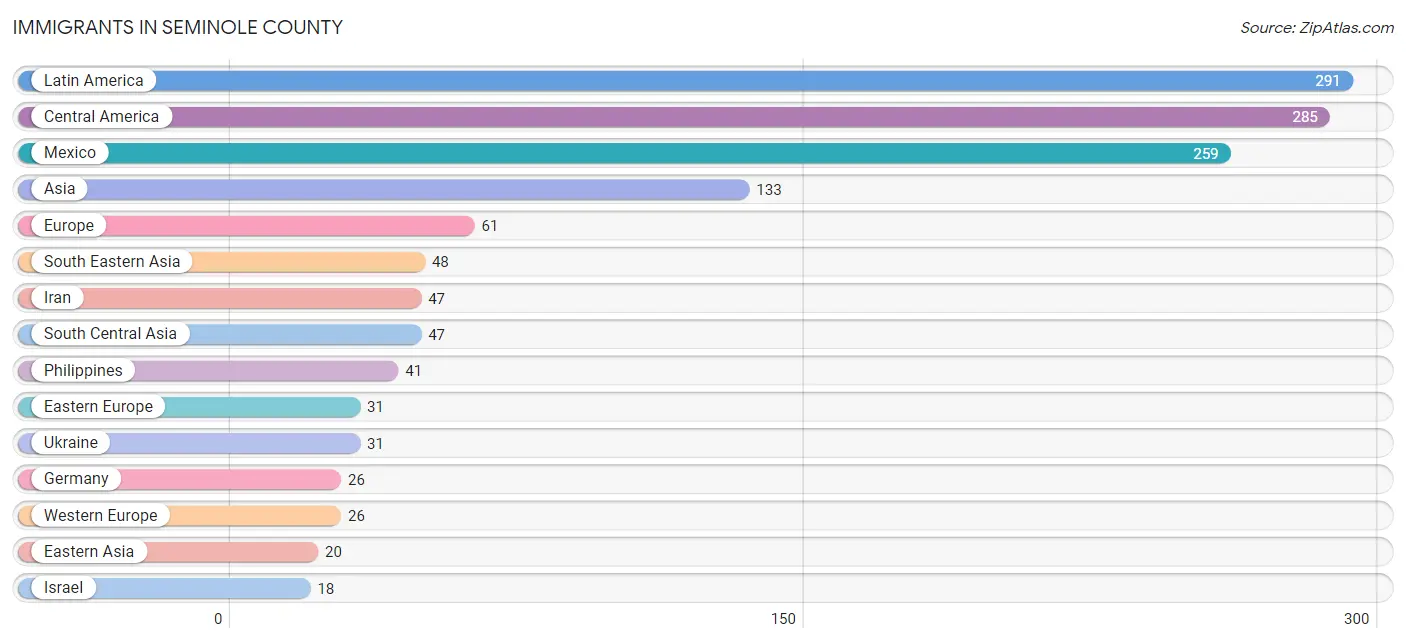
| Immigration Origin | # Population | % Population |
| Africa | 11 | 0.1% |
| Asia | 133 | 0.6% |
| Australia | 3 | 0.0% |
| Belize | 5 | 0.0% |
| Canada | 13 | 0.1% |
| Caribbean | 5 | 0.0% |
| Central America | 285 | 1.2% |
| China | 11 | 0.1% |
| Eastern Africa | 11 | 0.1% |
| Eastern Asia | 20 | 0.1% |
| Eastern Europe | 31 | 0.1% |
| Ecuador | 1 | 0.0% |
| El Salvador | 17 | 0.1% |
| Europe | 61 | 0.3% |
| Germany | 26 | 0.1% |
| Guatemala | 4 | 0.0% |
| Iran | 47 | 0.2% |
| Israel | 18 | 0.1% |
| Japan | 8 | 0.0% |
| Kenya | 11 | 0.1% |
| Korea | 1 | 0.0% |
| Latin America | 291 | 1.2% |
| Mexico | 259 | 1.1% |
| Northern Europe | 2 | 0.0% |
| Oceania | 10 | 0.0% |
| Philippines | 41 | 0.2% |
| South America | 1 | 0.0% |
| South Central Asia | 47 | 0.2% |
| South Eastern Asia | 48 | 0.2% |
| Southern Europe | 2 | 0.0% |
| Spain | 2 | 0.0% |
| Thailand | 7 | 0.0% |
| Trinidad and Tobago | 5 | 0.0% |
| Ukraine | 31 | 0.1% |
| Western Asia | 18 | 0.1% |
| Western Europe | 26 | 0.1% | View All 36 Rows |
Sex and Age in Seminole County
Sex and Age in Seminole County
The most populous age groups in Seminole County are 10 to 14 Years (890 | 7.6%) for men and 15 to 19 Years (907 | 7.6%) for women.
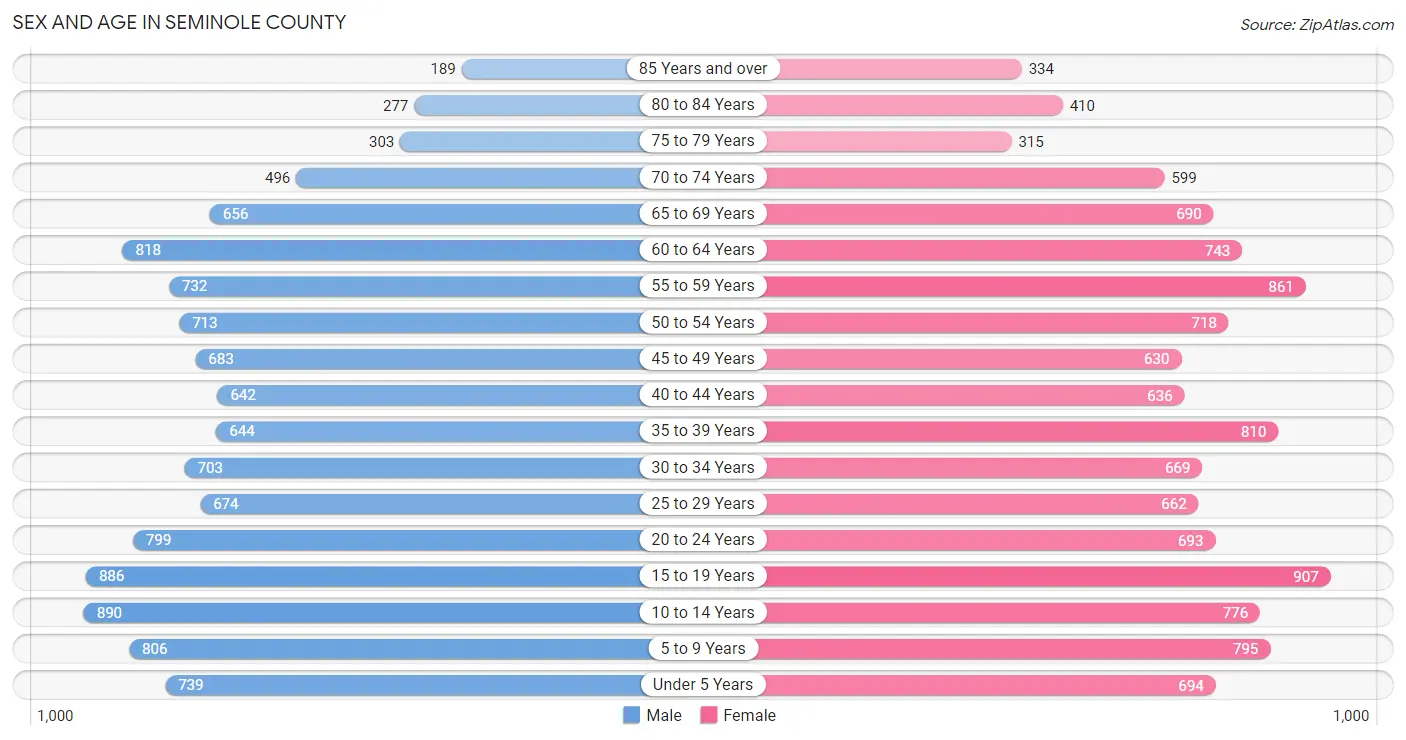
| Age Bracket | Male | Female |
| Under 5 Years | 739 (6.3%) | 694 (5.8%) |
| 5 to 9 Years | 806 (6.9%) | 795 (6.7%) |
| 10 to 14 Years | 890 (7.6%) | 776 (6.5%) |
| 15 to 19 Years | 886 (7.6%) | 907 (7.6%) |
| 20 to 24 Years | 799 (6.9%) | 693 (5.8%) |
| 25 to 29 Years | 674 (5.8%) | 662 (5.5%) |
| 30 to 34 Years | 703 (6.0%) | 669 (5.6%) |
| 35 to 39 Years | 644 (5.5%) | 810 (6.8%) |
| 40 to 44 Years | 642 (5.5%) | 636 (5.3%) |
| 45 to 49 Years | 683 (5.9%) | 630 (5.3%) |
| 50 to 54 Years | 713 (6.1%) | 718 (6.0%) |
| 55 to 59 Years | 732 (6.3%) | 861 (7.2%) |
| 60 to 64 Years | 818 (7.0%) | 743 (6.2%) |
| 65 to 69 Years | 656 (5.6%) | 690 (5.8%) |
| 70 to 74 Years | 496 (4.3%) | 599 (5.0%) |
| 75 to 79 Years | 303 (2.6%) | 315 (2.6%) |
| 80 to 84 Years | 277 (2.4%) | 410 (3.4%) |
| 85 Years and over | 189 (1.6%) | 334 (2.8%) |
| Total | 11,650 (100.0%) | 11,942 (100.0%) |
Families and Households in Seminole County
Median Family Size in Seminole County
The median family size in Seminole County is 3.31 persons per family, with single female/mother families (1,400 | 24.3%) accounting for the largest median family size of 3.37 persons per family. On the other hand, single male/father families (539 | 9.4%) represent the smallest median family size with 3.24 persons per family.
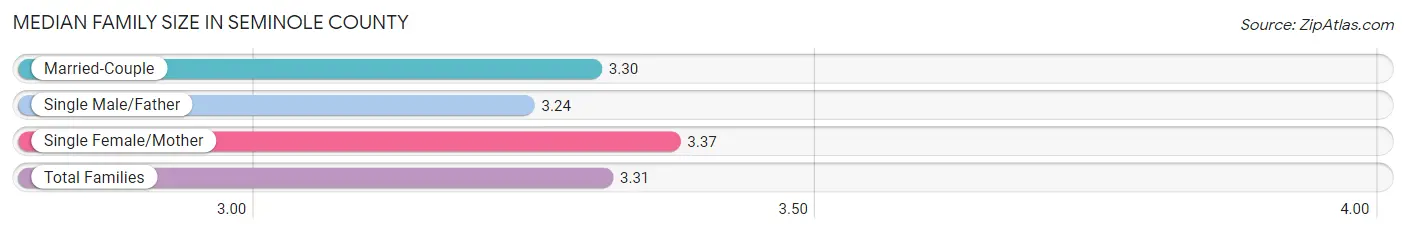
| Family Type | # Families | Family Size |
| Married-Couple | 3,810 (66.3%) | 3.30 |
| Single Male/Father | 539 (9.4%) | 3.24 |
| Single Female/Mother | 1,400 (24.3%) | 3.37 |
| Total Families | 5,749 (100.0%) | 3.31 |
Median Household Size in Seminole County
The median household size in Seminole County is 2.68 persons per household, with single female/mother households (1,400 | 16.4%) accounting for the largest median household size of 3.56 persons per household. non-family households (2,787 | 32.7%) represent the smallest median household size with 1.18 persons per household.
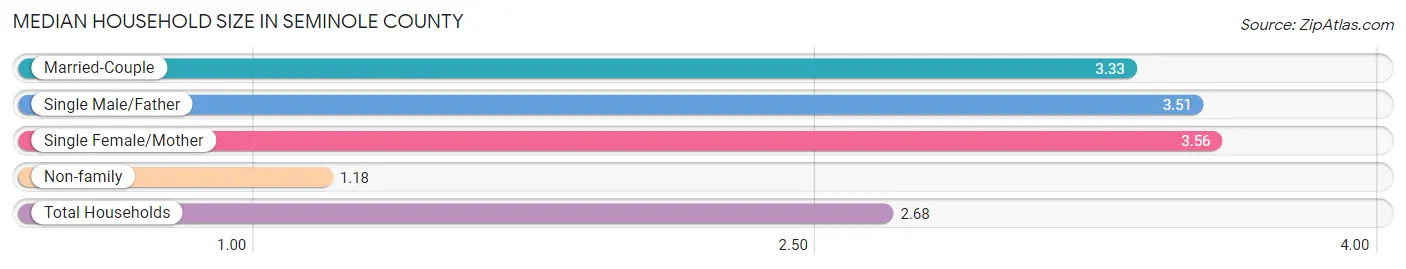
| Household Type | # Households | Household Size |
| Married-Couple | 3,810 (44.6%) | 3.33 |
| Single Male/Father | 539 (6.3%) | 3.51 |
| Single Female/Mother | 1,400 (16.4%) | 3.56 |
| Non-family | 2,787 (32.7%) | 1.18 |
| Total Households | 8,536 (100.0%) | 2.68 |
Household Size by Marriage Status in Seminole County
Out of a total of 8,536 households in Seminole County, 5,749 (67.3%) are family households, while 2,787 (32.7%) are nonfamily households. The most numerous type of family households are 2-person households, comprising 2,548, and the most common type of nonfamily households are 1-person households, comprising 2,478.
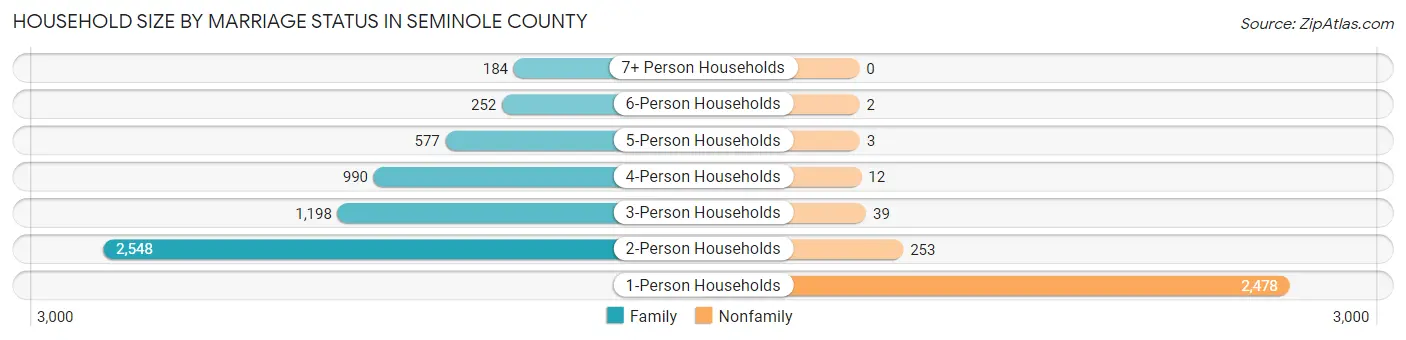
| Household Size | Family Households | Nonfamily Households |
| 1-Person Households | - | 2,478 (29.0%) |
| 2-Person Households | 2,548 (29.8%) | 253 (3.0%) |
| 3-Person Households | 1,198 (14.0%) | 39 (0.5%) |
| 4-Person Households | 990 (11.6%) | 12 (0.1%) |
| 5-Person Households | 577 (6.8%) | 3 (0.0%) |
| 6-Person Households | 252 (2.9%) | 2 (0.0%) |
| 7+ Person Households | 184 (2.2%) | 0 (0.0%) |
| Total | 5,749 (67.3%) | 2,787 (32.7%) |
Female Fertility in Seminole County
Fertility by Age in Seminole County
Average fertility rate in Seminole County is 61.0 births per 1,000 women. Women in the age bracket of 20 to 34 years have the highest fertility rate with 109.0 births per 1,000 women. Women in the age bracket of 20 to 34 years acount for 69.3% of all women with births.
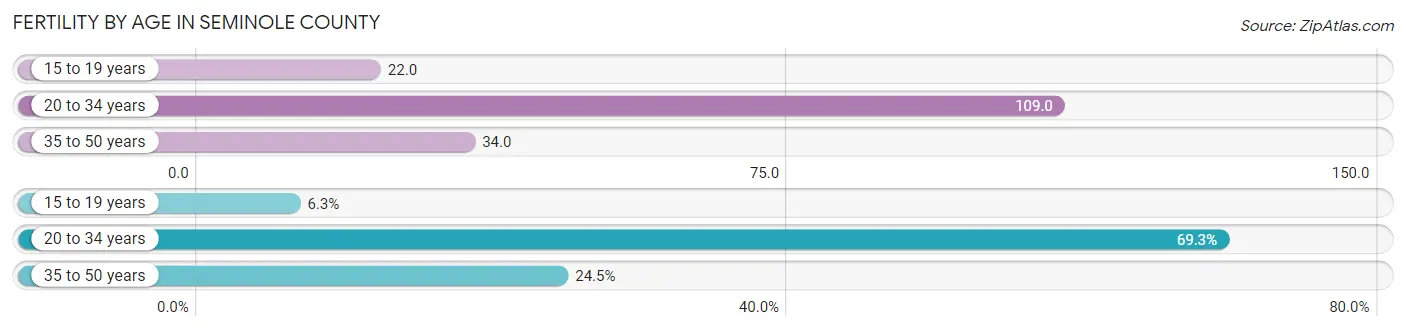
| Age Bracket | Women with Births | Births / 1,000 Women |
| 15 to 19 years | 20 (6.3%) | 22.0 |
| 20 to 34 years | 221 (69.3%) | 109.0 |
| 35 to 50 years | 78 (24.4%) | 34.0 |
| Total | 319 (100.0%) | 61.0 |
Fertility by Age by Marriage Status in Seminole County
65.5% of women with births (319) in Seminole County are married. The highest percentage of unmarried women with births falls into 15 to 19 years age bracket with 95.0% of them unmarried at the time of birth, while the lowest percentage of unmarried women with births belong to 20 to 34 years age bracket with 29.4% of them unmarried.
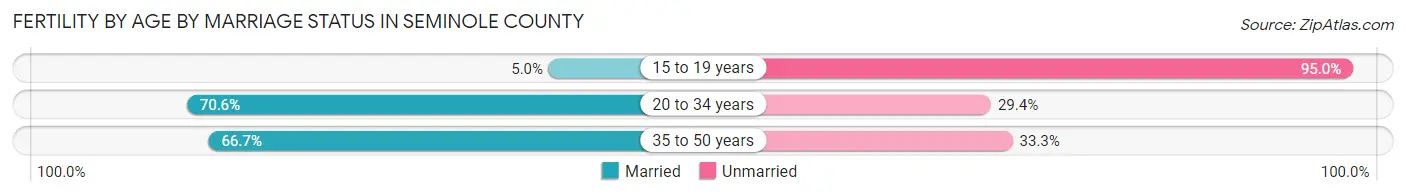
| Age Bracket | Married | Unmarried |
| 15 to 19 years | 1 (5.0%) | 19 (95.0%) |
| 20 to 34 years | 156 (70.6%) | 65 (29.4%) |
| 35 to 50 years | 52 (66.7%) | 26 (33.3%) |
| Total | 209 (65.5%) | 110 (34.5%) |
Fertility by Education in Seminole County
Average fertility rate in Seminole County is 61.0 births per 1,000 women. Women with the education attainment of high school diploma have the highest fertility rate of 78.0 births per 1,000 women, while women with the education attainment of less than high school have the lowest fertility at 26.0 births per 1,000 women. Women with the education attainment of high school diploma represent 38.6% of all women with births.
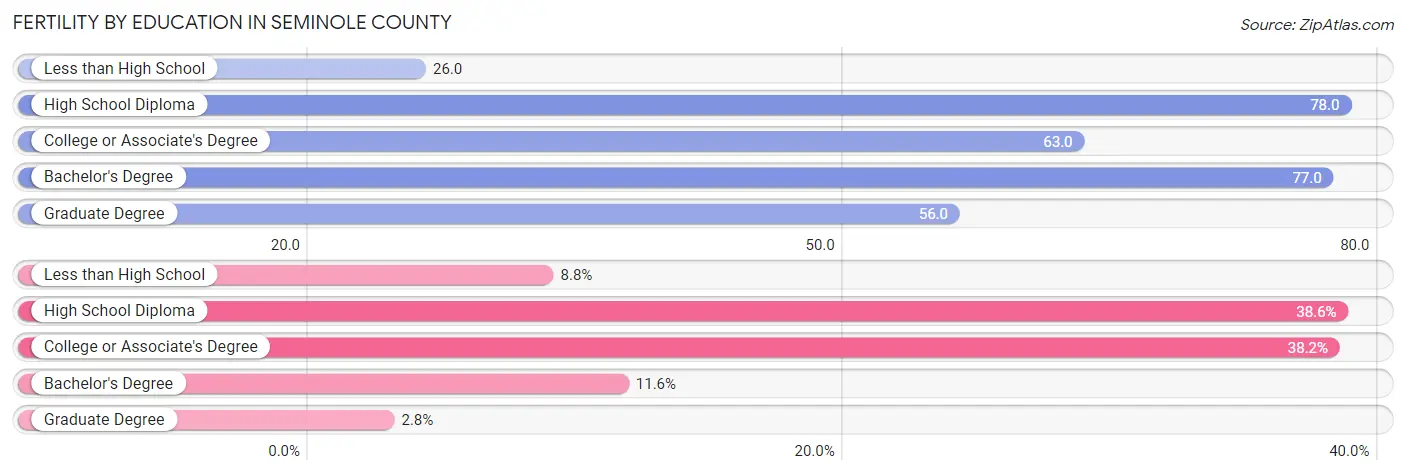
| Educational Attainment | Women with Births | Births / 1,000 Women |
| Less than High School | 28 (8.8%) | 26.0 |
| High School Diploma | 123 (38.6%) | 78.0 |
| College or Associate's Degree | 122 (38.2%) | 63.0 |
| Bachelor's Degree | 37 (11.6%) | 77.0 |
| Graduate Degree | 9 (2.8%) | 56.0 |
| Total | 319 (100.0%) | 61.0 |
Fertility by Education by Marriage Status in Seminole County
34.5% of women with births in Seminole County are unmarried. Women with the educational attainment of college or associate's degree are most likely to be married with 92.6% of them married at childbirth, while women with the educational attainment of high school diploma are least likely to be married with 61.0% of them unmarried at childbirth.
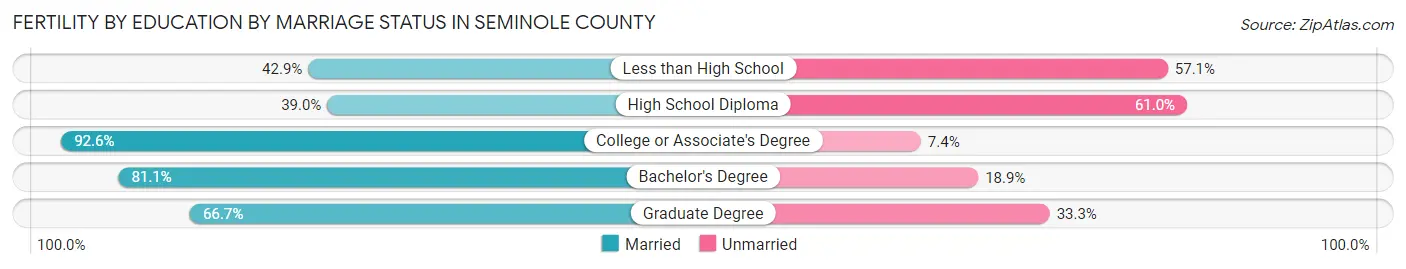
| Educational Attainment | Married | Unmarried |
| Less than High School | 12 (42.9%) | 16 (57.1%) |
| High School Diploma | 48 (39.0%) | 75 (61.0%) |
| College or Associate's Degree | 113 (92.6%) | 9 (7.4%) |
| Bachelor's Degree | 30 (81.1%) | 7 (18.9%) |
| Graduate Degree | 6 (66.7%) | 3 (33.3%) |
| Total | 209 (65.5%) | 110 (34.5%) |
Employment Characteristics in Seminole County
Employment by Class of Employer in Seminole County
Among the 8,453 employed individuals in Seminole County, private company employees (5,545 | 65.6%), local government employees (851 | 10.1%), and self-employed (not incorporated) (576 | 6.8%) make up the most common classes of employment.
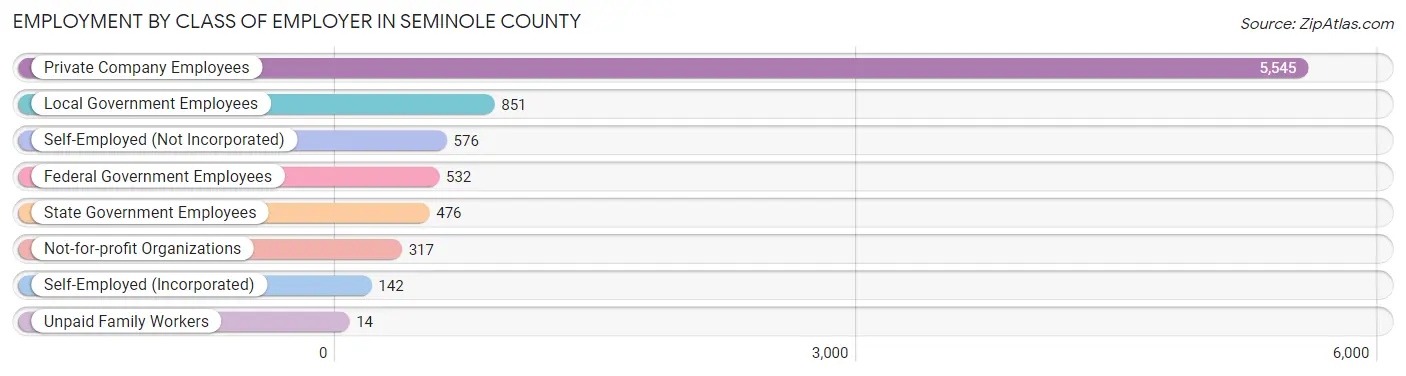
| Employer Class | # Employees | % Employees |
| Private Company Employees | 5,545 | 65.6% |
| Self-Employed (Incorporated) | 142 | 1.7% |
| Self-Employed (Not Incorporated) | 576 | 6.8% |
| Not-for-profit Organizations | 317 | 3.7% |
| Local Government Employees | 851 | 10.1% |
| State Government Employees | 476 | 5.6% |
| Federal Government Employees | 532 | 6.3% |
| Unpaid Family Workers | 14 | 0.2% |
| Total | 8,453 | 100.0% |
Employment Status by Age in Seminole County
According to the labor force statistics for Seminole County, out of the total population over 16 years of age (18,529), 49.5% or 9,172 individuals are in the labor force, with 7.2% or 660 of them unemployed. The age group with the highest labor force participation rate is 25 to 29 years, with 74.4% or 994 individuals in the labor force. Within the labor force, the 16 to 19 years age range has the highest percentage of unemployed individuals, with 18.2% or 95 of them being unemployed.
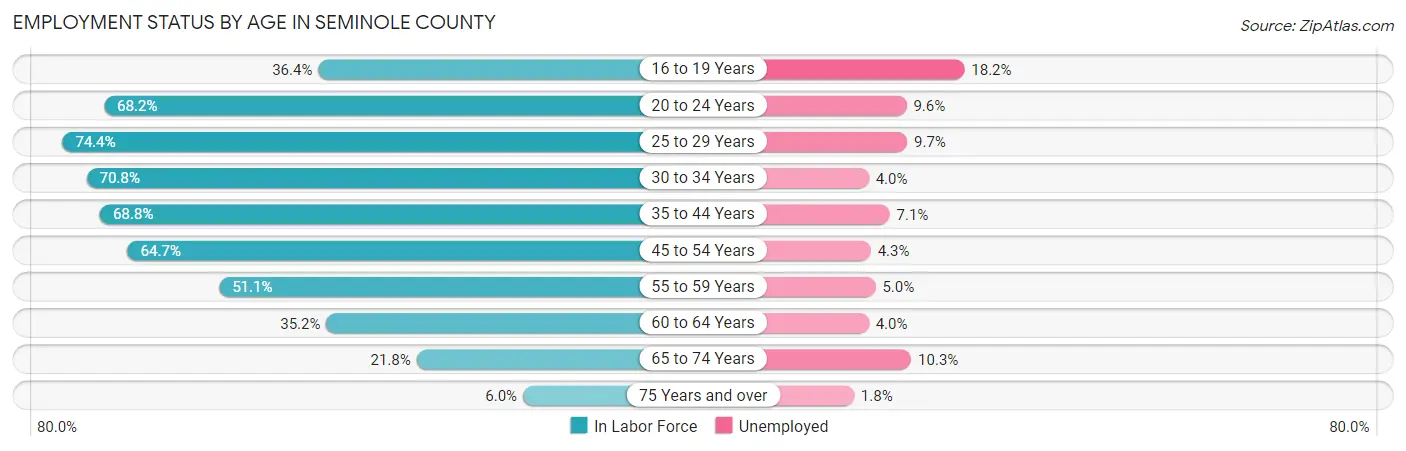
| Age Bracket | In Labor Force | Unemployed |
| 16 to 19 Years | 521 (36.4%) | 95 (18.2%) |
| 20 to 24 Years | 1,018 (68.2%) | 98 (9.6%) |
| 25 to 29 Years | 994 (74.4%) | 96 (9.7%) |
| 30 to 34 Years | 971 (70.8%) | 39 (4.0%) |
| 35 to 44 Years | 1,880 (68.8%) | 133 (7.1%) |
| 45 to 54 Years | 1,775 (64.7%) | 76 (4.3%) |
| 55 to 59 Years | 814 (51.1%) | 41 (5.0%) |
| 60 to 64 Years | 549 (35.2%) | 22 (4.0%) |
| 65 to 74 Years | 532 (21.8%) | 55 (10.3%) |
| 75 Years and over | 110 (6.0%) | 2 (1.8%) |
| Total | 9,172 (49.5%) | 660 (7.2%) |
Employment Status by Educational Attainment in Seminole County
According to labor force statistics for Seminole County, 61.6% of individuals (6,984) out of the total population between 25 and 64 years of age (11,338) are in the labor force, with 5.8% or 405 of them being unemployed. The group with the highest labor force participation rate are those with the educational attainment of bachelor's degree or higher, with 72.5% or 1,120 individuals in the labor force. Within the labor force, individuals with less than high school education have the highest percentage of unemployment, with 10.4% or 74 of them being unemployed.
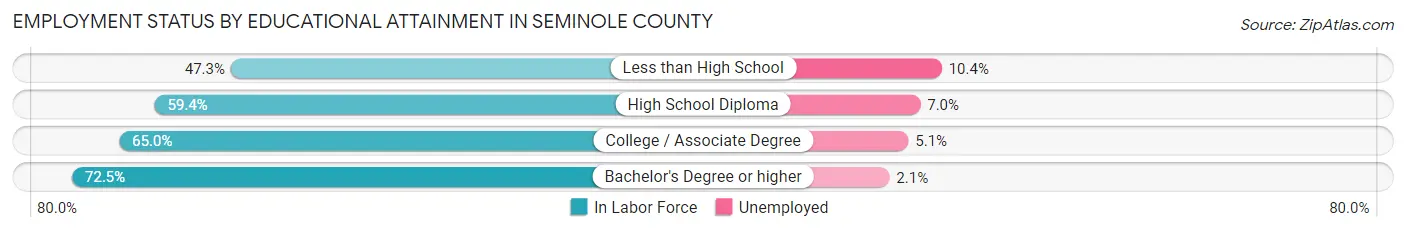
| Educational Attainment | In Labor Force | Unemployed |
| Less than High School | 714 (47.3%) | 157 (10.4%) |
| High School Diploma | 2,508 (59.4%) | 296 (7.0%) |
| College / Associate Degree | 2,640 (65.0%) | 207 (5.1%) |
| Bachelor's Degree or higher | 1,120 (72.5%) | 32 (2.1%) |
| Total | 6,984 (61.6%) | 658 (5.8%) |
Employment Occupations by Sex in Seminole County
Management, Business, Science and Arts Occupations
The most common Management, Business, Science and Arts occupations in Seminole County are Community & Social Service (754 | 8.9%), Management (655 | 7.7%), Education Instruction & Library (450 | 5.3%), Health Diagnosing & Treating (435 | 5.1%), and Health Technologists (235 | 2.8%).
Management, Business, Science and Arts Occupations by Sex
Within the Management, Business, Science and Arts occupations in Seminole County, the most male-oriented occupations are Architecture & Engineering (96.0%), Computers, Engineering & Science (81.2%), and Life, Physical & Social Science (76.0%), while the most female-oriented occupations are Arts, Media & Entertainment (91.4%), Health Diagnosing & Treating (90.3%), and Education Instruction & Library (85.6%).
| Occupation | Male | Female |
| Management | 375 (57.3%) | 280 (42.7%) |
| Business & Financial | 44 (25.3%) | 130 (74.7%) |
| Computers, Engineering & Science | 112 (81.2%) | 26 (18.8%) |
| Computers & Mathematics | 3 (21.4%) | 11 (78.6%) |
| Architecture & Engineering | 71 (96.0%) | 3 (4.1%) |
| Life, Physical & Social Science | 38 (76.0%) | 12 (24.0%) |
| Community & Social Service | 141 (18.7%) | 613 (81.3%) |
| Education, Arts & Media | 44 (25.0%) | 132 (75.0%) |
| Legal Services & Support | 25 (53.2%) | 22 (46.8%) |
| Education Instruction & Library | 65 (14.4%) | 385 (85.6%) |
| Arts, Media & Entertainment | 7 (8.6%) | 74 (91.4%) |
| Health Diagnosing & Treating | 42 (9.7%) | 393 (90.3%) |
| Health Technologists | 39 (16.6%) | 196 (83.4%) |
| Total (Category) | 714 (33.1%) | 1,442 (66.9%) |
| Total (Overall) | 4,556 (53.6%) | 3,947 (46.4%) |
Services Occupations
The most common Services occupations in Seminole County are Food Preparation & Serving (582 | 6.8%), Cleaning & Maintenance (418 | 4.9%), Healthcare Support (299 | 3.5%), Security & Protection (248 | 2.9%), and Law Enforcement (177 | 2.1%).
Services Occupations by Sex
Within the Services occupations in Seminole County, the most male-oriented occupations are Law Enforcement (88.1%), Security & Protection (81.5%), and Cleaning & Maintenance (69.1%), while the most female-oriented occupations are Healthcare Support (90.3%), Personal Care & Service (73.5%), and Food Preparation & Serving (61.5%).
| Occupation | Male | Female |
| Healthcare Support | 29 (9.7%) | 270 (90.3%) |
| Security & Protection | 202 (81.5%) | 46 (18.5%) |
| Firefighting & Prevention | 46 (64.8%) | 25 (35.2%) |
| Law Enforcement | 156 (88.1%) | 21 (11.9%) |
| Food Preparation & Serving | 224 (38.5%) | 358 (61.5%) |
| Cleaning & Maintenance | 289 (69.1%) | 129 (30.9%) |
| Personal Care & Service | 45 (26.5%) | 125 (73.5%) |
| Total (Category) | 789 (46.0%) | 928 (54.0%) |
| Total (Overall) | 4,556 (53.6%) | 3,947 (46.4%) |
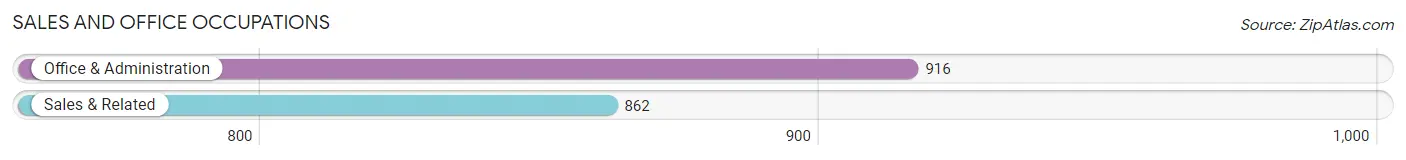
Sales and Office Occupations
The most common Sales and Office occupations in Seminole County are Office & Administration (916 | 10.8%), and Sales & Related (862 | 10.1%).
Sales and Office Occupations by Sex
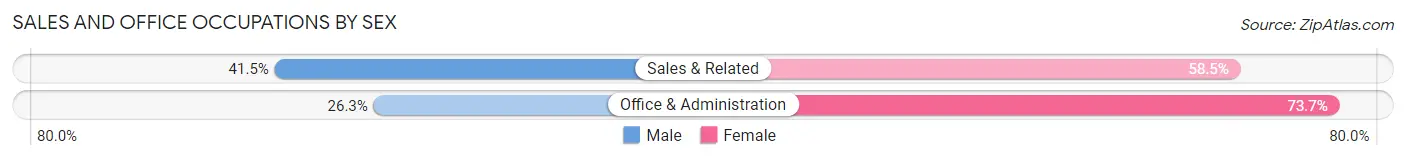
| Occupation | Male | Female |
| Sales & Related | 358 (41.5%) | 504 (58.5%) |
| Office & Administration | 241 (26.3%) | 675 (73.7%) |
| Total (Category) | 599 (33.7%) | 1,179 (66.3%) |
| Total (Overall) | 4,556 (53.6%) | 3,947 (46.4%) |
Natural Resources, Construction and Maintenance Occupations
The most common Natural Resources, Construction and Maintenance occupations in Seminole County are Construction & Extraction (640 | 7.5%), Installation, Maintenance & Repair (557 | 6.6%), and Farming, Fishing & Forestry (41 | 0.5%).
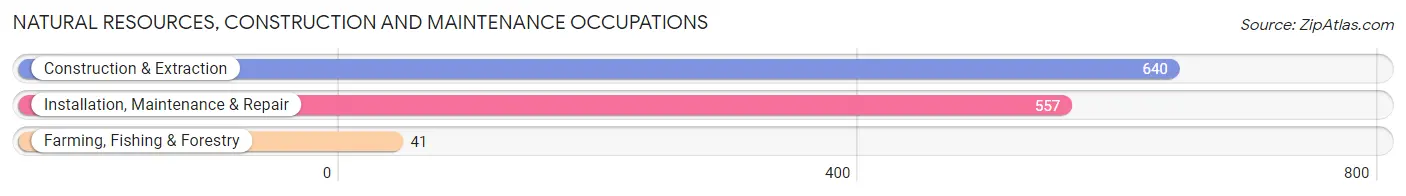
Natural Resources, Construction and Maintenance Occupations by Sex
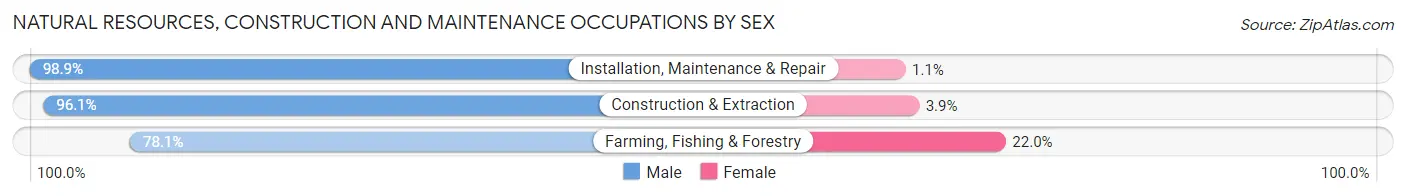
| Occupation | Male | Female |
| Farming, Fishing & Forestry | 32 (78.0%) | 9 (22.0%) |
| Construction & Extraction | 615 (96.1%) | 25 (3.9%) |
| Installation, Maintenance & Repair | 551 (98.9%) | 6 (1.1%) |
| Total (Category) | 1,198 (96.8%) | 40 (3.2%) |
| Total (Overall) | 4,556 (53.6%) | 3,947 (46.4%) |
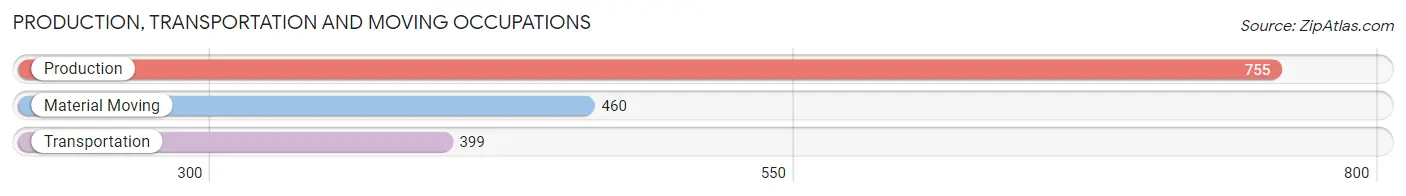
Production, Transportation and Moving Occupations
The most common Production, Transportation and Moving occupations in Seminole County are Production (755 | 8.9%), Material Moving (460 | 5.4%), and Transportation (399 | 4.7%).
Production, Transportation and Moving Occupations by Sex
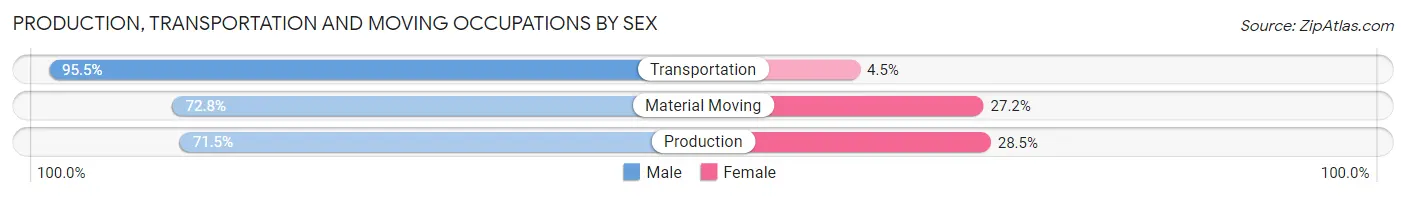
| Occupation | Male | Female |
| Production | 540 (71.5%) | 215 (28.5%) |
| Transportation | 381 (95.5%) | 18 (4.5%) |
| Material Moving | 335 (72.8%) | 125 (27.2%) |
| Total (Category) | 1,256 (77.8%) | 358 (22.2%) |
| Total (Overall) | 4,556 (53.6%) | 3,947 (46.4%) |
Employment Industries by Sex in Seminole County
Employment Industries in Seminole County
The major employment industries in Seminole County include Retail Trade (1,241 | 14.6%), Health Care & Social Assistance (1,085 | 12.8%), Manufacturing (978 | 11.5%), Public Administration (757 | 8.9%), and Accommodation & Food Services (687 | 8.1%).
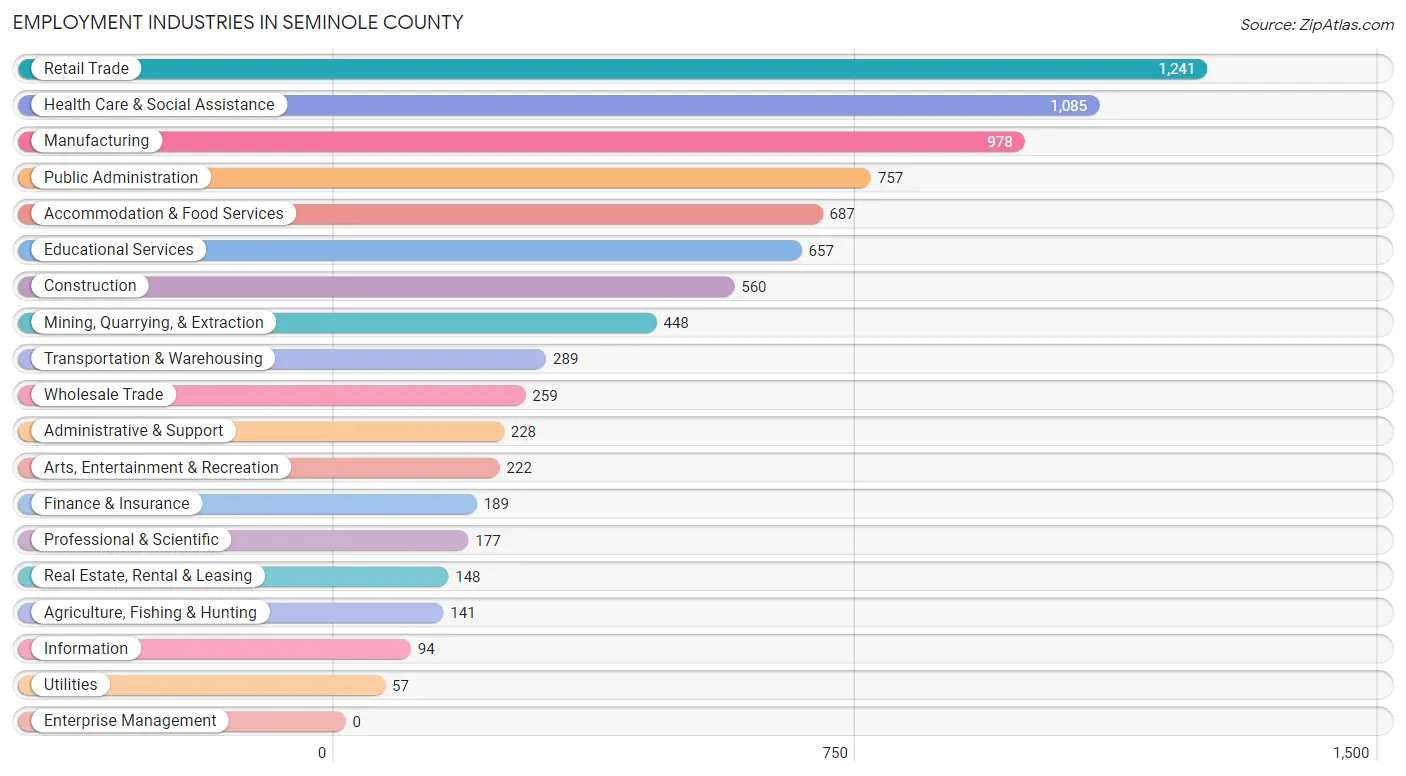
Employment Industries by Sex in Seminole County
The Seminole County industries that see more men than women are Mining, Quarrying, & Extraction (95.1%), Construction (93.2%), and Wholesale Trade (89.6%), whereas the industries that tend to have a higher number of women are Health Care & Social Assistance (84.0%), Educational Services (79.9%), and Finance & Insurance (79.4%).
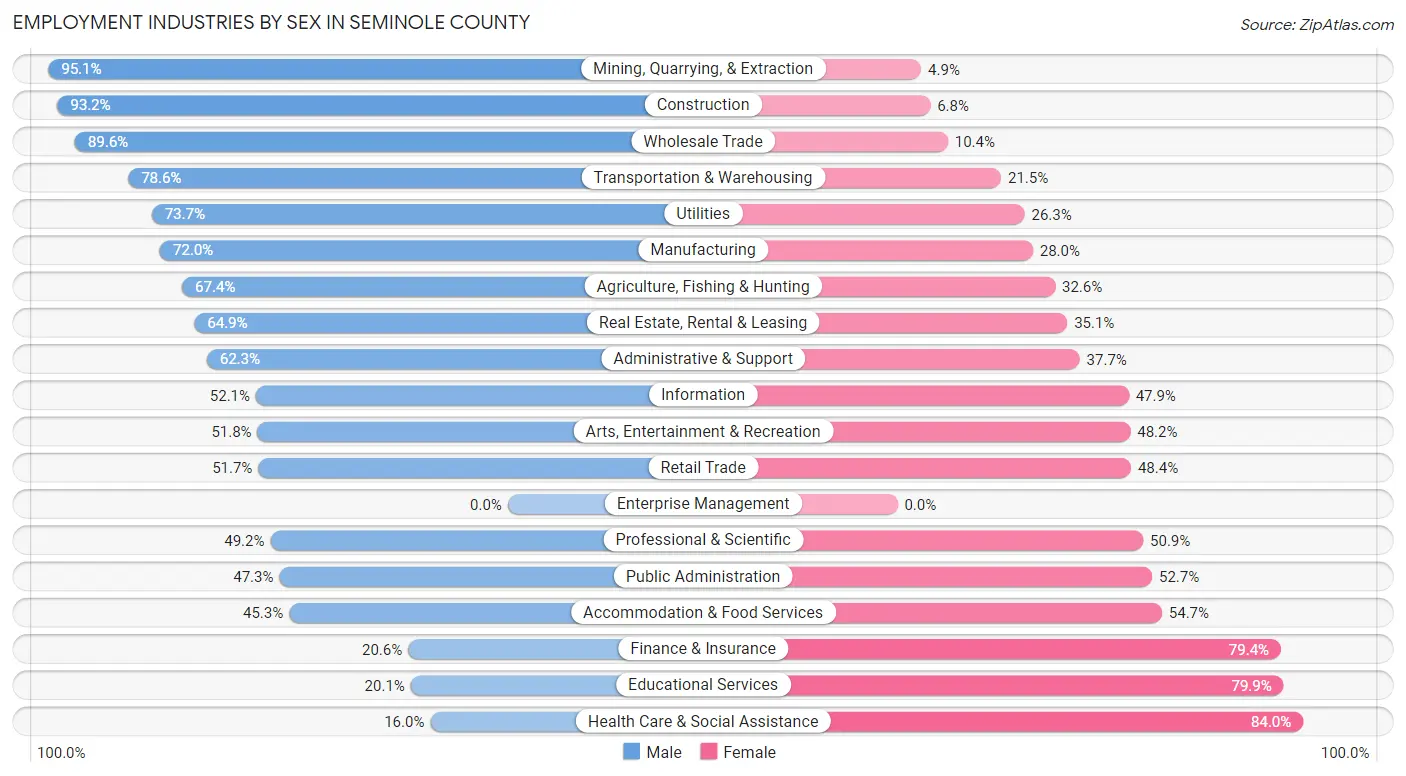
| Industry | Male | Female |
| Agriculture, Fishing & Hunting | 95 (67.4%) | 46 (32.6%) |
| Mining, Quarrying, & Extraction | 426 (95.1%) | 22 (4.9%) |
| Construction | 522 (93.2%) | 38 (6.8%) |
| Manufacturing | 704 (72.0%) | 274 (28.0%) |
| Wholesale Trade | 232 (89.6%) | 27 (10.4%) |
| Retail Trade | 641 (51.6%) | 600 (48.3%) |
| Transportation & Warehousing | 227 (78.5%) | 62 (21.4%) |
| Utilities | 42 (73.7%) | 15 (26.3%) |
| Information | 49 (52.1%) | 45 (47.9%) |
| Finance & Insurance | 39 (20.6%) | 150 (79.4%) |
| Real Estate, Rental & Leasing | 96 (64.9%) | 52 (35.1%) |
| Professional & Scientific | 87 (49.1%) | 90 (50.8%) |
| Enterprise Management | 0 (0.0%) | 0 (0.0%) |
| Administrative & Support | 142 (62.3%) | 86 (37.7%) |
| Educational Services | 132 (20.1%) | 525 (79.9%) |
| Health Care & Social Assistance | 174 (16.0%) | 911 (84.0%) |
| Arts, Entertainment & Recreation | 115 (51.8%) | 107 (48.2%) |
| Accommodation & Food Services | 311 (45.3%) | 376 (54.7%) |
| Public Administration | 358 (47.3%) | 399 (52.7%) |
| Total | 4,556 (53.6%) | 3,947 (46.4%) |
Education in Seminole County
School Enrollment in Seminole County
The most common levels of schooling among the 5,674 students in Seminole County are elementary school (1,362 | 24.0%), high school (1,333 | 23.5%), and middle school (1,239 | 21.8%).
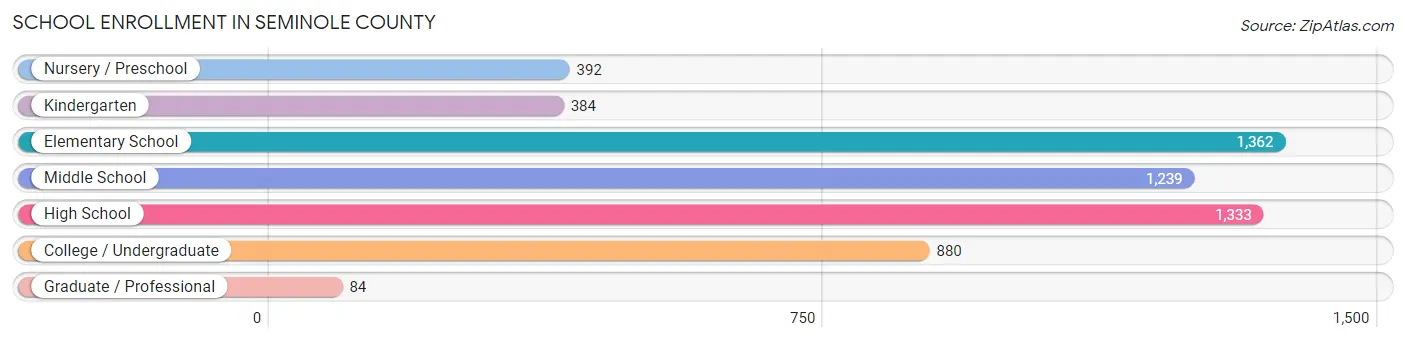
| School Level | # Students | % Students |
| Nursery / Preschool | 392 | 6.9% |
| Kindergarten | 384 | 6.8% |
| Elementary School | 1,362 | 24.0% |
| Middle School | 1,239 | 21.8% |
| High School | 1,333 | 23.5% |
| College / Undergraduate | 880 | 15.5% |
| Graduate / Professional | 84 | 1.5% |
| Total | 5,674 | 100.0% |
School Enrollment by Age by Funding Source in Seminole County
Out of a total of 5,674 students who are enrolled in schools in Seminole County, 340 (6.0%) attend a private institution, while the remaining 5,334 (94.0%) are enrolled in public schools. The age group of 20 to 24 year olds has the highest likelihood of being enrolled in private schools, with 62 (15.0% in the age bracket) enrolled. Conversely, the age group of 10 to 14 year olds has the lowest likelihood of being enrolled in a private school, with 1,519 (96.3% in the age bracket) attending a public institution.
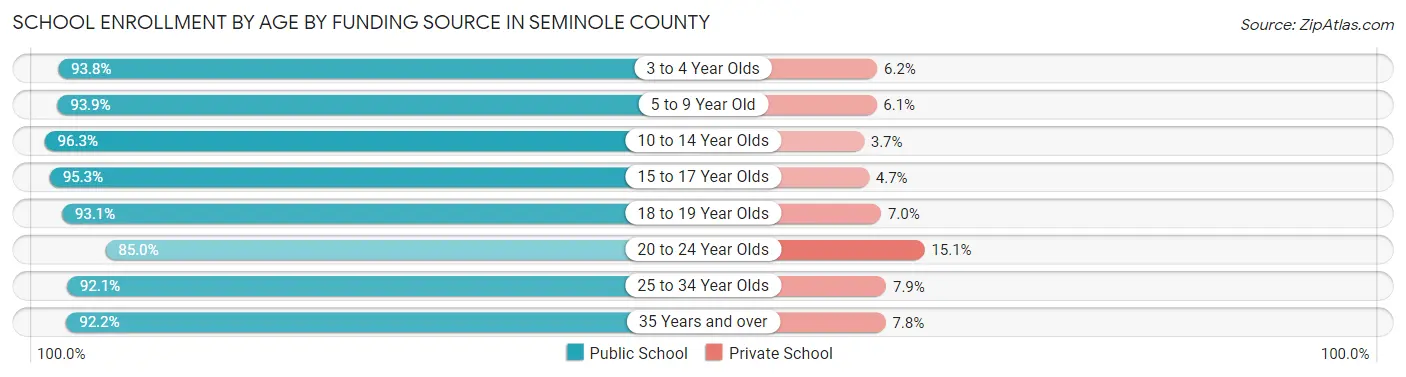
| Age Bracket | Public School | Private School |
| 3 to 4 Year Olds | 301 (93.8%) | 20 (6.2%) |
| 5 to 9 Year Old | 1,435 (93.9%) | 93 (6.1%) |
| 10 to 14 Year Olds | 1,519 (96.3%) | 59 (3.7%) |
| 15 to 17 Year Olds | 956 (95.3%) | 47 (4.7%) |
| 18 to 19 Year Olds | 442 (93.0%) | 33 (7.0%) |
| 20 to 24 Year Olds | 350 (85.0%) | 62 (15.0%) |
| 25 to 34 Year Olds | 175 (92.1%) | 15 (7.9%) |
| 35 Years and over | 154 (92.2%) | 13 (7.8%) |
| Total | 5,334 (94.0%) | 340 (6.0%) |
Educational Attainment by Field of Study in Seminole County
Education (684 | 28.1%), business (457 | 18.8%), science & technology (278 | 11.4%), arts & humanities (217 | 8.9%), and psychology (149 | 6.1%) are the most common fields of study among 2,435 individuals in Seminole County who have obtained a bachelor's degree or higher.
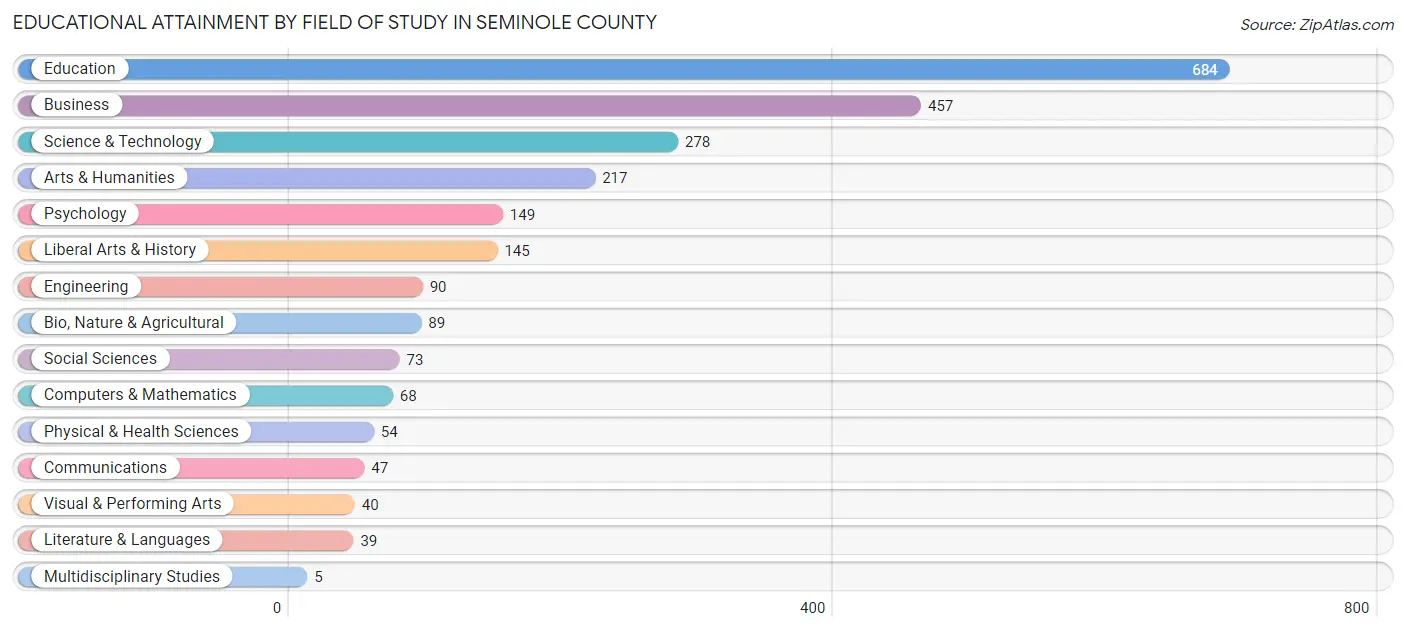
| Field of Study | # Graduates | % Graduates |
| Computers & Mathematics | 68 | 2.8% |
| Bio, Nature & Agricultural | 89 | 3.7% |
| Physical & Health Sciences | 54 | 2.2% |
| Psychology | 149 | 6.1% |
| Social Sciences | 73 | 3.0% |
| Engineering | 90 | 3.7% |
| Multidisciplinary Studies | 5 | 0.2% |
| Science & Technology | 278 | 11.4% |
| Business | 457 | 18.8% |
| Education | 684 | 28.1% |
| Literature & Languages | 39 | 1.6% |
| Liberal Arts & History | 145 | 5.9% |
| Visual & Performing Arts | 40 | 1.6% |
| Communications | 47 | 1.9% |
| Arts & Humanities | 217 | 8.9% |
| Total | 2,435 | 100.0% |
Transportation & Commute in Seminole County
Vehicle Availability by Sex in Seminole County
The most prevalent vehicle ownership categories in Seminole County are males with 2 vehicles (1,378, accounting for 30.8%) and females with 2 vehicles (1,254, making up 35.9%).
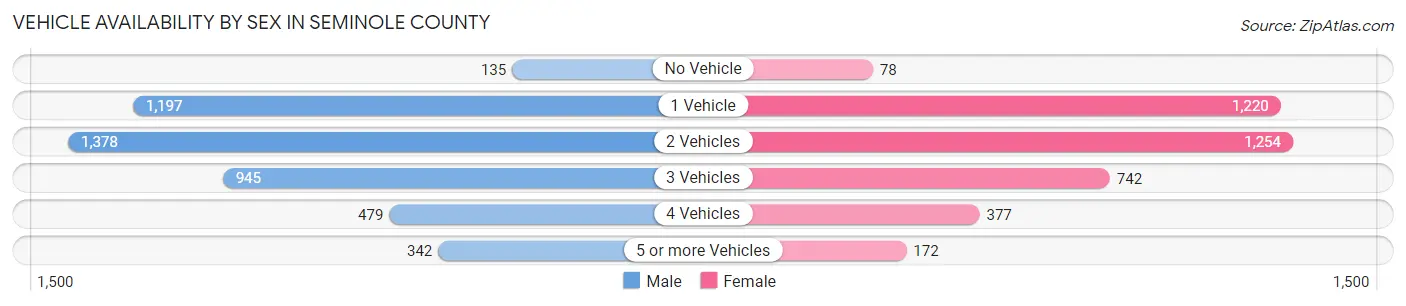
| Vehicles Available | Male | Female |
| No Vehicle | 135 (3.0%) | 78 (2.0%) |
| 1 Vehicle | 1,197 (26.7%) | 1,220 (31.8%) |
| 2 Vehicles | 1,378 (30.8%) | 1,254 (32.6%) |
| 3 Vehicles | 945 (21.1%) | 742 (19.3%) |
| 4 Vehicles | 479 (10.7%) | 377 (9.8%) |
| 5 or more Vehicles | 342 (7.6%) | 172 (4.5%) |
| Total | 4,476 (100.0%) | 3,843 (100.0%) |
Commute Time in Seminole County
The most frequently occuring commute durations in Seminole County are 5 to 9 minutes (1,598 commuters, 19.9%), 10 to 14 minutes (1,073 commuters, 13.3%), and 30 to 34 minutes (1,004 commuters, 12.5%).
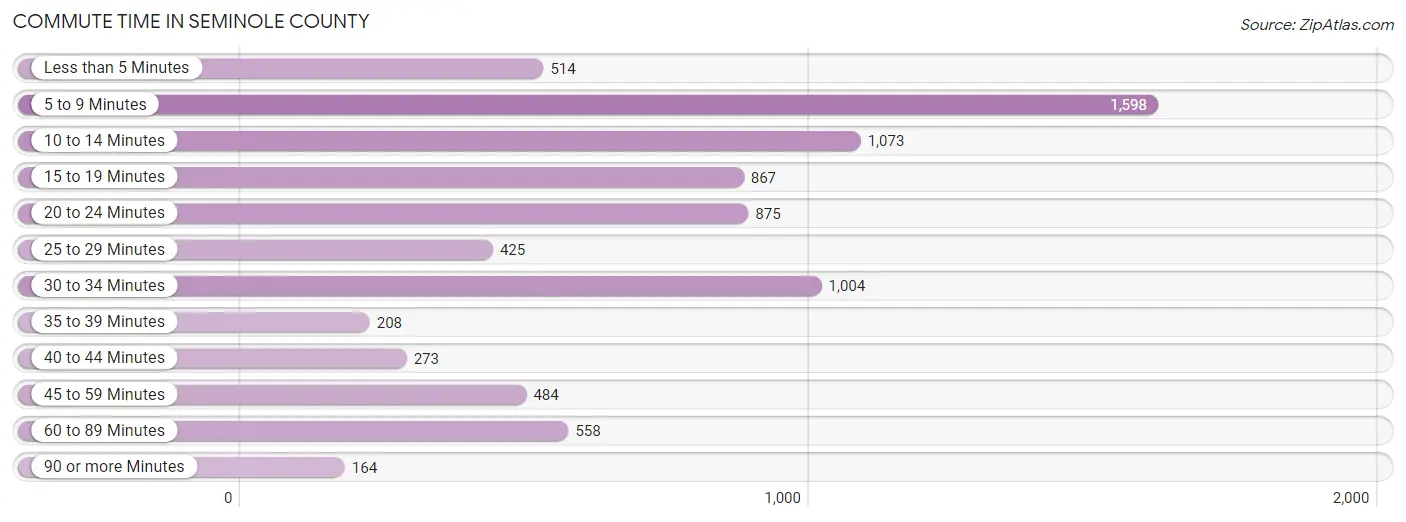
| Commute Time | # Commuters | % Commuters |
| Less than 5 Minutes | 514 | 6.4% |
| 5 to 9 Minutes | 1,598 | 19.9% |
| 10 to 14 Minutes | 1,073 | 13.3% |
| 15 to 19 Minutes | 867 | 10.8% |
| 20 to 24 Minutes | 875 | 10.9% |
| 25 to 29 Minutes | 425 | 5.3% |
| 30 to 34 Minutes | 1,004 | 12.5% |
| 35 to 39 Minutes | 208 | 2.6% |
| 40 to 44 Minutes | 273 | 3.4% |
| 45 to 59 Minutes | 484 | 6.0% |
| 60 to 89 Minutes | 558 | 6.9% |
| 90 or more Minutes | 164 | 2.0% |
Commute Time by Sex in Seminole County
The most common commute times in Seminole County are 5 to 9 minutes (813 commuters, 19.0%) for males and 5 to 9 minutes (785 commuters, 20.8%) for females.
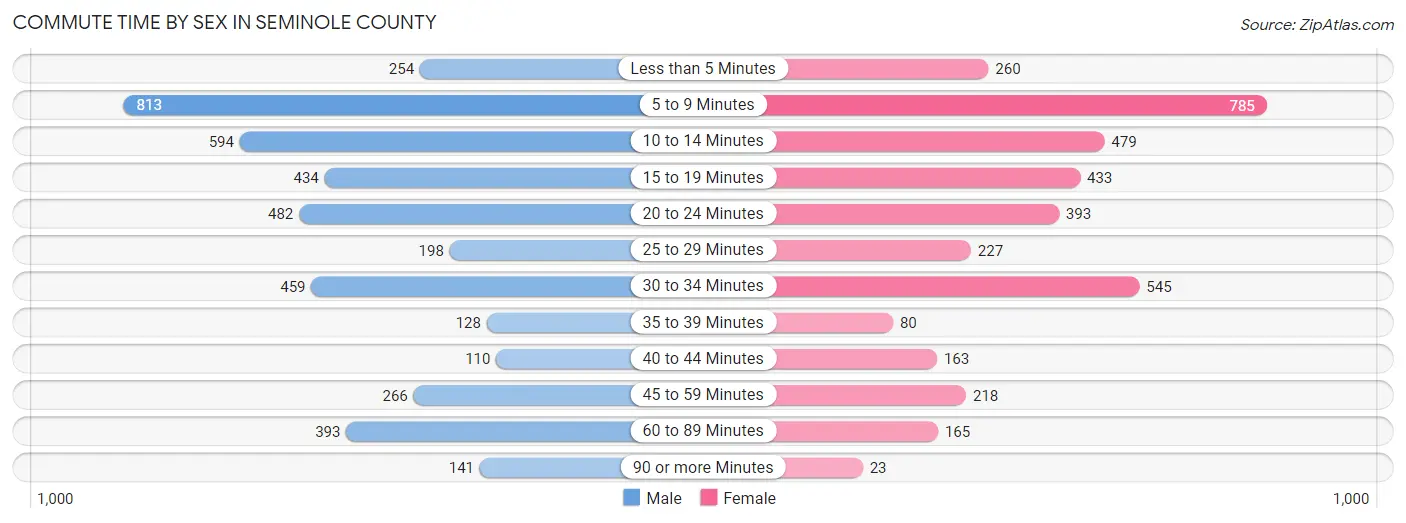
| Commute Time | Male | Female |
| Less than 5 Minutes | 254 (5.9%) | 260 (6.9%) |
| 5 to 9 Minutes | 813 (19.0%) | 785 (20.8%) |
| 10 to 14 Minutes | 594 (13.9%) | 479 (12.7%) |
| 15 to 19 Minutes | 434 (10.2%) | 433 (11.5%) |
| 20 to 24 Minutes | 482 (11.3%) | 393 (10.4%) |
| 25 to 29 Minutes | 198 (4.6%) | 227 (6.0%) |
| 30 to 34 Minutes | 459 (10.7%) | 545 (14.4%) |
| 35 to 39 Minutes | 128 (3.0%) | 80 (2.1%) |
| 40 to 44 Minutes | 110 (2.6%) | 163 (4.3%) |
| 45 to 59 Minutes | 266 (6.2%) | 218 (5.8%) |
| 60 to 89 Minutes | 393 (9.2%) | 165 (4.4%) |
| 90 or more Minutes | 141 (3.3%) | 23 (0.6%) |
Time of Departure to Work by Sex in Seminole County
The most frequent times of departure to work in Seminole County are 7:00 AM to 7:29 AM (617, 14.4%) for males and 7:00 AM to 7:29 AM (699, 18.5%) for females.
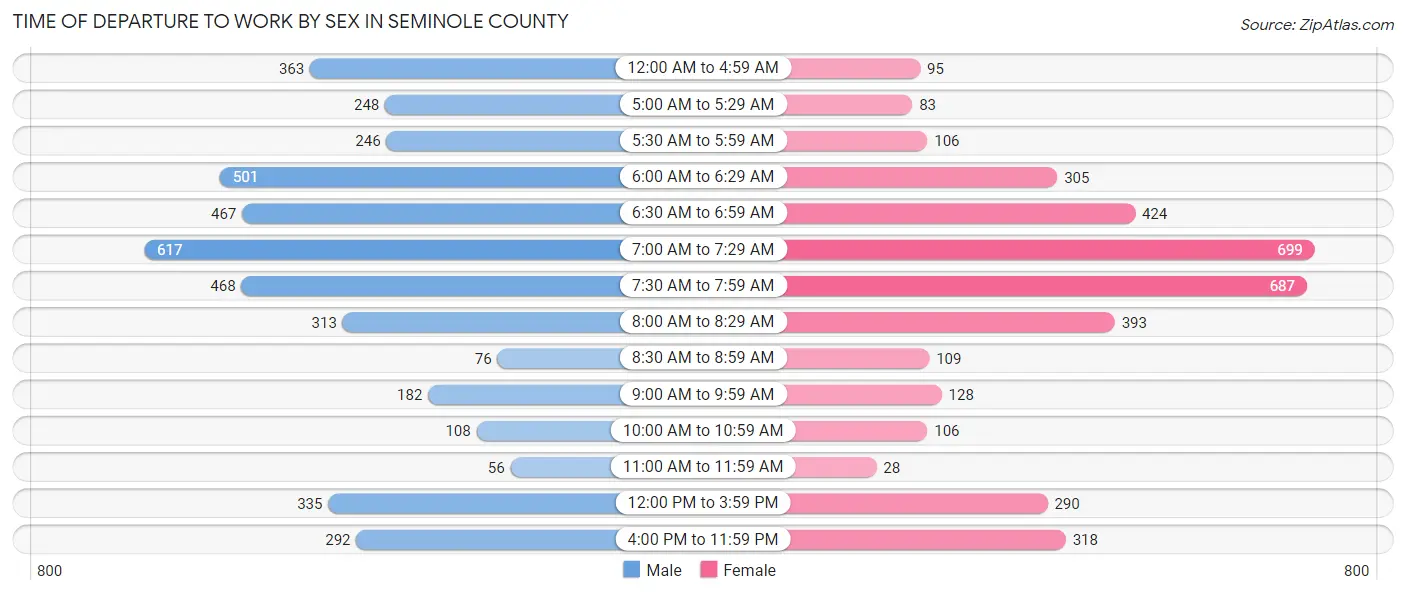
| Time of Departure | Male | Female |
| 12:00 AM to 4:59 AM | 363 (8.5%) | 95 (2.5%) |
| 5:00 AM to 5:29 AM | 248 (5.8%) | 83 (2.2%) |
| 5:30 AM to 5:59 AM | 246 (5.8%) | 106 (2.8%) |
| 6:00 AM to 6:29 AM | 501 (11.7%) | 305 (8.1%) |
| 6:30 AM to 6:59 AM | 467 (10.9%) | 424 (11.2%) |
| 7:00 AM to 7:29 AM | 617 (14.4%) | 699 (18.5%) |
| 7:30 AM to 7:59 AM | 468 (11.0%) | 687 (18.2%) |
| 8:00 AM to 8:29 AM | 313 (7.3%) | 393 (10.4%) |
| 8:30 AM to 8:59 AM | 76 (1.8%) | 109 (2.9%) |
| 9:00 AM to 9:59 AM | 182 (4.3%) | 128 (3.4%) |
| 10:00 AM to 10:59 AM | 108 (2.5%) | 106 (2.8%) |
| 11:00 AM to 11:59 AM | 56 (1.3%) | 28 (0.7%) |
| 12:00 PM to 3:59 PM | 335 (7.8%) | 290 (7.7%) |
| 4:00 PM to 11:59 PM | 292 (6.8%) | 318 (8.4%) |
| Total | 4,272 (100.0%) | 3,771 (100.0%) |
Housing Occupancy in Seminole County
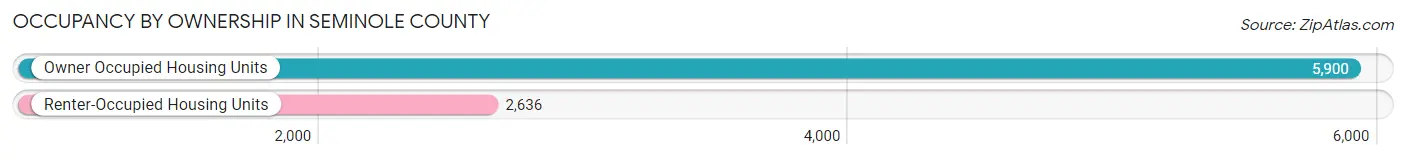
Occupancy by Ownership in Seminole County
Of the total 8,536 dwellings in Seminole County, owner-occupied units account for 5,900 (69.1%), while renter-occupied units make up 2,636 (30.9%).
| Occupancy | # Housing Units | % Housing Units |
| Owner Occupied Housing Units | 5,900 | 69.1% |
| Renter-Occupied Housing Units | 2,636 | 30.9% |
| Total Occupied Housing Units | 8,536 | 100.0% |
Occupancy by Household Size in Seminole County
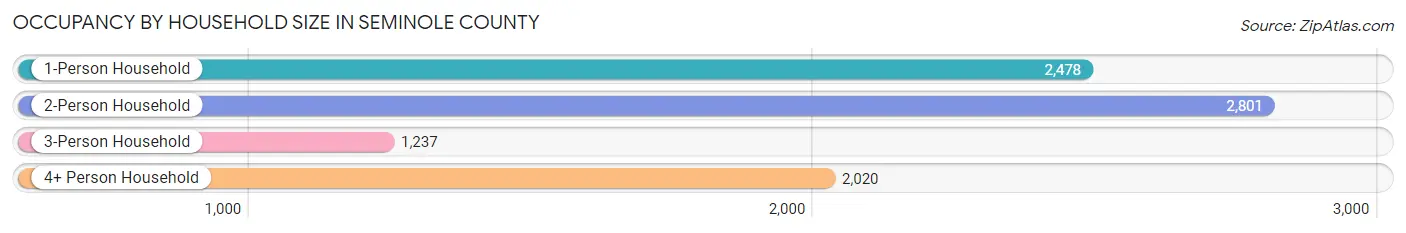
| Household Size | # Housing Units | % Housing Units |
| 1-Person Household | 2,478 | 29.0% |
| 2-Person Household | 2,801 | 32.8% |
| 3-Person Household | 1,237 | 14.5% |
| 4+ Person Household | 2,020 | 23.7% |
| Total Housing Units | 8,536 | 100.0% |
Occupancy by Ownership by Household Size in Seminole County
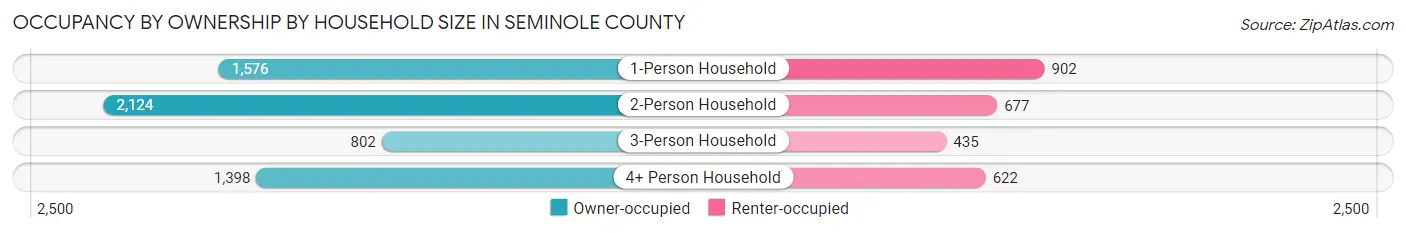
| Household Size | Owner-occupied | Renter-occupied |
| 1-Person Household | 1,576 (63.6%) | 902 (36.4%) |
| 2-Person Household | 2,124 (75.8%) | 677 (24.2%) |
| 3-Person Household | 802 (64.8%) | 435 (35.2%) |
| 4+ Person Household | 1,398 (69.2%) | 622 (30.8%) |
| Total Housing Units | 5,900 (69.1%) | 2,636 (30.9%) |
Occupancy by Educational Attainment in Seminole County
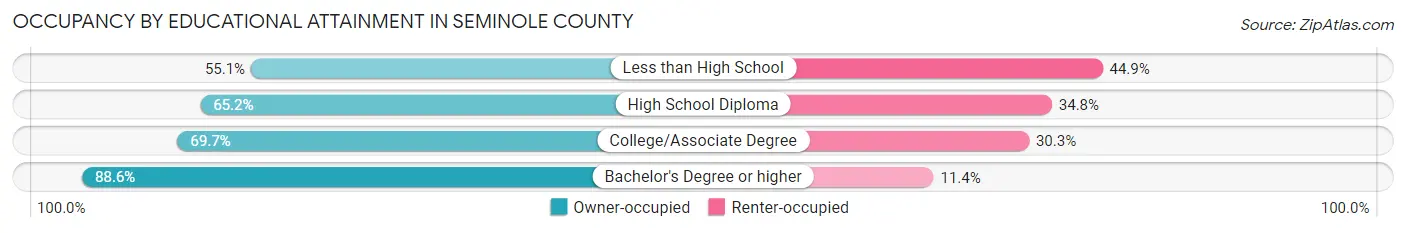
| Household Size | Owner-occupied | Renter-occupied |
| Less than High School | 668 (55.1%) | 544 (44.9%) |
| High School Diploma | 1,828 (65.2%) | 977 (34.8%) |
| College/Associate Degree | 2,213 (69.7%) | 962 (30.3%) |
| Bachelor's Degree or higher | 1,191 (88.6%) | 153 (11.4%) |
Occupancy by Age of Householder in Seminole County
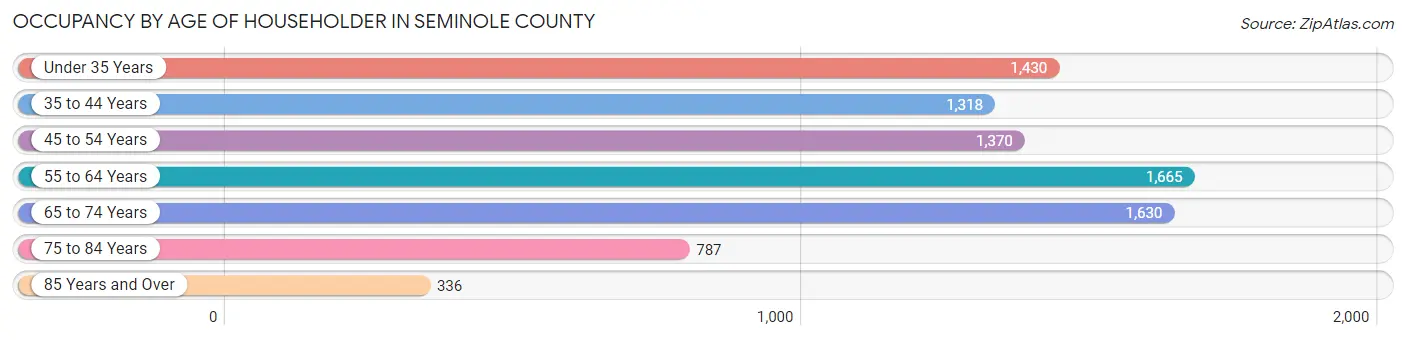
| Age Bracket | # Households | % Households |
| Under 35 Years | 1,430 | 16.8% |
| 35 to 44 Years | 1,318 | 15.4% |
| 45 to 54 Years | 1,370 | 16.1% |
| 55 to 64 Years | 1,665 | 19.5% |
| 65 to 74 Years | 1,630 | 19.1% |
| 75 to 84 Years | 787 | 9.2% |
| 85 Years and Over | 336 | 3.9% |
| Total | 8,536 | 100.0% |
Housing Finances in Seminole County
Median Income by Occupancy in Seminole County
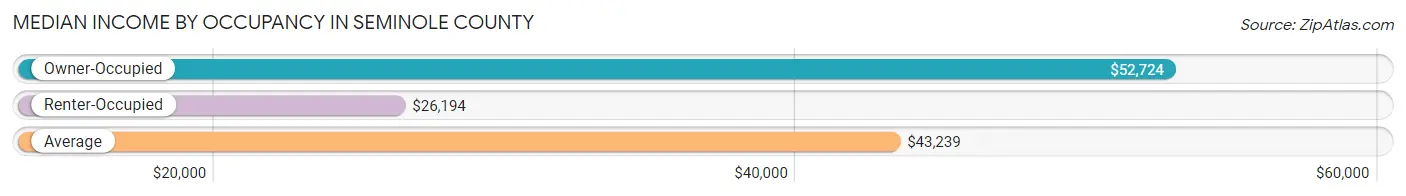
| Occupancy Type | # Households | Median Income |
| Owner-Occupied | 5,900 (69.1%) | $52,724 |
| Renter-Occupied | 2,636 (30.9%) | $26,194 |
| Average | 8,536 (100.0%) | $43,239 |
Occupancy by Householder Income Bracket in Seminole County
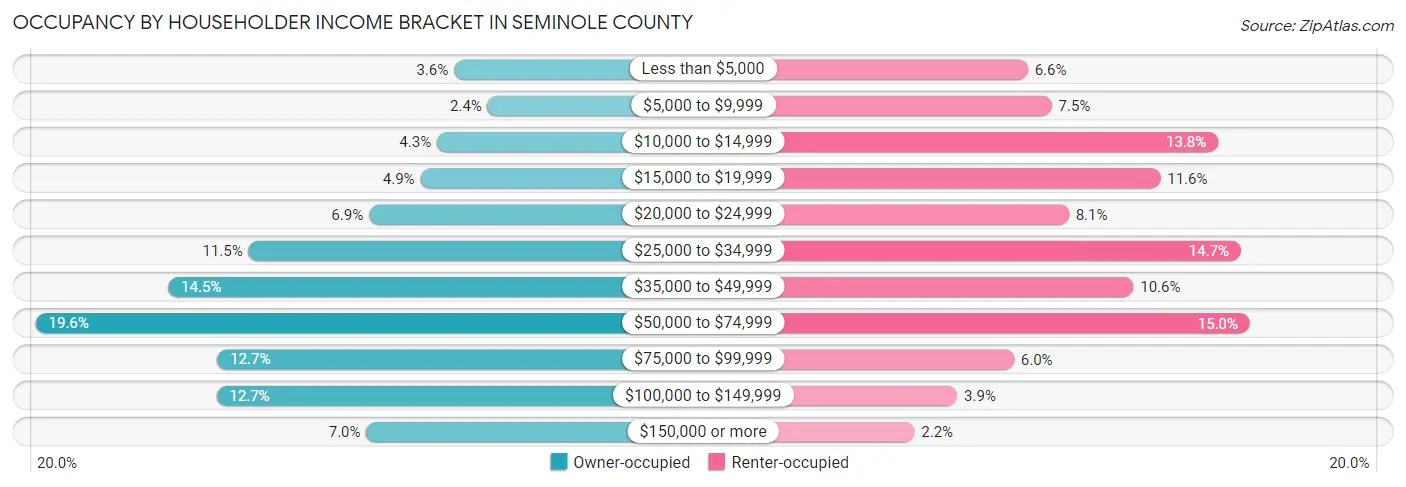
| Income Bracket | Owner-occupied | Renter-occupied |
| Less than $5,000 | 215 (3.6%) | 173 (6.6%) |
| $5,000 to $9,999 | 139 (2.4%) | 197 (7.5%) |
| $10,000 to $14,999 | 253 (4.3%) | 364 (13.8%) |
| $15,000 to $19,999 | 290 (4.9%) | 306 (11.6%) |
| $20,000 to $24,999 | 406 (6.9%) | 214 (8.1%) |
| $25,000 to $34,999 | 677 (11.5%) | 387 (14.7%) |
| $35,000 to $49,999 | 857 (14.5%) | 279 (10.6%) |
| $50,000 to $74,999 | 1,155 (19.6%) | 396 (15.0%) |
| $75,000 to $99,999 | 747 (12.7%) | 159 (6.0%) |
| $100,000 to $149,999 | 749 (12.7%) | 102 (3.9%) |
| $150,000 or more | 412 (7.0%) | 59 (2.2%) |
| Total | 5,900 (100.0%) | 2,636 (100.0%) |
Monthly Housing Cost Tiers in Seminole County
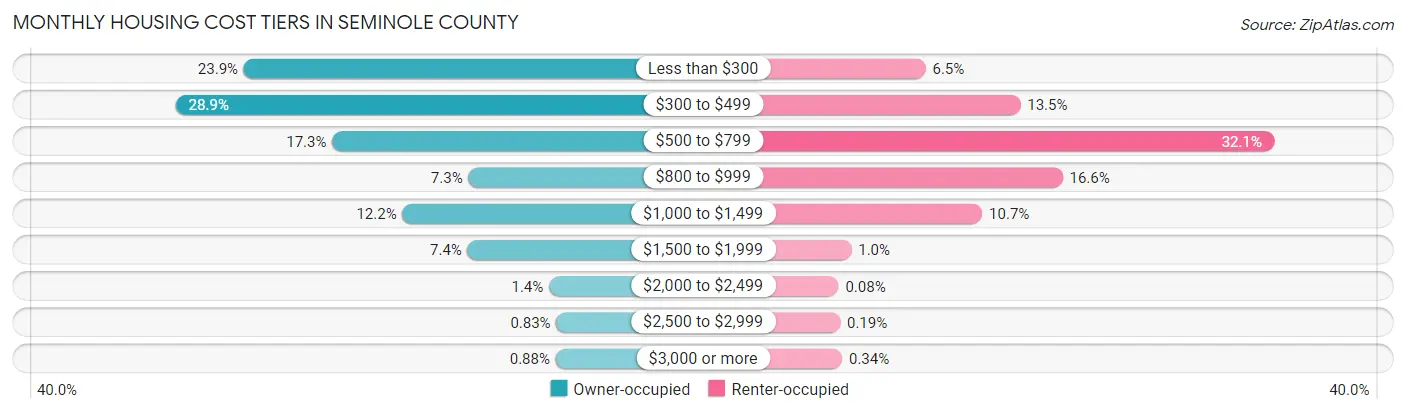
| Monthly Cost | Owner-occupied | Renter-occupied |
| Less than $300 | 1,407 (23.8%) | 171 (6.5%) |
| $300 to $499 | 1,704 (28.9%) | 355 (13.5%) |
| $500 to $799 | 1,023 (17.3%) | 847 (32.1%) |
| $800 to $999 | 431 (7.3%) | 437 (16.6%) |
| $1,000 to $1,499 | 718 (12.2%) | 281 (10.7%) |
| $1,500 to $1,999 | 435 (7.4%) | 27 (1.0%) |
| $2,000 to $2,499 | 81 (1.4%) | 2 (0.1%) |
| $2,500 to $2,999 | 49 (0.8%) | 5 (0.2%) |
| $3,000 or more | 52 (0.9%) | 9 (0.3%) |
| Total | 5,900 (100.0%) | 2,636 (100.0%) |
Physical Housing Characteristics in Seminole County
Housing Structures in Seminole County
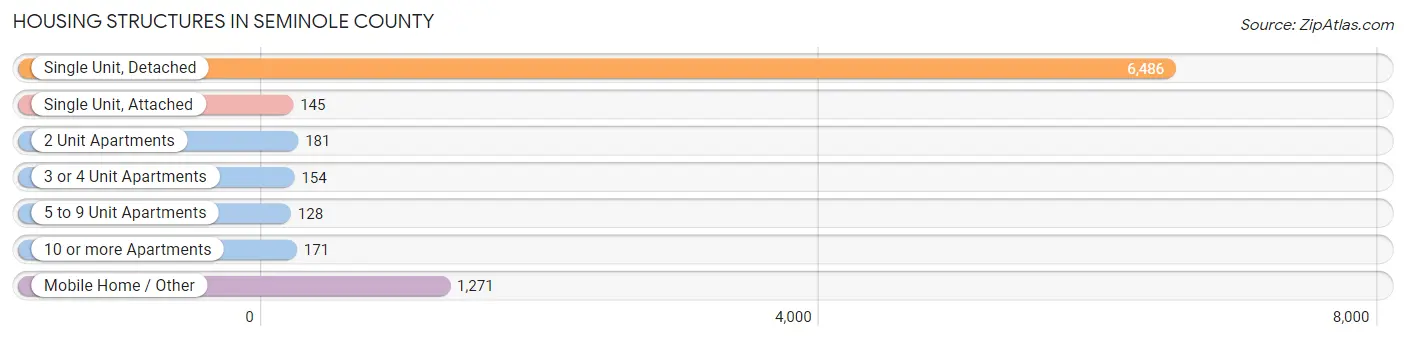
| Structure Type | # Housing Units | % Housing Units |
| Single Unit, Detached | 6,486 | 76.0% |
| Single Unit, Attached | 145 | 1.7% |
| 2 Unit Apartments | 181 | 2.1% |
| 3 or 4 Unit Apartments | 154 | 1.8% |
| 5 to 9 Unit Apartments | 128 | 1.5% |
| 10 or more Apartments | 171 | 2.0% |
| Mobile Home / Other | 1,271 | 14.9% |
| Total | 8,536 | 100.0% |
Housing Structures by Occupancy in Seminole County
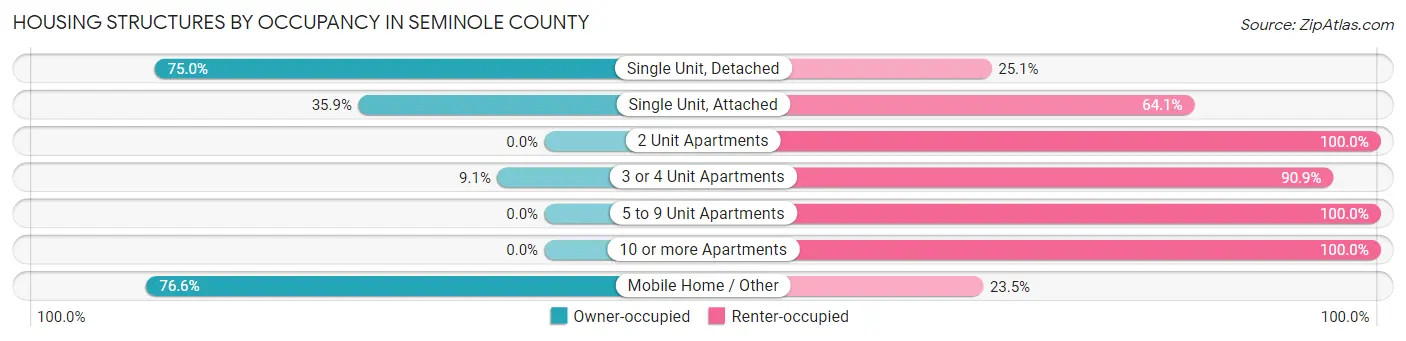
| Structure Type | Owner-occupied | Renter-occupied |
| Single Unit, Detached | 4,861 (75.0%) | 1,625 (25.1%) |
| Single Unit, Attached | 52 (35.9%) | 93 (64.1%) |
| 2 Unit Apartments | 0 (0.0%) | 181 (100.0%) |
| 3 or 4 Unit Apartments | 14 (9.1%) | 140 (90.9%) |
| 5 to 9 Unit Apartments | 0 (0.0%) | 128 (100.0%) |
| 10 or more Apartments | 0 (0.0%) | 171 (100.0%) |
| Mobile Home / Other | 973 (76.5%) | 298 (23.4%) |
| Total | 5,900 (69.1%) | 2,636 (30.9%) |
Housing Structures by Number of Rooms in Seminole County
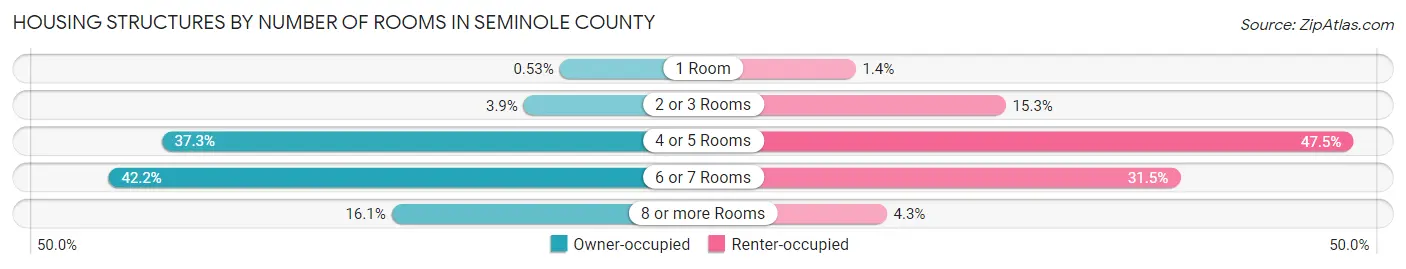
| Number of Rooms | Owner-occupied | Renter-occupied |
| 1 Room | 31 (0.5%) | 38 (1.4%) |
| 2 or 3 Rooms | 227 (3.8%) | 404 (15.3%) |
| 4 or 5 Rooms | 2,202 (37.3%) | 1,251 (47.5%) |
| 6 or 7 Rooms | 2,492 (42.2%) | 829 (31.5%) |
| 8 or more Rooms | 948 (16.1%) | 114 (4.3%) |
| Total | 5,900 (100.0%) | 2,636 (100.0%) |
Housing Structure by Heating Type in Seminole County
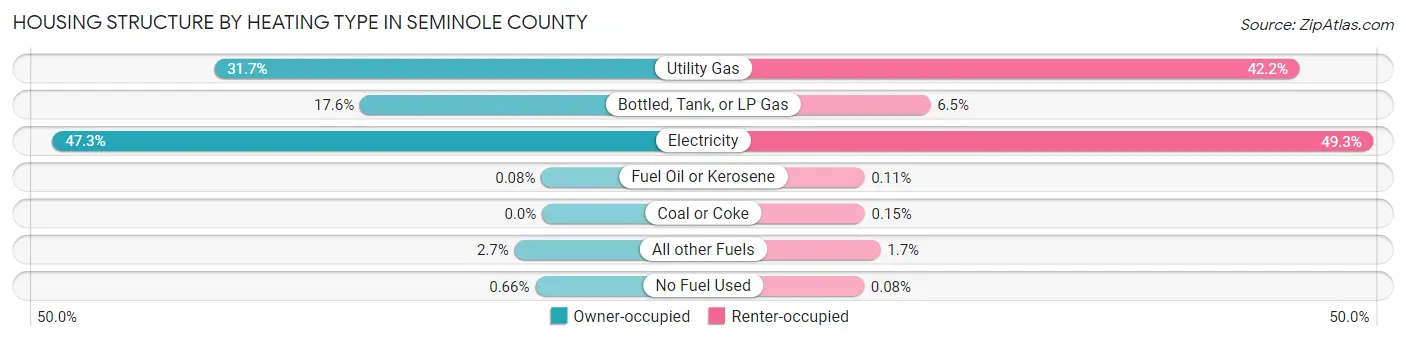
| Heating Type | Owner-occupied | Renter-occupied |
| Utility Gas | 1,869 (31.7%) | 1,112 (42.2%) |
| Bottled, Tank, or LP Gas | 1,038 (17.6%) | 171 (6.5%) |
| Electricity | 2,792 (47.3%) | 1,300 (49.3%) |
| Fuel Oil or Kerosene | 5 (0.1%) | 3 (0.1%) |
| Coal or Coke | 0 (0.0%) | 4 (0.2%) |
| All other Fuels | 157 (2.7%) | 44 (1.7%) |
| No Fuel Used | 39 (0.7%) | 2 (0.1%) |
| Total | 5,900 (100.0%) | 2,636 (100.0%) |
Household Vehicle Usage in Seminole County
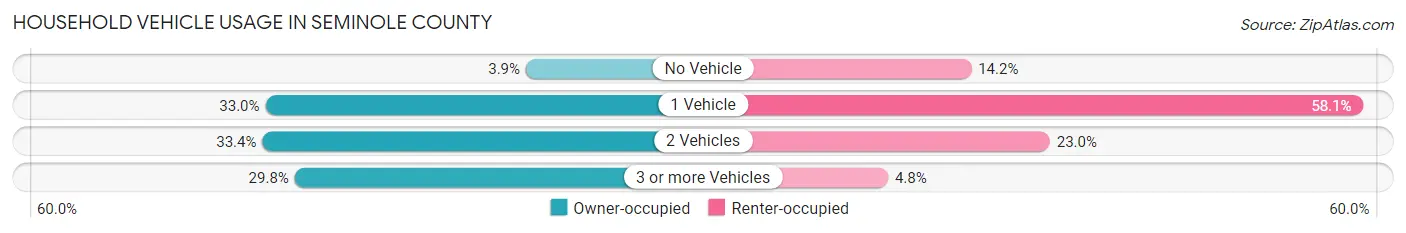
| Vehicles per Household | Owner-occupied | Renter-occupied |
| No Vehicle | 227 (3.8%) | 373 (14.1%) |
| 1 Vehicle | 1,949 (33.0%) | 1,531 (58.1%) |
| 2 Vehicles | 1,969 (33.4%) | 605 (23.0%) |
| 3 or more Vehicles | 1,755 (29.7%) | 127 (4.8%) |
| Total | 5,900 (100.0%) | 2,636 (100.0%) |
Real Estate & Mortgages in Seminole County
Real Estate and Mortgage Overview in Seminole County
| Characteristic | Without Mortgage | With Mortgage |
| Housing Units | 3,726 | 2,174 |
| Median Property Value | $65,600 | $127,000 |
| Median Household Income | $44,692 | $253 |
| Monthly Housing Costs | $346 | $49 |
| Real Estate Taxes | $385 | $88 |
Property Value by Mortgage Status in Seminole County
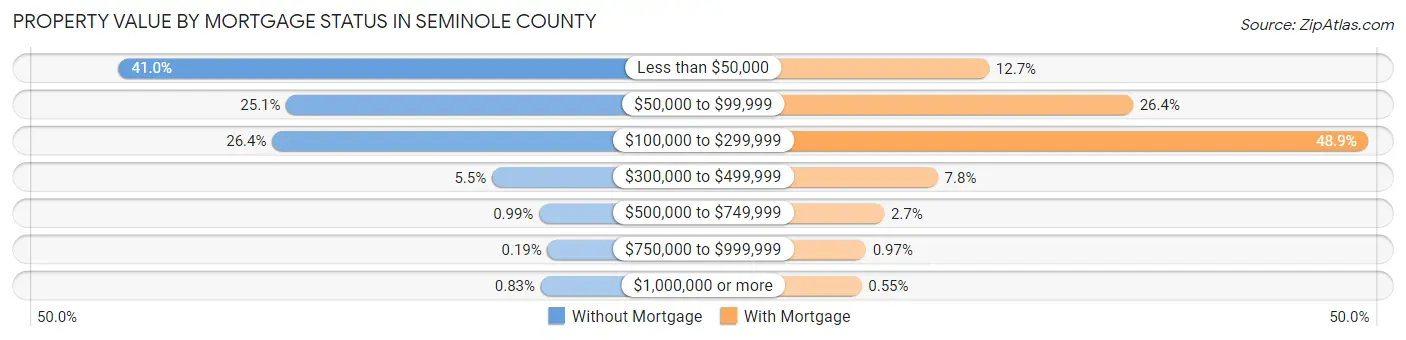
| Property Value | Without Mortgage | With Mortgage |
| Less than $50,000 | 1,529 (41.0%) | 276 (12.7%) |
| $50,000 to $99,999 | 934 (25.1%) | 574 (26.4%) |
| $100,000 to $299,999 | 984 (26.4%) | 1,062 (48.8%) |
| $300,000 to $499,999 | 204 (5.5%) | 170 (7.8%) |
| $500,000 to $749,999 | 37 (1.0%) | 59 (2.7%) |
| $750,000 to $999,999 | 7 (0.2%) | 21 (1.0%) |
| $1,000,000 or more | 31 (0.8%) | 12 (0.5%) |
| Total | 3,726 (100.0%) | 2,174 (100.0%) |
Household Income by Mortgage Status in Seminole County
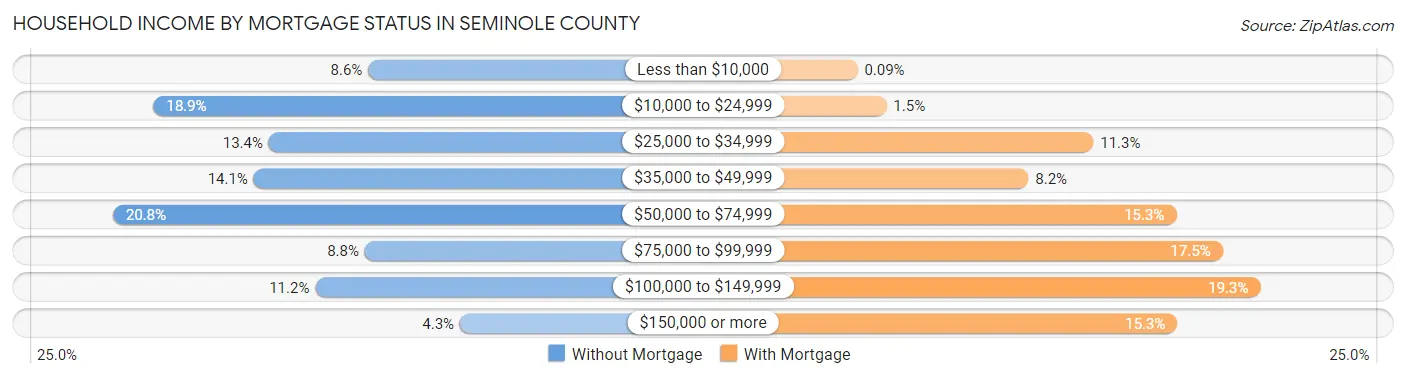
| Household Income | Without Mortgage | With Mortgage |
| Less than $10,000 | 322 (8.6%) | 2 (0.1%) |
| $10,000 to $24,999 | 703 (18.9%) | 32 (1.5%) |
| $25,000 to $34,999 | 498 (13.4%) | 246 (11.3%) |
| $35,000 to $49,999 | 525 (14.1%) | 179 (8.2%) |
| $50,000 to $74,999 | 775 (20.8%) | 332 (15.3%) |
| $75,000 to $99,999 | 328 (8.8%) | 380 (17.5%) |
| $100,000 to $149,999 | 416 (11.2%) | 419 (19.3%) |
| $150,000 or more | 159 (4.3%) | 333 (15.3%) |
| Total | 3,726 (100.0%) | 2,174 (100.0%) |
Property Value to Household Income Ratio in Seminole County
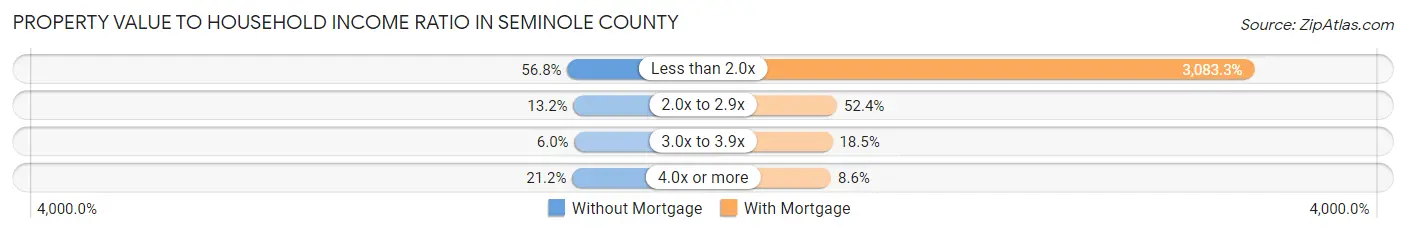
| Value-to-Income Ratio | Without Mortgage | With Mortgage |
| Less than 2.0x | 2,115 (56.8%) | 67,031 (3,083.3%) |
| 2.0x to 2.9x | 491 (13.2%) | 1,140 (52.4%) |
| 3.0x to 3.9x | 224 (6.0%) | 401 (18.4%) |
| 4.0x or more | 790 (21.2%) | 186 (8.6%) |
| Total | 3,726 (100.0%) | 2,174 (100.0%) |
Real Estate Taxes by Mortgage Status in Seminole County
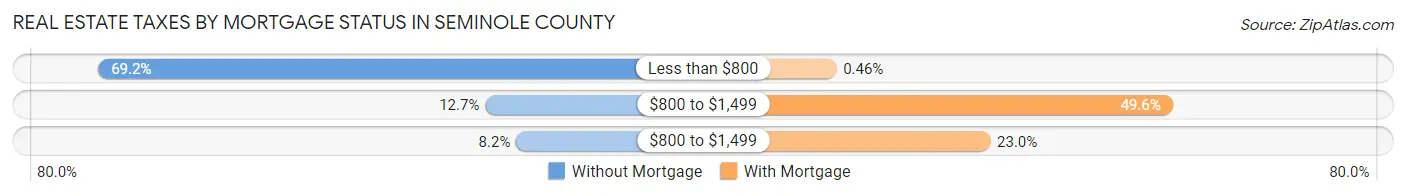
| Property Taxes | Without Mortgage | With Mortgage |
| Less than $800 | 2,580 (69.2%) | 10 (0.5%) |
| $800 to $1,499 | 473 (12.7%) | 1,079 (49.6%) |
| $800 to $1,499 | 304 (8.2%) | 499 (23.0%) |
| Total | 3,726 (100.0%) | 2,174 (100.0%) |
Health & Disability in Seminole County
Health Insurance Coverage by Age in Seminole County
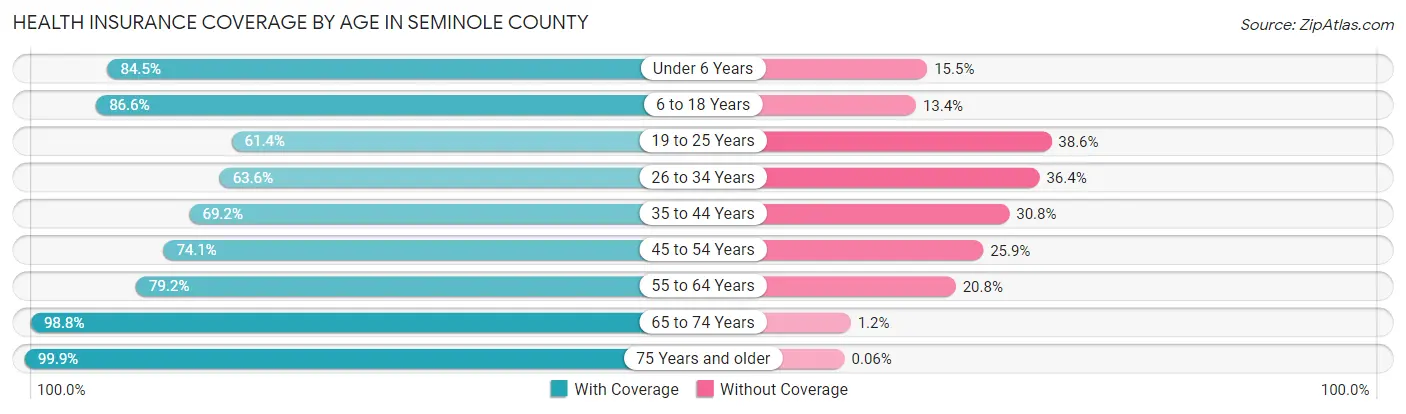
| Age Bracket | With Coverage | Without Coverage |
| Under 6 Years | 1,453 (84.5%) | 266 (15.5%) |
| 6 to 18 Years | 3,820 (86.6%) | 589 (13.4%) |
| 19 to 25 Years | 1,294 (61.4%) | 814 (38.6%) |
| 26 to 34 Years | 1,529 (63.6%) | 875 (36.4%) |
| 35 to 44 Years | 1,863 (69.2%) | 828 (30.8%) |
| 45 to 54 Years | 2,020 (74.1%) | 706 (25.9%) |
| 55 to 64 Years | 2,436 (79.2%) | 639 (20.8%) |
| 65 to 74 Years | 2,308 (98.8%) | 28 (1.2%) |
| 75 Years and older | 1,680 (99.9%) | 1 (0.1%) |
| Total | 18,403 (79.5%) | 4,746 (20.5%) |
Health Insurance Coverage by Citizenship Status in Seminole County
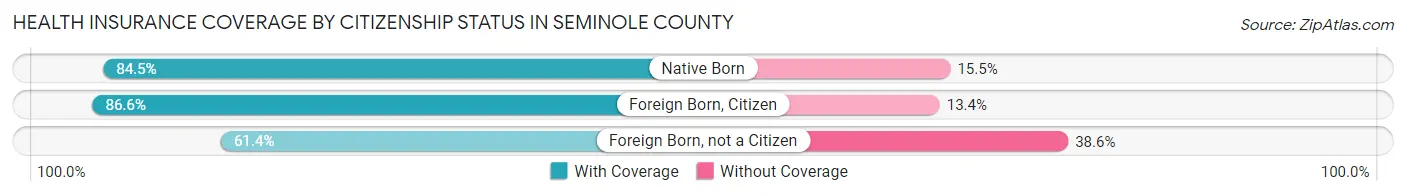
| Citizenship Status | With Coverage | Without Coverage |
| Native Born | 1,453 (84.5%) | 266 (15.5%) |
| Foreign Born, Citizen | 3,820 (86.6%) | 589 (13.4%) |
| Foreign Born, not a Citizen | 1,294 (61.4%) | 814 (38.6%) |
Health Insurance Coverage by Household Income in Seminole County
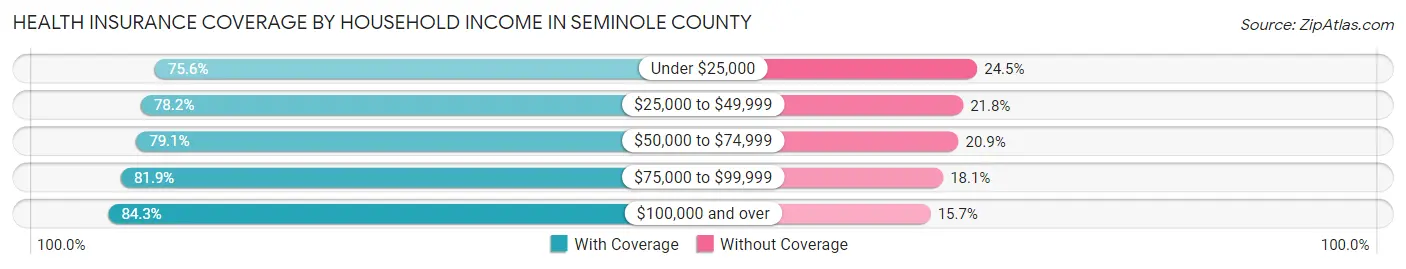
| Household Income | With Coverage | Without Coverage |
| Under $25,000 | 3,758 (75.5%) | 1,216 (24.4%) |
| $25,000 to $49,999 | 4,431 (78.2%) | 1,236 (21.8%) |
| $50,000 to $74,999 | 3,497 (79.1%) | 926 (20.9%) |
| $75,000 to $99,999 | 2,596 (81.9%) | 572 (18.1%) |
| $100,000 and over | 3,908 (84.3%) | 729 (15.7%) |
Public vs Private Health Insurance Coverage by Age in Seminole County
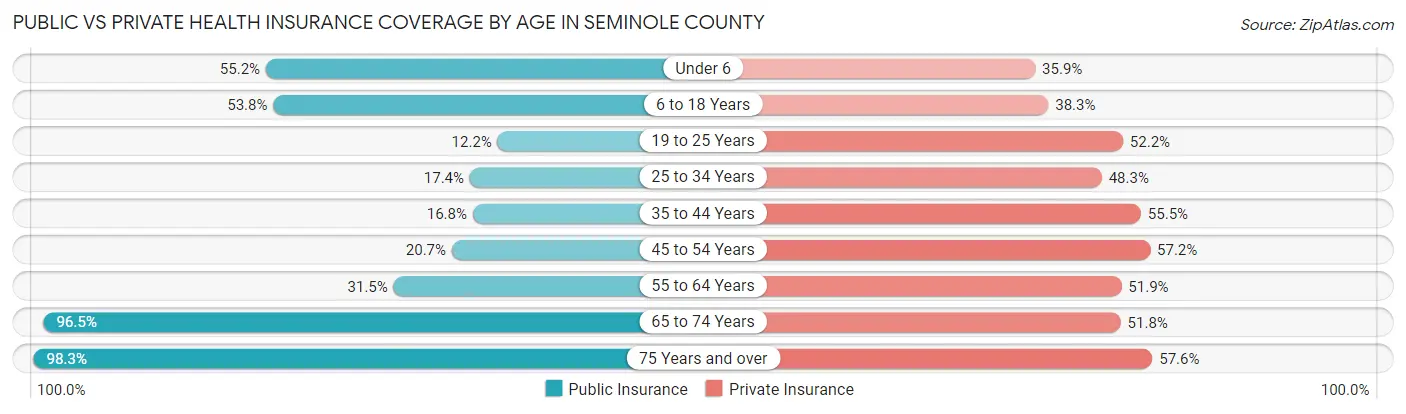
| Age Bracket | Public Insurance | Private Insurance |
| Under 6 | 949 (55.2%) | 617 (35.9%) |
| 6 to 18 Years | 2,374 (53.8%) | 1,690 (38.3%) |
| 19 to 25 Years | 257 (12.2%) | 1,100 (52.2%) |
| 25 to 34 Years | 417 (17.3%) | 1,160 (48.2%) |
| 35 to 44 Years | 452 (16.8%) | 1,494 (55.5%) |
| 45 to 54 Years | 564 (20.7%) | 1,560 (57.2%) |
| 55 to 64 Years | 969 (31.5%) | 1,596 (51.9%) |
| 65 to 74 Years | 2,254 (96.5%) | 1,209 (51.8%) |
| 75 Years and over | 1,653 (98.3%) | 969 (57.6%) |
| Total | 9,889 (42.7%) | 11,395 (49.2%) |
Disability Status by Sex by Age in Seminole County
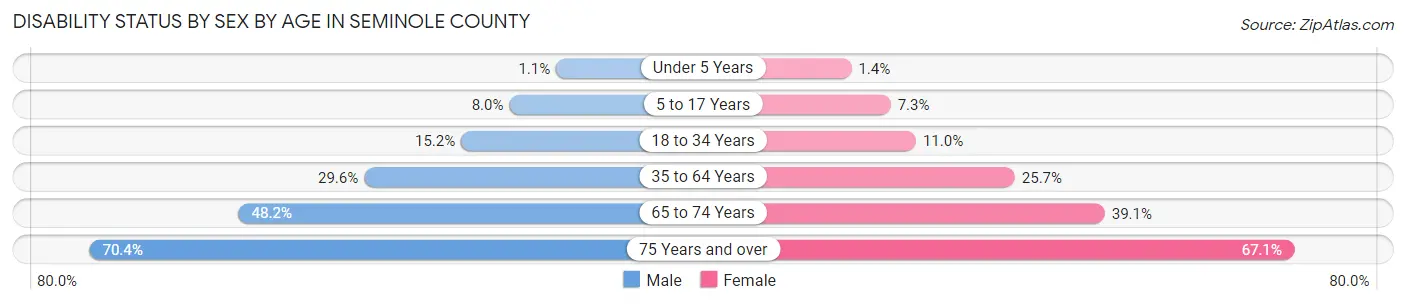
| Age Bracket | Male | Female |
| Under 5 Years | 8 (1.1%) | 10 (1.4%) |
| 5 to 17 Years | 177 (8.0%) | 153 (7.3%) |
| 18 to 34 Years | 381 (15.2%) | 263 (11.0%) |
| 35 to 64 Years | 1,229 (29.6%) | 1,115 (25.7%) |
| 65 to 74 Years | 540 (48.2%) | 475 (39.1%) |
| 75 Years and over | 541 (70.4%) | 612 (67.1%) |
Disability Class by Sex by Age in Seminole County
Disability Class: Hearing Difficulty
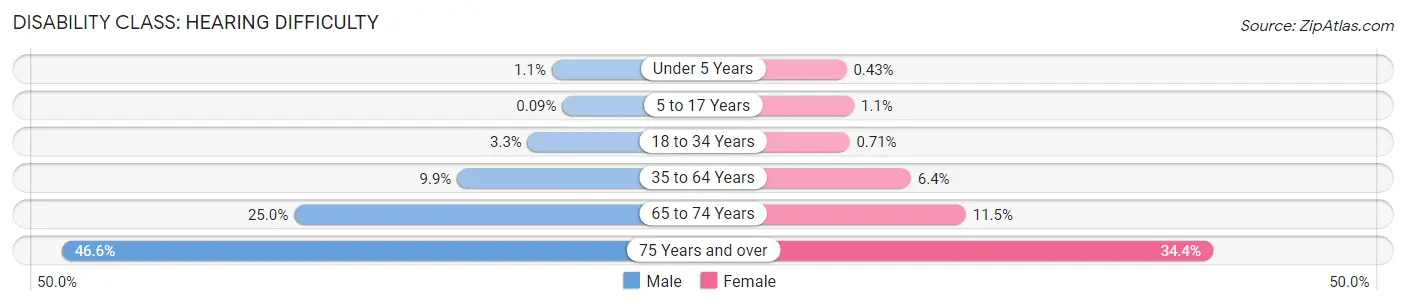
| Age Bracket | Male | Female |
| Under 5 Years | 8 (1.1%) | 3 (0.4%) |
| 5 to 17 Years | 2 (0.1%) | 24 (1.1%) |
| 18 to 34 Years | 83 (3.3%) | 17 (0.7%) |
| 35 to 64 Years | 409 (9.9%) | 278 (6.4%) |
| 65 to 74 Years | 280 (25.0%) | 140 (11.5%) |
| 75 Years and over | 358 (46.6%) | 314 (34.4%) |
Disability Class: Vision Difficulty
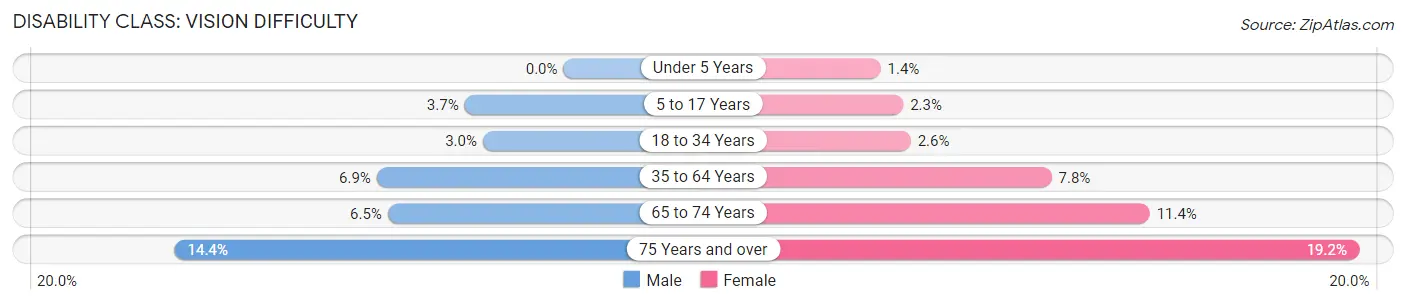
| Age Bracket | Male | Female |
| Under 5 Years | 0 (0.0%) | 10 (1.4%) |
| 5 to 17 Years | 81 (3.7%) | 48 (2.3%) |
| 18 to 34 Years | 75 (3.0%) | 61 (2.6%) |
| 35 to 64 Years | 288 (6.9%) | 338 (7.8%) |
| 65 to 74 Years | 73 (6.5%) | 139 (11.4%) |
| 75 Years and over | 111 (14.4%) | 175 (19.2%) |
Disability Class: Cognitive Difficulty
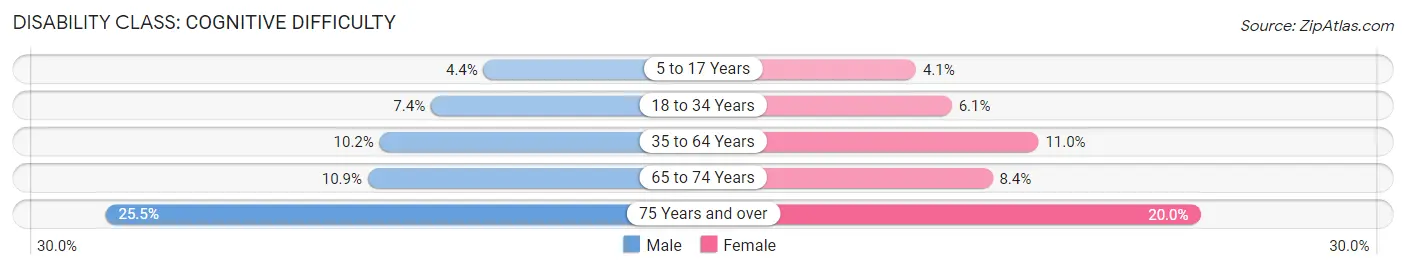
| Age Bracket | Male | Female |
| 5 to 17 Years | 98 (4.4%) | 87 (4.1%) |
| 18 to 34 Years | 185 (7.4%) | 146 (6.1%) |
| 35 to 64 Years | 425 (10.2%) | 475 (11.0%) |
| 65 to 74 Years | 122 (10.9%) | 102 (8.4%) |
| 75 Years and over | 196 (25.5%) | 182 (20.0%) |
Disability Class: Ambulatory Difficulty
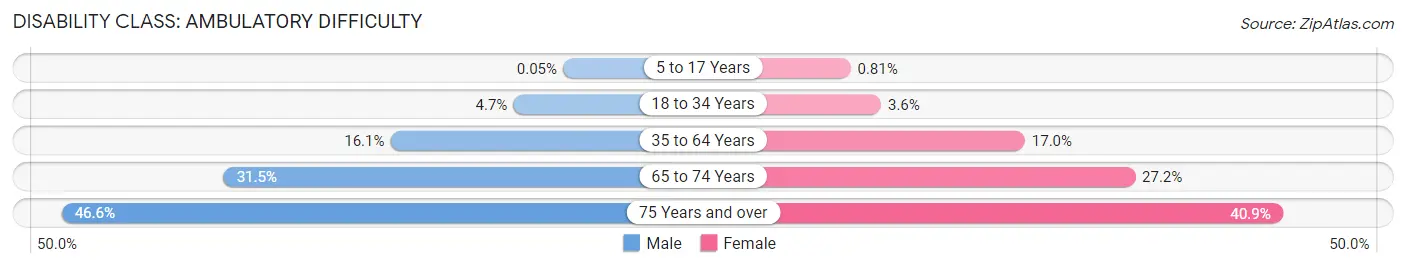
| Age Bracket | Male | Female |
| 5 to 17 Years | 1 (0.1%) | 17 (0.8%) |
| 18 to 34 Years | 117 (4.7%) | 87 (3.6%) |
| 35 to 64 Years | 667 (16.1%) | 737 (17.0%) |
| 65 to 74 Years | 353 (31.5%) | 331 (27.2%) |
| 75 Years and over | 358 (46.6%) | 373 (40.9%) |
Disability Class: Self-Care Difficulty
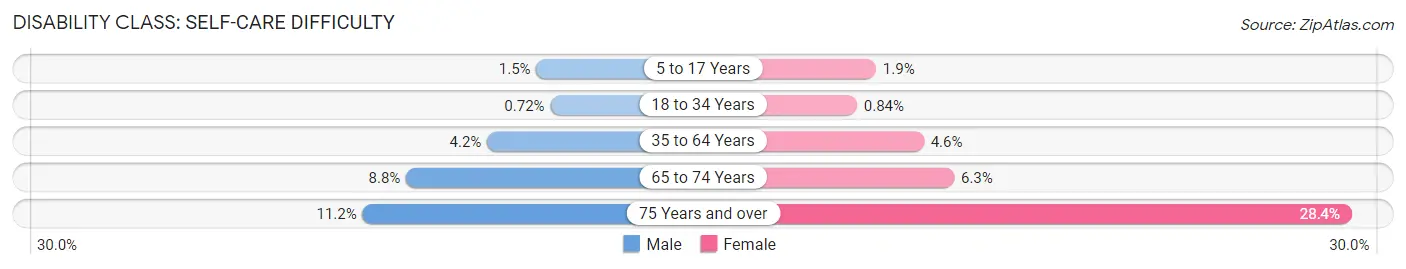
| Age Bracket | Male | Female |
| 5 to 17 Years | 33 (1.5%) | 40 (1.9%) |
| 18 to 34 Years | 18 (0.7%) | 20 (0.8%) |
| 35 to 64 Years | 176 (4.2%) | 198 (4.6%) |
| 65 to 74 Years | 98 (8.7%) | 76 (6.2%) |
| 75 Years and over | 86 (11.2%) | 259 (28.4%) |
Technology Access in Seminole County
Computing Device Access in Seminole County
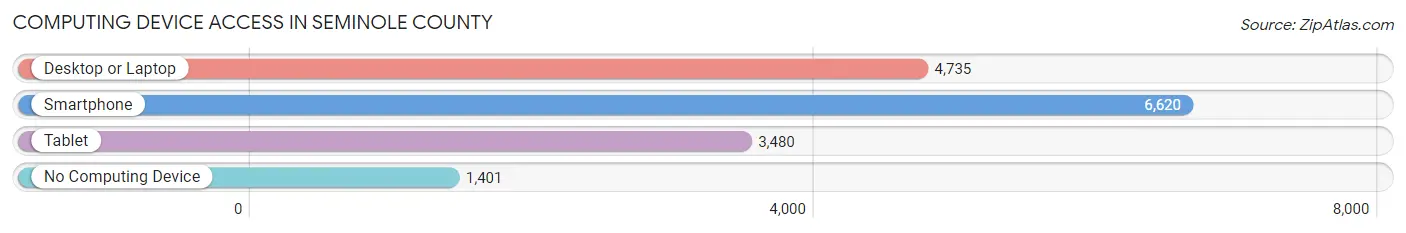
| Device Type | # Households | % Households |
| Desktop or Laptop | 4,735 | 55.5% |
| Smartphone | 6,620 | 77.5% |
| Tablet | 3,480 | 40.8% |
| No Computing Device | 1,401 | 16.4% |
| Total | 8,536 | 100.0% |
Internet Access in Seminole County
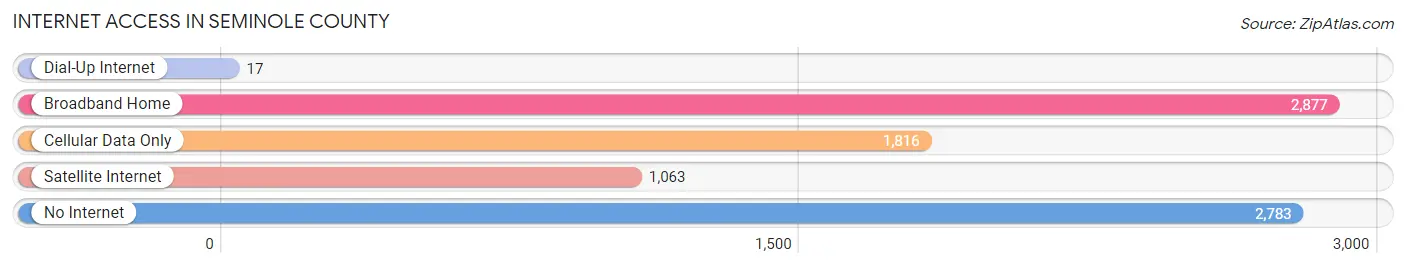
| Internet Type | # Households | % Households |
| Dial-Up Internet | 17 | 0.2% |
| Broadband Home | 2,877 | 33.7% |
| Cellular Data Only | 1,816 | 21.3% |
| Satellite Internet | 1,063 | 12.4% |
| No Internet | 2,783 | 32.6% |
| Total | 8,536 | 100.0% |
Seminole County Summary
Seminole County is located in the east-central part of Oklahoma, and is bordered by Hughes County to the north, Pontotoc County to the east, Pottawatomie County to the south, and Okfuskee County to the west. The county seat is Wewoka, and the county was named for the Seminole Nation of Native Americans who once lived in the area.
Geography
Seminole County covers an area of 745 square miles, and is mostly flat with some rolling hills. The terrain is mostly covered in grasslands, with some wooded areas. The county is drained by the North Canadian River, which flows through the county from east to west. The county is also home to several small lakes, including Lake Wewoka, Lake Holdenville, and Lake Seminole.
Demographics
As of the 2010 census, Seminole County had a population of 25,482. The racial makeup of the county was 68.2% White, 15.2% Native American, 0.7% Black or African American, 0.4% Asian, 0.1% Pacific Islander, and 14.4% from other races. Hispanic or Latino of any race were 4.3% of the population.
Economy
The economy of Seminole County is largely based on agriculture, with the main crops being cotton, corn, and soybeans. The county is also home to several oil and gas fields, and there are several manufacturing plants in the area. The county is also home to several casinos, which provide a significant source of revenue for the county.
History
Seminole County was created in 1907 from parts of Pontotoc, Hughes, and Okfuskee counties. The county was named for the Seminole Nation of Native Americans who once lived in the area. The county seat was originally located in Sasakwa, but was moved to Wewoka in 1909.
The county was largely rural until the 1930s, when oil and gas were discovered in the area. This led to an influx of people and businesses, and the county's population grew rapidly. The county was also home to several military bases during World War II, which provided a significant boost to the local economy.
In the 1950s, the county began to diversify its economy, and several manufacturing plants were established in the area. The county also began to attract tourists, and several casinos were built in the area.
Today, Seminole County is a largely rural county, with a population of around 25,000. The county is home to several small towns, and the economy is largely based on agriculture and tourism. The county is also home to several casinos, which provide a significant source of revenue for the county.
Common Questions
What is Per Capita Income in Seminole County?
Per Capita income in Seminole County is $23,137.
What is the Median Family Income in Seminole County?
Median Family Income in Seminole County is $51,352.
What is the Median Household income in Seminole County?
Median Household Income in Seminole County is $43,239.
What is Income or Wage Gap in Seminole County?
Income or Wage Gap in Seminole County is 29.5%.
Women in Seminole County earn 70.5 cents for every dollar earned by a man.
What is Family Income Deficit in Seminole County?
Family Income Deficit in Seminole County is $11,676.
Families that are below poverty line in Seminole County earn $11,676 less on average than the poverty threshold level.
What is Inequality or Gini Index in Seminole County?
Inequality or Gini Index in Seminole County is 0.46.
What is the Total Population of Seminole County?
Total Population of Seminole County is 23,592.
What is the Total Male Population of Seminole County?
Total Male Population of Seminole County is 11,650.
What is the Total Female Population of Seminole County?
Total Female Population of Seminole County is 11,942.
What is the Ratio of Males per 100 Females in Seminole County?
There are 97.55 Males per 100 Females in Seminole County.
What is the Ratio of Females per 100 Males in Seminole County?
There are 102.51 Females per 100 Males in Seminole County.
What is the Median Population Age in Seminole County?
Median Population Age in Seminole County is 38.9 Years.
What is the Average Family Size in Seminole County
Average Family Size in Seminole County is 3.3 People.
What is the Average Household Size in Seminole County
Average Household Size in Seminole County is 2.7 People.
How Large is the Labor Force in Seminole County?
There are 9,172 People in the Labor Forcein in Seminole County.
What is the Percentage of People in the Labor Force in Seminole County?
49.5% of People are in the Labor Force in Seminole County.
What is the Unemployment Rate in Seminole County?
Unemployment Rate in Seminole County is 7.2%.