Roger Mills County, OK Map & Demographics
Roger Mills County Map
Roger Mills County Overview
$43,603
PER CAPITA INCOME
$68,041
AVG FAMILY INCOME
$57,574
AVG HOUSEHOLD INCOME
39.8%
WAGE / INCOME GAP [ % ]
60.2¢/ $1
WAGE / INCOME GAP [ $ ]
0.54
INEQUALITY / GINI INDEX
3,423
TOTAL POPULATION
1,783
MALE POPULATION
1,640
FEMALE POPULATION
108.72
MALES / 100 FEMALES
91.98
FEMALES / 100 MALES
42.0
MEDIAN AGE
2.8
AVG FAMILY SIZE
2.3
AVG HOUSEHOLD SIZE
1,552
LABOR FORCE [ PEOPLE ]
58.7%
PERCENT IN LABOR FORCE
4.7%
UNEMPLOYMENT RATE
Roger Mills County Area Codes
Income in Roger Mills County
Income Overview in Roger Mills County
Per Capita Income in Roger Mills County is $43,603, while median incomes of families and households are $68,041 and $57,574 respectively.
| Characteristic | Number | Measure |
| Per Capita Income | 3,423 | $43,603 |
| Median Family Income | 1,034 | $68,041 |
| Mean Family Income | 1,034 | $92,070 |
| Median Household Income | 1,458 | $57,574 |
| Mean Household Income | 1,458 | $98,522 |
| Income Deficit | 1,034 | $0 |
| Wage / Income Gap (%) | 3,423 | 39.83% |
| Wage / Income Gap ($) | 3,423 | 60.17¢ per $1 |
| Gini / Inequality Index | 3,423 | 0.54 |
Earnings by Sex in Roger Mills County
Average Earnings in Roger Mills County are $41,071, $52,972 for men and $31,875 for women, a difference of 39.8%.
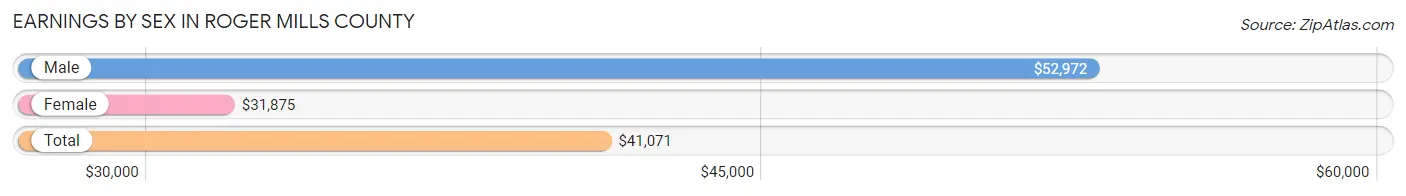
| Sex | Number | Average Earnings |
| Male | 921 (56.9%) | $52,972 |
| Female | 697 (43.1%) | $31,875 |
| Total | 1,618 (100.0%) | $41,071 |
Earnings by Sex by Income Bracket in Roger Mills County
The most common earnings brackets in Roger Mills County are $100,000+ for men (201 | 21.8%) and $35,000 to $39,999 for women (72 | 10.3%).
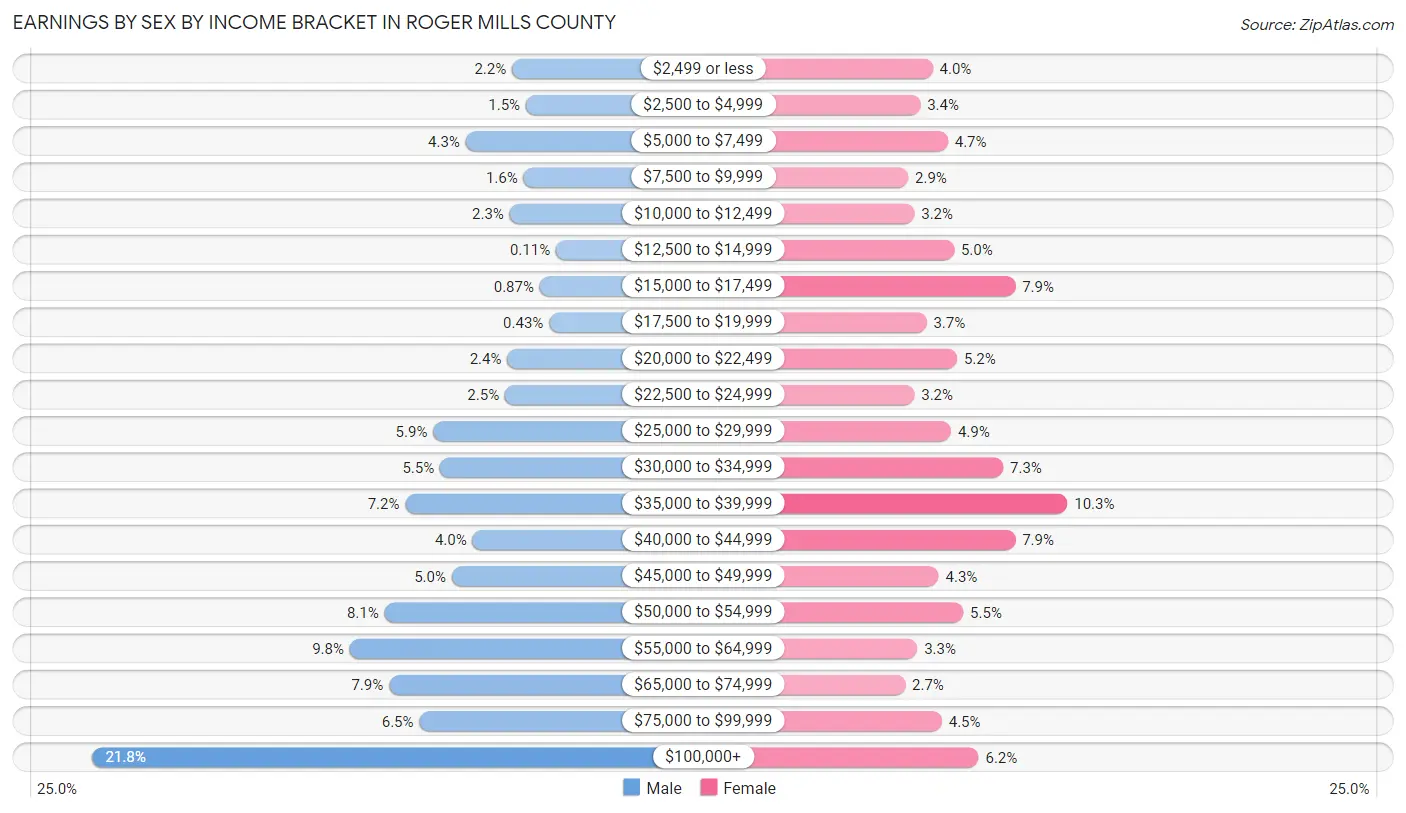
| Income | Male | Female |
| $2,499 or less | 20 (2.2%) | 28 (4.0%) |
| $2,500 to $4,999 | 14 (1.5%) | 24 (3.4%) |
| $5,000 to $7,499 | 40 (4.3%) | 33 (4.7%) |
| $7,500 to $9,999 | 15 (1.6%) | 20 (2.9%) |
| $10,000 to $12,499 | 21 (2.3%) | 22 (3.2%) |
| $12,500 to $14,999 | 1 (0.1%) | 35 (5.0%) |
| $15,000 to $17,499 | 8 (0.9%) | 55 (7.9%) |
| $17,500 to $19,999 | 4 (0.4%) | 26 (3.7%) |
| $20,000 to $22,499 | 22 (2.4%) | 36 (5.2%) |
| $22,500 to $24,999 | 23 (2.5%) | 22 (3.2%) |
| $25,000 to $29,999 | 54 (5.9%) | 34 (4.9%) |
| $30,000 to $34,999 | 51 (5.5%) | 51 (7.3%) |
| $35,000 to $39,999 | 66 (7.2%) | 72 (10.3%) |
| $40,000 to $44,999 | 37 (4.0%) | 55 (7.9%) |
| $45,000 to $49,999 | 46 (5.0%) | 30 (4.3%) |
| $50,000 to $54,999 | 75 (8.1%) | 38 (5.4%) |
| $55,000 to $64,999 | 90 (9.8%) | 23 (3.3%) |
| $65,000 to $74,999 | 73 (7.9%) | 19 (2.7%) |
| $75,000 to $99,999 | 60 (6.5%) | 31 (4.4%) |
| $100,000+ | 201 (21.8%) | 43 (6.2%) |
| Total | 921 (100.0%) | 697 (100.0%) |
Earnings by Sex by Educational Attainment in Roger Mills County
Average earnings in Roger Mills County are $53,361 for men and $35,203 for women, a difference of 34.0%. Men with an educational attainment of graduate degree enjoy the highest average annual earnings of $110,952, while those with less than high school education earn the least with $34,500. Women with an educational attainment of graduate degree earn the most with the average annual earnings of $69,688, while those with less than high school education have the smallest earnings of $18,750.
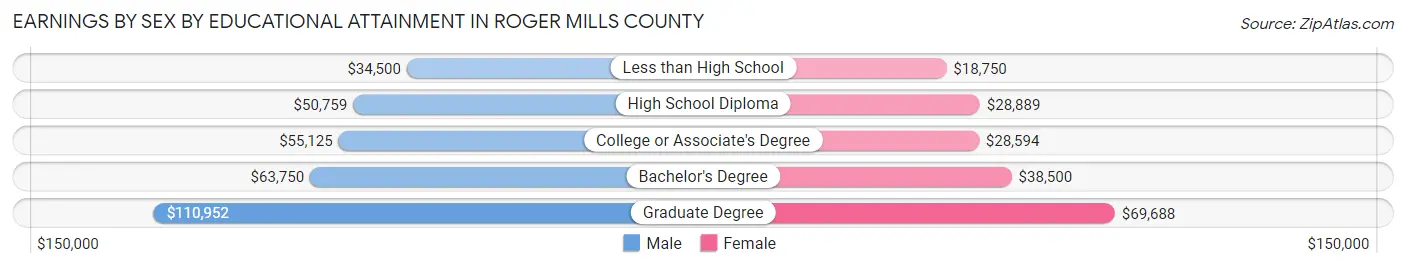
| Educational Attainment | Male Income | Female Income |
| Less than High School | $34,500 | $18,750 |
| High School Diploma | $50,759 | $28,889 |
| College or Associate's Degree | $55,125 | $28,594 |
| Bachelor's Degree | $63,750 | $38,500 |
| Graduate Degree | $110,952 | $69,688 |
| Total | $53,361 | $35,203 |
Family Income in Roger Mills County
Family Income Brackets in Roger Mills County
According to the Roger Mills County family income data, there are 237 families falling into the $50,000 to $74,999 income range, which is the most common income bracket and makes up 22.9% of all families. Conversely, the $10,000 to $14,999 income bracket is the least frequent group with only 6 families (0.6%) belonging to this category.
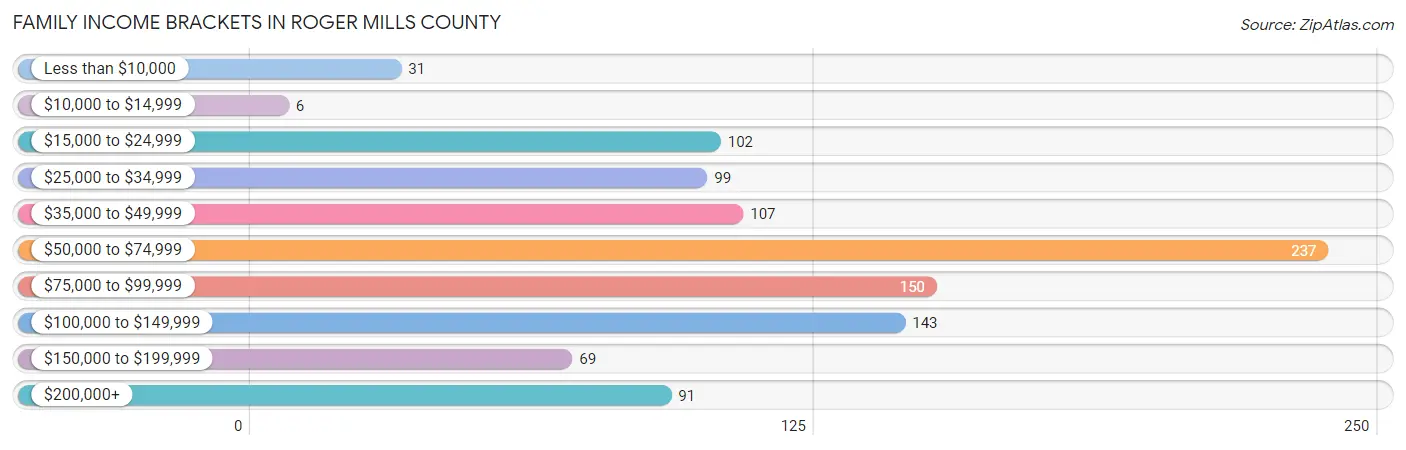
| Income Bracket | # Families | % Families |
| Less than $10,000 | 31 | 3.0% |
| $10,000 to $14,999 | 6 | 0.6% |
| $15,000 to $24,999 | 102 | 9.9% |
| $25,000 to $34,999 | 99 | 9.6% |
| $35,000 to $49,999 | 107 | 10.3% |
| $50,000 to $74,999 | 237 | 22.9% |
| $75,000 to $99,999 | 150 | 14.5% |
| $100,000 to $149,999 | 143 | 13.8% |
| $150,000 to $199,999 | 69 | 6.7% |
| $200,000+ | 91 | 8.8% |
Family Income by Famaliy Size in Roger Mills County
5-person families (72 | 7.0%) account for the highest median family income in Roger Mills County with $78,571 per family, while 2-person families (608 | 58.8%) have the highest median income of $34,838 per family member.
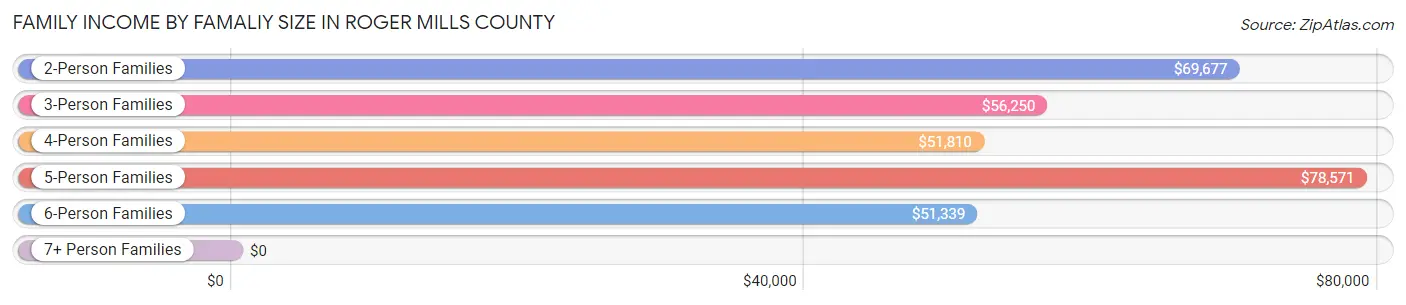
| Income Bracket | # Families | Median Income |
| 2-Person Families | 608 (58.8%) | $69,677 |
| 3-Person Families | 145 (14.0%) | $56,250 |
| 4-Person Families | 150 (14.5%) | $51,810 |
| 5-Person Families | 72 (7.0%) | $78,571 |
| 6-Person Families | 56 (5.4%) | $51,339 |
| 7+ Person Families | 3 (0.3%) | $0 |
| Total | 1,034 (100.0%) | $68,041 |
Family Income by Number of Earners in Roger Mills County
The median family income in Roger Mills County is $68,041, with families comprising 3+ earners (15) having the highest median family income of $130,250, while families with no earners (198) have the lowest median family income of $37,143, accounting for 1.5% and 19.2% of families, respectively.
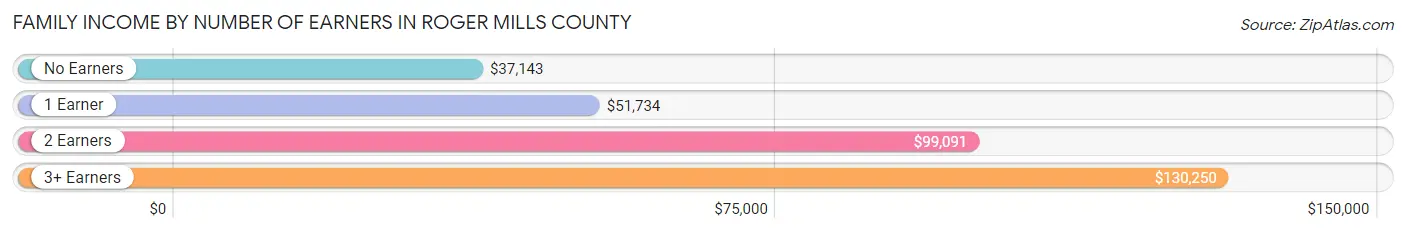
| Number of Earners | # Families | Median Income |
| No Earners | 198 (19.2%) | $37,143 |
| 1 Earner | 391 (37.8%) | $51,734 |
| 2 Earners | 430 (41.6%) | $99,091 |
| 3+ Earners | 15 (1.5%) | $130,250 |
| Total | 1,034 (100.0%) | $68,041 |
Household Income in Roger Mills County
Household Income Brackets in Roger Mills County
With 322 households falling in the category, the $50,000 to $74,999 income range is the most frequent in Roger Mills County, accounting for 22.1% of all households. In contrast, only 28 households (1.9%) fall into the $10,000 to $14,999 income bracket, making it the least populous group.
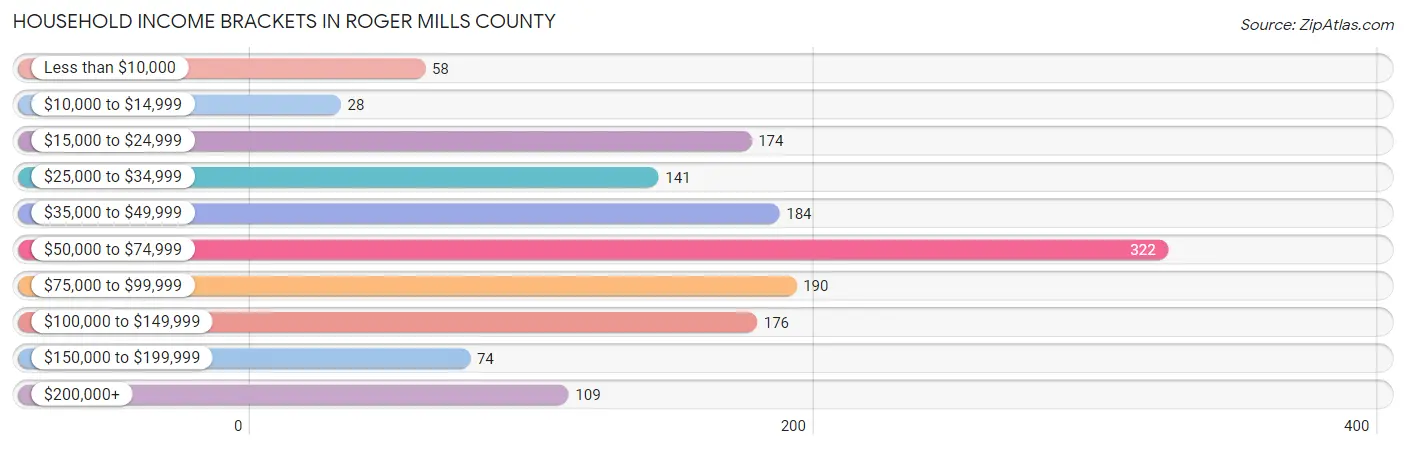
| Income Bracket | # Households | % Households |
| Less than $10,000 | 58 | 4.0% |
| $10,000 to $14,999 | 28 | 1.9% |
| $15,000 to $24,999 | 174 | 11.9% |
| $25,000 to $34,999 | 141 | 9.7% |
| $35,000 to $49,999 | 184 | 12.6% |
| $50,000 to $74,999 | 322 | 22.1% |
| $75,000 to $99,999 | 190 | 13.0% |
| $100,000 to $149,999 | 176 | 12.1% |
| $150,000 to $199,999 | 74 | 5.1% |
| $200,000+ | 109 | 7.5% |
Household Income by Householder Age in Roger Mills County
The median household income in Roger Mills County is $57,574, with the highest median household income of $85,223 found in the 15 to 24 years age bracket for the primary householder. A total of 99 households (6.8%) fall into this category. Meanwhile, the 65+ years age bracket for the primary householder has the lowest median household income of $52,019, with 505 households (34.6%) in this group.
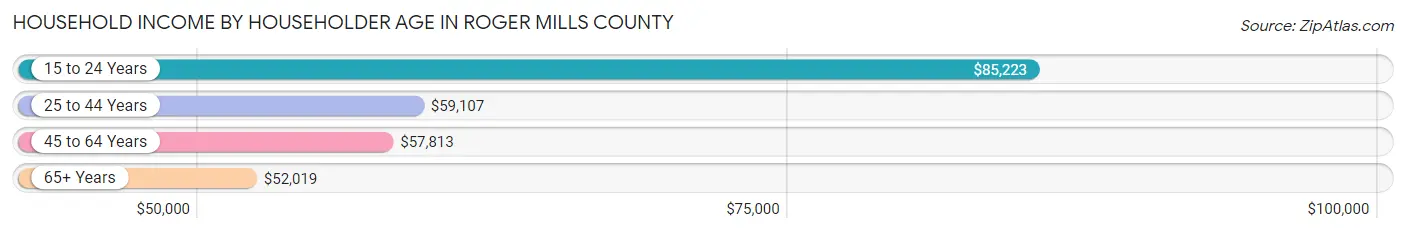
| Income Bracket | # Households | Median Income |
| 15 to 24 Years | 99 (6.8%) | $85,223 |
| 25 to 44 Years | 381 (26.1%) | $59,107 |
| 45 to 64 Years | 473 (32.4%) | $57,813 |
| 65+ Years | 505 (34.6%) | $52,019 |
| Total | 1,458 (100.0%) | $57,574 |
Poverty in Roger Mills County
Income Below Poverty by Sex and Age in Roger Mills County
With 11.5% poverty level for males and 15.8% for females among the residents of Roger Mills County, 25 to 34 year old males and 15 year old females are the most vulnerable to poverty, with 48 males (33.3%) and 4 females (36.4%) in their respective age groups living below the poverty level.
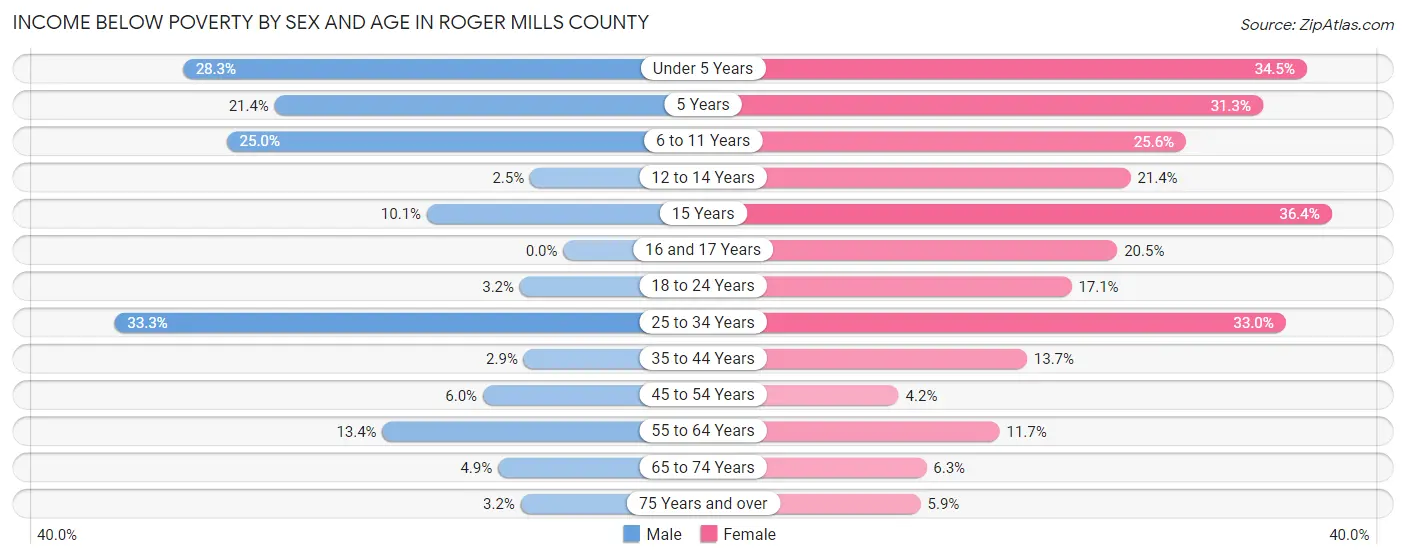
| Age Bracket | Male | Female |
| Under 5 Years | 26 (28.3%) | 29 (34.5%) |
| 5 Years | 3 (21.4%) | 5 (31.2%) |
| 6 to 11 Years | 43 (25.0%) | 35 (25.6%) |
| 12 to 14 Years | 2 (2.5%) | 18 (21.4%) |
| 15 Years | 8 (10.1%) | 4 (36.4%) |
| 16 and 17 Years | 0 (0.0%) | 9 (20.4%) |
| 18 to 24 Years | 4 (3.2%) | 15 (17.1%) |
| 25 to 34 Years | 48 (33.3%) | 57 (33.0%) |
| 35 to 44 Years | 7 (2.9%) | 29 (13.7%) |
| 45 to 54 Years | 12 (6.0%) | 7 (4.2%) |
| 55 to 64 Years | 36 (13.4%) | 26 (11.7%) |
| 65 to 74 Years | 10 (4.9%) | 13 (6.3%) |
| 75 Years and over | 4 (3.2%) | 11 (5.9%) |
| Total | 203 (11.5%) | 258 (15.8%) |
Income Above Poverty by Sex and Age in Roger Mills County
According to the poverty statistics in Roger Mills County, males aged 16 and 17 years and females aged 45 to 54 years are the age groups that are most secure financially, with 100.0% of males and 95.8% of females in these age groups living above the poverty line.
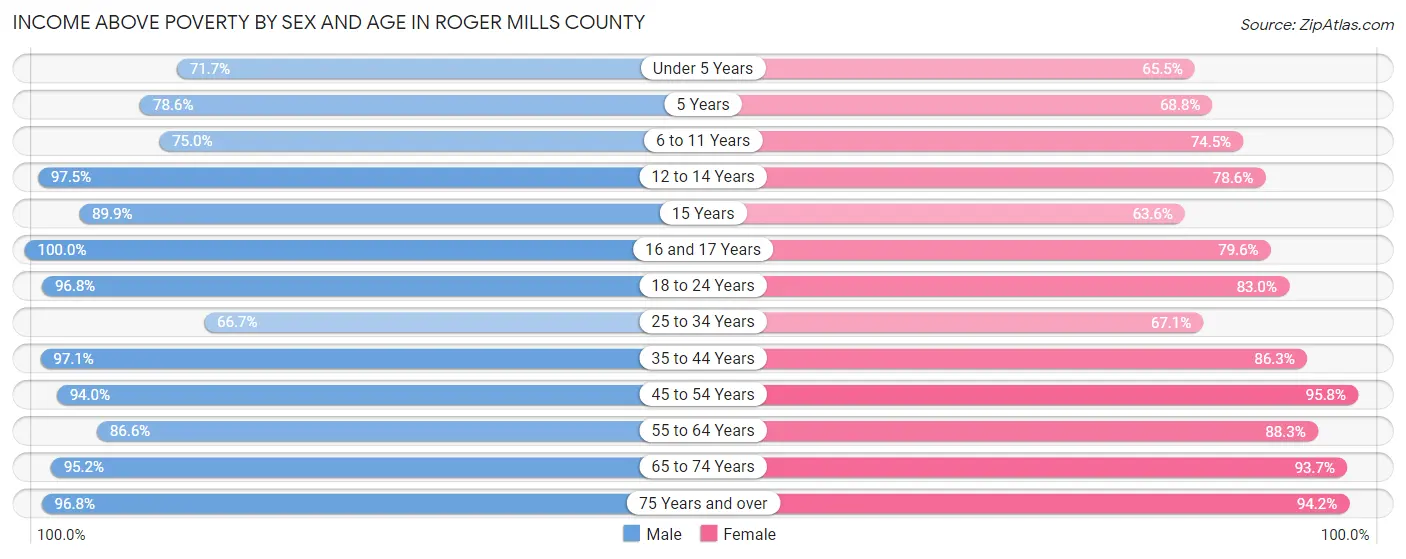
| Age Bracket | Male | Female |
| Under 5 Years | 66 (71.7%) | 55 (65.5%) |
| 5 Years | 11 (78.6%) | 11 (68.8%) |
| 6 to 11 Years | 129 (75.0%) | 102 (74.5%) |
| 12 to 14 Years | 79 (97.5%) | 66 (78.6%) |
| 15 Years | 71 (89.9%) | 7 (63.6%) |
| 16 and 17 Years | 23 (100.0%) | 35 (79.5%) |
| 18 to 24 Years | 120 (96.8%) | 73 (83.0%) |
| 25 to 34 Years | 96 (66.7%) | 116 (67.0%) |
| 35 to 44 Years | 231 (97.1%) | 182 (86.3%) |
| 45 to 54 Years | 189 (94.0%) | 159 (95.8%) |
| 55 to 64 Years | 232 (86.6%) | 196 (88.3%) |
| 65 to 74 Years | 196 (95.2%) | 194 (93.7%) |
| 75 Years and over | 122 (96.8%) | 177 (94.2%) |
| Total | 1,565 (88.5%) | 1,373 (84.2%) |
Income Below Poverty Among Married-Couple Families in Roger Mills County
The poverty statistics for married-couple families in Roger Mills County show that 7.5% or 62 of the total 827 families live below the poverty line. Families with 3 or 4 children have the highest poverty rate of 37.3%, comprising of 25 families. On the other hand, families with no children have the lowest poverty rate of 4.1%, which includes 22 families.
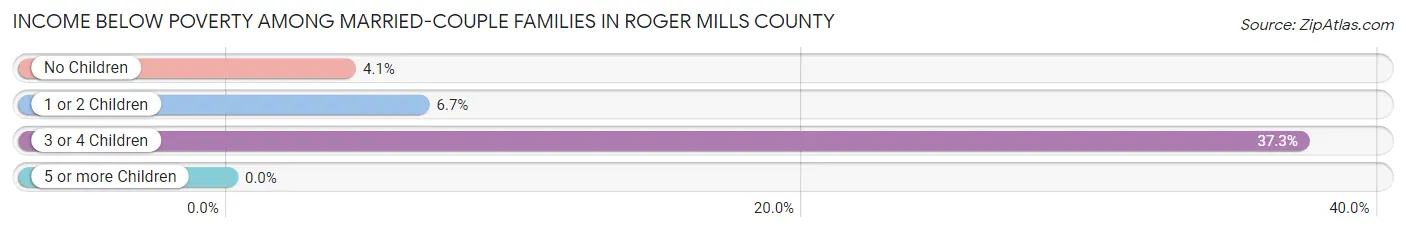
| Children | Above Poverty | Below Poverty |
| No Children | 513 (95.9%) | 22 (4.1%) |
| 1 or 2 Children | 210 (93.3%) | 15 (6.7%) |
| 3 or 4 Children | 42 (62.7%) | 25 (37.3%) |
| 5 or more Children | 0 (0.0%) | 0 (0.0%) |
| Total | 765 (92.5%) | 62 (7.5%) |
Income Below Poverty Among Single-Parent Households in Roger Mills County
According to the poverty data in Roger Mills County, 10.0% or 6 single-father households and 26.5% or 39 single-mother households are living below the poverty line. Among single-father households, those with no children have the highest poverty rate, with 4 households (23.5%) experiencing poverty. Likewise, among single-mother households, those with 5 or more children have the highest poverty rate, with 3 households (100.0%) falling below the poverty line.
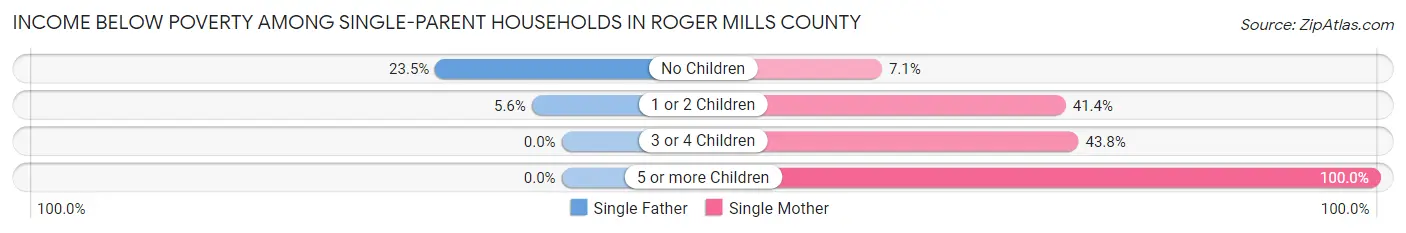
| Children | Single Father | Single Mother |
| No Children | 4 (23.5%) | 5 (7.1%) |
| 1 or 2 Children | 2 (5.6%) | 24 (41.4%) |
| 3 or 4 Children | 0 (0.0%) | 7 (43.8%) |
| 5 or more Children | 0 (0.0%) | 3 (100.0%) |
| Total | 6 (10.0%) | 39 (26.5%) |
Income Below Poverty Among Married-Couple vs Single-Parent Households in Roger Mills County
The poverty data for Roger Mills County shows that 62 of the married-couple family households (7.5%) and 45 of the single-parent households (21.7%) are living below the poverty level. Within the married-couple family households, those with 3 or 4 children have the highest poverty rate, with 25 households (37.3%) falling below the poverty line. Among the single-parent households, those with 5 or more children have the highest poverty rate, with 3 household (100.0%) living below poverty.
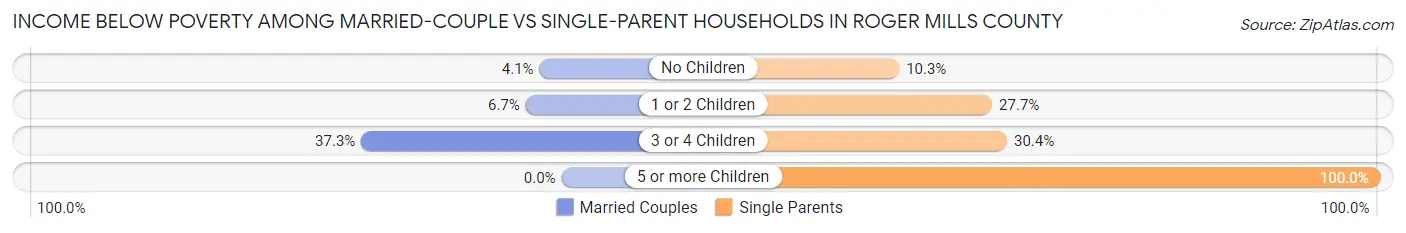
| Children | Married-Couple Families | Single-Parent Households |
| No Children | 22 (4.1%) | 9 (10.3%) |
| 1 or 2 Children | 15 (6.7%) | 26 (27.7%) |
| 3 or 4 Children | 25 (37.3%) | 7 (30.4%) |
| 5 or more Children | 0 (0.0%) | 3 (100.0%) |
| Total | 62 (7.5%) | 45 (21.7%) |
Race in Roger Mills County
The most populous races in Roger Mills County are White / Caucasian (2,899 | 84.7%), Hispanic or Latino (275 | 8.0%), and Native / Alaskan (195 | 5.7%).
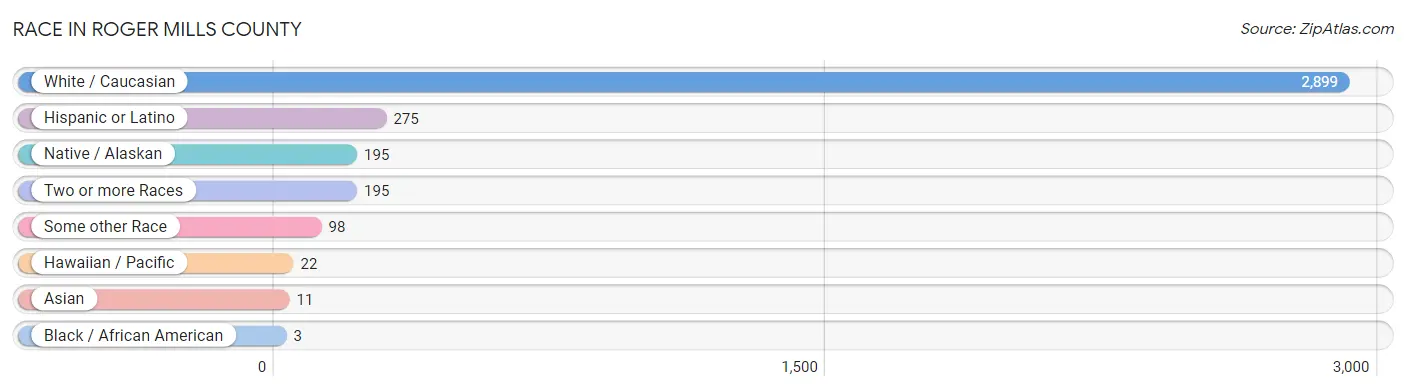
| Race | # Population | % Population |
| Asian | 11 | 0.3% |
| Black / African American | 3 | 0.1% |
| Hawaiian / Pacific | 22 | 0.6% |
| Hispanic or Latino | 275 | 8.0% |
| Native / Alaskan | 195 | 5.7% |
| White / Caucasian | 2,899 | 84.7% |
| Two or more Races | 195 | 5.7% |
| Some other Race | 98 | 2.9% |
| Total | 3,423 | 100.0% |
Ancestry in Roger Mills County
The most populous ancestries reported in Roger Mills County are Irish (490 | 14.3%), German (449 | 13.1%), English (373 | 10.9%), Mexican (193 | 5.6%), and American (157 | 4.6%), together accounting for 48.6% of all Roger Mills County residents.
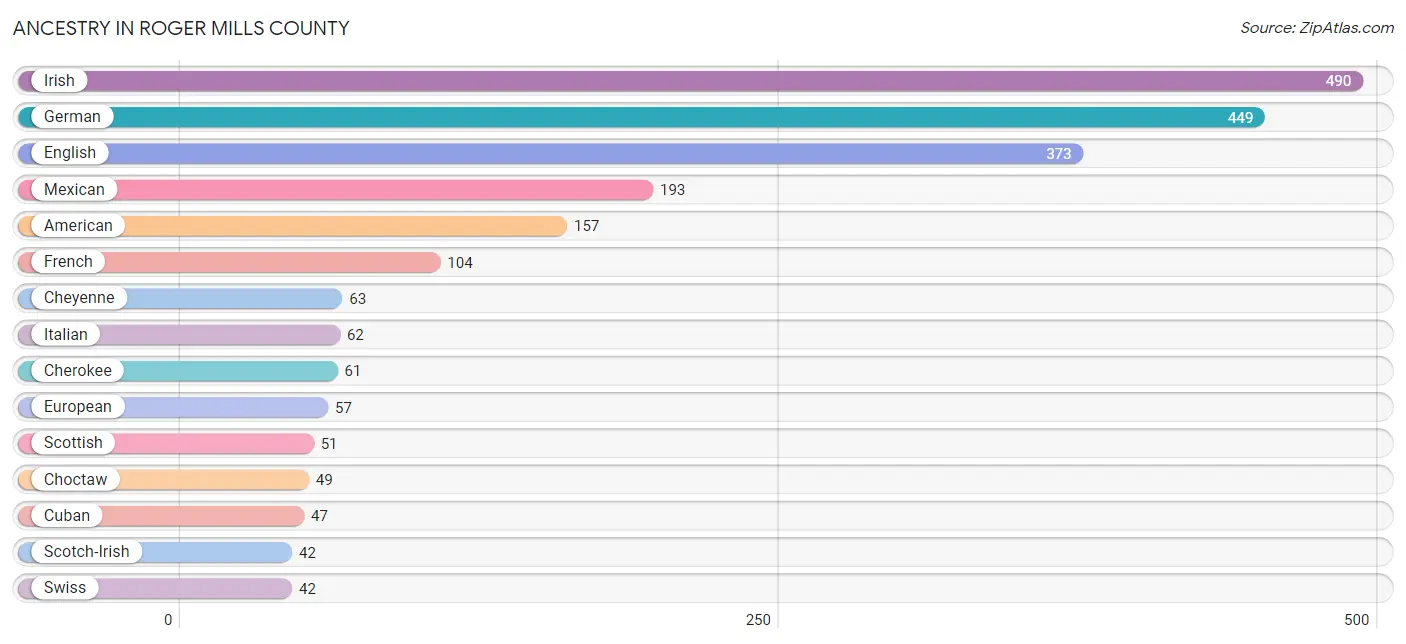
| Ancestry | # Population | % Population |
| American | 157 | 4.6% |
| Arab | 6 | 0.2% |
| Austrian | 5 | 0.2% |
| Blackfeet | 4 | 0.1% |
| Central American | 24 | 0.7% |
| Cherokee | 61 | 1.8% |
| Cheyenne | 63 | 1.8% |
| Chickasaw | 9 | 0.3% |
| Chippewa | 6 | 0.2% |
| Choctaw | 49 | 1.4% |
| Comanche | 4 | 0.1% |
| Creek | 2 | 0.1% |
| Cuban | 47 | 1.4% |
| Czech | 8 | 0.2% |
| Czechoslovakian | 6 | 0.2% |
| Danish | 22 | 0.6% |
| Dutch | 5 | 0.2% |
| Dutch West Indian | 8 | 0.2% |
| Eastern European | 4 | 0.1% |
| English | 373 | 10.9% |
| European | 57 | 1.7% |
| Fijian | 22 | 0.6% |
| French | 104 | 3.0% |
| French Canadian | 5 | 0.2% |
| German | 449 | 13.1% |
| German Russian | 1 | 0.0% |
| Indian (Asian) | 5 | 0.2% |
| Irish | 490 | 14.3% |
| Italian | 62 | 1.8% |
| Korean | 1 | 0.0% |
| Mexican | 193 | 5.6% |
| Native Hawaiian | 2 | 0.1% |
| Navajo | 14 | 0.4% |
| Norwegian | 23 | 0.7% |
| Pakistani | 6 | 0.2% |
| Polish | 37 | 1.1% |
| Potawatomi | 3 | 0.1% |
| Salvadoran | 24 | 0.7% |
| Scandinavian | 13 | 0.4% |
| Scotch-Irish | 42 | 1.2% |
| Scottish | 51 | 1.5% |
| Spaniard | 3 | 0.1% |
| Swedish | 23 | 0.7% |
| Swiss | 42 | 1.2% |
| Syrian | 6 | 0.2% |
| Welsh | 2 | 0.1% | View All 46 Rows |
Immigrants in Roger Mills County
The most numerous immigrant groups reported in Roger Mills County came from Latin America (83 | 2.4%), Central America (61 | 1.8%), Mexico (61 | 1.8%), Caribbean (22 | 0.6%), and Cuba (22 | 0.6%), together accounting for 7.3% of all Roger Mills County residents.
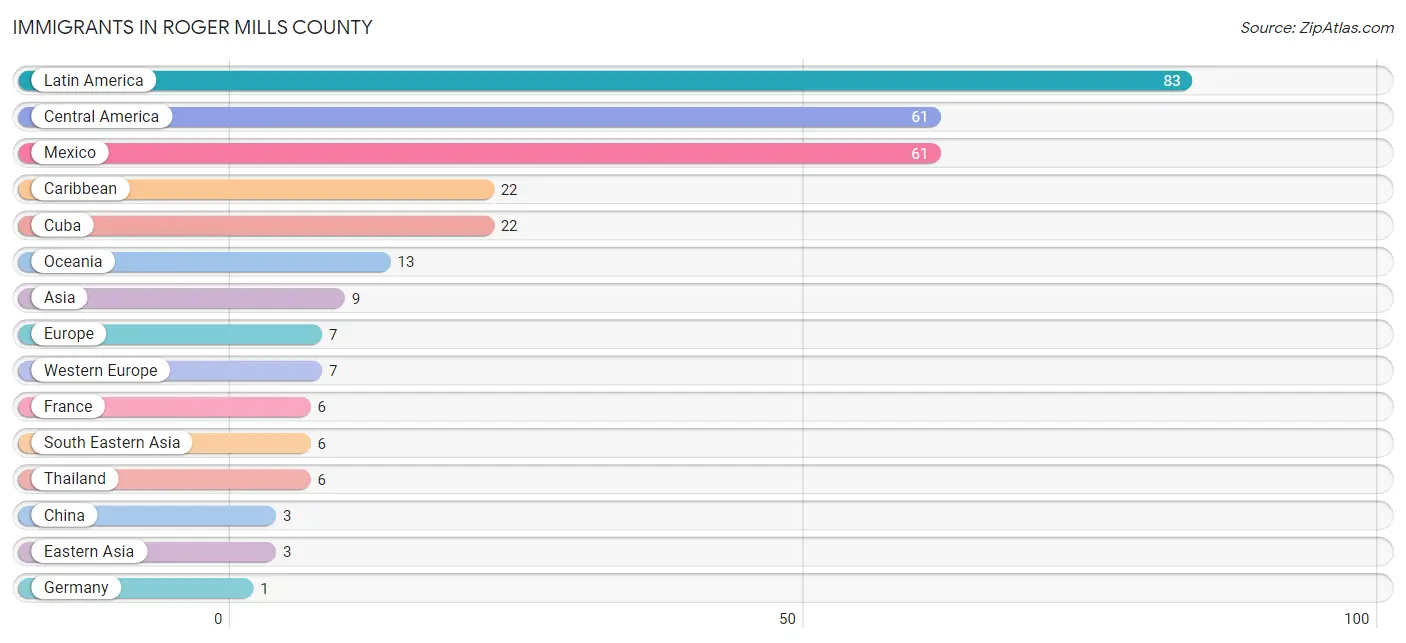
| Immigration Origin | # Population | % Population |
| Asia | 9 | 0.3% |
| Caribbean | 22 | 0.6% |
| Central America | 61 | 1.8% |
| China | 3 | 0.1% |
| Cuba | 22 | 0.6% |
| Eastern Asia | 3 | 0.1% |
| Europe | 7 | 0.2% |
| France | 6 | 0.2% |
| Germany | 1 | 0.0% |
| Latin America | 83 | 2.4% |
| Mexico | 61 | 1.8% |
| Oceania | 13 | 0.4% |
| South Eastern Asia | 6 | 0.2% |
| Thailand | 6 | 0.2% |
| Western Europe | 7 | 0.2% | View All 15 Rows |
Sex and Age in Roger Mills County
Sex and Age in Roger Mills County
The most populous age groups in Roger Mills County are 5 to 9 Years (160 | 9.0%) for men and 60 to 64 Years (153 | 9.3%) for women.
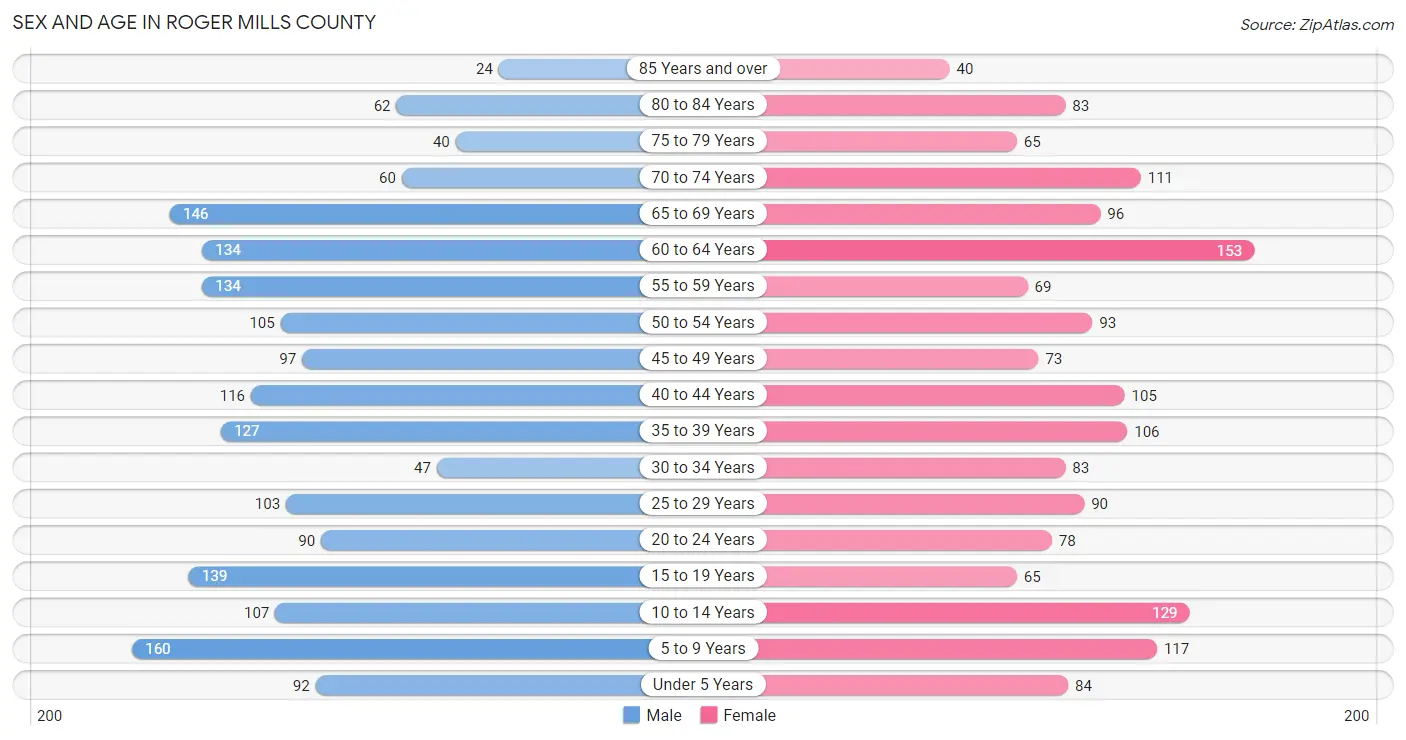
| Age Bracket | Male | Female |
| Under 5 Years | 92 (5.2%) | 84 (5.1%) |
| 5 to 9 Years | 160 (9.0%) | 117 (7.1%) |
| 10 to 14 Years | 107 (6.0%) | 129 (7.9%) |
| 15 to 19 Years | 139 (7.8%) | 65 (4.0%) |
| 20 to 24 Years | 90 (5.1%) | 78 (4.8%) |
| 25 to 29 Years | 103 (5.8%) | 90 (5.5%) |
| 30 to 34 Years | 47 (2.6%) | 83 (5.1%) |
| 35 to 39 Years | 127 (7.1%) | 106 (6.5%) |
| 40 to 44 Years | 116 (6.5%) | 105 (6.4%) |
| 45 to 49 Years | 97 (5.4%) | 73 (4.4%) |
| 50 to 54 Years | 105 (5.9%) | 93 (5.7%) |
| 55 to 59 Years | 134 (7.5%) | 69 (4.2%) |
| 60 to 64 Years | 134 (7.5%) | 153 (9.3%) |
| 65 to 69 Years | 146 (8.2%) | 96 (5.9%) |
| 70 to 74 Years | 60 (3.4%) | 111 (6.8%) |
| 75 to 79 Years | 40 (2.2%) | 65 (4.0%) |
| 80 to 84 Years | 62 (3.5%) | 83 (5.1%) |
| 85 Years and over | 24 (1.3%) | 40 (2.4%) |
| Total | 1,783 (100.0%) | 1,640 (100.0%) |
Families and Households in Roger Mills County
Median Family Size in Roger Mills County
The median family size in Roger Mills County is 2.80 persons per family, with married-couple families (827 | 80.0%) accounting for the largest median family size of 2.86 persons per family. On the other hand, single male/father families (60 | 5.8%) represent the smallest median family size with 2.28 persons per family.
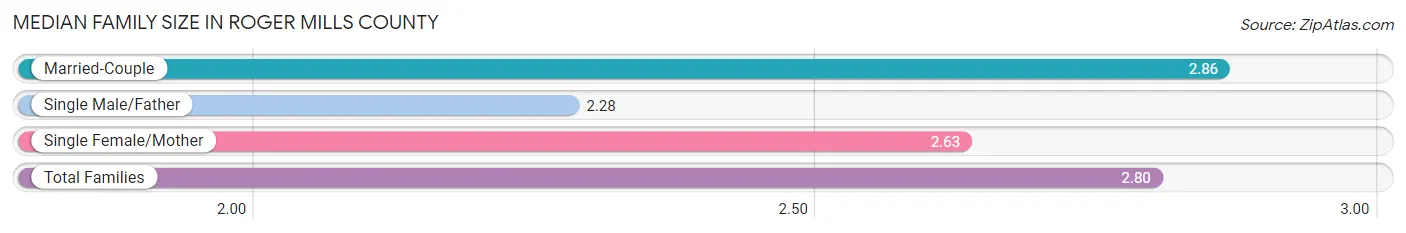
| Family Type | # Families | Family Size |
| Married-Couple | 827 (80.0%) | 2.86 |
| Single Male/Father | 60 (5.8%) | 2.28 |
| Single Female/Mother | 147 (14.2%) | 2.63 |
| Total Families | 1,034 (100.0%) | 2.80 |
Median Household Size in Roger Mills County
The median household size in Roger Mills County is 2.34 persons per household, with married-couple households (827 | 56.7%) accounting for the largest median household size of 2.88 persons per household. non-family households (424 | 29.1%) represent the smallest median household size with 1.07 persons per household.
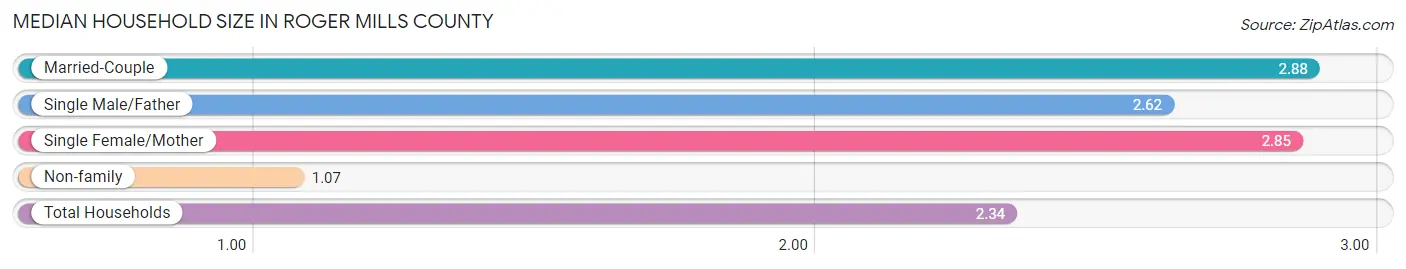
| Household Type | # Households | Household Size |
| Married-Couple | 827 (56.7%) | 2.88 |
| Single Male/Father | 60 (4.1%) | 2.62 |
| Single Female/Mother | 147 (10.1%) | 2.85 |
| Non-family | 424 (29.1%) | 1.07 |
| Total Households | 1,458 (100.0%) | 2.34 |
Household Size by Marriage Status in Roger Mills County
Out of a total of 1,458 households in Roger Mills County, 1,034 (70.9%) are family households, while 424 (29.1%) are nonfamily households. The most numerous type of family households are 2-person households, comprising 594, and the most common type of nonfamily households are 1-person households, comprising 395.
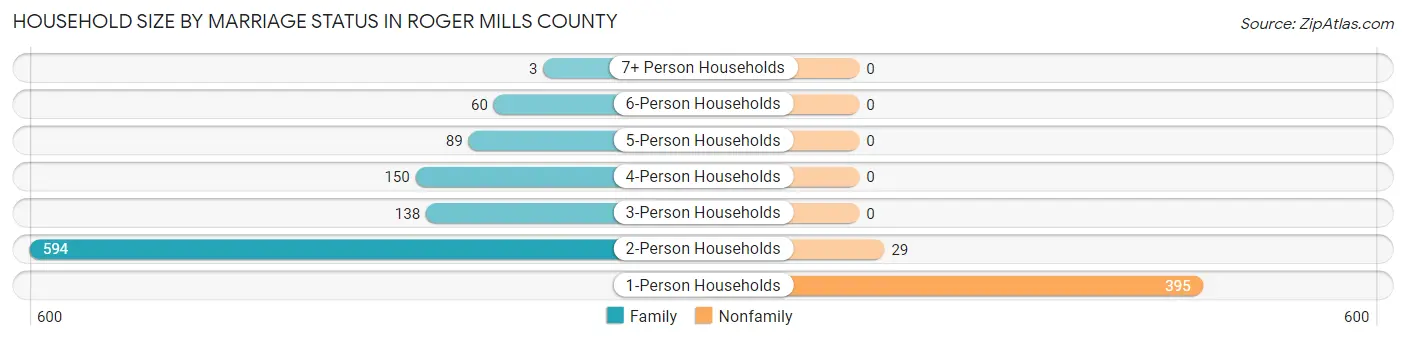
| Household Size | Family Households | Nonfamily Households |
| 1-Person Households | - | 395 (27.1%) |
| 2-Person Households | 594 (40.7%) | 29 (2.0%) |
| 3-Person Households | 138 (9.5%) | 0 (0.0%) |
| 4-Person Households | 150 (10.3%) | 0 (0.0%) |
| 5-Person Households | 89 (6.1%) | 0 (0.0%) |
| 6-Person Households | 60 (4.1%) | 0 (0.0%) |
| 7+ Person Households | 3 (0.2%) | 0 (0.0%) |
| Total | 1,034 (70.9%) | 424 (29.1%) |
Female Fertility in Roger Mills County
Fertility by Age in Roger Mills County
Average fertility rate in Roger Mills County is 59.0 births per 1,000 women. Women in the age bracket of 20 to 34 years have the highest fertility rate with 120.0 births per 1,000 women. Women in the age bracket of 20 to 34 years acount for 81.1% of all women with births.
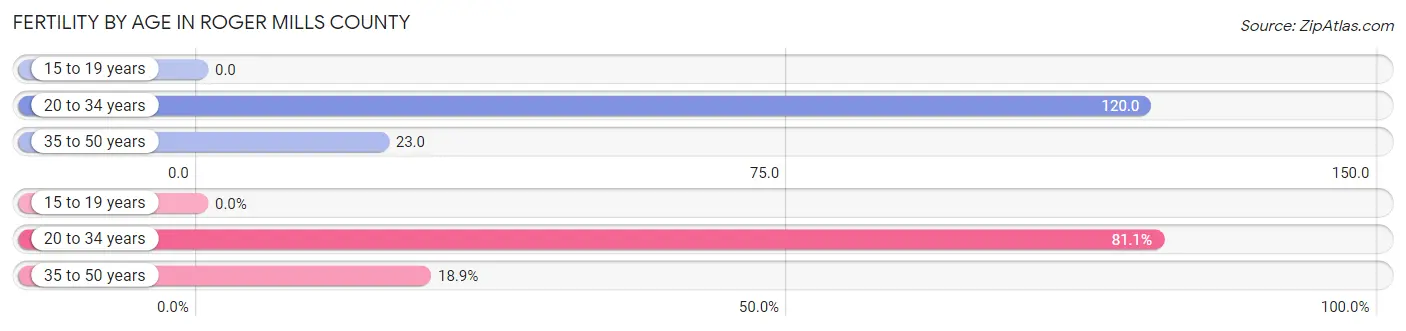
| Age Bracket | Women with Births | Births / 1,000 Women |
| 15 to 19 years | 0 (0.0%) | 0.0 |
| 20 to 34 years | 30 (81.1%) | 120.0 |
| 35 to 50 years | 7 (18.9%) | 23.0 |
| Total | 37 (100.0%) | 59.0 |
Fertility by Age by Marriage Status in Roger Mills County
78.4% of women with births (37) in Roger Mills County are married. The highest percentage of unmarried women with births falls into 20 to 34 years age bracket with 26.7% of them unmarried at the time of birth, while the lowest percentage of unmarried women with births belong to 35 to 50 years age bracket with 0.0% of them unmarried.
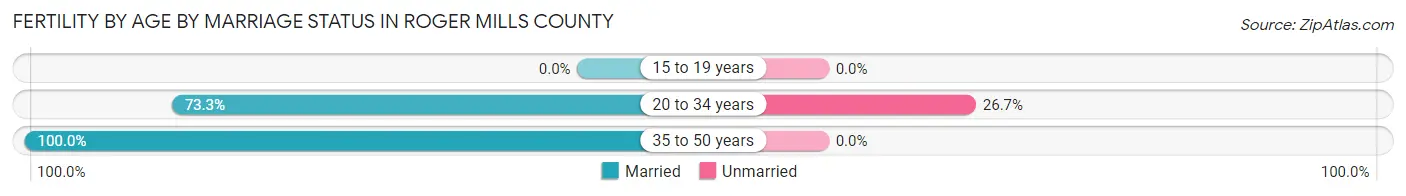
| Age Bracket | Married | Unmarried |
| 15 to 19 years | 0 (0.0%) | 0 (0.0%) |
| 20 to 34 years | 22 (73.3%) | 8 (26.7%) |
| 35 to 50 years | 7 (100.0%) | 0 (0.0%) |
| Total | 29 (78.4%) | 8 (21.6%) |
Fertility by Education in Roger Mills County
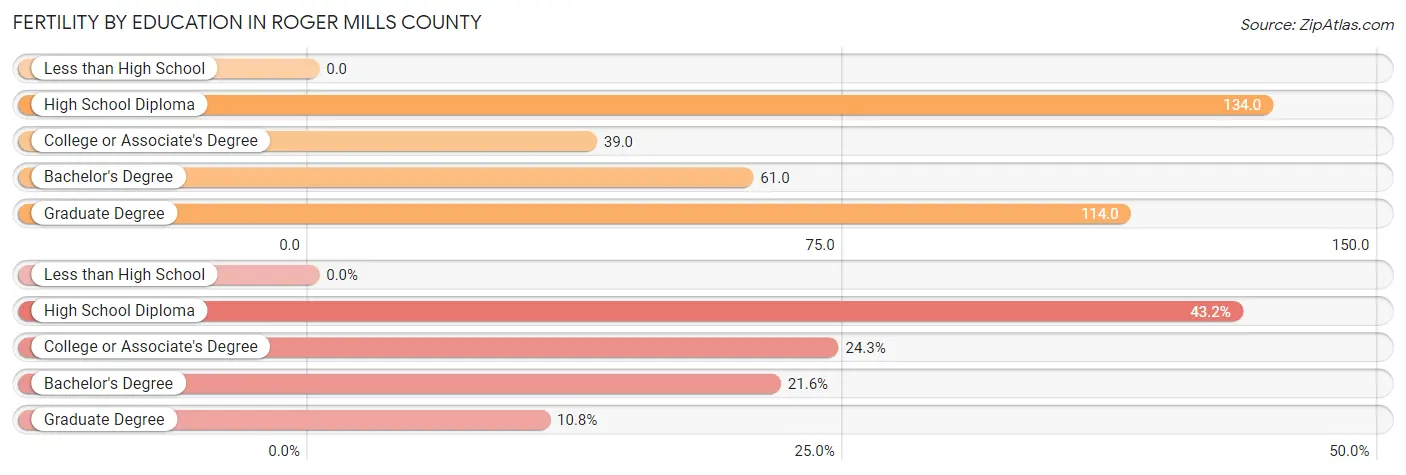
| Educational Attainment | Women with Births | Births / 1,000 Women |
| Less than High School | 0 (0.0%) | 0.0 |
| High School Diploma | 16 (43.2%) | 134.0 |
| College or Associate's Degree | 9 (24.3%) | 39.0 |
| Bachelor's Degree | 8 (21.6%) | 61.0 |
| Graduate Degree | 4 (10.8%) | 114.0 |
| Total | 37 (100.0%) | 59.0 |
Fertility by Education by Marriage Status in Roger Mills County
21.6% of women with births in Roger Mills County are unmarried. Women with the educational attainment of high school diploma are most likely to be married with 100.0% of them married at childbirth, while women with the educational attainment of college or associate's degree are least likely to be married with 66.7% of them unmarried at childbirth.
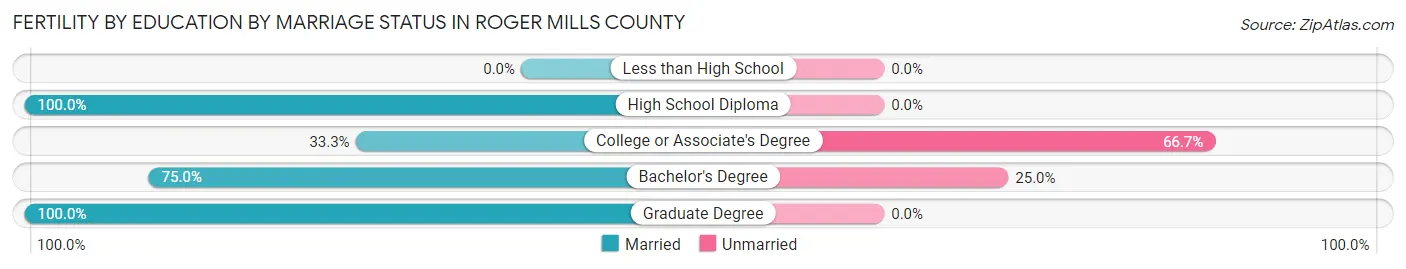
| Educational Attainment | Married | Unmarried |
| Less than High School | 0 (0.0%) | 0 (0.0%) |
| High School Diploma | 16 (100.0%) | 0 (0.0%) |
| College or Associate's Degree | 3 (33.3%) | 6 (66.7%) |
| Bachelor's Degree | 6 (75.0%) | 2 (25.0%) |
| Graduate Degree | 4 (100.0%) | 0 (0.0%) |
| Total | 29 (78.4%) | 8 (21.6%) |
Employment Characteristics in Roger Mills County
Employment by Class of Employer in Roger Mills County
Among the 1,469 employed individuals in Roger Mills County, private company employees (609 | 41.5%), self-employed (not incorporated) (293 | 20.0%), and local government employees (218 | 14.8%) make up the most common classes of employment.
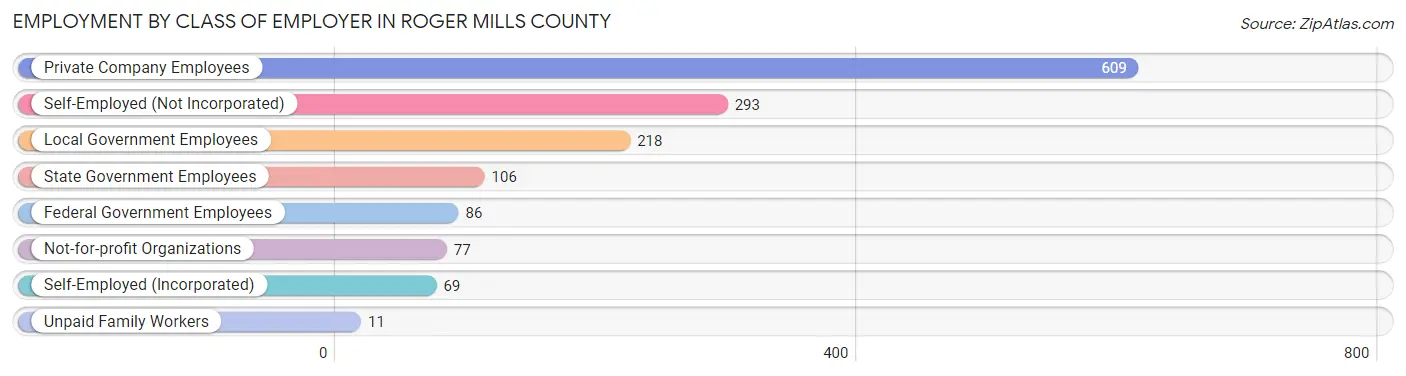
| Employer Class | # Employees | % Employees |
| Private Company Employees | 609 | 41.5% |
| Self-Employed (Incorporated) | 69 | 4.7% |
| Self-Employed (Not Incorporated) | 293 | 20.0% |
| Not-for-profit Organizations | 77 | 5.2% |
| Local Government Employees | 218 | 14.8% |
| State Government Employees | 106 | 7.2% |
| Federal Government Employees | 86 | 5.9% |
| Unpaid Family Workers | 11 | 0.7% |
| Total | 1,469 | 100.0% |
Employment Status by Age in Roger Mills County
According to the labor force statistics for Roger Mills County, out of the total population over 16 years of age (2,644), 58.7% or 1,552 individuals are in the labor force, with 4.7% or 73 of them unemployed. The age group with the highest labor force participation rate is 20 to 24 years, with 81.5% or 137 individuals in the labor force. Within the labor force, the 25 to 29 years age range has the highest percentage of unemployed individuals, with 15.5% or 20 of them being unemployed.
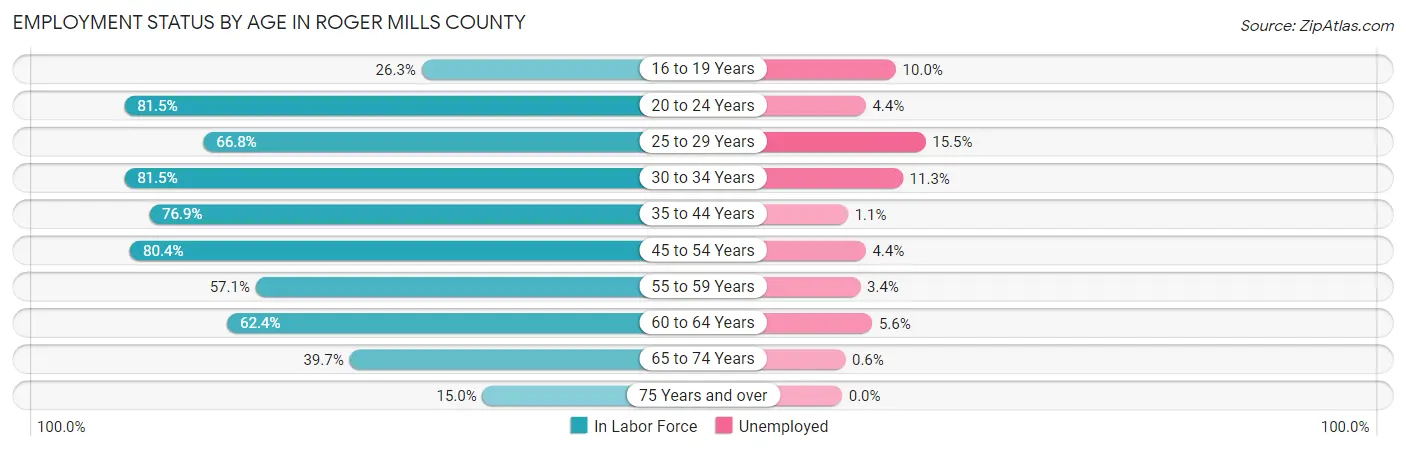
| Age Bracket | In Labor Force | Unemployed |
| 16 to 19 Years | 30 (26.3%) | 3 (10.0%) |
| 20 to 24 Years | 137 (81.5%) | 6 (4.4%) |
| 25 to 29 Years | 129 (66.8%) | 20 (15.5%) |
| 30 to 34 Years | 106 (81.5%) | 12 (11.3%) |
| 35 to 44 Years | 349 (76.9%) | 4 (1.1%) |
| 45 to 54 Years | 296 (80.4%) | 13 (4.4%) |
| 55 to 59 Years | 116 (57.1%) | 4 (3.4%) |
| 60 to 64 Years | 179 (62.4%) | 10 (5.6%) |
| 65 to 74 Years | 164 (39.7%) | 1 (0.6%) |
| 75 Years and over | 47 (15.0%) | 0 (0.0%) |
| Total | 1,552 (58.7%) | 73 (4.7%) |
Employment Status by Educational Attainment in Roger Mills County
According to labor force statistics for Roger Mills County, 71.9% of individuals (1,176) out of the total population between 25 and 64 years of age (1,635) are in the labor force, with 5.4% or 64 of them being unemployed. The group with the highest labor force participation rate are those with the educational attainment of bachelor's degree or higher, with 78.4% or 261 individuals in the labor force. Within the labor force, individuals with less than high school education have the highest percentage of unemployment, with 38.1% or 24 of them being unemployed.
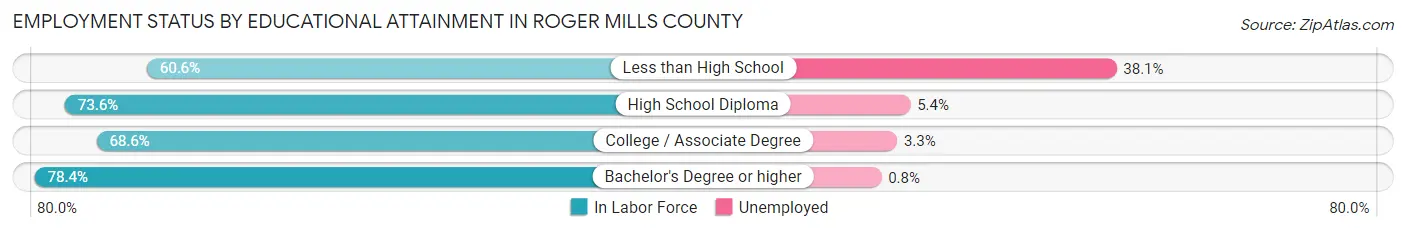
| Educational Attainment | In Labor Force | Unemployed |
| Less than High School | 63 (60.6%) | 40 (38.1%) |
| High School Diploma | 429 (73.6%) | 31 (5.4%) |
| College / Associate Degree | 422 (68.6%) | 20 (3.3%) |
| Bachelor's Degree or higher | 261 (78.4%) | 3 (0.8%) |
| Total | 1,176 (71.9%) | 88 (5.4%) |
Employment Occupations by Sex in Roger Mills County
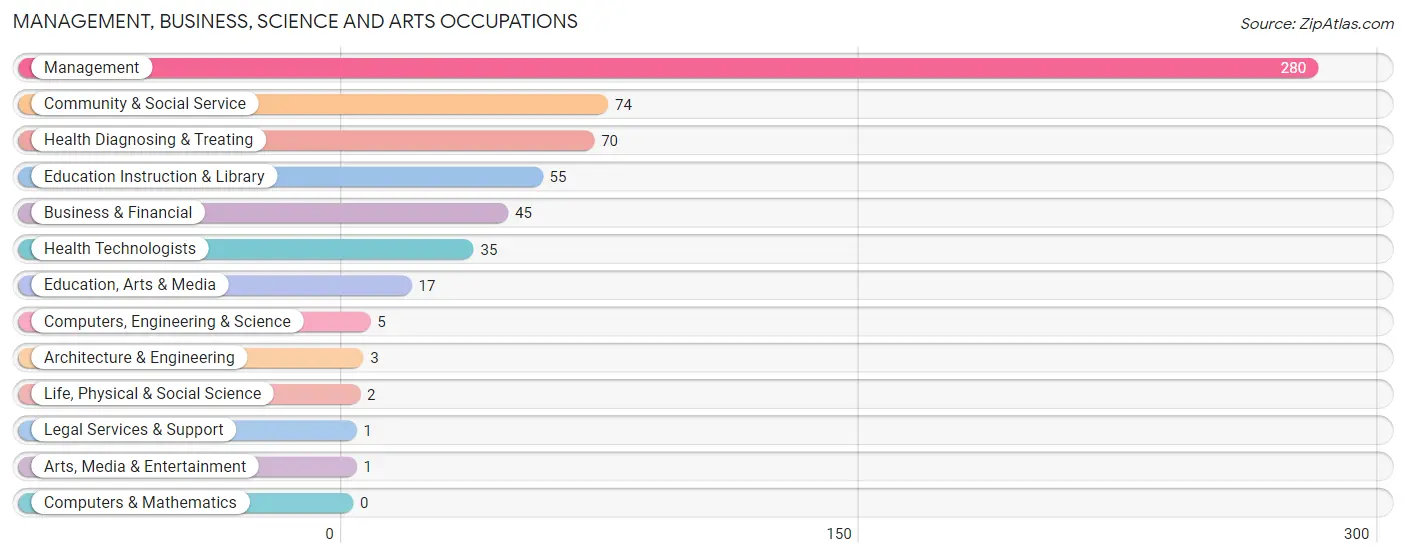
Management, Business, Science and Arts Occupations
The most common Management, Business, Science and Arts occupations in Roger Mills County are Management (280 | 18.9%), Community & Social Service (74 | 5.0%), Health Diagnosing & Treating (70 | 4.7%), Education Instruction & Library (55 | 3.7%), and Business & Financial (45 | 3.0%).
Management, Business, Science and Arts Occupations by Sex
Within the Management, Business, Science and Arts occupations in Roger Mills County, the most male-oriented occupations are Computers, Engineering & Science (100.0%), Architecture & Engineering (100.0%), and Life, Physical & Social Science (100.0%), while the most female-oriented occupations are Legal Services & Support (100.0%), Arts, Media & Entertainment (100.0%), and Health Technologists (100.0%).
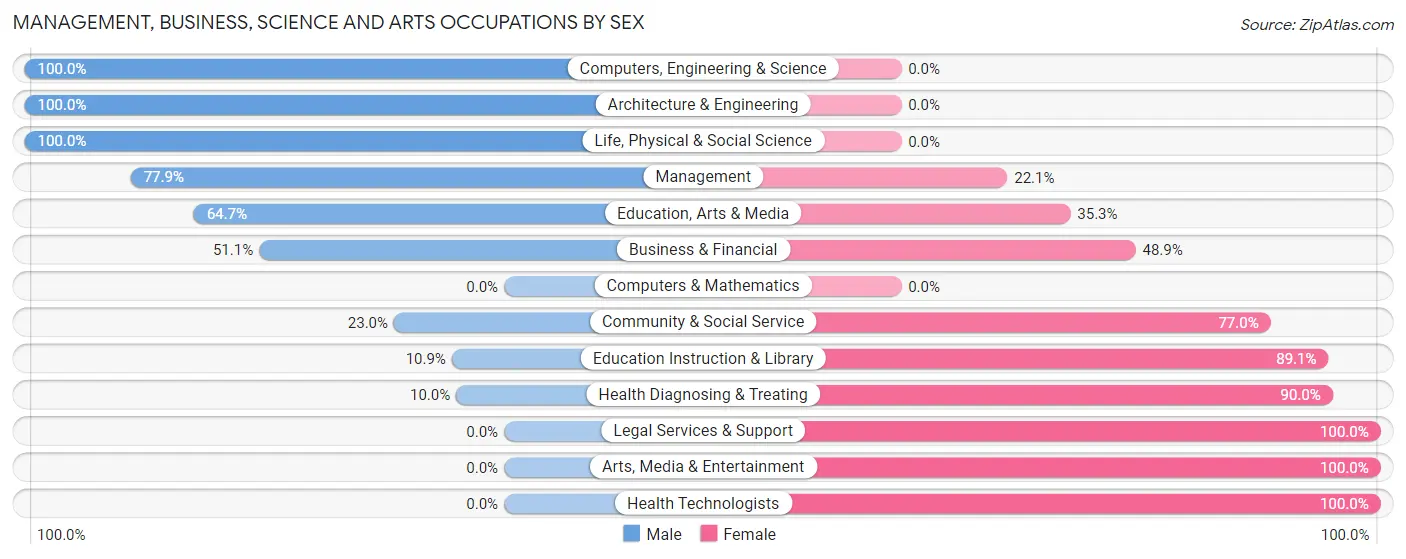
| Occupation | Male | Female |
| Management | 218 (77.9%) | 62 (22.1%) |
| Business & Financial | 23 (51.1%) | 22 (48.9%) |
| Computers, Engineering & Science | 5 (100.0%) | 0 (0.0%) |
| Computers & Mathematics | 0 (0.0%) | 0 (0.0%) |
| Architecture & Engineering | 3 (100.0%) | 0 (0.0%) |
| Life, Physical & Social Science | 2 (100.0%) | 0 (0.0%) |
| Community & Social Service | 17 (23.0%) | 57 (77.0%) |
| Education, Arts & Media | 11 (64.7%) | 6 (35.3%) |
| Legal Services & Support | 0 (0.0%) | 1 (100.0%) |
| Education Instruction & Library | 6 (10.9%) | 49 (89.1%) |
| Arts, Media & Entertainment | 0 (0.0%) | 1 (100.0%) |
| Health Diagnosing & Treating | 7 (10.0%) | 63 (90.0%) |
| Health Technologists | 0 (0.0%) | 35 (100.0%) |
| Total (Category) | 270 (57.0%) | 204 (43.0%) |
| Total (Overall) | 867 (58.6%) | 613 (41.4%) |
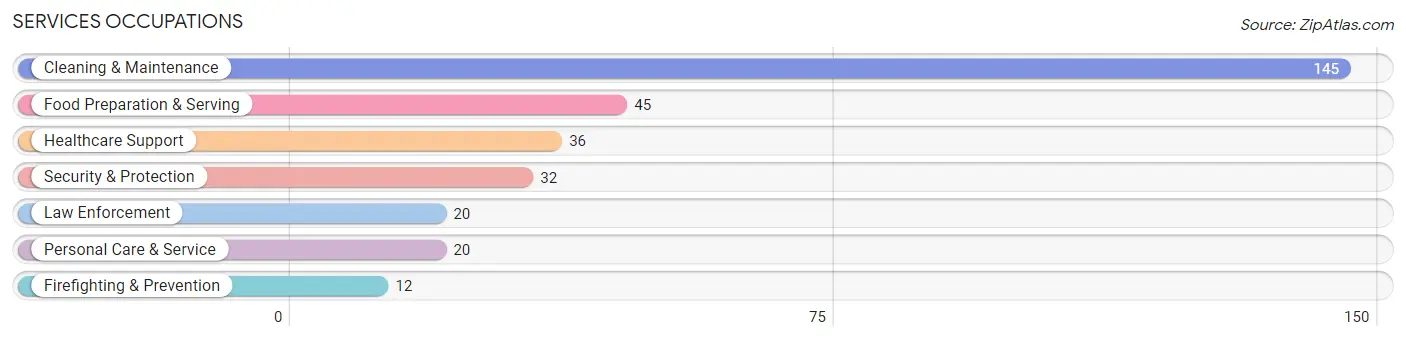
Services Occupations
The most common Services occupations in Roger Mills County are Cleaning & Maintenance (145 | 9.8%), Food Preparation & Serving (45 | 3.0%), Healthcare Support (36 | 2.4%), Security & Protection (32 | 2.2%), and Law Enforcement (20 | 1.3%).
Services Occupations by Sex
Within the Services occupations in Roger Mills County, the most male-oriented occupations are Law Enforcement (100.0%), Security & Protection (90.6%), and Firefighting & Prevention (75.0%), while the most female-oriented occupations are Healthcare Support (100.0%), Personal Care & Service (100.0%), and Food Preparation & Serving (95.6%).
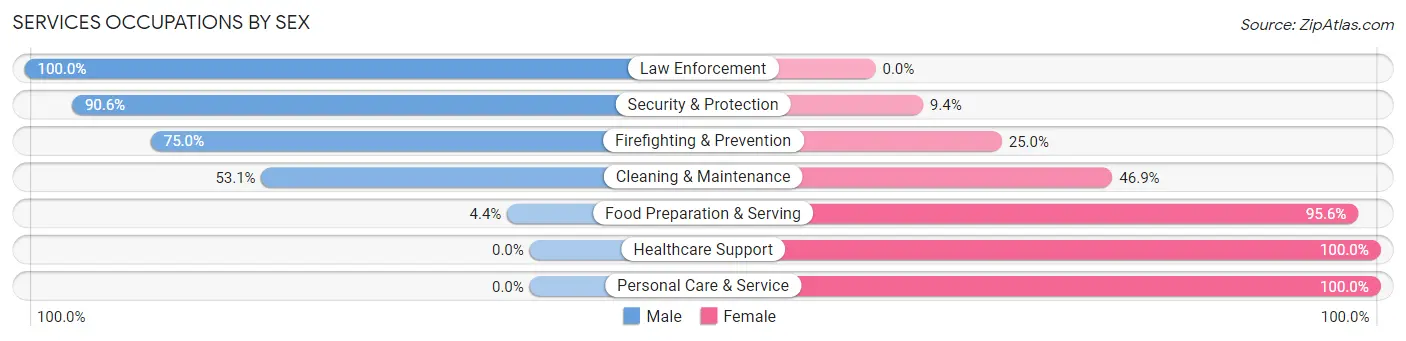
| Occupation | Male | Female |
| Healthcare Support | 0 (0.0%) | 36 (100.0%) |
| Security & Protection | 29 (90.6%) | 3 (9.4%) |
| Firefighting & Prevention | 9 (75.0%) | 3 (25.0%) |
| Law Enforcement | 20 (100.0%) | 0 (0.0%) |
| Food Preparation & Serving | 2 (4.4%) | 43 (95.6%) |
| Cleaning & Maintenance | 77 (53.1%) | 68 (46.9%) |
| Personal Care & Service | 0 (0.0%) | 20 (100.0%) |
| Total (Category) | 108 (38.9%) | 170 (61.2%) |
| Total (Overall) | 867 (58.6%) | 613 (41.4%) |
Sales and Office Occupations
The most common Sales and Office occupations in Roger Mills County are Office & Administration (148 | 10.0%), and Sales & Related (89 | 6.0%).
Sales and Office Occupations by Sex
| Occupation | Male | Female |
| Sales & Related | 23 (25.8%) | 66 (74.2%) |
| Office & Administration | 12 (8.1%) | 136 (91.9%) |
| Total (Category) | 35 (14.8%) | 202 (85.2%) |
| Total (Overall) | 867 (58.6%) | 613 (41.4%) |
Natural Resources, Construction and Maintenance Occupations
The most common Natural Resources, Construction and Maintenance occupations in Roger Mills County are Construction & Extraction (107 | 7.2%), Installation, Maintenance & Repair (75 | 5.1%), and Farming, Fishing & Forestry (55 | 3.7%).
Natural Resources, Construction and Maintenance Occupations by Sex
| Occupation | Male | Female |
| Farming, Fishing & Forestry | 52 (94.6%) | 3 (5.4%) |
| Construction & Extraction | 101 (94.4%) | 6 (5.6%) |
| Installation, Maintenance & Repair | 75 (100.0%) | 0 (0.0%) |
| Total (Category) | 228 (96.2%) | 9 (3.8%) |
| Total (Overall) | 867 (58.6%) | 613 (41.4%) |
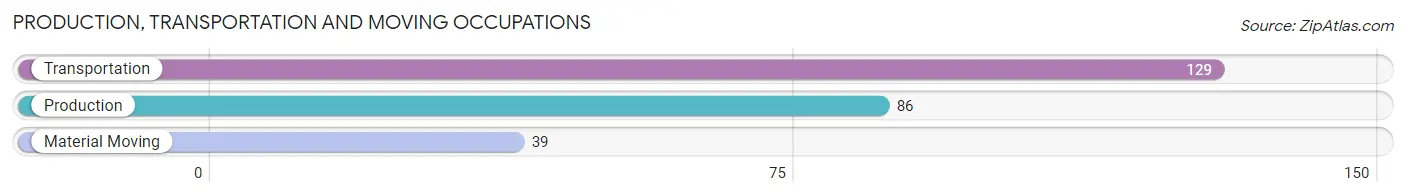
Production, Transportation and Moving Occupations
The most common Production, Transportation and Moving occupations in Roger Mills County are Transportation (129 | 8.7%), Production (86 | 5.8%), and Material Moving (39 | 2.6%).
Production, Transportation and Moving Occupations by Sex
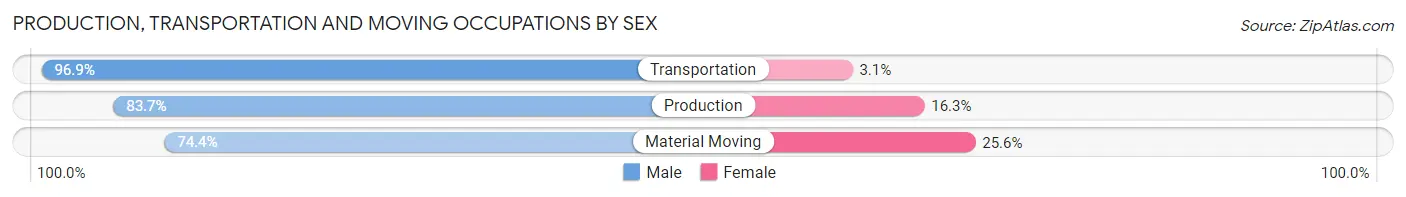
| Occupation | Male | Female |
| Production | 72 (83.7%) | 14 (16.3%) |
| Transportation | 125 (96.9%) | 4 (3.1%) |
| Material Moving | 29 (74.4%) | 10 (25.6%) |
| Total (Category) | 226 (89.0%) | 28 (11.0%) |
| Total (Overall) | 867 (58.6%) | 613 (41.4%) |
Employment Industries by Sex in Roger Mills County
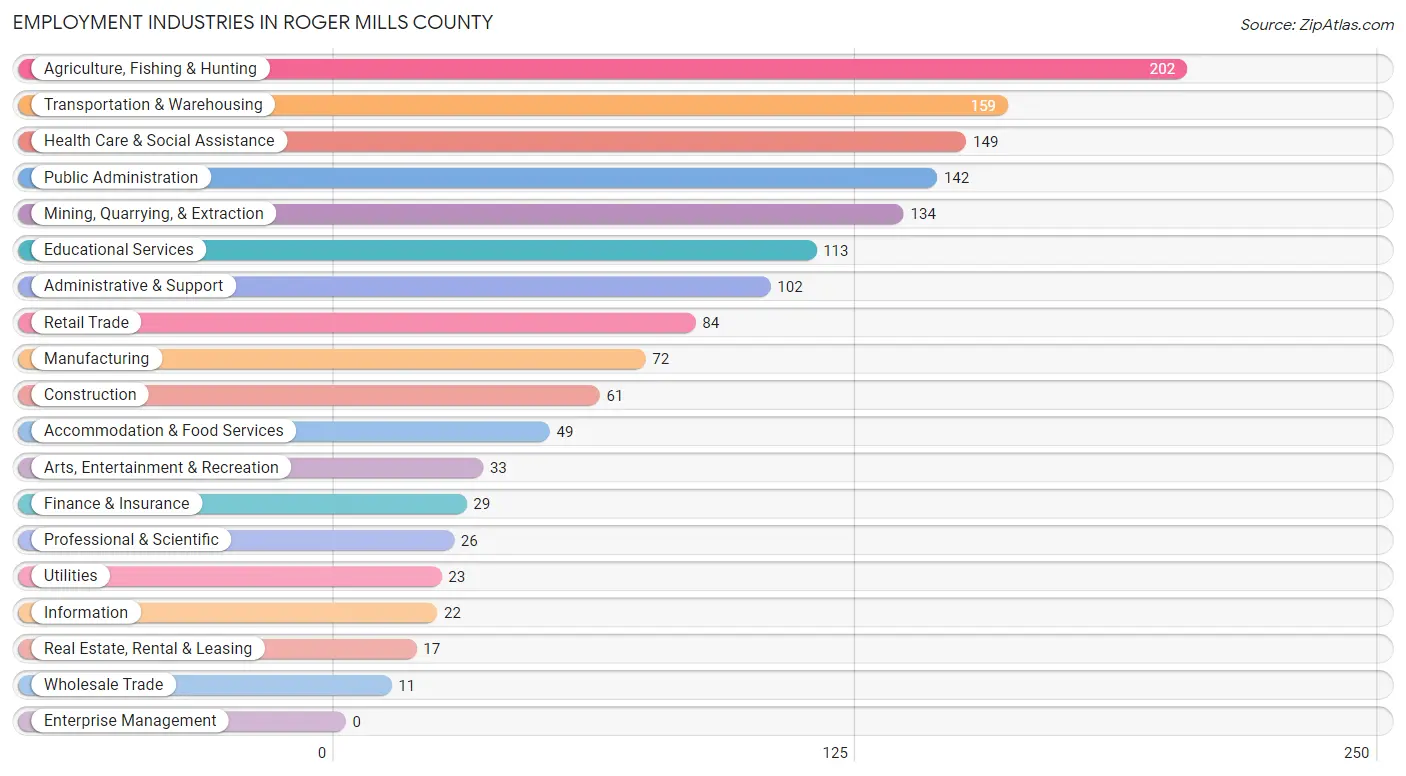
Employment Industries in Roger Mills County
The major employment industries in Roger Mills County include Agriculture, Fishing & Hunting (202 | 13.7%), Transportation & Warehousing (159 | 10.7%), Health Care & Social Assistance (149 | 10.1%), Public Administration (142 | 9.6%), and Mining, Quarrying, & Extraction (134 | 9.0%).
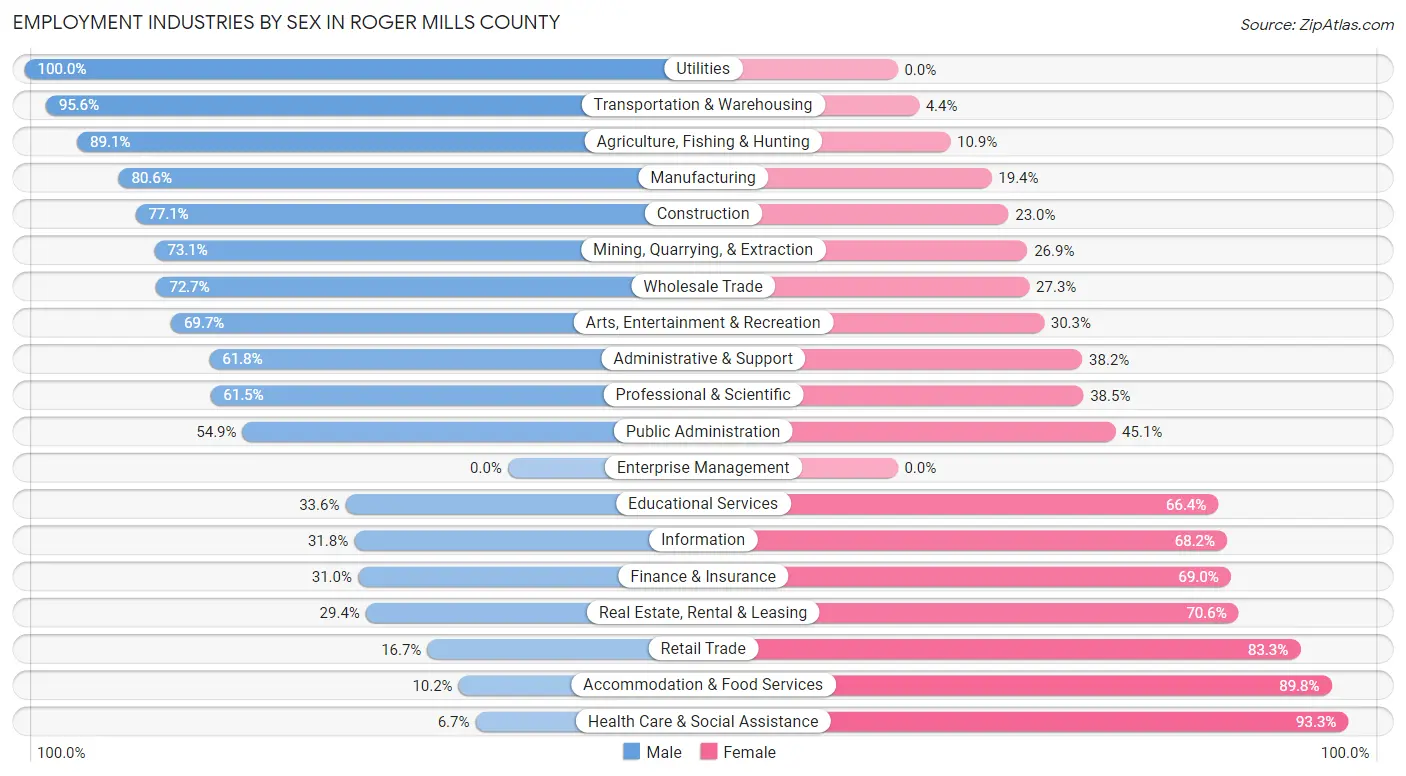
Employment Industries by Sex in Roger Mills County
The Roger Mills County industries that see more men than women are Utilities (100.0%), Transportation & Warehousing (95.6%), and Agriculture, Fishing & Hunting (89.1%), whereas the industries that tend to have a higher number of women are Health Care & Social Assistance (93.3%), Accommodation & Food Services (89.8%), and Retail Trade (83.3%).
| Industry | Male | Female |
| Agriculture, Fishing & Hunting | 180 (89.1%) | 22 (10.9%) |
| Mining, Quarrying, & Extraction | 98 (73.1%) | 36 (26.9%) |
| Construction | 47 (77.0%) | 14 (23.0%) |
| Manufacturing | 58 (80.6%) | 14 (19.4%) |
| Wholesale Trade | 8 (72.7%) | 3 (27.3%) |
| Retail Trade | 14 (16.7%) | 70 (83.3%) |
| Transportation & Warehousing | 152 (95.6%) | 7 (4.4%) |
| Utilities | 23 (100.0%) | 0 (0.0%) |
| Information | 7 (31.8%) | 15 (68.2%) |
| Finance & Insurance | 9 (31.0%) | 20 (69.0%) |
| Real Estate, Rental & Leasing | 5 (29.4%) | 12 (70.6%) |
| Professional & Scientific | 16 (61.5%) | 10 (38.5%) |
| Enterprise Management | 0 (0.0%) | 0 (0.0%) |
| Administrative & Support | 63 (61.8%) | 39 (38.2%) |
| Educational Services | 38 (33.6%) | 75 (66.4%) |
| Health Care & Social Assistance | 10 (6.7%) | 139 (93.3%) |
| Arts, Entertainment & Recreation | 23 (69.7%) | 10 (30.3%) |
| Accommodation & Food Services | 5 (10.2%) | 44 (89.8%) |
| Public Administration | 78 (54.9%) | 64 (45.1%) |
| Total | 867 (58.6%) | 613 (41.4%) |
Education in Roger Mills County
School Enrollment in Roger Mills County
The most common levels of schooling among the 799 students in Roger Mills County are elementary school (199 | 24.9%), middle school (197 | 24.7%), and high school (192 | 24.0%).
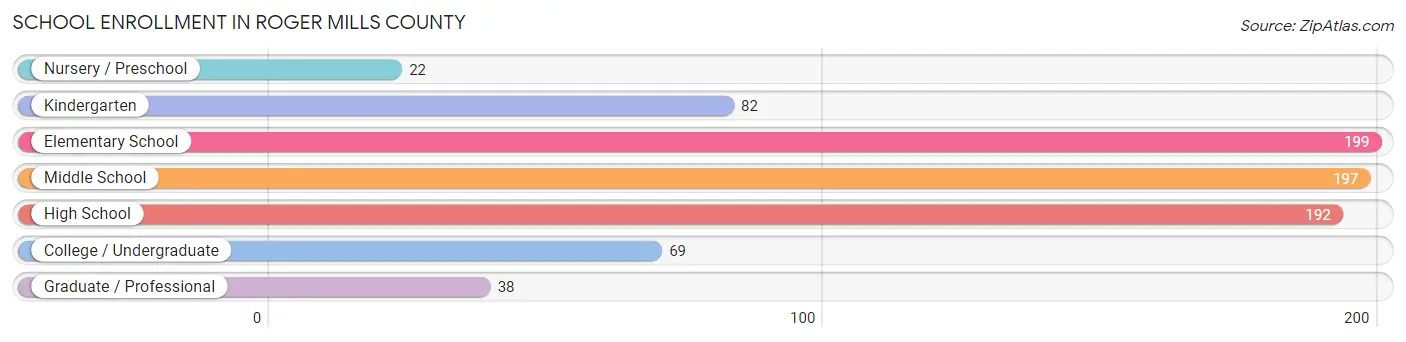
| School Level | # Students | % Students |
| Nursery / Preschool | 22 | 2.8% |
| Kindergarten | 82 | 10.3% |
| Elementary School | 199 | 24.9% |
| Middle School | 197 | 24.7% |
| High School | 192 | 24.0% |
| College / Undergraduate | 69 | 8.6% |
| Graduate / Professional | 38 | 4.8% |
| Total | 799 | 100.0% |
School Enrollment by Age by Funding Source in Roger Mills County
Out of a total of 799 students who are enrolled in schools in Roger Mills County, 54 (6.8%) attend a private institution, while the remaining 745 (93.2%) are enrolled in public schools. The age group of 5 to 9 year old has the highest likelihood of being enrolled in private schools, with 36 (13.2% in the age bracket) enrolled. Conversely, the age group of 18 to 19 year olds has the lowest likelihood of being enrolled in a private school, with 38 (100.0% in the age bracket) attending a public institution.
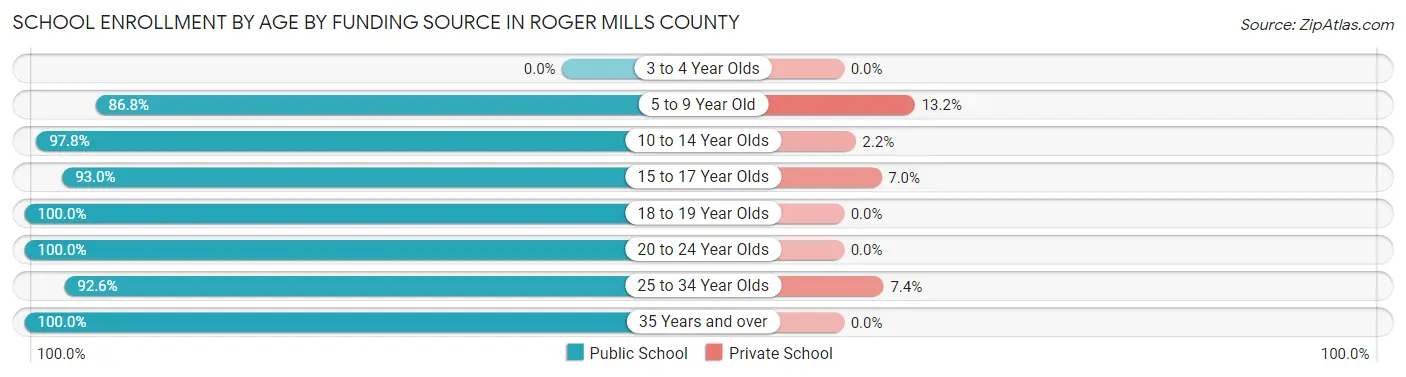
| Age Bracket | Public School | Private School |
| 3 to 4 Year Olds | 0 (0.0%) | 0 (0.0%) |
| 5 to 9 Year Old | 236 (86.8%) | 36 (13.2%) |
| 10 to 14 Year Olds | 223 (97.8%) | 5 (2.2%) |
| 15 to 17 Year Olds | 146 (93.0%) | 11 (7.0%) |
| 18 to 19 Year Olds | 38 (100.0%) | 0 (0.0%) |
| 20 to 24 Year Olds | 71 (100.0%) | 0 (0.0%) |
| 25 to 34 Year Olds | 25 (92.6%) | 2 (7.4%) |
| 35 Years and over | 6 (100.0%) | 0 (0.0%) |
| Total | 745 (93.2%) | 54 (6.8%) |
Educational Attainment by Field of Study in Roger Mills County
Education (136 | 24.6%), business (97 | 17.5%), science & technology (66 | 11.9%), physical & health sciences (58 | 10.5%), and bio, nature & agricultural (52 | 9.4%) are the most common fields of study among 553 individuals in Roger Mills County who have obtained a bachelor's degree or higher.
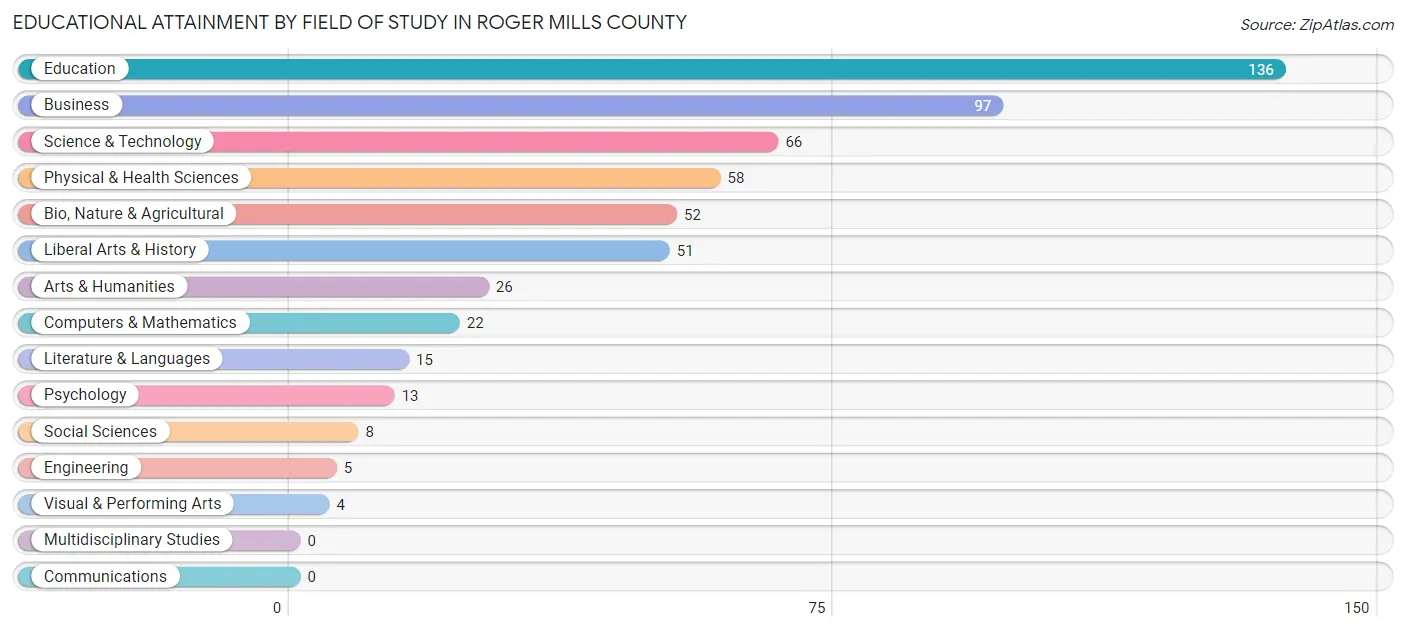
| Field of Study | # Graduates | % Graduates |
| Computers & Mathematics | 22 | 4.0% |
| Bio, Nature & Agricultural | 52 | 9.4% |
| Physical & Health Sciences | 58 | 10.5% |
| Psychology | 13 | 2.4% |
| Social Sciences | 8 | 1.5% |
| Engineering | 5 | 0.9% |
| Multidisciplinary Studies | 0 | 0.0% |
| Science & Technology | 66 | 11.9% |
| Business | 97 | 17.5% |
| Education | 136 | 24.6% |
| Literature & Languages | 15 | 2.7% |
| Liberal Arts & History | 51 | 9.2% |
| Visual & Performing Arts | 4 | 0.7% |
| Communications | 0 | 0.0% |
| Arts & Humanities | 26 | 4.7% |
| Total | 553 | 100.0% |
Transportation & Commute in Roger Mills County
Vehicle Availability by Sex in Roger Mills County
The most prevalent vehicle ownership categories in Roger Mills County are males with 3 vehicles (293, accounting for 33.8%) and females with 3 vehicles (184, making up 48.7%).
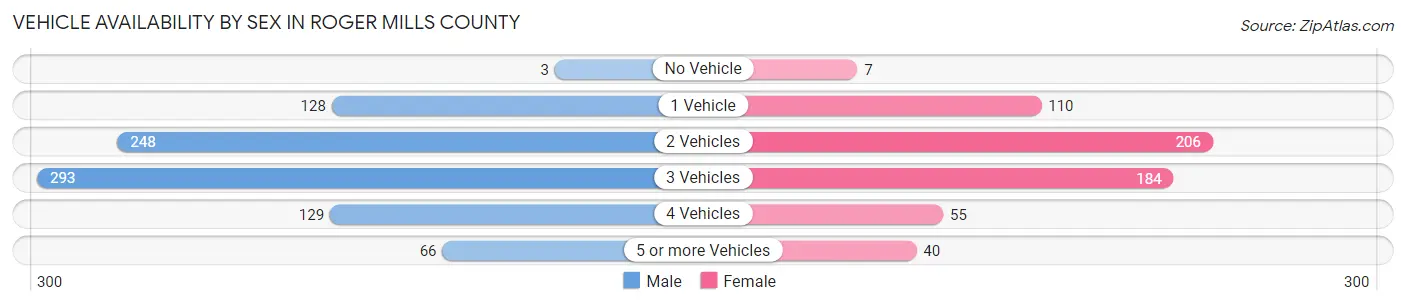
| Vehicles Available | Male | Female |
| No Vehicle | 3 (0.4%) | 7 (1.2%) |
| 1 Vehicle | 128 (14.8%) | 110 (18.3%) |
| 2 Vehicles | 248 (28.6%) | 206 (34.2%) |
| 3 Vehicles | 293 (33.8%) | 184 (30.6%) |
| 4 Vehicles | 129 (14.9%) | 55 (9.1%) |
| 5 or more Vehicles | 66 (7.6%) | 40 (6.6%) |
| Total | 867 (100.0%) | 602 (100.0%) |
Commute Time in Roger Mills County
The most frequently occuring commute durations in Roger Mills County are less than 5 minutes (312 commuters, 22.8%), 5 to 9 minutes (203 commuters, 14.8%), and 30 to 34 minutes (171 commuters, 12.5%).
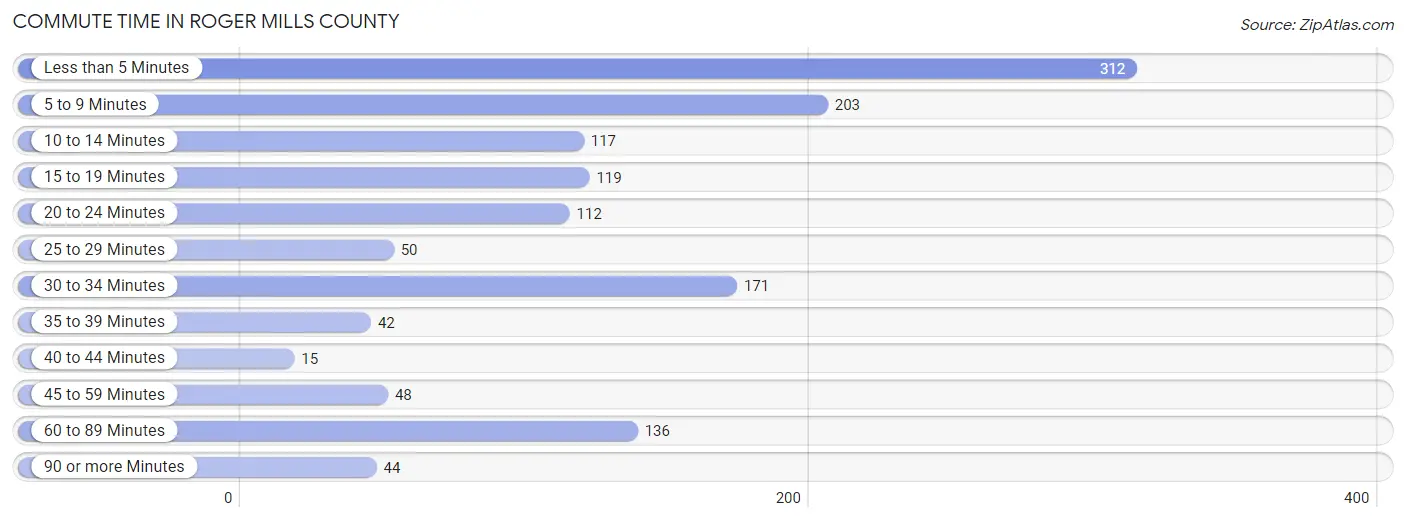
| Commute Time | # Commuters | % Commuters |
| Less than 5 Minutes | 312 | 22.8% |
| 5 to 9 Minutes | 203 | 14.8% |
| 10 to 14 Minutes | 117 | 8.6% |
| 15 to 19 Minutes | 119 | 8.7% |
| 20 to 24 Minutes | 112 | 8.2% |
| 25 to 29 Minutes | 50 | 3.6% |
| 30 to 34 Minutes | 171 | 12.5% |
| 35 to 39 Minutes | 42 | 3.1% |
| 40 to 44 Minutes | 15 | 1.1% |
| 45 to 59 Minutes | 48 | 3.5% |
| 60 to 89 Minutes | 136 | 9.9% |
| 90 or more Minutes | 44 | 3.2% |
Commute Time by Sex in Roger Mills County
The most common commute times in Roger Mills County are less than 5 minutes (220 commuters, 26.7%) for males and 30 to 34 minutes (98 commuters, 18.0%) for females.
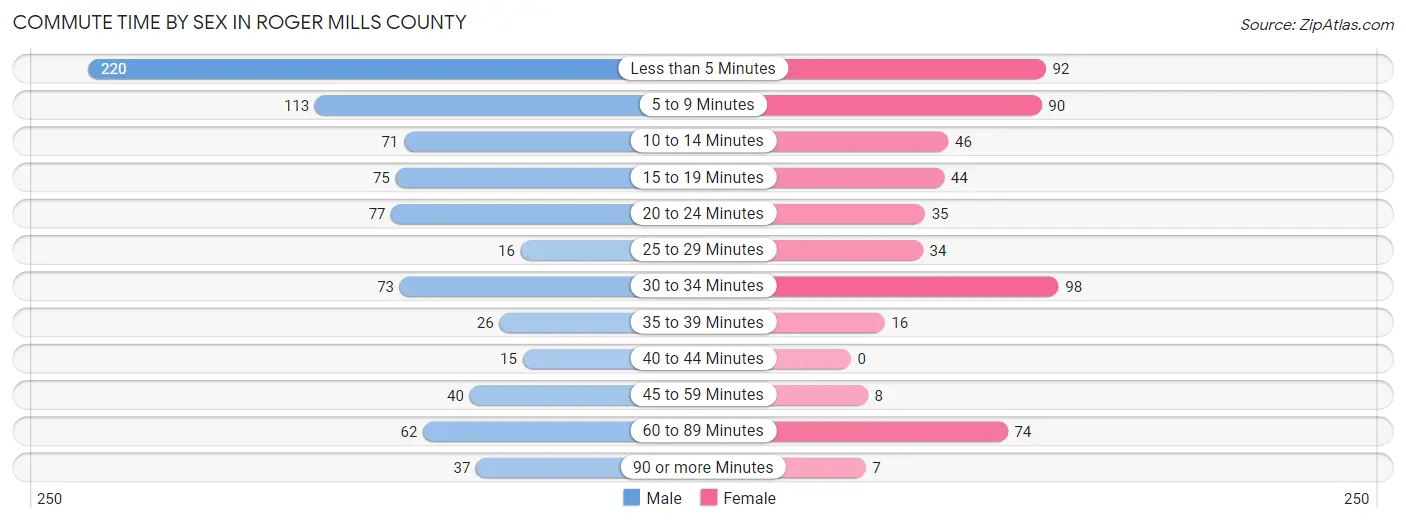
| Commute Time | Male | Female |
| Less than 5 Minutes | 220 (26.7%) | 92 (16.9%) |
| 5 to 9 Minutes | 113 (13.7%) | 90 (16.5%) |
| 10 to 14 Minutes | 71 (8.6%) | 46 (8.5%) |
| 15 to 19 Minutes | 75 (9.1%) | 44 (8.1%) |
| 20 to 24 Minutes | 77 (9.3%) | 35 (6.4%) |
| 25 to 29 Minutes | 16 (1.9%) | 34 (6.2%) |
| 30 to 34 Minutes | 73 (8.8%) | 98 (18.0%) |
| 35 to 39 Minutes | 26 (3.2%) | 16 (2.9%) |
| 40 to 44 Minutes | 15 (1.8%) | 0 (0.0%) |
| 45 to 59 Minutes | 40 (4.9%) | 8 (1.5%) |
| 60 to 89 Minutes | 62 (7.5%) | 74 (13.6%) |
| 90 or more Minutes | 37 (4.5%) | 7 (1.3%) |
Time of Departure to Work by Sex in Roger Mills County
The most frequent times of departure to work in Roger Mills County are 7:00 AM to 7:29 AM (224, 27.2%) for males and 7:00 AM to 7:29 AM (109, 20.0%) for females.
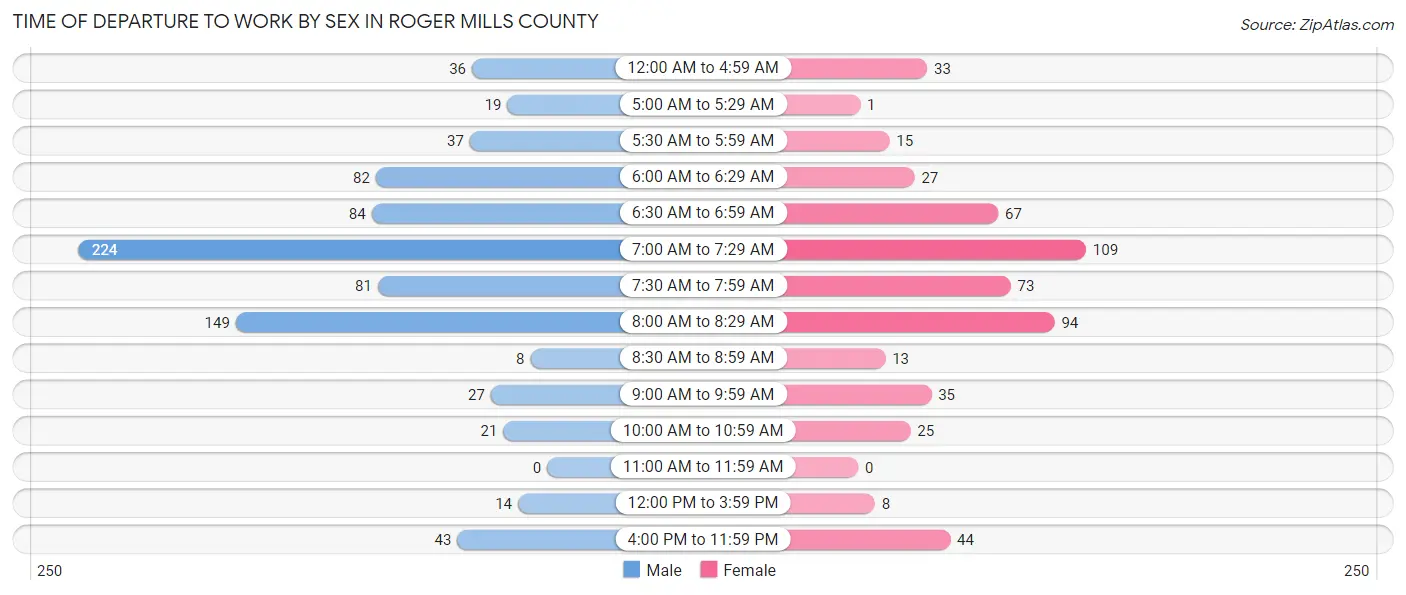
| Time of Departure | Male | Female |
| 12:00 AM to 4:59 AM | 36 (4.4%) | 33 (6.1%) |
| 5:00 AM to 5:29 AM | 19 (2.3%) | 1 (0.2%) |
| 5:30 AM to 5:59 AM | 37 (4.5%) | 15 (2.8%) |
| 6:00 AM to 6:29 AM | 82 (9.9%) | 27 (5.0%) |
| 6:30 AM to 6:59 AM | 84 (10.2%) | 67 (12.3%) |
| 7:00 AM to 7:29 AM | 224 (27.2%) | 109 (20.0%) |
| 7:30 AM to 7:59 AM | 81 (9.8%) | 73 (13.4%) |
| 8:00 AM to 8:29 AM | 149 (18.1%) | 94 (17.3%) |
| 8:30 AM to 8:59 AM | 8 (1.0%) | 13 (2.4%) |
| 9:00 AM to 9:59 AM | 27 (3.3%) | 35 (6.4%) |
| 10:00 AM to 10:59 AM | 21 (2.5%) | 25 (4.6%) |
| 11:00 AM to 11:59 AM | 0 (0.0%) | 0 (0.0%) |
| 12:00 PM to 3:59 PM | 14 (1.7%) | 8 (1.5%) |
| 4:00 PM to 11:59 PM | 43 (5.2%) | 44 (8.1%) |
| Total | 825 (100.0%) | 544 (100.0%) |
Housing Occupancy in Roger Mills County
Occupancy by Ownership in Roger Mills County
Of the total 1,458 dwellings in Roger Mills County, owner-occupied units account for 1,178 (80.8%), while renter-occupied units make up 280 (19.2%).
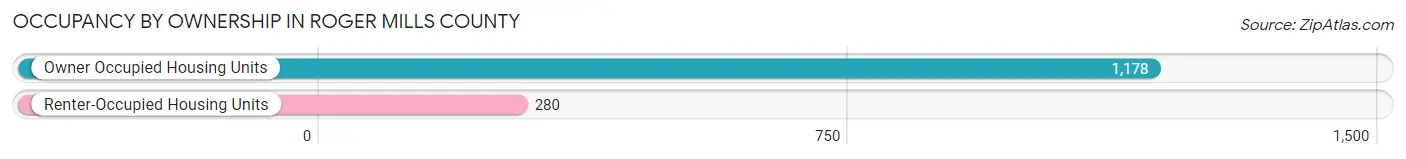
| Occupancy | # Housing Units | % Housing Units |
| Owner Occupied Housing Units | 1,178 | 80.8% |
| Renter-Occupied Housing Units | 280 | 19.2% |
| Total Occupied Housing Units | 1,458 | 100.0% |
Occupancy by Household Size in Roger Mills County
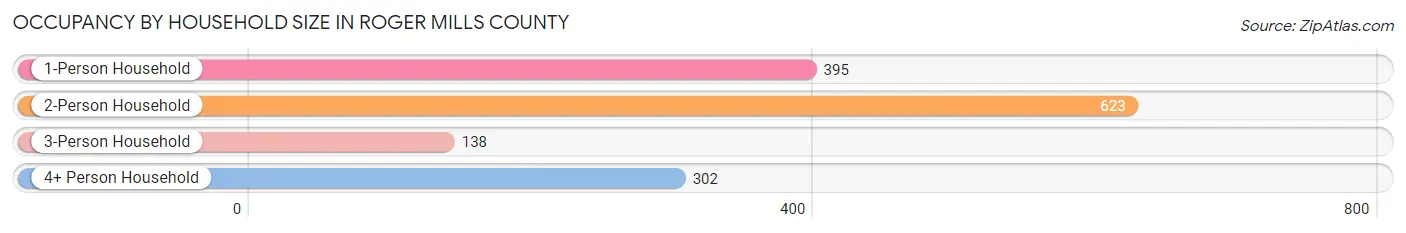
| Household Size | # Housing Units | % Housing Units |
| 1-Person Household | 395 | 27.1% |
| 2-Person Household | 623 | 42.7% |
| 3-Person Household | 138 | 9.5% |
| 4+ Person Household | 302 | 20.7% |
| Total Housing Units | 1,458 | 100.0% |
Occupancy by Ownership by Household Size in Roger Mills County
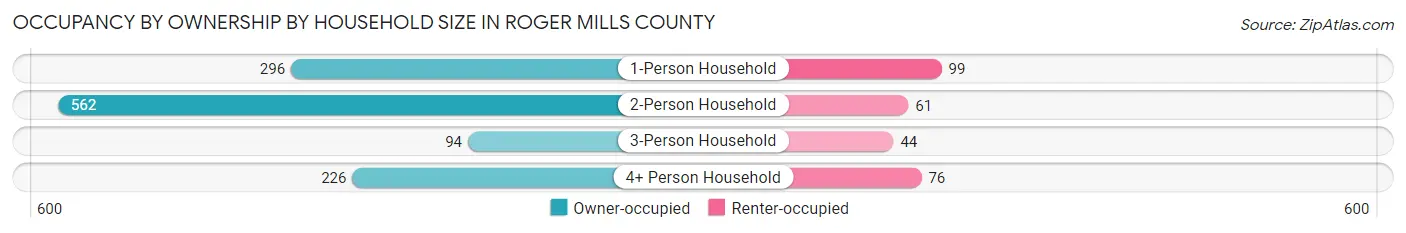
| Household Size | Owner-occupied | Renter-occupied |
| 1-Person Household | 296 (74.9%) | 99 (25.1%) |
| 2-Person Household | 562 (90.2%) | 61 (9.8%) |
| 3-Person Household | 94 (68.1%) | 44 (31.9%) |
| 4+ Person Household | 226 (74.8%) | 76 (25.2%) |
| Total Housing Units | 1,178 (80.8%) | 280 (19.2%) |
Occupancy by Educational Attainment in Roger Mills County
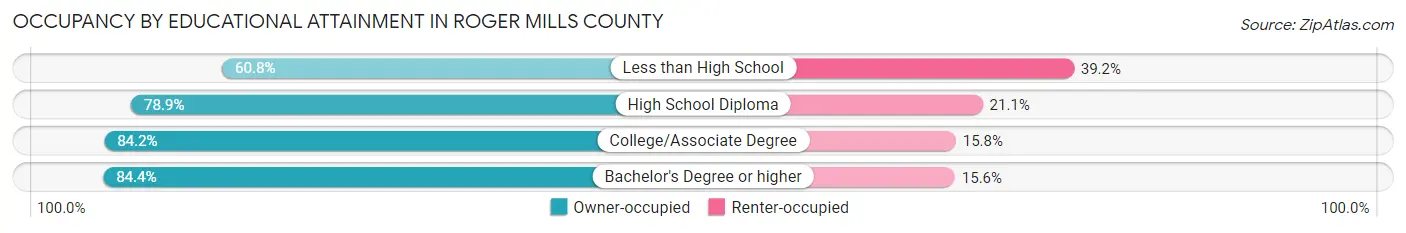
| Household Size | Owner-occupied | Renter-occupied |
| Less than High School | 59 (60.8%) | 38 (39.2%) |
| High School Diploma | 411 (78.9%) | 110 (21.1%) |
| College/Associate Degree | 432 (84.2%) | 81 (15.8%) |
| Bachelor's Degree or higher | 276 (84.4%) | 51 (15.6%) |
Occupancy by Age of Householder in Roger Mills County
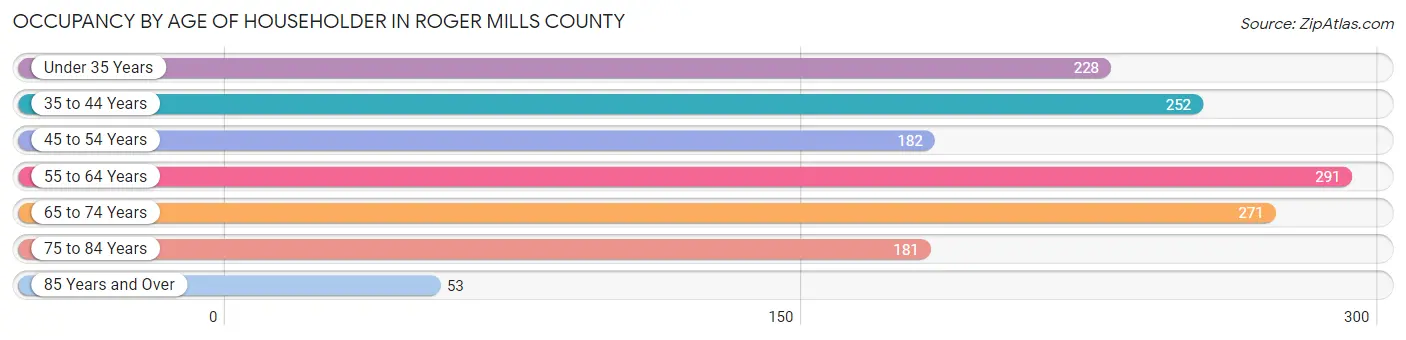
| Age Bracket | # Households | % Households |
| Under 35 Years | 228 | 15.6% |
| 35 to 44 Years | 252 | 17.3% |
| 45 to 54 Years | 182 | 12.5% |
| 55 to 64 Years | 291 | 20.0% |
| 65 to 74 Years | 271 | 18.6% |
| 75 to 84 Years | 181 | 12.4% |
| 85 Years and Over | 53 | 3.6% |
| Total | 1,458 | 100.0% |
Housing Finances in Roger Mills County
Median Income by Occupancy in Roger Mills County
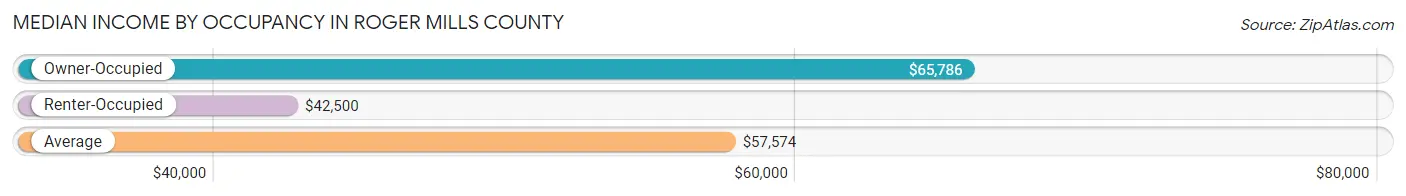
| Occupancy Type | # Households | Median Income |
| Owner-Occupied | 1,178 (80.8%) | $65,786 |
| Renter-Occupied | 280 (19.2%) | $42,500 |
| Average | 1,458 (100.0%) | $57,574 |
Occupancy by Householder Income Bracket in Roger Mills County
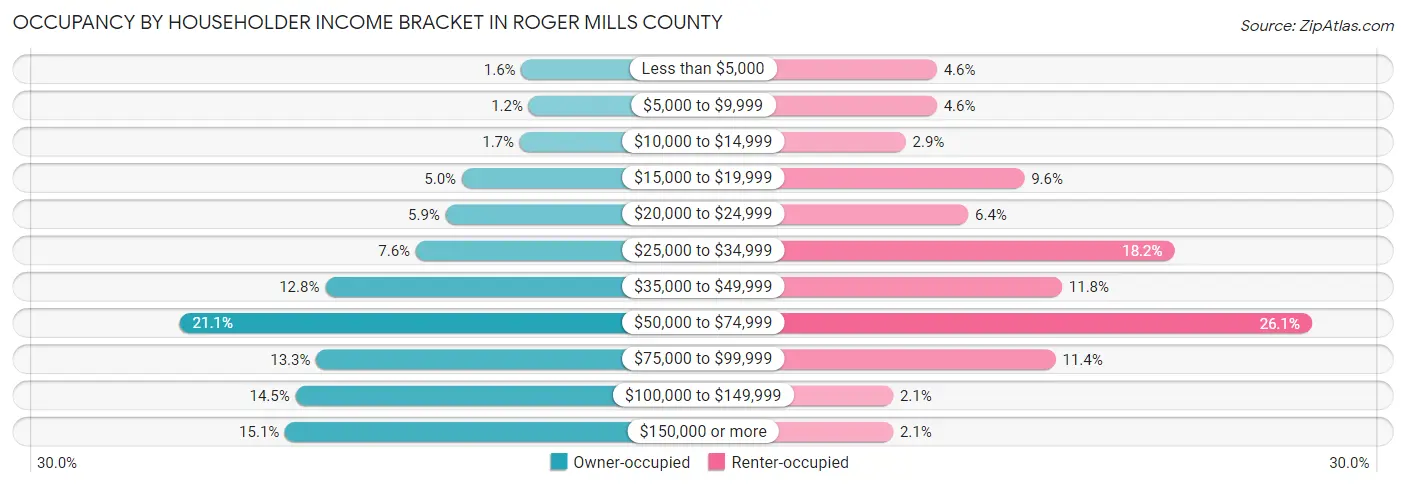
| Income Bracket | Owner-occupied | Renter-occupied |
| Less than $5,000 | 19 (1.6%) | 13 (4.6%) |
| $5,000 to $9,999 | 14 (1.2%) | 13 (4.6%) |
| $10,000 to $14,999 | 20 (1.7%) | 8 (2.9%) |
| $15,000 to $19,999 | 59 (5.0%) | 27 (9.6%) |
| $20,000 to $24,999 | 70 (5.9%) | 18 (6.4%) |
| $25,000 to $34,999 | 90 (7.6%) | 51 (18.2%) |
| $35,000 to $49,999 | 151 (12.8%) | 33 (11.8%) |
| $50,000 to $74,999 | 249 (21.1%) | 73 (26.1%) |
| $75,000 to $99,999 | 157 (13.3%) | 32 (11.4%) |
| $100,000 to $149,999 | 171 (14.5%) | 6 (2.1%) |
| $150,000 or more | 178 (15.1%) | 6 (2.1%) |
| Total | 1,178 (100.0%) | 280 (100.0%) |
Monthly Housing Cost Tiers in Roger Mills County
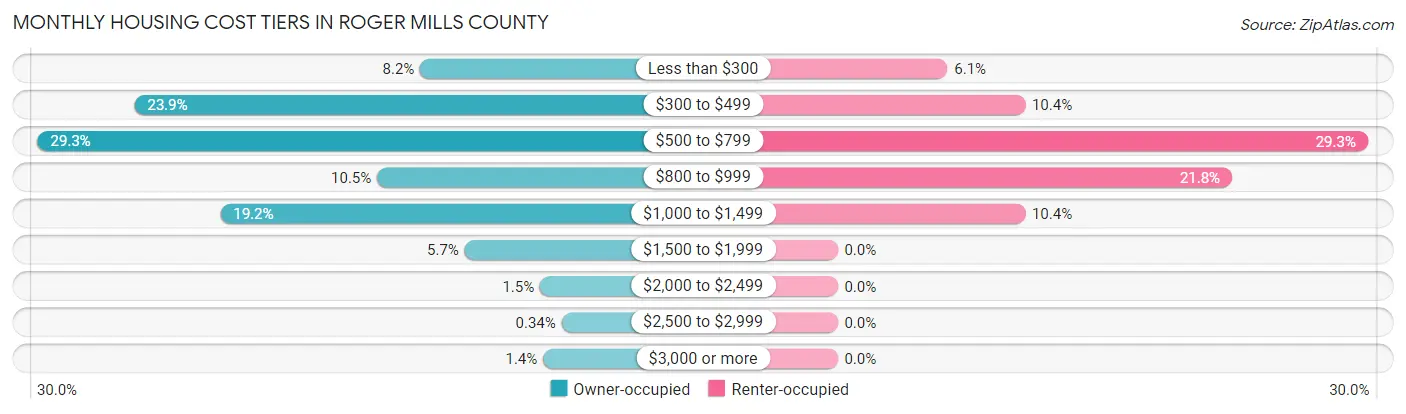
| Monthly Cost | Owner-occupied | Renter-occupied |
| Less than $300 | 96 (8.2%) | 17 (6.1%) |
| $300 to $499 | 282 (23.9%) | 29 (10.4%) |
| $500 to $799 | 345 (29.3%) | 82 (29.3%) |
| $800 to $999 | 124 (10.5%) | 61 (21.8%) |
| $1,000 to $1,499 | 226 (19.2%) | 29 (10.4%) |
| $1,500 to $1,999 | 67 (5.7%) | 0 (0.0%) |
| $2,000 to $2,499 | 18 (1.5%) | 0 (0.0%) |
| $2,500 to $2,999 | 4 (0.3%) | 0 (0.0%) |
| $3,000 or more | 16 (1.4%) | 0 (0.0%) |
| Total | 1,178 (100.0%) | 280 (100.0%) |
Physical Housing Characteristics in Roger Mills County
Housing Structures in Roger Mills County
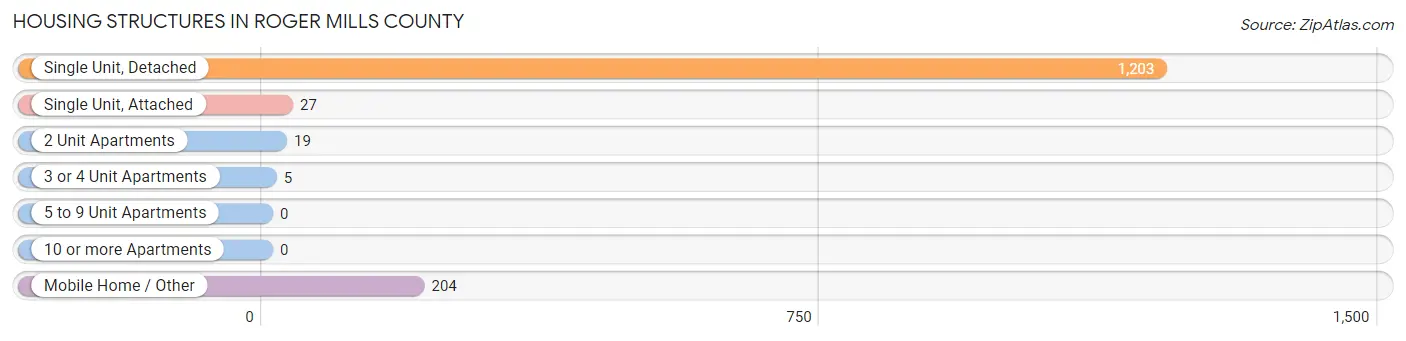
| Structure Type | # Housing Units | % Housing Units |
| Single Unit, Detached | 1,203 | 82.5% |
| Single Unit, Attached | 27 | 1.8% |
| 2 Unit Apartments | 19 | 1.3% |
| 3 or 4 Unit Apartments | 5 | 0.3% |
| 5 to 9 Unit Apartments | 0 | 0.0% |
| 10 or more Apartments | 0 | 0.0% |
| Mobile Home / Other | 204 | 14.0% |
| Total | 1,458 | 100.0% |
Housing Structures by Occupancy in Roger Mills County
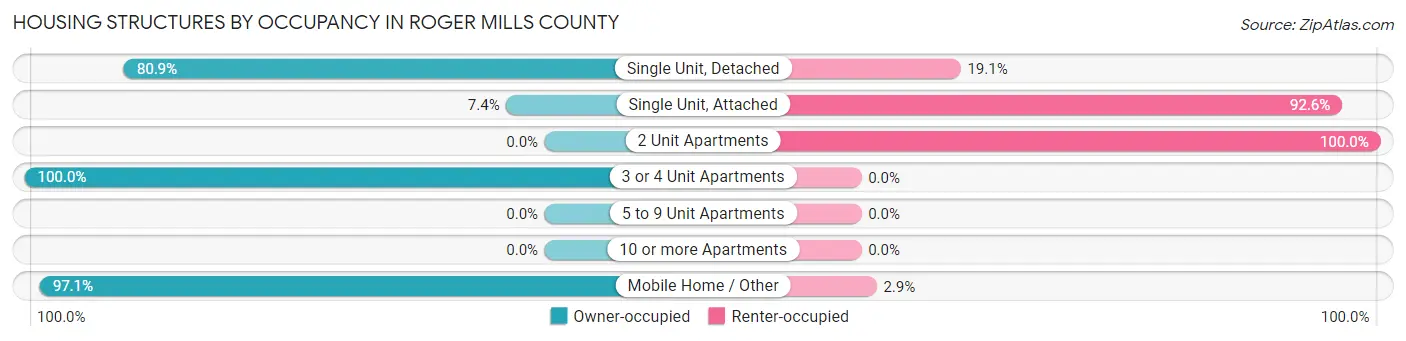
| Structure Type | Owner-occupied | Renter-occupied |
| Single Unit, Detached | 973 (80.9%) | 230 (19.1%) |
| Single Unit, Attached | 2 (7.4%) | 25 (92.6%) |
| 2 Unit Apartments | 0 (0.0%) | 19 (100.0%) |
| 3 or 4 Unit Apartments | 5 (100.0%) | 0 (0.0%) |
| 5 to 9 Unit Apartments | 0 (0.0%) | 0 (0.0%) |
| 10 or more Apartments | 0 (0.0%) | 0 (0.0%) |
| Mobile Home / Other | 198 (97.1%) | 6 (2.9%) |
| Total | 1,178 (80.8%) | 280 (19.2%) |
Housing Structures by Number of Rooms in Roger Mills County
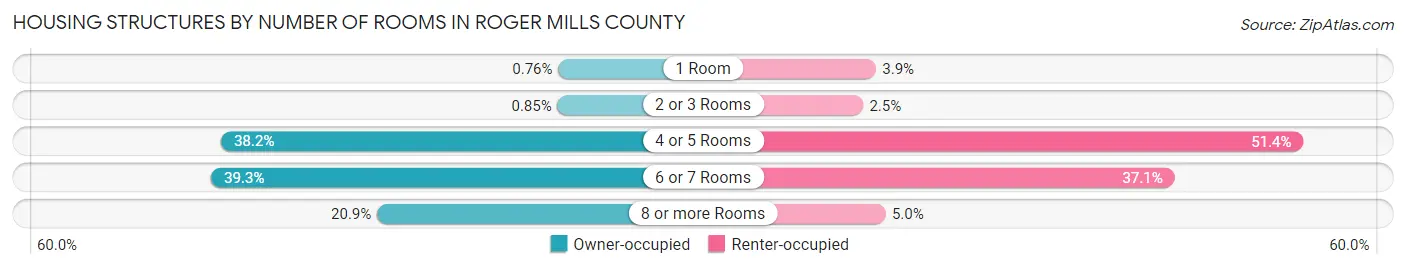
| Number of Rooms | Owner-occupied | Renter-occupied |
| 1 Room | 9 (0.8%) | 11 (3.9%) |
| 2 or 3 Rooms | 10 (0.9%) | 7 (2.5%) |
| 4 or 5 Rooms | 450 (38.2%) | 144 (51.4%) |
| 6 or 7 Rooms | 463 (39.3%) | 104 (37.1%) |
| 8 or more Rooms | 246 (20.9%) | 14 (5.0%) |
| Total | 1,178 (100.0%) | 280 (100.0%) |
Housing Structure by Heating Type in Roger Mills County
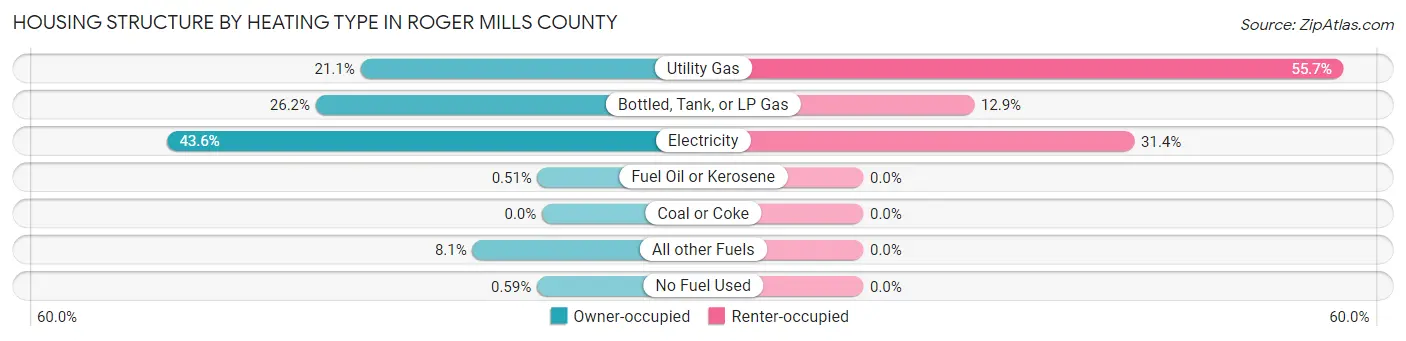
| Heating Type | Owner-occupied | Renter-occupied |
| Utility Gas | 248 (21.0%) | 156 (55.7%) |
| Bottled, Tank, or LP Gas | 309 (26.2%) | 36 (12.9%) |
| Electricity | 513 (43.5%) | 88 (31.4%) |
| Fuel Oil or Kerosene | 6 (0.5%) | 0 (0.0%) |
| Coal or Coke | 0 (0.0%) | 0 (0.0%) |
| All other Fuels | 95 (8.1%) | 0 (0.0%) |
| No Fuel Used | 7 (0.6%) | 0 (0.0%) |
| Total | 1,178 (100.0%) | 280 (100.0%) |
Household Vehicle Usage in Roger Mills County
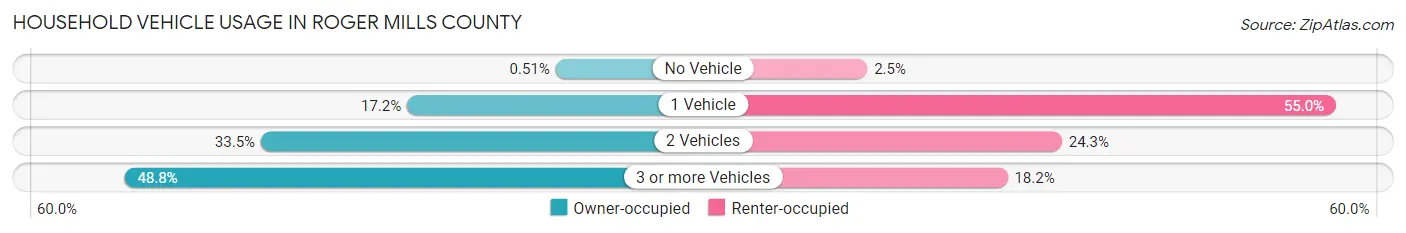
| Vehicles per Household | Owner-occupied | Renter-occupied |
| No Vehicle | 6 (0.5%) | 7 (2.5%) |
| 1 Vehicle | 202 (17.2%) | 154 (55.0%) |
| 2 Vehicles | 395 (33.5%) | 68 (24.3%) |
| 3 or more Vehicles | 575 (48.8%) | 51 (18.2%) |
| Total | 1,178 (100.0%) | 280 (100.0%) |
Real Estate & Mortgages in Roger Mills County
Real Estate and Mortgage Overview in Roger Mills County
| Characteristic | Without Mortgage | With Mortgage |
| Housing Units | 763 | 415 |
| Median Property Value | $156,700 | $139,700 |
| Median Household Income | $60,313 | $52 |
| Monthly Housing Costs | $507 | $16 |
| Real Estate Taxes | $793 | $7 |
Property Value by Mortgage Status in Roger Mills County
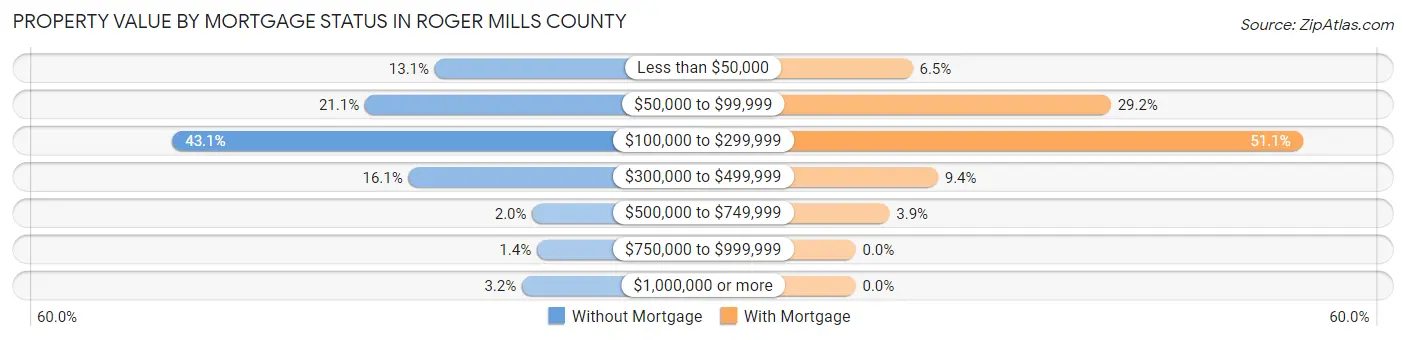
| Property Value | Without Mortgage | With Mortgage |
| Less than $50,000 | 100 (13.1%) | 27 (6.5%) |
| $50,000 to $99,999 | 161 (21.1%) | 121 (29.2%) |
| $100,000 to $299,999 | 329 (43.1%) | 212 (51.1%) |
| $300,000 to $499,999 | 123 (16.1%) | 39 (9.4%) |
| $500,000 to $749,999 | 15 (2.0%) | 16 (3.9%) |
| $750,000 to $999,999 | 11 (1.4%) | 0 (0.0%) |
| $1,000,000 or more | 24 (3.2%) | 0 (0.0%) |
| Total | 763 (100.0%) | 415 (100.0%) |
Household Income by Mortgage Status in Roger Mills County
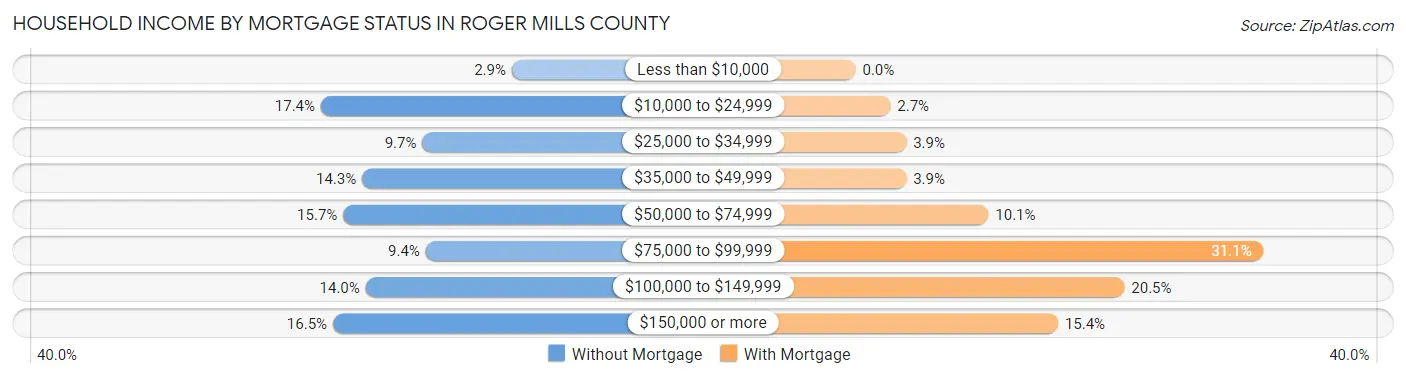
| Household Income | Without Mortgage | With Mortgage |
| Less than $10,000 | 22 (2.9%) | 0 (0.0%) |
| $10,000 to $24,999 | 133 (17.4%) | 11 (2.6%) |
| $25,000 to $34,999 | 74 (9.7%) | 16 (3.9%) |
| $35,000 to $49,999 | 109 (14.3%) | 16 (3.9%) |
| $50,000 to $74,999 | 120 (15.7%) | 42 (10.1%) |
| $75,000 to $99,999 | 72 (9.4%) | 129 (31.1%) |
| $100,000 to $149,999 | 107 (14.0%) | 85 (20.5%) |
| $150,000 or more | 126 (16.5%) | 64 (15.4%) |
| Total | 763 (100.0%) | 415 (100.0%) |
Property Value to Household Income Ratio in Roger Mills County
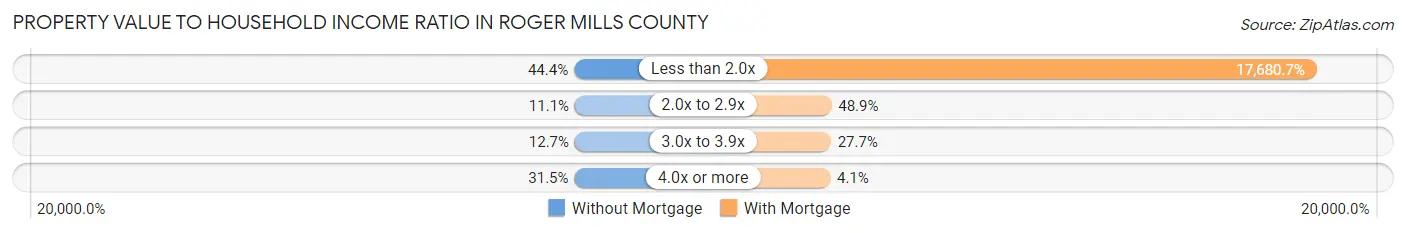
| Value-to-Income Ratio | Without Mortgage | With Mortgage |
| Less than 2.0x | 339 (44.4%) | 73,375 (17,680.7%) |
| 2.0x to 2.9x | 85 (11.1%) | 203 (48.9%) |
| 3.0x to 3.9x | 97 (12.7%) | 115 (27.7%) |
| 4.0x or more | 240 (31.5%) | 17 (4.1%) |
| Total | 763 (100.0%) | 415 (100.0%) |
Real Estate Taxes by Mortgage Status in Roger Mills County
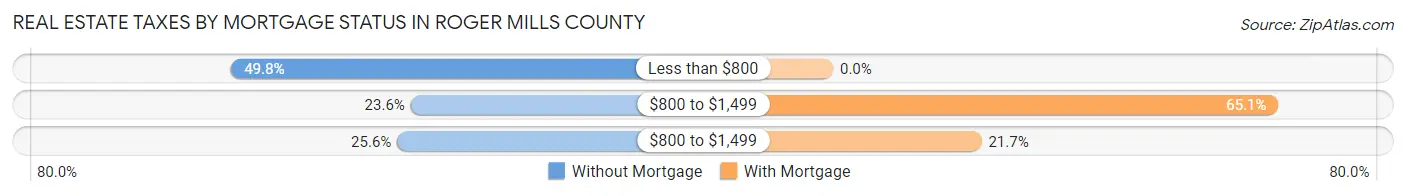
| Property Taxes | Without Mortgage | With Mortgage |
| Less than $800 | 380 (49.8%) | 0 (0.0%) |
| $800 to $1,499 | 180 (23.6%) | 270 (65.1%) |
| $800 to $1,499 | 195 (25.6%) | 90 (21.7%) |
| Total | 763 (100.0%) | 415 (100.0%) |
Health & Disability in Roger Mills County
Health Insurance Coverage by Age in Roger Mills County
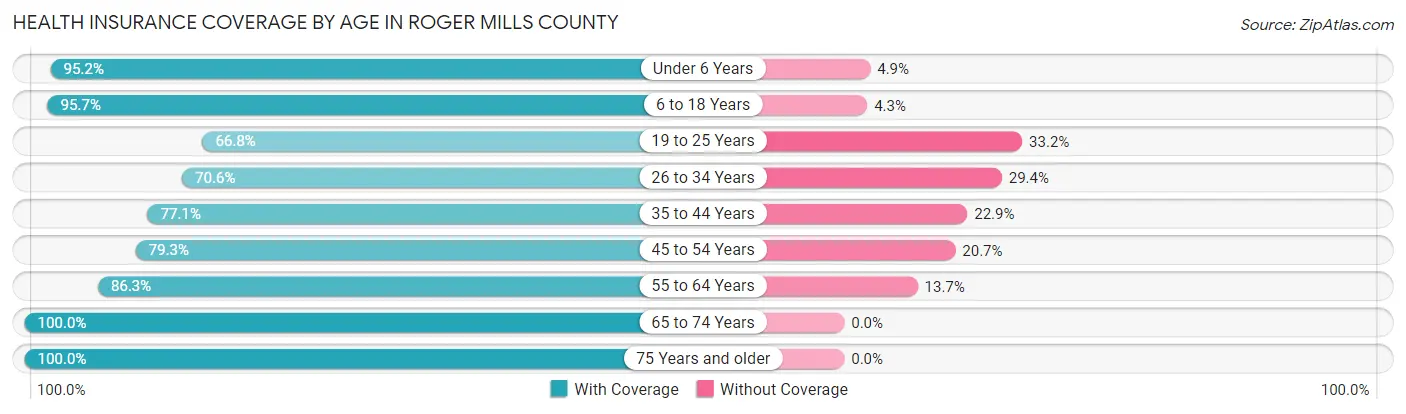
| Age Bracket | With Coverage | Without Coverage |
| Under 6 Years | 196 (95.2%) | 10 (4.9%) |
| 6 to 18 Years | 649 (95.7%) | 29 (4.3%) |
| 19 to 25 Years | 137 (66.8%) | 68 (33.2%) |
| 26 to 34 Years | 202 (70.6%) | 84 (29.4%) |
| 35 to 44 Years | 346 (77.1%) | 103 (22.9%) |
| 45 to 54 Years | 291 (79.3%) | 76 (20.7%) |
| 55 to 64 Years | 423 (86.3%) | 67 (13.7%) |
| 65 to 74 Years | 413 (100.0%) | 0 (0.0%) |
| 75 Years and older | 314 (100.0%) | 0 (0.0%) |
| Total | 2,971 (87.2%) | 437 (12.8%) |
Health Insurance Coverage by Citizenship Status in Roger Mills County
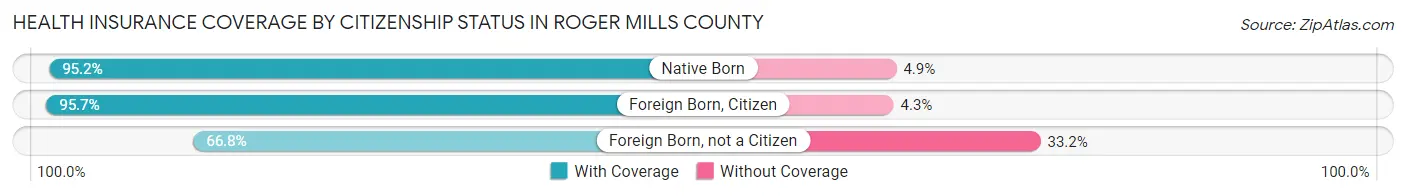
| Citizenship Status | With Coverage | Without Coverage |
| Native Born | 196 (95.2%) | 10 (4.9%) |
| Foreign Born, Citizen | 649 (95.7%) | 29 (4.3%) |
| Foreign Born, not a Citizen | 137 (66.8%) | 68 (33.2%) |
Health Insurance Coverage by Household Income in Roger Mills County
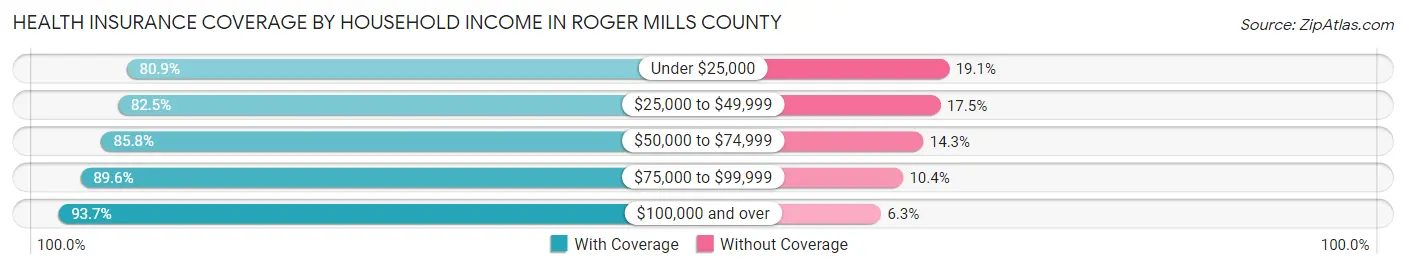
| Household Income | With Coverage | Without Coverage |
| Under $25,000 | 377 (80.9%) | 89 (19.1%) |
| $25,000 to $49,999 | 539 (82.5%) | 114 (17.5%) |
| $50,000 to $74,999 | 728 (85.8%) | 121 (14.2%) |
| $75,000 to $99,999 | 481 (89.6%) | 56 (10.4%) |
| $100,000 and over | 846 (93.7%) | 57 (6.3%) |
Public vs Private Health Insurance Coverage by Age in Roger Mills County
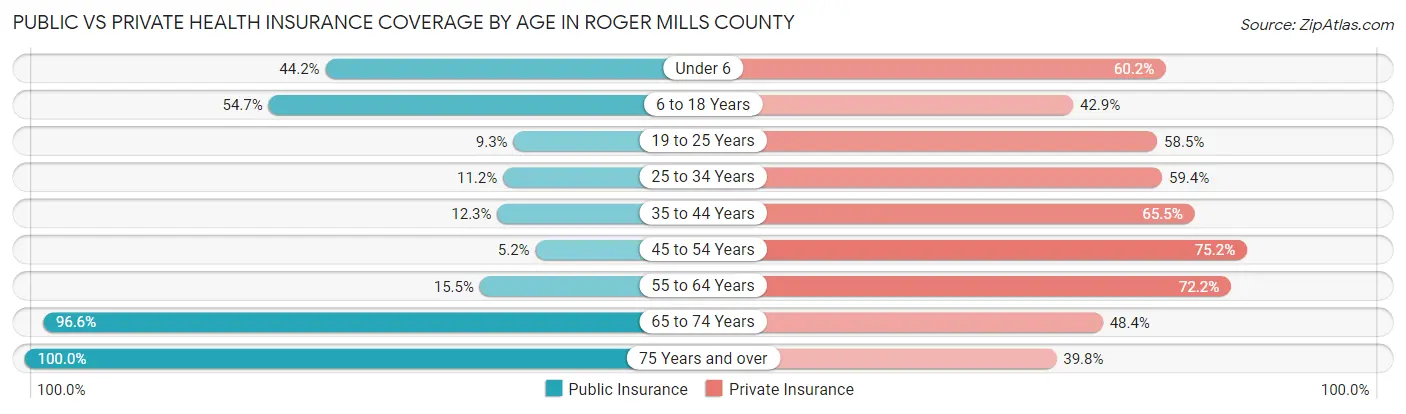
| Age Bracket | Public Insurance | Private Insurance |
| Under 6 | 91 (44.2%) | 124 (60.2%) |
| 6 to 18 Years | 371 (54.7%) | 291 (42.9%) |
| 19 to 25 Years | 19 (9.3%) | 120 (58.5%) |
| 25 to 34 Years | 32 (11.2%) | 170 (59.4%) |
| 35 to 44 Years | 55 (12.2%) | 294 (65.5%) |
| 45 to 54 Years | 19 (5.2%) | 276 (75.2%) |
| 55 to 64 Years | 76 (15.5%) | 354 (72.2%) |
| 65 to 74 Years | 399 (96.6%) | 200 (48.4%) |
| 75 Years and over | 314 (100.0%) | 125 (39.8%) |
| Total | 1,376 (40.4%) | 1,954 (57.3%) |
Disability Status by Sex by Age in Roger Mills County
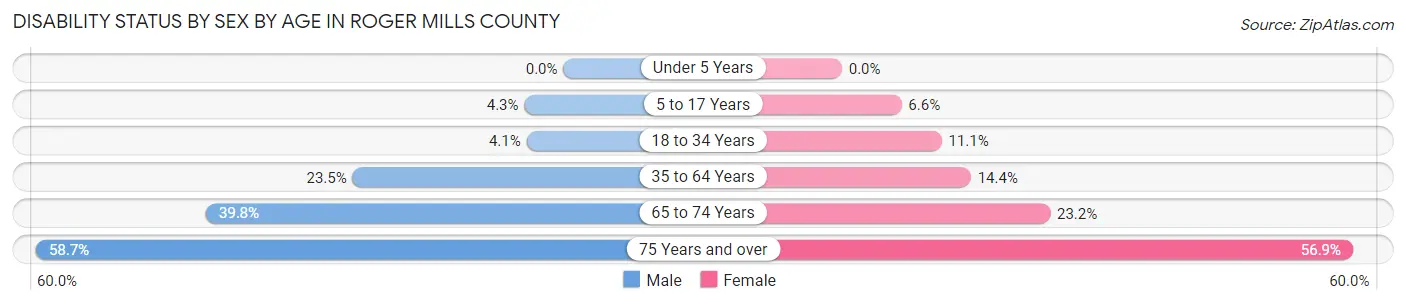
| Age Bracket | Male | Female |
| Under 5 Years | 0 (0.0%) | 0 (0.0%) |
| 5 to 17 Years | 16 (4.3%) | 20 (6.6%) |
| 18 to 34 Years | 11 (4.1%) | 29 (11.1%) |
| 35 to 64 Years | 166 (23.5%) | 86 (14.4%) |
| 65 to 74 Years | 82 (39.8%) | 48 (23.2%) |
| 75 Years and over | 74 (58.7%) | 107 (56.9%) |
Disability Class by Sex by Age in Roger Mills County
Disability Class: Hearing Difficulty
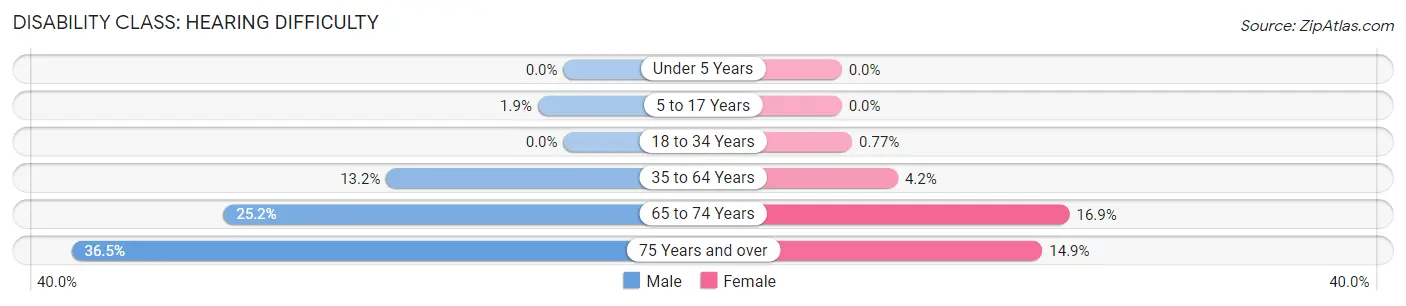
| Age Bracket | Male | Female |
| Under 5 Years | 0 (0.0%) | 0 (0.0%) |
| 5 to 17 Years | 7 (1.9%) | 0 (0.0%) |
| 18 to 34 Years | 0 (0.0%) | 2 (0.8%) |
| 35 to 64 Years | 93 (13.2%) | 25 (4.2%) |
| 65 to 74 Years | 52 (25.2%) | 35 (16.9%) |
| 75 Years and over | 46 (36.5%) | 28 (14.9%) |
Disability Class: Vision Difficulty
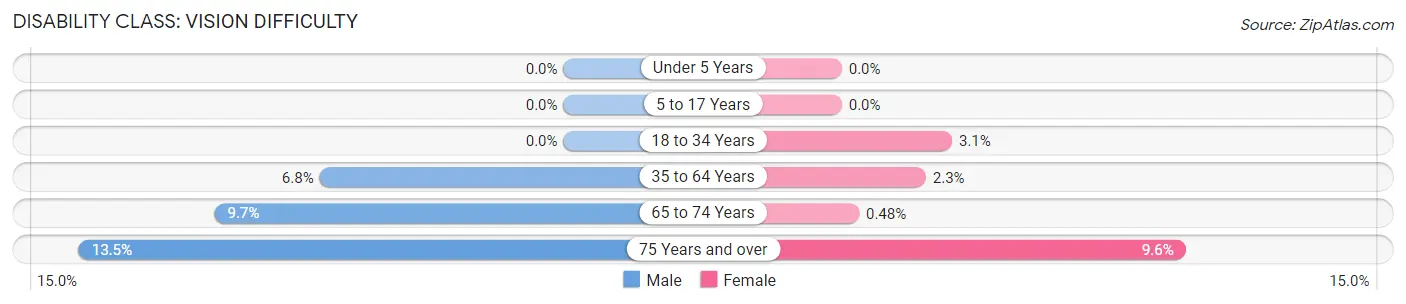
| Age Bracket | Male | Female |
| Under 5 Years | 0 (0.0%) | 0 (0.0%) |
| 5 to 17 Years | 0 (0.0%) | 0 (0.0%) |
| 18 to 34 Years | 0 (0.0%) | 8 (3.1%) |
| 35 to 64 Years | 48 (6.8%) | 14 (2.3%) |
| 65 to 74 Years | 20 (9.7%) | 1 (0.5%) |
| 75 Years and over | 17 (13.5%) | 18 (9.6%) |
Disability Class: Cognitive Difficulty
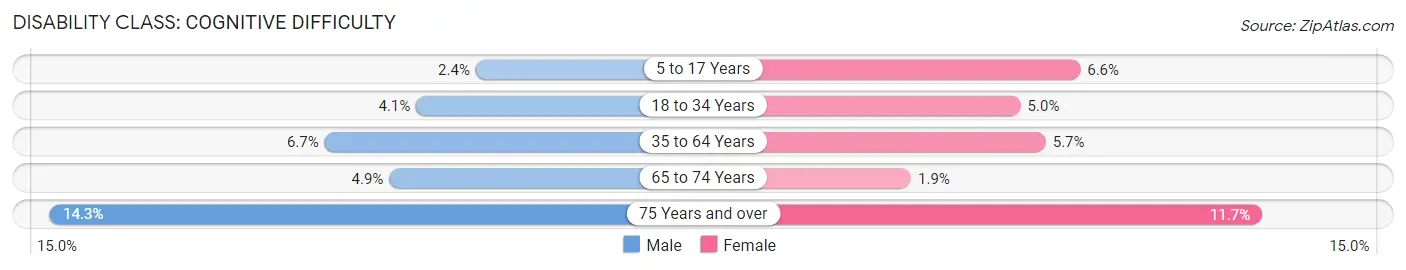
| Age Bracket | Male | Female |
| 5 to 17 Years | 9 (2.4%) | 20 (6.6%) |
| 18 to 34 Years | 11 (4.1%) | 13 (5.0%) |
| 35 to 64 Years | 47 (6.7%) | 34 (5.7%) |
| 65 to 74 Years | 10 (4.9%) | 4 (1.9%) |
| 75 Years and over | 18 (14.3%) | 22 (11.7%) |
Disability Class: Ambulatory Difficulty
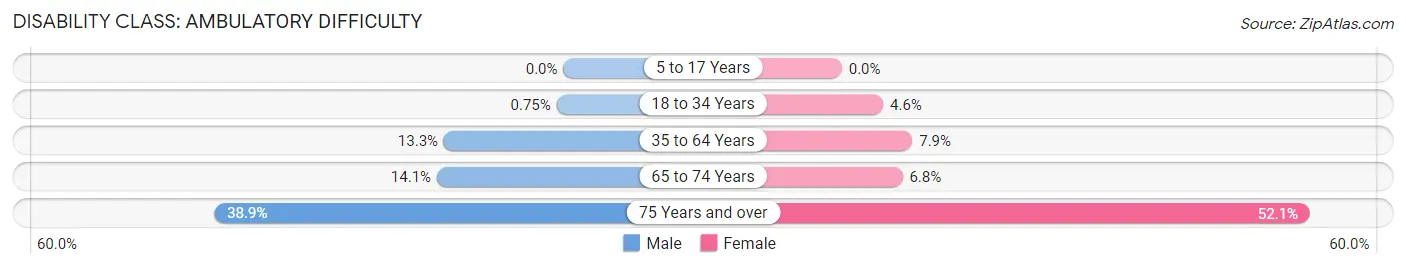
| Age Bracket | Male | Female |
| 5 to 17 Years | 0 (0.0%) | 0 (0.0%) |
| 18 to 34 Years | 2 (0.7%) | 12 (4.6%) |
| 35 to 64 Years | 94 (13.3%) | 47 (7.9%) |
| 65 to 74 Years | 29 (14.1%) | 14 (6.8%) |
| 75 Years and over | 49 (38.9%) | 98 (52.1%) |
Disability Class: Self-Care Difficulty
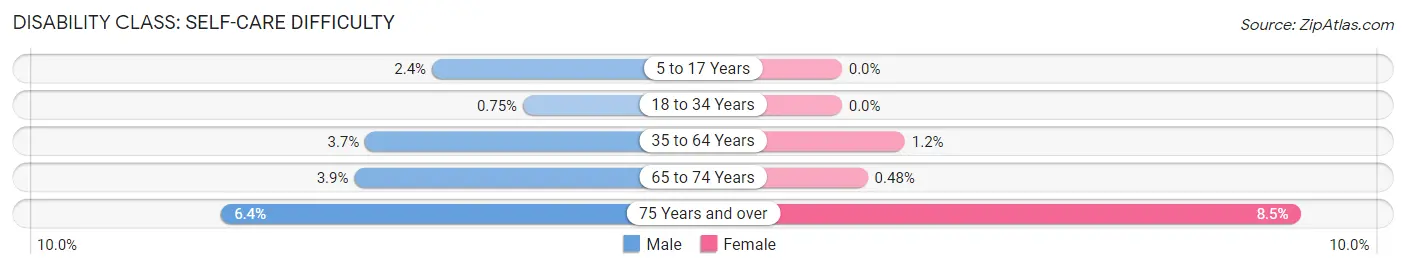
| Age Bracket | Male | Female |
| 5 to 17 Years | 9 (2.4%) | 0 (0.0%) |
| 18 to 34 Years | 2 (0.7%) | 0 (0.0%) |
| 35 to 64 Years | 26 (3.7%) | 7 (1.2%) |
| 65 to 74 Years | 8 (3.9%) | 1 (0.5%) |
| 75 Years and over | 8 (6.4%) | 16 (8.5%) |
Technology Access in Roger Mills County
Computing Device Access in Roger Mills County
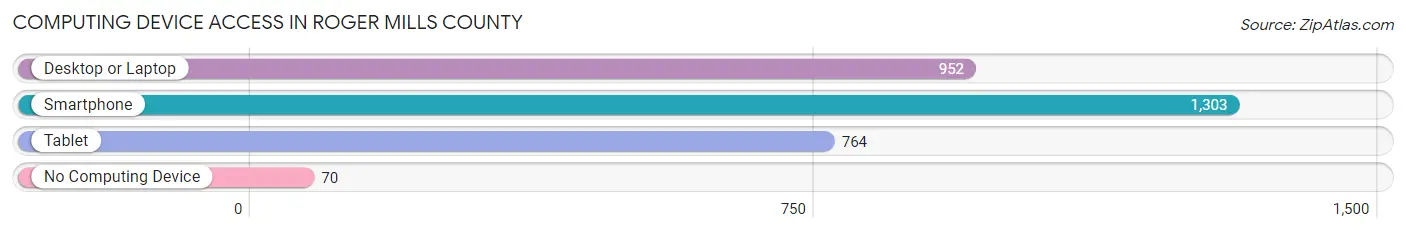
| Device Type | # Households | % Households |
| Desktop or Laptop | 952 | 65.3% |
| Smartphone | 1,303 | 89.4% |
| Tablet | 764 | 52.4% |
| No Computing Device | 70 | 4.8% |
| Total | 1,458 | 100.0% |
Internet Access in Roger Mills County
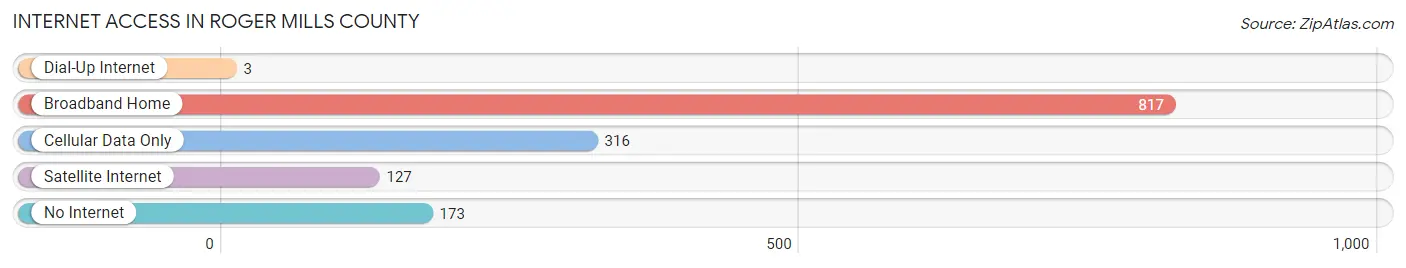
| Internet Type | # Households | % Households |
| Dial-Up Internet | 3 | 0.2% |
| Broadband Home | 817 | 56.0% |
| Cellular Data Only | 316 | 21.7% |
| Satellite Internet | 127 | 8.7% |
| No Internet | 173 | 11.9% |
| Total | 1,458 | 100.0% |
Roger Mills County Summary
Mills County is located in the south-central region of Oklahoma, and is bordered by Jefferson County to the north, Carter County to the east, Love County to the south, and Stephens County to the west. The county seat is located in the town of Cheyenne, and the county is named after Roger Mills, a prominent politician and lawyer in the late 19th century.
History
Mills County was established in 1892, and was named after Roger Mills, a prominent politician and lawyer in the late 19th century. The county was originally part of the Cheyenne and Arapaho Indian Reservation, and was opened to settlement in 1892. The first settlers in the area were ranchers, who established large cattle operations in the area. The county was officially organized in 1895, and the town of Cheyenne was established as the county seat.
In the early 20th century, the county experienced a period of rapid growth, as the population increased from just over 1,000 in 1900 to over 5,000 by 1910. This growth was largely due to the development of the oil and gas industry in the area, as well as the construction of the Oklahoma Central Railway. The county continued to grow throughout the 20th century, and by 2000, the population had reached 8,845.
Geography
Mills County is located in the south-central region of Oklahoma, and is bordered by Jefferson County to the north, Carter County to the east, Love County to the south, and Stephens County to the west. The county covers an area of 845 square miles, and is mostly comprised of rolling hills and prairies. The Washita River runs through the county, and there are several small lakes and reservoirs in the area. The county is located in the Central Great Plains ecoregion, and is home to a variety of wildlife, including white-tailed deer, wild turkey, and bobcats.
Economy
Mills County has a diverse economy, with a variety of industries providing employment opportunities. The largest industry in the county is agriculture, with cattle ranching and wheat farming being the primary sources of income. Oil and gas production is also an important part of the economy, and there are several oil and gas companies operating in the area. Other industries in the county include manufacturing, retail, and tourism.
Demographics
As of the 2010 census, the population of Mills County was 8,845, with a population density of 10.5 people per square mile. The racial makeup of the county was 94.3% White, 0.7% African American, 1.2% Native American, 0.3% Asian, 0.1% Pacific Islander, and 2.4% from other races. The median household income in the county was $37,945, and the median family income was $45,938. The per capita income in the county was $18,945. The largest employers in the county are the oil and gas industry, the agricultural industry, and the retail industry.
Common Questions
What is Per Capita Income in Roger Mills County?
Per Capita income in Roger Mills County is $43,603.
What is the Median Family Income in Roger Mills County?
Median Family Income in Roger Mills County is $68,041.
What is the Median Household income in Roger Mills County?
Median Household Income in Roger Mills County is $57,574.
What is Income or Wage Gap in Roger Mills County?
Income or Wage Gap in Roger Mills County is 39.8%.
Women in Roger Mills County earn 60.2 cents for every dollar earned by a man.
What is Inequality or Gini Index in Roger Mills County?
Inequality or Gini Index in Roger Mills County is 0.54.
What is the Total Population of Roger Mills County?
Total Population of Roger Mills County is 3,423.
What is the Total Male Population of Roger Mills County?
Total Male Population of Roger Mills County is 1,783.
What is the Total Female Population of Roger Mills County?
Total Female Population of Roger Mills County is 1,640.
What is the Ratio of Males per 100 Females in Roger Mills County?
There are 108.72 Males per 100 Females in Roger Mills County.
What is the Ratio of Females per 100 Males in Roger Mills County?
There are 91.98 Females per 100 Males in Roger Mills County.
What is the Median Population Age in Roger Mills County?
Median Population Age in Roger Mills County is 42.0 Years.
What is the Average Family Size in Roger Mills County
Average Family Size in Roger Mills County is 2.8 People.
What is the Average Household Size in Roger Mills County
Average Household Size in Roger Mills County is 2.3 People.
How Large is the Labor Force in Roger Mills County?
There are 1,552 People in the Labor Forcein in Roger Mills County.
What is the Percentage of People in the Labor Force in Roger Mills County?
58.7% of People are in the Labor Force in Roger Mills County.
What is the Unemployment Rate in Roger Mills County?
Unemployment Rate in Roger Mills County is 4.7%.