Pushmataha County, OK Map & Demographics
Pushmataha County Map
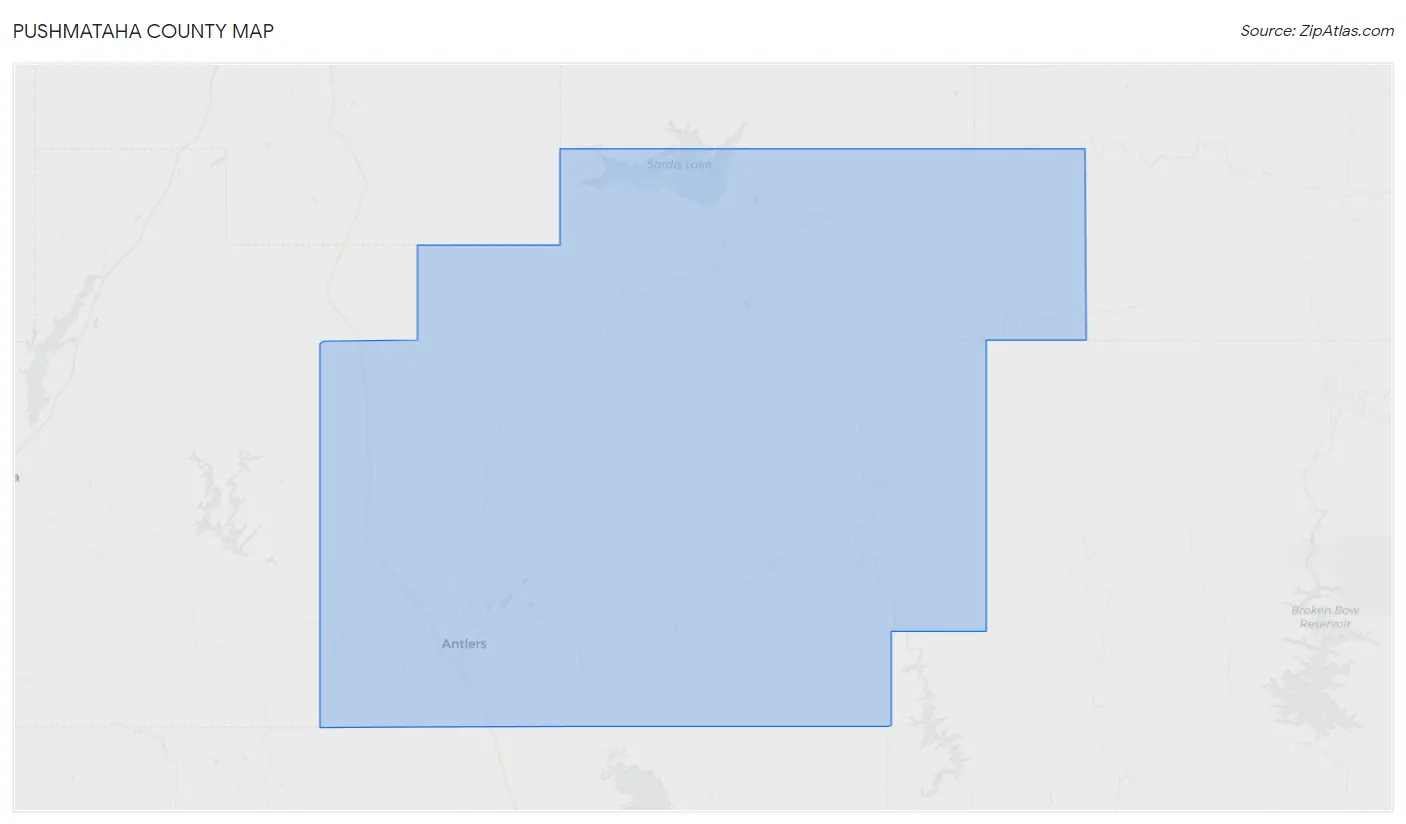
Pushmataha County Overview
$23,393
PER CAPITA INCOME
$53,688
AVG FAMILY INCOME
$42,274
AVG HOUSEHOLD INCOME
35.1%
WAGE / INCOME GAP [ % ]
64.9¢/ $1
WAGE / INCOME GAP [ $ ]
$9,833
FAMILY INCOME DEFICIT
0.46
INEQUALITY / GINI INDEX
10,845
TOTAL POPULATION
5,312
MALE POPULATION
5,533
FEMALE POPULATION
96.01
MALES / 100 FEMALES
104.16
FEMALES / 100 MALES
44.0
MEDIAN AGE
3.1
AVG FAMILY SIZE
2.5
AVG HOUSEHOLD SIZE
4,019
LABOR FORCE [ PEOPLE ]
45.8%
PERCENT IN LABOR FORCE
9.0%
UNEMPLOYMENT RATE
Income in Pushmataha County
Income Overview in Pushmataha County
Per Capita Income in Pushmataha County is $23,393, while median incomes of families and households are $53,688 and $42,274 respectively.
| Characteristic | Number | Measure |
| Per Capita Income | 10,845 | $23,393 |
| Median Family Income | 2,786 | $53,688 |
| Mean Family Income | 2,786 | $66,090 |
| Median Household Income | 4,229 | $42,274 |
| Mean Household Income | 4,229 | $54,980 |
| Income Deficit | 2,786 | $9,833 |
| Wage / Income Gap (%) | 10,845 | 35.05% |
| Wage / Income Gap ($) | 10,845 | 64.95¢ per $1 |
| Gini / Inequality Index | 10,845 | 0.46 |
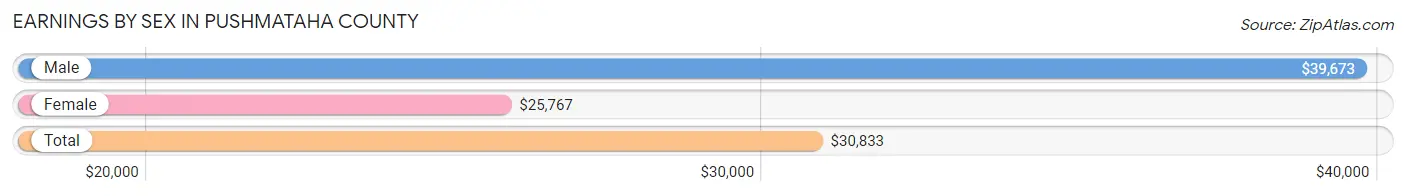
Earnings by Sex in Pushmataha County
Average Earnings in Pushmataha County are $30,833, $39,673 for men and $25,767 for women, a difference of 35.0%.
| Sex | Number | Average Earnings |
| Male | 2,093 (50.4%) | $39,673 |
| Female | 2,059 (49.6%) | $25,767 |
| Total | 4,152 (100.0%) | $30,833 |
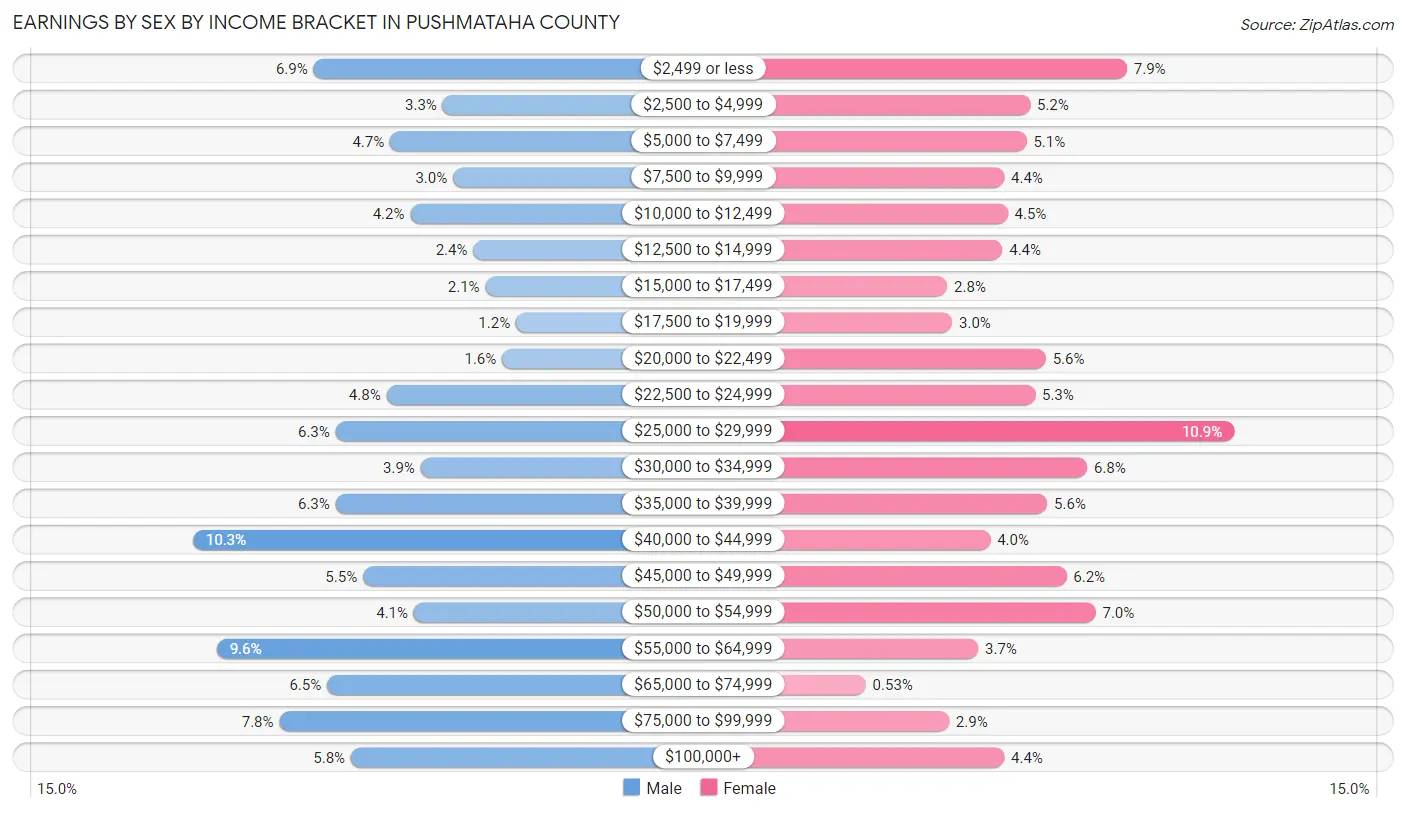
Earnings by Sex by Income Bracket in Pushmataha County
The most common earnings brackets in Pushmataha County are $40,000 to $44,999 for men (215 | 10.3%) and $25,000 to $29,999 for women (224 | 10.9%).
| Income | Male | Female |
| $2,499 or less | 144 (6.9%) | 162 (7.9%) |
| $2,500 to $4,999 | 68 (3.3%) | 106 (5.1%) |
| $5,000 to $7,499 | 99 (4.7%) | 104 (5.1%) |
| $7,500 to $9,999 | 62 (3.0%) | 91 (4.4%) |
| $10,000 to $12,499 | 87 (4.2%) | 93 (4.5%) |
| $12,500 to $14,999 | 50 (2.4%) | 90 (4.4%) |
| $15,000 to $17,499 | 43 (2.1%) | 58 (2.8%) |
| $17,500 to $19,999 | 25 (1.2%) | 61 (3.0%) |
| $20,000 to $22,499 | 33 (1.6%) | 115 (5.6%) |
| $22,500 to $24,999 | 101 (4.8%) | 109 (5.3%) |
| $25,000 to $29,999 | 131 (6.3%) | 224 (10.9%) |
| $30,000 to $34,999 | 81 (3.9%) | 139 (6.8%) |
| $35,000 to $39,999 | 131 (6.3%) | 116 (5.6%) |
| $40,000 to $44,999 | 215 (10.3%) | 83 (4.0%) |
| $45,000 to $49,999 | 115 (5.5%) | 127 (6.2%) |
| $50,000 to $54,999 | 85 (4.1%) | 144 (7.0%) |
| $55,000 to $64,999 | 201 (9.6%) | 76 (3.7%) |
| $65,000 to $74,999 | 136 (6.5%) | 11 (0.5%) |
| $75,000 to $99,999 | 164 (7.8%) | 59 (2.9%) |
| $100,000+ | 122 (5.8%) | 91 (4.4%) |
| Total | 2,093 (100.0%) | 2,059 (100.0%) |
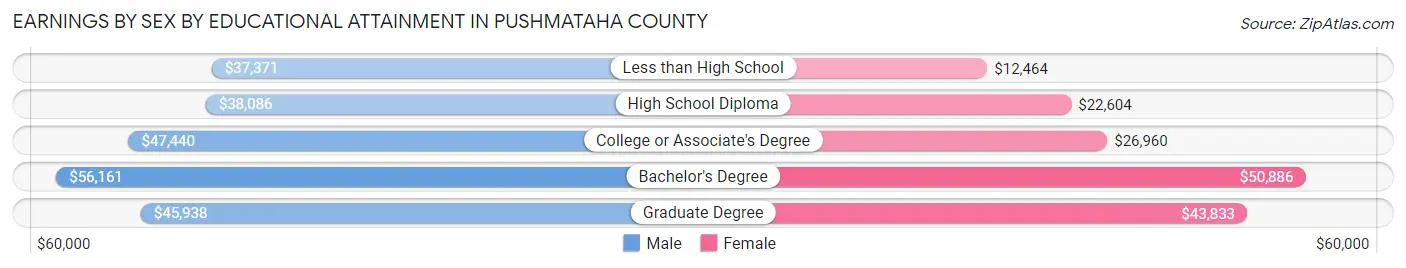
Earnings by Sex by Educational Attainment in Pushmataha County
Average earnings in Pushmataha County are $41,765 for men and $27,595 for women, a difference of 33.9%. Men with an educational attainment of bachelor's degree enjoy the highest average annual earnings of $56,161, while those with less than high school education earn the least with $37,371. Women with an educational attainment of bachelor's degree earn the most with the average annual earnings of $50,886, while those with less than high school education have the smallest earnings of $12,464.
| Educational Attainment | Male Income | Female Income |
| Less than High School | $37,371 | $12,464 |
| High School Diploma | $38,086 | $22,604 |
| College or Associate's Degree | $47,440 | $26,960 |
| Bachelor's Degree | $56,161 | $50,886 |
| Graduate Degree | $45,938 | $43,833 |
| Total | $41,765 | $27,595 |
Family Income in Pushmataha County
Family Income Brackets in Pushmataha County
According to the Pushmataha County family income data, there are 644 families falling into the $50,000 to $74,999 income range, which is the most common income bracket and makes up 23.1% of all families. Conversely, the $150,000 to $199,999 income bracket is the least frequent group with only 81 families (2.9%) belonging to this category.
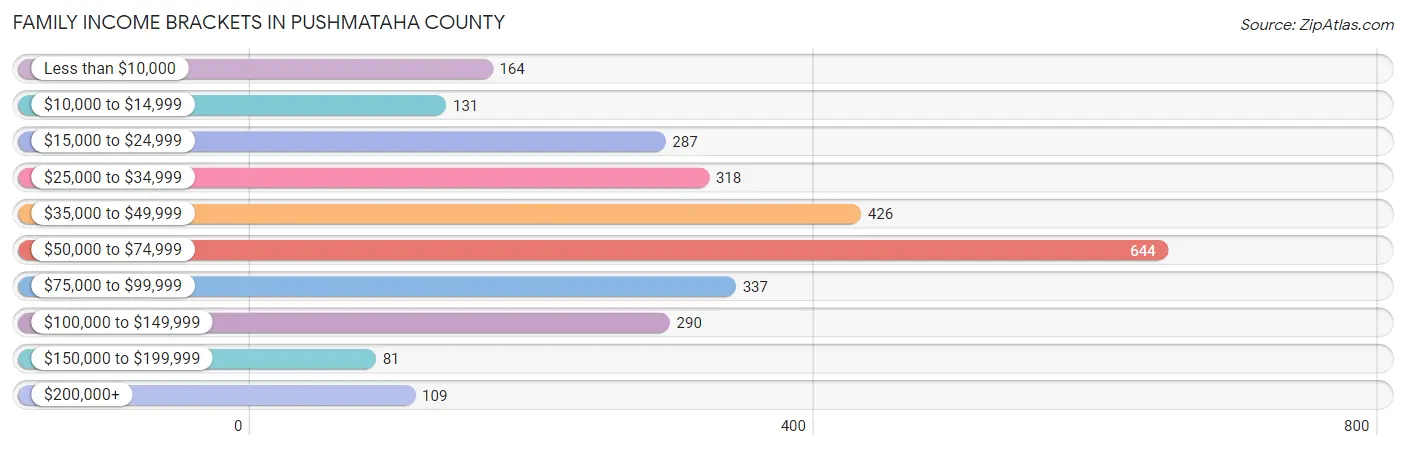
| Income Bracket | # Families | % Families |
| Less than $10,000 | 164 | 5.9% |
| $10,000 to $14,999 | 131 | 4.7% |
| $15,000 to $24,999 | 287 | 10.3% |
| $25,000 to $34,999 | 318 | 11.4% |
| $35,000 to $49,999 | 426 | 15.3% |
| $50,000 to $74,999 | 644 | 23.1% |
| $75,000 to $99,999 | 337 | 12.1% |
| $100,000 to $149,999 | 290 | 10.4% |
| $150,000 to $199,999 | 81 | 2.9% |
| $200,000+ | 109 | 3.9% |
Family Income by Famaliy Size in Pushmataha County
4-person families (345 | 12.4%) account for the highest median family income in Pushmataha County with $67,917 per family, while 2-person families (1,533 | 55.0%) have the highest median income of $25,223 per family member.
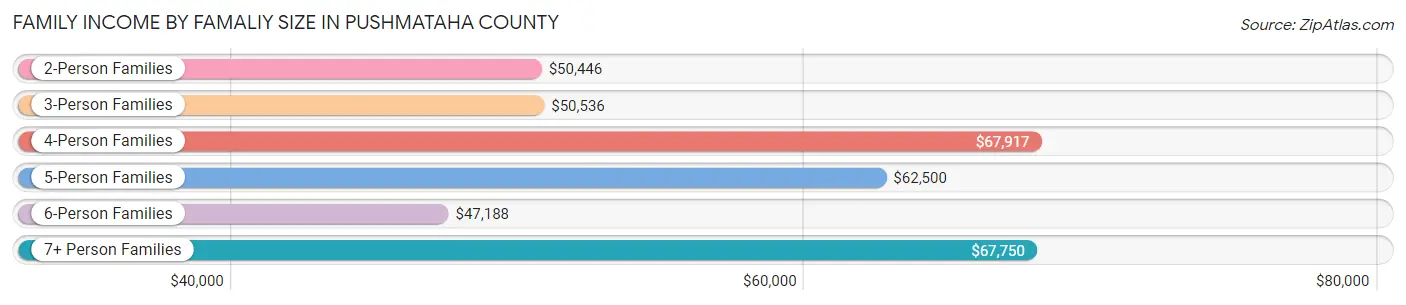
| Income Bracket | # Families | Median Income |
| 2-Person Families | 1,533 (55.0%) | $50,446 |
| 3-Person Families | 587 (21.1%) | $50,536 |
| 4-Person Families | 345 (12.4%) | $67,917 |
| 5-Person Families | 210 (7.5%) | $62,500 |
| 6-Person Families | 65 (2.3%) | $47,188 |
| 7+ Person Families | 46 (1.7%) | $67,750 |
| Total | 2,786 (100.0%) | $53,688 |
Family Income by Number of Earners in Pushmataha County
The median family income in Pushmataha County is $53,688, with families comprising 2 earners (850) having the highest median family income of $83,600, while families with no earners (895) have the lowest median family income of $30,439, accounting for 30.5% and 32.1% of families, respectively.
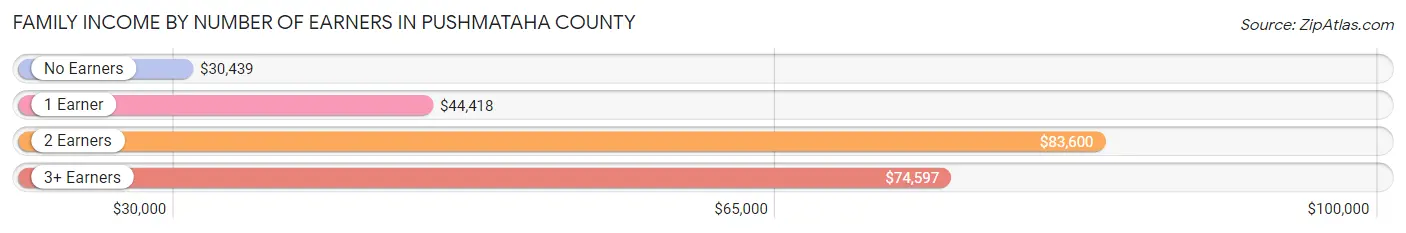
| Number of Earners | # Families | Median Income |
| No Earners | 895 (32.1%) | $30,439 |
| 1 Earner | 915 (32.8%) | $44,418 |
| 2 Earners | 850 (30.5%) | $83,600 |
| 3+ Earners | 126 (4.5%) | $74,597 |
| Total | 2,786 (100.0%) | $53,688 |
Household Income in Pushmataha County
Household Income Brackets in Pushmataha County
With 854 households falling in the category, the $50,000 to $74,999 income range is the most frequent in Pushmataha County, accounting for 20.2% of all households. In contrast, only 89 households (2.1%) fall into the $150,000 to $199,999 income bracket, making it the least populous group.
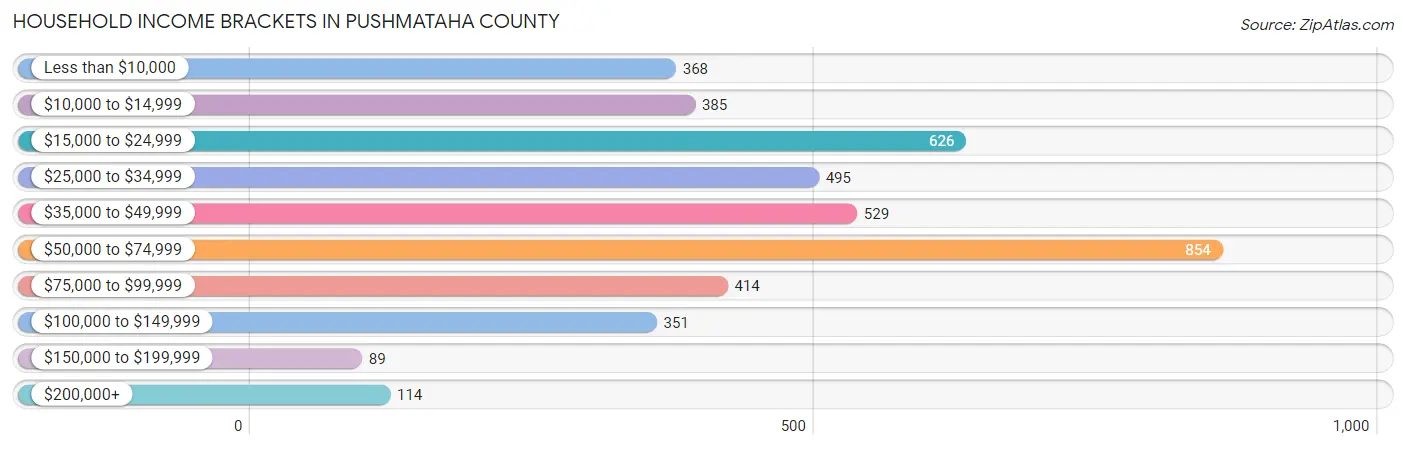
| Income Bracket | # Households | % Households |
| Less than $10,000 | 368 | 8.7% |
| $10,000 to $14,999 | 385 | 9.1% |
| $15,000 to $24,999 | 626 | 14.8% |
| $25,000 to $34,999 | 495 | 11.7% |
| $35,000 to $49,999 | 529 | 12.5% |
| $50,000 to $74,999 | 854 | 20.2% |
| $75,000 to $99,999 | 414 | 9.8% |
| $100,000 to $149,999 | 351 | 8.3% |
| $150,000 to $199,999 | 89 | 2.1% |
| $200,000+ | 114 | 2.7% |
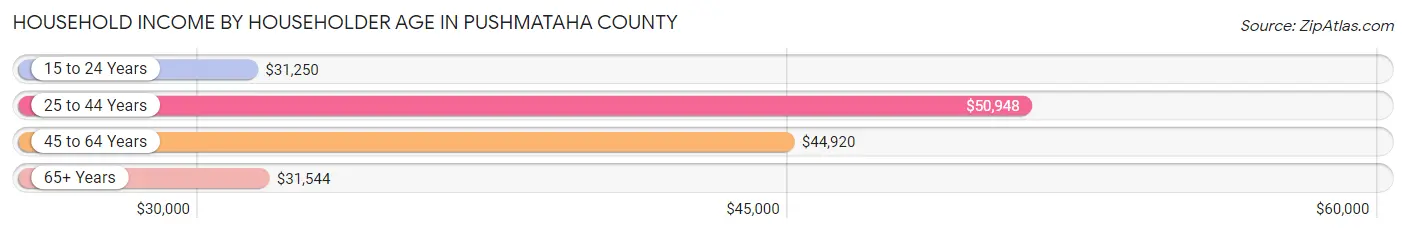
Household Income by Householder Age in Pushmataha County
The median household income in Pushmataha County is $42,274, with the highest median household income of $50,948 found in the 25 to 44 years age bracket for the primary householder. A total of 1,040 households (24.6%) fall into this category. Meanwhile, the 15 to 24 years age bracket for the primary householder has the lowest median household income of $31,250, with 105 households (2.5%) in this group.
| Income Bracket | # Households | Median Income |
| 15 to 24 Years | 105 (2.5%) | $31,250 |
| 25 to 44 Years | 1,040 (24.6%) | $50,948 |
| 45 to 64 Years | 1,581 (37.4%) | $44,920 |
| 65+ Years | 1,503 (35.5%) | $31,544 |
| Total | 4,229 (100.0%) | $42,274 |
Poverty in Pushmataha County
Income Below Poverty by Sex and Age in Pushmataha County
With 22.6% poverty level for males and 20.8% for females among the residents of Pushmataha County, 18 to 24 year old males and 16 and 17 year old females are the most vulnerable to poverty, with 154 males (38.1%) and 45 females (34.6%) in their respective age groups living below the poverty level.
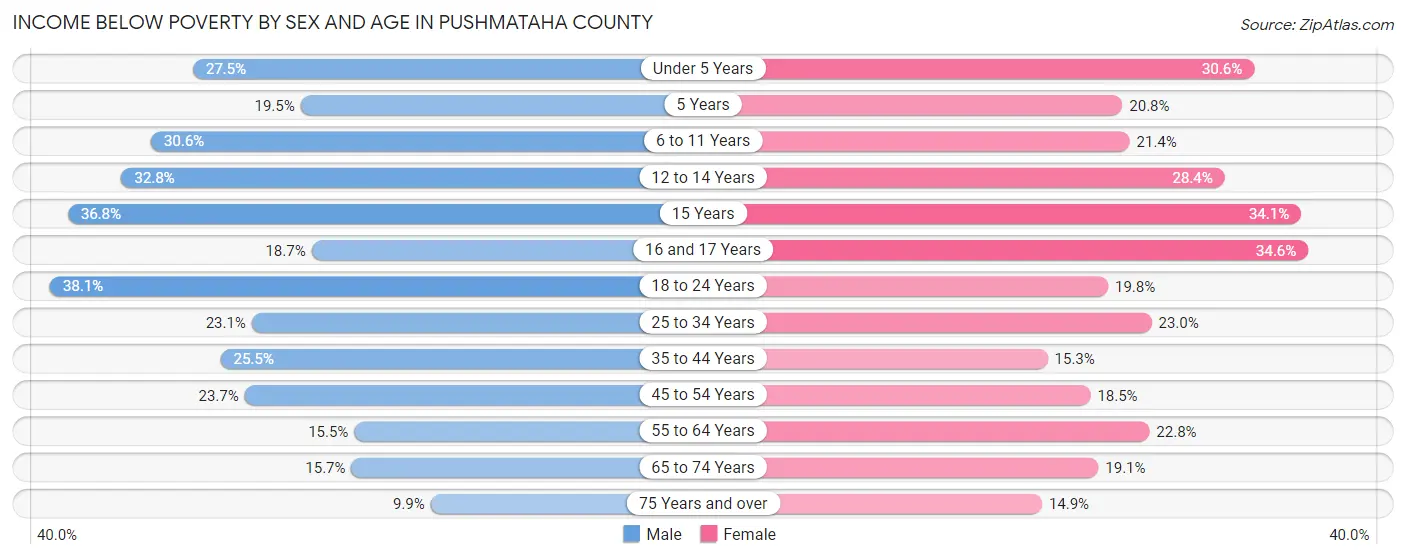
| Age Bracket | Male | Female |
| Under 5 Years | 74 (27.5%) | 90 (30.6%) |
| 5 Years | 8 (19.5%) | 20 (20.8%) |
| 6 to 11 Years | 124 (30.6%) | 78 (21.4%) |
| 12 to 14 Years | 63 (32.8%) | 54 (28.4%) |
| 15 Years | 39 (36.8%) | 15 (34.1%) |
| 16 and 17 Years | 23 (18.7%) | 45 (34.6%) |
| 18 to 24 Years | 154 (38.1%) | 70 (19.8%) |
| 25 to 34 Years | 131 (23.1%) | 135 (23.0%) |
| 35 to 44 Years | 156 (25.5%) | 90 (15.3%) |
| 45 to 54 Years | 138 (23.7%) | 122 (18.5%) |
| 55 to 64 Years | 125 (15.5%) | 193 (22.8%) |
| 65 to 74 Years | 99 (15.7%) | 137 (19.1%) |
| 75 Years and over | 49 (9.9%) | 82 (14.9%) |
| Total | 1,183 (22.6%) | 1,131 (20.8%) |
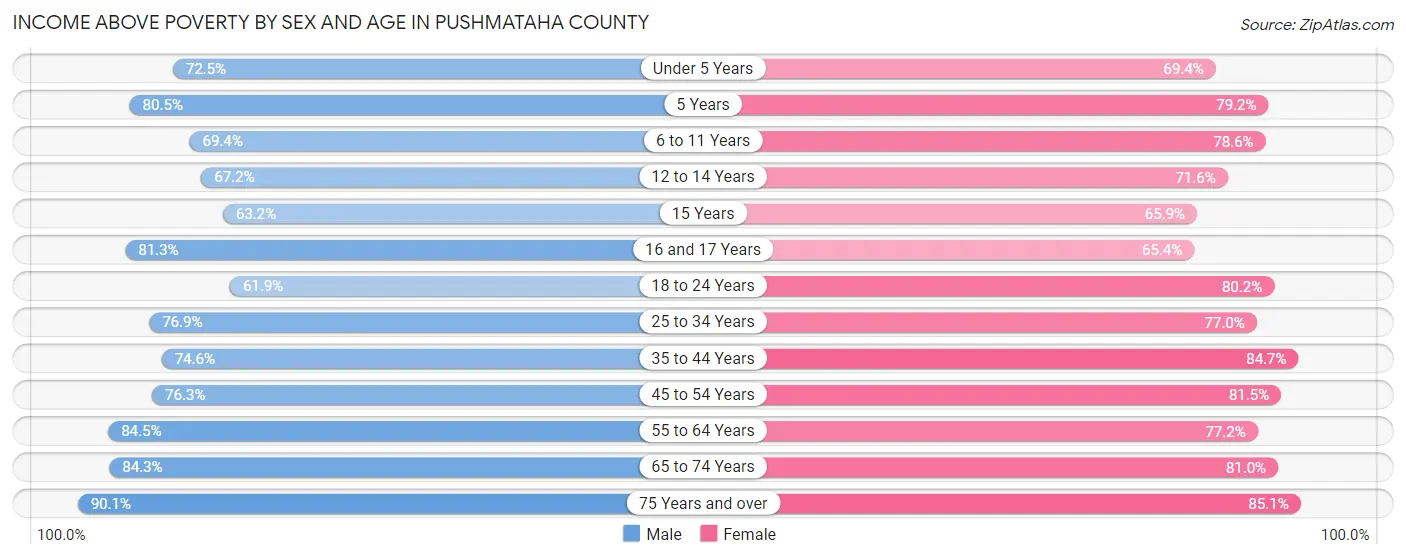
Income Above Poverty by Sex and Age in Pushmataha County
According to the poverty statistics in Pushmataha County, males aged 75 years and over and females aged 75 years and over are the age groups that are most secure financially, with 90.1% of males and 85.1% of females in these age groups living above the poverty line.
| Age Bracket | Male | Female |
| Under 5 Years | 195 (72.5%) | 204 (69.4%) |
| 5 Years | 33 (80.5%) | 76 (79.2%) |
| 6 to 11 Years | 281 (69.4%) | 287 (78.6%) |
| 12 to 14 Years | 129 (67.2%) | 136 (71.6%) |
| 15 Years | 67 (63.2%) | 29 (65.9%) |
| 16 and 17 Years | 100 (81.3%) | 85 (65.4%) |
| 18 to 24 Years | 250 (61.9%) | 284 (80.2%) |
| 25 to 34 Years | 435 (76.9%) | 452 (77.0%) |
| 35 to 44 Years | 457 (74.6%) | 499 (84.7%) |
| 45 to 54 Years | 445 (76.3%) | 539 (81.5%) |
| 55 to 64 Years | 680 (84.5%) | 652 (77.2%) |
| 65 to 74 Years | 530 (84.3%) | 582 (80.9%) |
| 75 Years and over | 448 (90.1%) | 470 (85.1%) |
| Total | 4,050 (77.4%) | 4,295 (79.2%) |
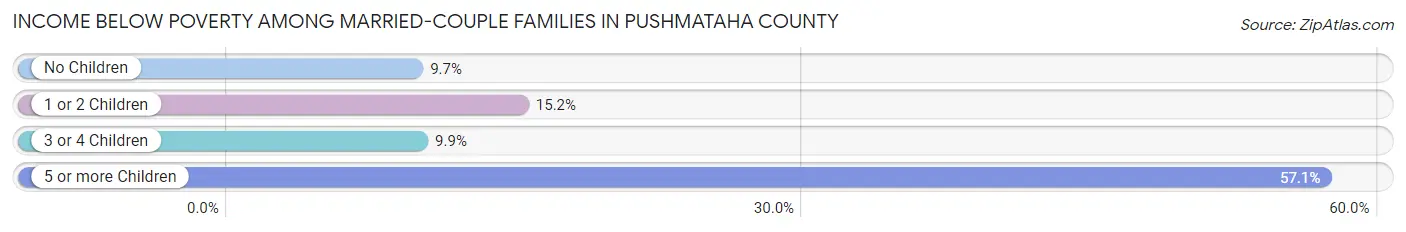
Income Below Poverty Among Married-Couple Families in Pushmataha County
The poverty statistics for married-couple families in Pushmataha County show that 11.9% or 250 of the total 2,102 families live below the poverty line. Families with 5 or more children have the highest poverty rate of 57.1%, comprising of 20 families. On the other hand, families with no children have the lowest poverty rate of 9.7%, which includes 133 families.
| Children | Above Poverty | Below Poverty |
| No Children | 1,243 (90.3%) | 133 (9.7%) |
| 1 or 2 Children | 458 (84.8%) | 82 (15.2%) |
| 3 or 4 Children | 136 (90.1%) | 15 (9.9%) |
| 5 or more Children | 15 (42.9%) | 20 (57.1%) |
| Total | 1,852 (88.1%) | 250 (11.9%) |
Income Below Poverty Among Single-Parent Households in Pushmataha County
According to the poverty data in Pushmataha County, 16.2% or 31 single-father households and 41.2% or 203 single-mother households are living below the poverty line. Among single-father households, those with 1 or 2 children have the highest poverty rate, with 24 households (24.7%) experiencing poverty. Likewise, among single-mother households, those with 1 or 2 children have the highest poverty rate, with 153 households (53.7%) falling below the poverty line.
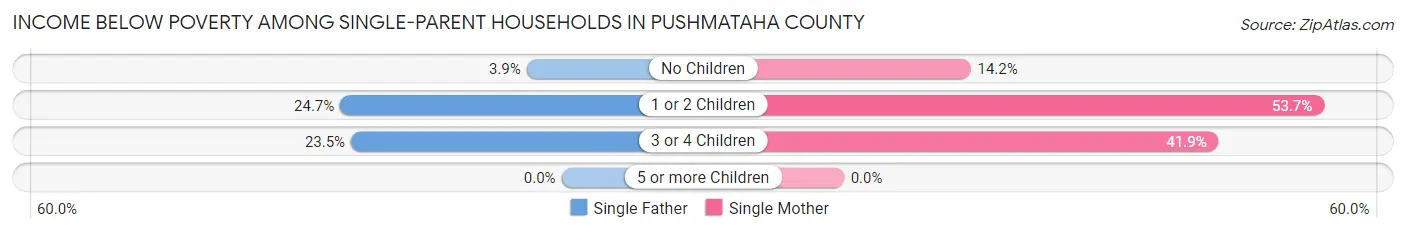
| Children | Single Father | Single Mother |
| No Children | 3 (3.9%) | 19 (14.2%) |
| 1 or 2 Children | 24 (24.7%) | 153 (53.7%) |
| 3 or 4 Children | 4 (23.5%) | 31 (41.9%) |
| 5 or more Children | 0 (0.0%) | 0 (0.0%) |
| Total | 31 (16.2%) | 203 (41.2%) |
Income Below Poverty Among Married-Couple vs Single-Parent Households in Pushmataha County
The poverty data for Pushmataha County shows that 250 of the married-couple family households (11.9%) and 234 of the single-parent households (34.2%) are living below the poverty level. Within the married-couple family households, those with 5 or more children have the highest poverty rate, with 20 households (57.1%) falling below the poverty line. Among the single-parent households, those with 1 or 2 children have the highest poverty rate, with 177 household (46.3%) living below poverty.
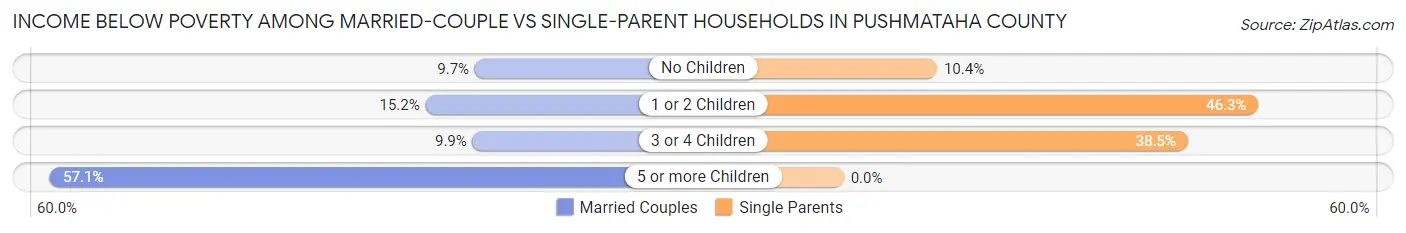
| Children | Married-Couple Families | Single-Parent Households |
| No Children | 133 (9.7%) | 22 (10.4%) |
| 1 or 2 Children | 82 (15.2%) | 177 (46.3%) |
| 3 or 4 Children | 15 (9.9%) | 35 (38.5%) |
| 5 or more Children | 20 (57.1%) | 0 (0.0%) |
| Total | 250 (11.9%) | 234 (34.2%) |
Race in Pushmataha County
The most populous races in Pushmataha County are White / Caucasian (7,636 | 70.4%), Native / Alaskan (1,680 | 15.5%), and Two or more Races (1,289 | 11.9%).
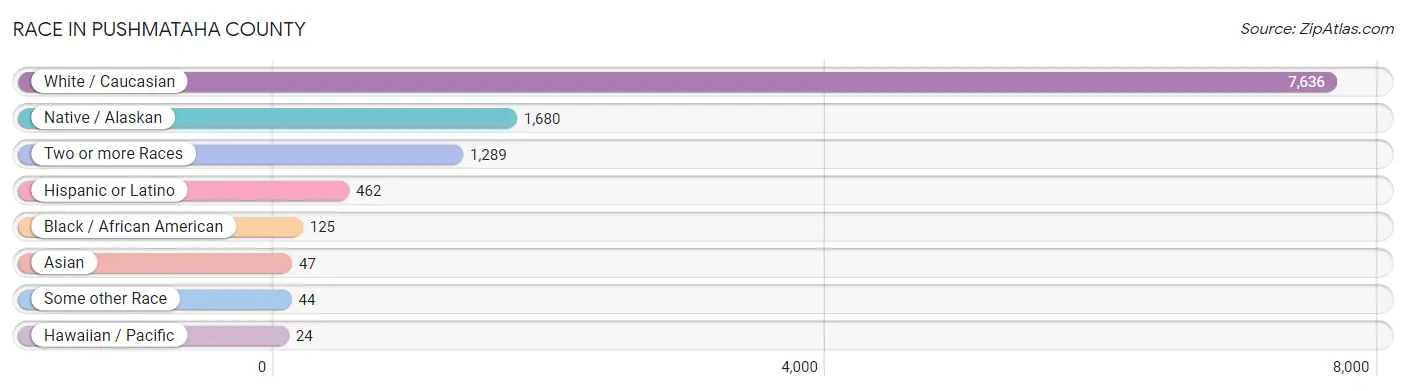
| Race | # Population | % Population |
| Asian | 47 | 0.4% |
| Black / African American | 125 | 1.1% |
| Hawaiian / Pacific | 24 | 0.2% |
| Hispanic or Latino | 462 | 4.3% |
| Native / Alaskan | 1,680 | 15.5% |
| White / Caucasian | 7,636 | 70.4% |
| Two or more Races | 1,289 | 11.9% |
| Some other Race | 44 | 0.4% |
| Total | 10,845 | 100.0% |
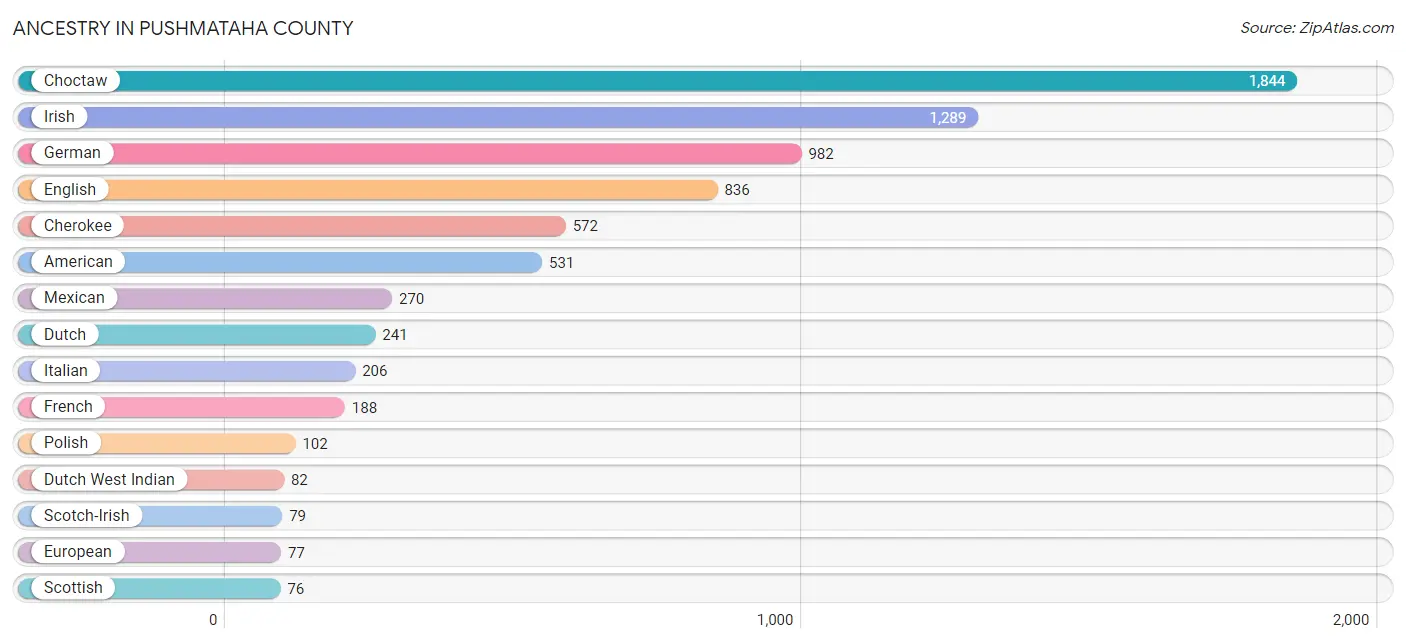
Ancestry in Pushmataha County
The most populous ancestries reported in Pushmataha County are Choctaw (1,844 | 17.0%), Irish (1,289 | 11.9%), German (982 | 9.0%), English (836 | 7.7%), and Cherokee (572 | 5.3%), together accounting for 50.9% of all Pushmataha County residents.
| Ancestry | # Population | % Population |
| Afghan | 6 | 0.1% |
| African | 6 | 0.1% |
| American | 531 | 4.9% |
| Apache | 11 | 0.1% |
| Arab | 12 | 0.1% |
| Austrian | 12 | 0.1% |
| Bhutanese | 2 | 0.0% |
| Blackfeet | 1 | 0.0% |
| British | 57 | 0.5% |
| Cajun | 25 | 0.2% |
| Cherokee | 572 | 5.3% |
| Cheyenne | 4 | 0.0% |
| Chickasaw | 73 | 0.7% |
| Choctaw | 1,844 | 17.0% |
| Comanche | 5 | 0.1% |
| Creek | 54 | 0.5% |
| Danish | 15 | 0.1% |
| Dominican | 17 | 0.2% |
| Dutch | 241 | 2.2% |
| Dutch West Indian | 82 | 0.8% |
| Eastern European | 2 | 0.0% |
| Ecuadorian | 10 | 0.1% |
| English | 836 | 7.7% |
| European | 77 | 0.7% |
| Fijian | 8 | 0.1% |
| Finnish | 3 | 0.0% |
| French | 188 | 1.7% |
| French Canadian | 10 | 0.1% |
| German | 982 | 9.0% |
| Greek | 9 | 0.1% |
| Hungarian | 1 | 0.0% |
| Indian (Asian) | 8 | 0.1% |
| Irish | 1,289 | 11.9% |
| Italian | 206 | 1.9% |
| Jamaican | 18 | 0.2% |
| Korean | 30 | 0.3% |
| Lithuanian | 10 | 0.1% |
| Mexican | 270 | 2.5% |
| Native Hawaiian | 8 | 0.1% |
| Northern European | 18 | 0.2% |
| Norwegian | 34 | 0.3% |
| Pakistani | 1 | 0.0% |
| Pima | 48 | 0.4% |
| Polish | 102 | 0.9% |
| Portuguese | 3 | 0.0% |
| Potawatomi | 17 | 0.2% |
| Pueblo | 48 | 0.4% |
| Puerto Rican | 33 | 0.3% |
| Russian | 28 | 0.3% |
| Scandinavian | 41 | 0.4% |
| Scotch-Irish | 79 | 0.7% |
| Scottish | 76 | 0.7% |
| Seminole | 22 | 0.2% |
| Sioux | 8 | 0.1% |
| South American | 10 | 0.1% |
| Spaniard | 28 | 0.3% |
| Spanish | 43 | 0.4% |
| Sri Lankan | 32 | 0.3% |
| Subsaharan African | 6 | 0.1% |
| Swedish | 38 | 0.4% |
| Swiss | 3 | 0.0% |
| Thai | 26 | 0.2% |
| Tohono O'Odham | 2 | 0.0% |
| Welsh | 6 | 0.1% | View All 64 Rows |
Immigrants in Pushmataha County
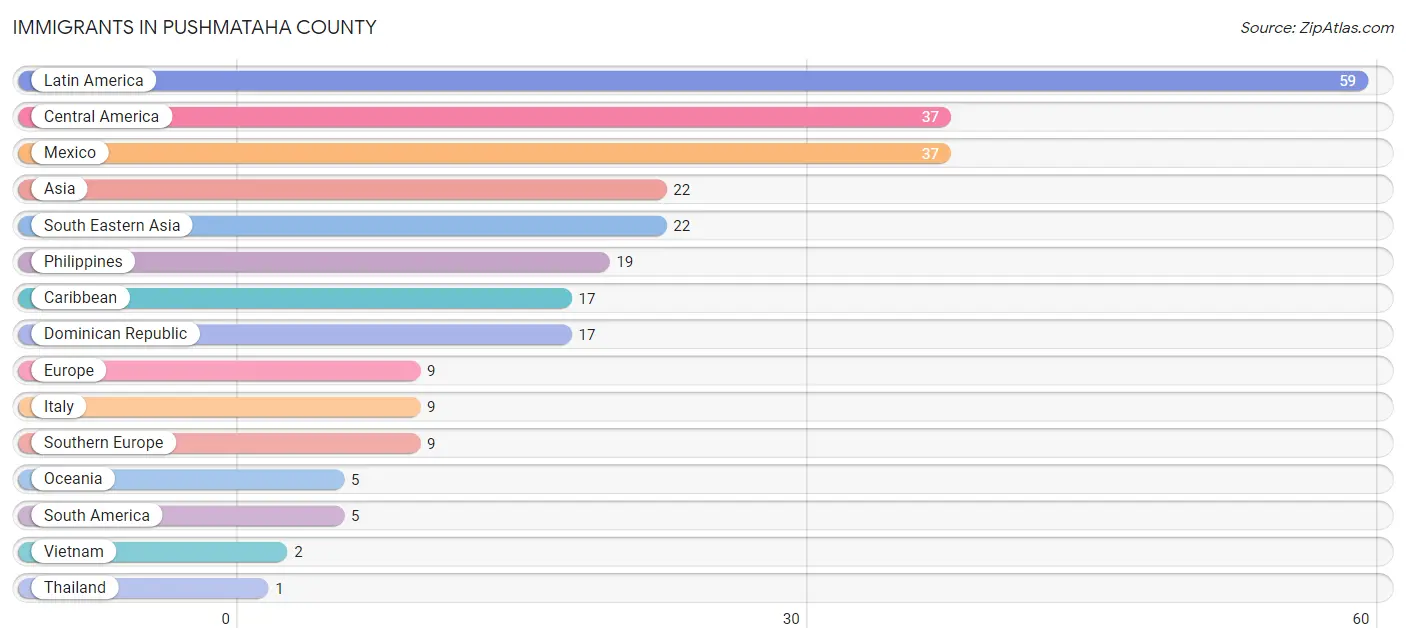
The most numerous immigrant groups reported in Pushmataha County came from Latin America (59 | 0.5%), Central America (37 | 0.3%), Mexico (37 | 0.3%), Asia (22 | 0.2%), and South Eastern Asia (22 | 0.2%), together accounting for 1.6% of all Pushmataha County residents.
| Immigration Origin | # Population | % Population |
| Asia | 22 | 0.2% |
| Caribbean | 17 | 0.2% |
| Central America | 37 | 0.3% |
| Dominican Republic | 17 | 0.2% |
| Europe | 9 | 0.1% |
| Italy | 9 | 0.1% |
| Latin America | 59 | 0.5% |
| Mexico | 37 | 0.3% |
| Oceania | 5 | 0.1% |
| Philippines | 19 | 0.2% |
| South America | 5 | 0.1% |
| South Eastern Asia | 22 | 0.2% |
| Southern Europe | 9 | 0.1% |
| Thailand | 1 | 0.0% |
| Vietnam | 2 | 0.0% | View All 15 Rows |
Sex and Age in Pushmataha County
Sex and Age in Pushmataha County
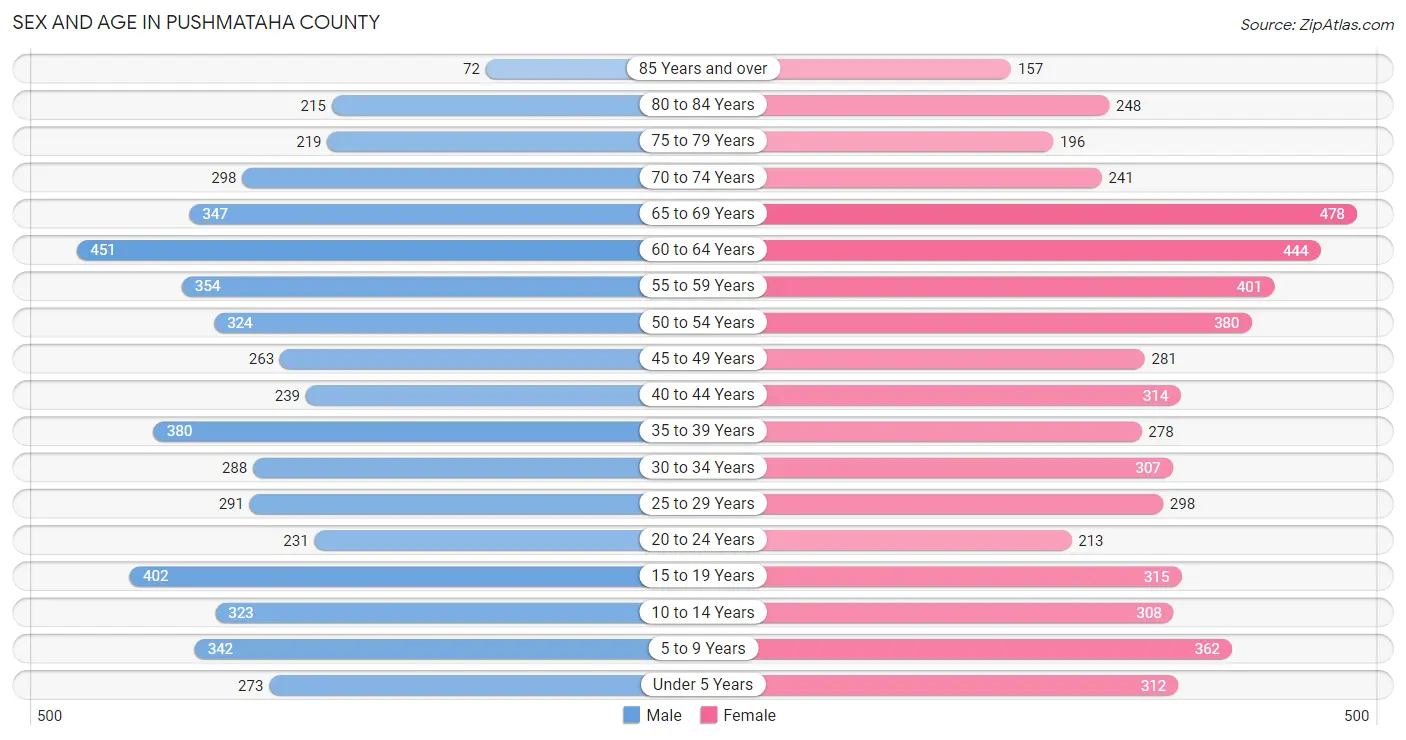
The most populous age groups in Pushmataha County are 60 to 64 Years (451 | 8.5%) for men and 65 to 69 Years (478 | 8.6%) for women.
| Age Bracket | Male | Female |
| Under 5 Years | 273 (5.1%) | 312 (5.6%) |
| 5 to 9 Years | 342 (6.4%) | 362 (6.5%) |
| 10 to 14 Years | 323 (6.1%) | 308 (5.6%) |
| 15 to 19 Years | 402 (7.6%) | 315 (5.7%) |
| 20 to 24 Years | 231 (4.3%) | 213 (3.8%) |
| 25 to 29 Years | 291 (5.5%) | 298 (5.4%) |
| 30 to 34 Years | 288 (5.4%) | 307 (5.6%) |
| 35 to 39 Years | 380 (7.1%) | 278 (5.0%) |
| 40 to 44 Years | 239 (4.5%) | 314 (5.7%) |
| 45 to 49 Years | 263 (5.0%) | 281 (5.1%) |
| 50 to 54 Years | 324 (6.1%) | 380 (6.9%) |
| 55 to 59 Years | 354 (6.7%) | 401 (7.2%) |
| 60 to 64 Years | 451 (8.5%) | 444 (8.0%) |
| 65 to 69 Years | 347 (6.5%) | 478 (8.6%) |
| 70 to 74 Years | 298 (5.6%) | 241 (4.4%) |
| 75 to 79 Years | 219 (4.1%) | 196 (3.5%) |
| 80 to 84 Years | 215 (4.1%) | 248 (4.5%) |
| 85 Years and over | 72 (1.4%) | 157 (2.8%) |
| Total | 5,312 (100.0%) | 5,533 (100.0%) |
Families and Households in Pushmataha County
Median Family Size in Pushmataha County
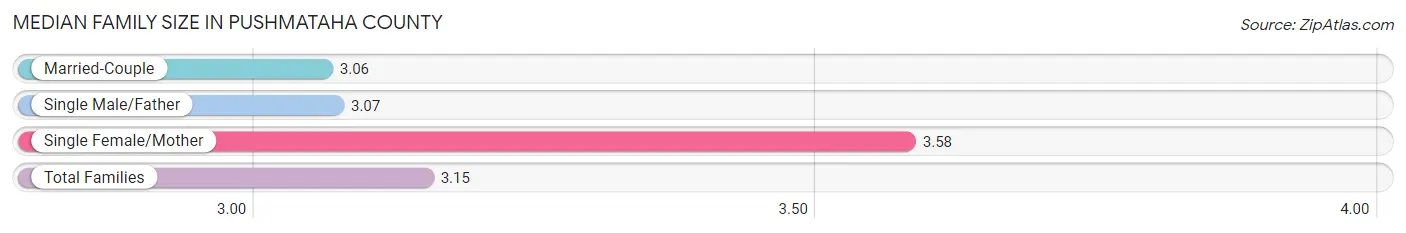
The median family size in Pushmataha County is 3.15 persons per family, with single female/mother families (493 | 17.7%) accounting for the largest median family size of 3.58 persons per family. On the other hand, married-couple families (2,102 | 75.4%) represent the smallest median family size with 3.06 persons per family.
| Family Type | # Families | Family Size |
| Married-Couple | 2,102 (75.4%) | 3.06 |
| Single Male/Father | 191 (6.9%) | 3.07 |
| Single Female/Mother | 493 (17.7%) | 3.58 |
| Total Families | 2,786 (100.0%) | 3.15 |
Median Household Size in Pushmataha County
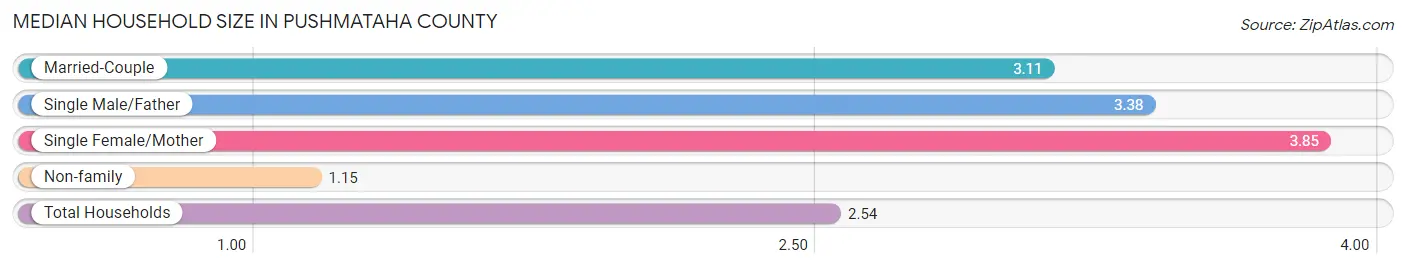
The median household size in Pushmataha County is 2.54 persons per household, with single female/mother households (493 | 11.7%) accounting for the largest median household size of 3.85 persons per household. non-family households (1,443 | 34.1%) represent the smallest median household size with 1.15 persons per household.
| Household Type | # Households | Household Size |
| Married-Couple | 2,102 (49.7%) | 3.11 |
| Single Male/Father | 191 (4.5%) | 3.38 |
| Single Female/Mother | 493 (11.7%) | 3.85 |
| Non-family | 1,443 (34.1%) | 1.15 |
| Total Households | 4,229 (100.0%) | 2.54 |
Household Size by Marriage Status in Pushmataha County
Out of a total of 4,229 households in Pushmataha County, 2,786 (65.9%) are family households, while 1,443 (34.1%) are nonfamily households. The most numerous type of family households are 2-person households, comprising 1,480, and the most common type of nonfamily households are 1-person households, comprising 1,279.
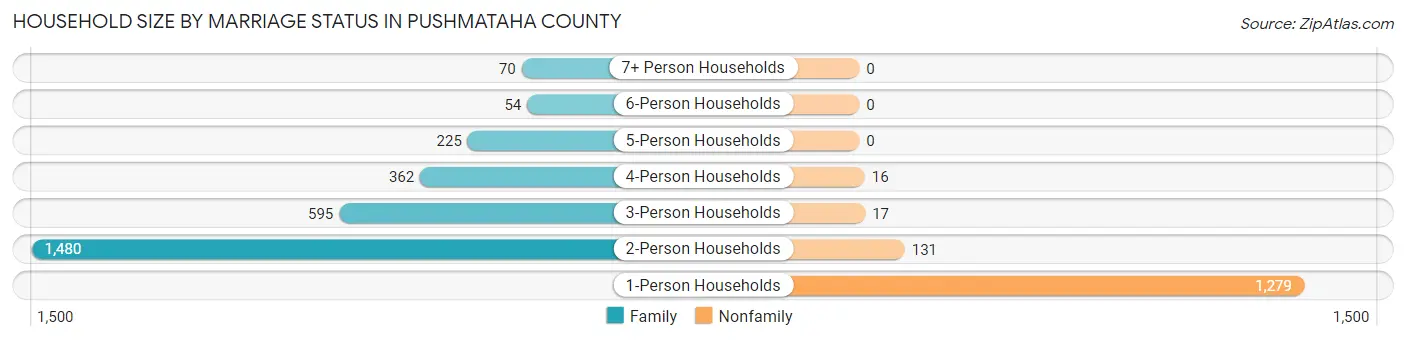
| Household Size | Family Households | Nonfamily Households |
| 1-Person Households | - | 1,279 (30.2%) |
| 2-Person Households | 1,480 (35.0%) | 131 (3.1%) |
| 3-Person Households | 595 (14.1%) | 17 (0.4%) |
| 4-Person Households | 362 (8.6%) | 16 (0.4%) |
| 5-Person Households | 225 (5.3%) | 0 (0.0%) |
| 6-Person Households | 54 (1.3%) | 0 (0.0%) |
| 7+ Person Households | 70 (1.7%) | 0 (0.0%) |
| Total | 2,786 (65.9%) | 1,443 (34.1%) |
Female Fertility in Pushmataha County
Fertility by Age in Pushmataha County
Average fertility rate in Pushmataha County is 61.0 births per 1,000 women. Women in the age bracket of 20 to 34 years have the highest fertility rate with 116.0 births per 1,000 women. Women in the age bracket of 20 to 34 years acount for 74.8% of all women with births.
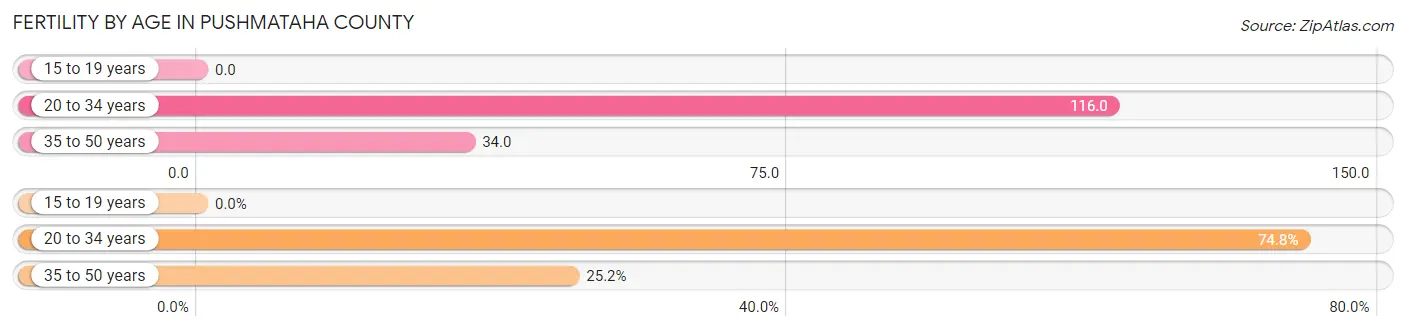
| Age Bracket | Women with Births | Births / 1,000 Women |
| 15 to 19 years | 0 (0.0%) | 0.0 |
| 20 to 34 years | 95 (74.8%) | 116.0 |
| 35 to 50 years | 32 (25.2%) | 34.0 |
| Total | 127 (100.0%) | 61.0 |
Fertility by Age by Marriage Status in Pushmataha County
51.2% of women with births (127) in Pushmataha County are married. The highest percentage of unmarried women with births falls into 20 to 34 years age bracket with 65.3% of them unmarried at the time of birth, while the lowest percentage of unmarried women with births belong to 35 to 50 years age bracket with 0.0% of them unmarried.
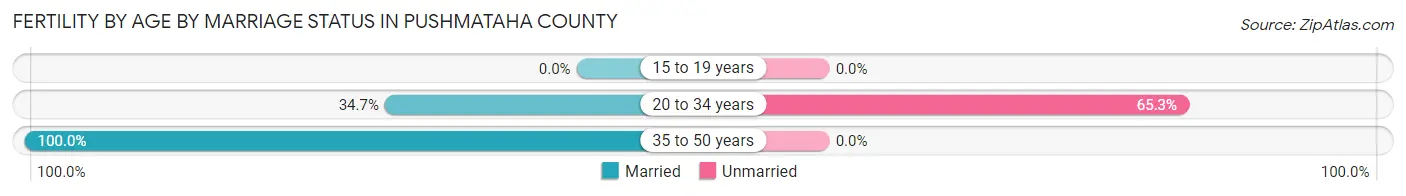
| Age Bracket | Married | Unmarried |
| 15 to 19 years | 0 (0.0%) | 0 (0.0%) |
| 20 to 34 years | 33 (34.7%) | 62 (65.3%) |
| 35 to 50 years | 32 (100.0%) | 0 (0.0%) |
| Total | 65 (51.2%) | 62 (48.8%) |
Fertility by Education in Pushmataha County
Average fertility rate in Pushmataha County is 61.0 births per 1,000 women. Women with the education attainment of bachelor's degree have the highest fertility rate of 112.0 births per 1,000 women, while women with the education attainment of college or associate's degree have the lowest fertility at 25.0 births per 1,000 women. Women with the education attainment of high school diploma represent 48.8% of all women with births.
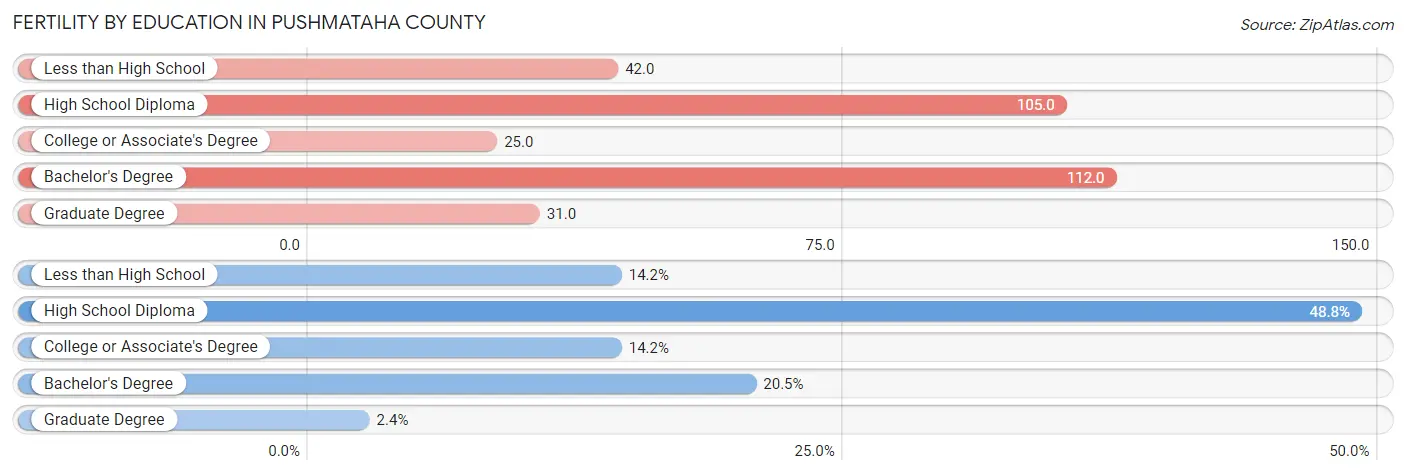
| Educational Attainment | Women with Births | Births / 1,000 Women |
| Less than High School | 18 (14.2%) | 42.0 |
| High School Diploma | 62 (48.8%) | 105.0 |
| College or Associate's Degree | 18 (14.2%) | 25.0 |
| Bachelor's Degree | 26 (20.5%) | 112.0 |
| Graduate Degree | 3 (2.4%) | 31.0 |
| Total | 127 (100.0%) | 61.0 |
Fertility by Education by Marriage Status in Pushmataha County
48.8% of women with births in Pushmataha County are unmarried. Women with the educational attainment of college or associate's degree are most likely to be married with 100.0% of them married at childbirth, while women with the educational attainment of high school diploma are least likely to be married with 71.0% of them unmarried at childbirth.
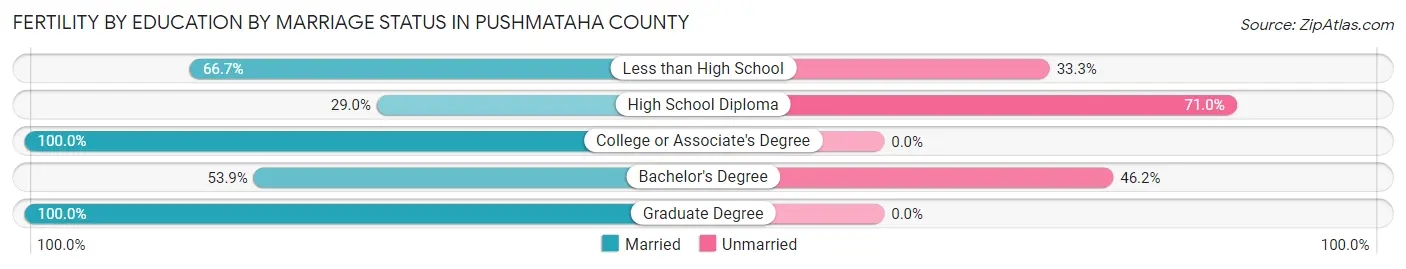
| Educational Attainment | Married | Unmarried |
| Less than High School | 12 (66.7%) | 6 (33.3%) |
| High School Diploma | 18 (29.0%) | 44 (71.0%) |
| College or Associate's Degree | 18 (100.0%) | 0 (0.0%) |
| Bachelor's Degree | 14 (53.8%) | 12 (46.2%) |
| Graduate Degree | 3 (100.0%) | 0 (0.0%) |
| Total | 65 (51.2%) | 62 (48.8%) |
Employment Characteristics in Pushmataha County
Employment by Class of Employer in Pushmataha County
Among the 3,588 employed individuals in Pushmataha County, private company employees (1,884 | 52.5%), state government employees (447 | 12.5%), and self-employed (not incorporated) (409 | 11.4%) make up the most common classes of employment.
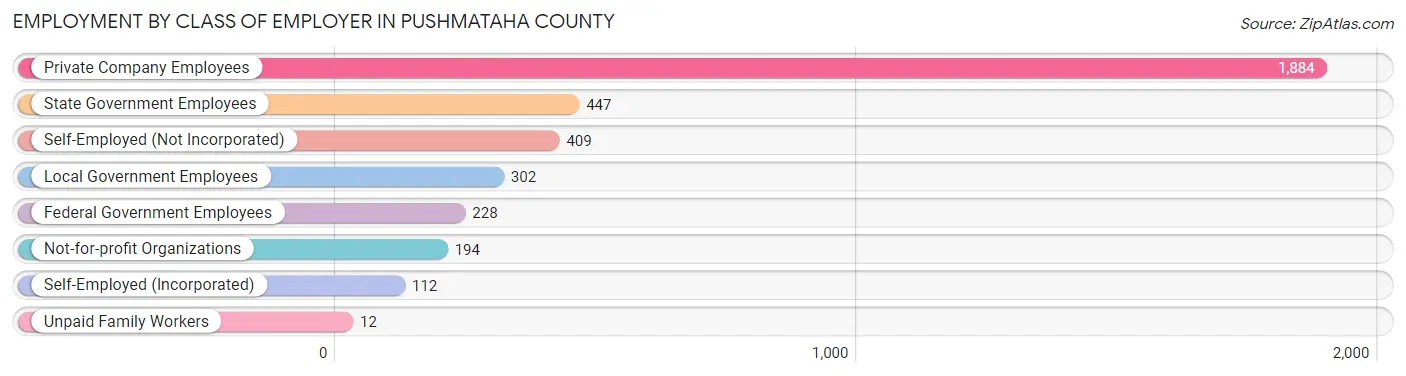
| Employer Class | # Employees | % Employees |
| Private Company Employees | 1,884 | 52.5% |
| Self-Employed (Incorporated) | 112 | 3.1% |
| Self-Employed (Not Incorporated) | 409 | 11.4% |
| Not-for-profit Organizations | 194 | 5.4% |
| Local Government Employees | 302 | 8.4% |
| State Government Employees | 447 | 12.5% |
| Federal Government Employees | 228 | 6.4% |
| Unpaid Family Workers | 12 | 0.3% |
| Total | 3,588 | 100.0% |
Employment Status by Age in Pushmataha County
According to the labor force statistics for Pushmataha County, out of the total population over 16 years of age (8,775), 45.8% or 4,019 individuals are in the labor force, with 9.0% or 362 of them unemployed. The age group with the highest labor force participation rate is 35 to 44 years, with 73.3% or 888 individuals in the labor force. Within the labor force, the 16 to 19 years age range has the highest percentage of unemployed individuals, with 44.6% or 107 of them being unemployed.
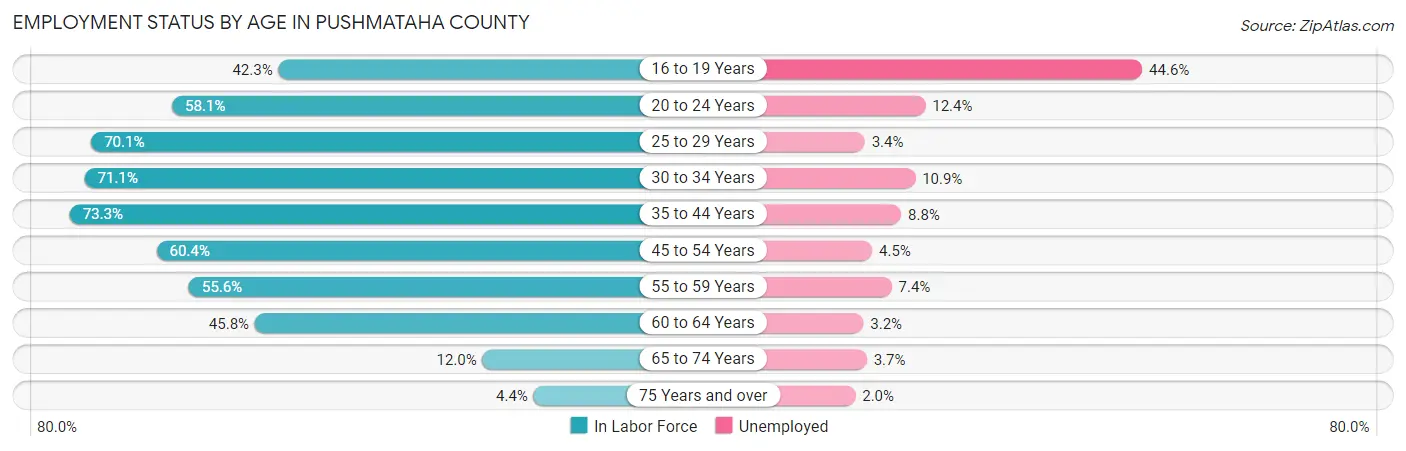
| Age Bracket | In Labor Force | Unemployed |
| 16 to 19 Years | 240 (42.3%) | 107 (44.6%) |
| 20 to 24 Years | 258 (58.1%) | 32 (12.4%) |
| 25 to 29 Years | 413 (70.1%) | 14 (3.4%) |
| 30 to 34 Years | 423 (71.1%) | 46 (10.9%) |
| 35 to 44 Years | 888 (73.3%) | 78 (8.8%) |
| 45 to 54 Years | 754 (60.4%) | 34 (4.5%) |
| 55 to 59 Years | 420 (55.6%) | 31 (7.4%) |
| 60 to 64 Years | 410 (45.8%) | 13 (3.2%) |
| 65 to 74 Years | 164 (12.0%) | 6 (3.7%) |
| 75 Years and over | 49 (4.4%) | 1 (2.0%) |
| Total | 4,019 (45.8%) | 362 (9.0%) |
Employment Status by Educational Attainment in Pushmataha County
According to labor force statistics for Pushmataha County, 62.5% of individuals (3,308) out of the total population between 25 and 64 years of age (5,293) are in the labor force, with 6.5% or 215 of them being unemployed. The group with the highest labor force participation rate are those with the educational attainment of bachelor's degree or higher, with 87.6% or 612 individuals in the labor force. Within the labor force, individuals with less than high school education have the highest percentage of unemployment, with 13.5% or 53 of them being unemployed.
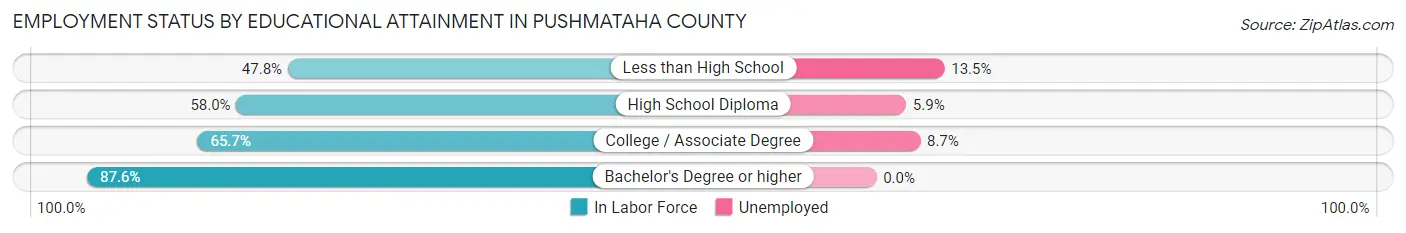
| Educational Attainment | In Labor Force | Unemployed |
| Less than High School | 394 (47.8%) | 111 (13.5%) |
| High School Diploma | 1,320 (58.0%) | 134 (5.9%) |
| College / Associate Degree | 981 (65.7%) | 130 (8.7%) |
| Bachelor's Degree or higher | 612 (87.6%) | 0 (0.0%) |
| Total | 3,308 (62.5%) | 344 (6.5%) |
Employment Occupations by Sex in Pushmataha County
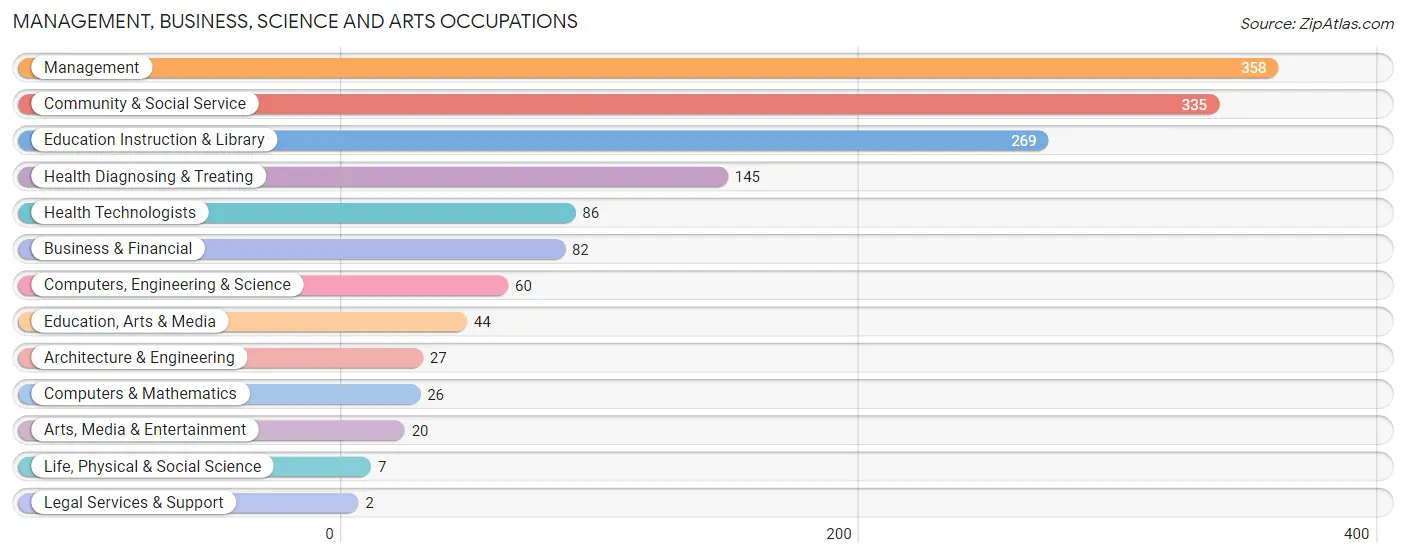
Management, Business, Science and Arts Occupations
The most common Management, Business, Science and Arts occupations in Pushmataha County are Management (358 | 9.8%), Community & Social Service (335 | 9.2%), Education Instruction & Library (269 | 7.4%), Health Diagnosing & Treating (145 | 4.0%), and Health Technologists (86 | 2.4%).
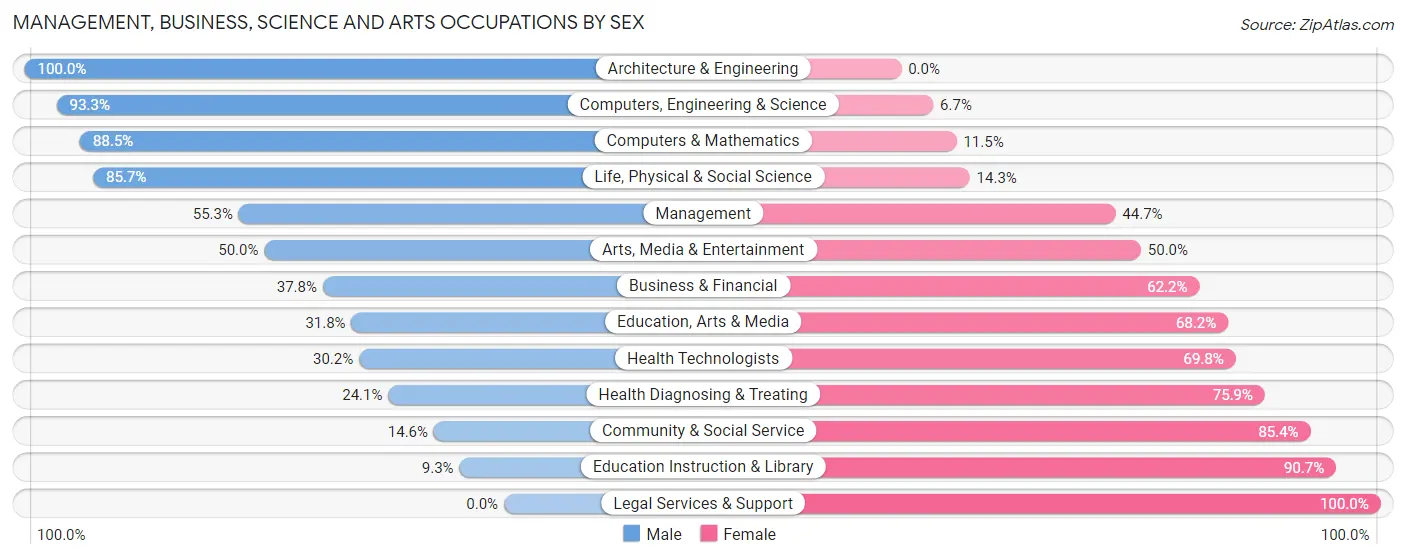
Management, Business, Science and Arts Occupations by Sex
Within the Management, Business, Science and Arts occupations in Pushmataha County, the most male-oriented occupations are Architecture & Engineering (100.0%), Computers, Engineering & Science (93.3%), and Computers & Mathematics (88.5%), while the most female-oriented occupations are Legal Services & Support (100.0%), Education Instruction & Library (90.7%), and Community & Social Service (85.4%).
| Occupation | Male | Female |
| Management | 198 (55.3%) | 160 (44.7%) |
| Business & Financial | 31 (37.8%) | 51 (62.2%) |
| Computers, Engineering & Science | 56 (93.3%) | 4 (6.7%) |
| Computers & Mathematics | 23 (88.5%) | 3 (11.5%) |
| Architecture & Engineering | 27 (100.0%) | 0 (0.0%) |
| Life, Physical & Social Science | 6 (85.7%) | 1 (14.3%) |
| Community & Social Service | 49 (14.6%) | 286 (85.4%) |
| Education, Arts & Media | 14 (31.8%) | 30 (68.2%) |
| Legal Services & Support | 0 (0.0%) | 2 (100.0%) |
| Education Instruction & Library | 25 (9.3%) | 244 (90.7%) |
| Arts, Media & Entertainment | 10 (50.0%) | 10 (50.0%) |
| Health Diagnosing & Treating | 35 (24.1%) | 110 (75.9%) |
| Health Technologists | 26 (30.2%) | 60 (69.8%) |
| Total (Category) | 369 (37.7%) | 611 (62.4%) |
| Total (Overall) | 1,905 (52.1%) | 1,750 (47.9%) |
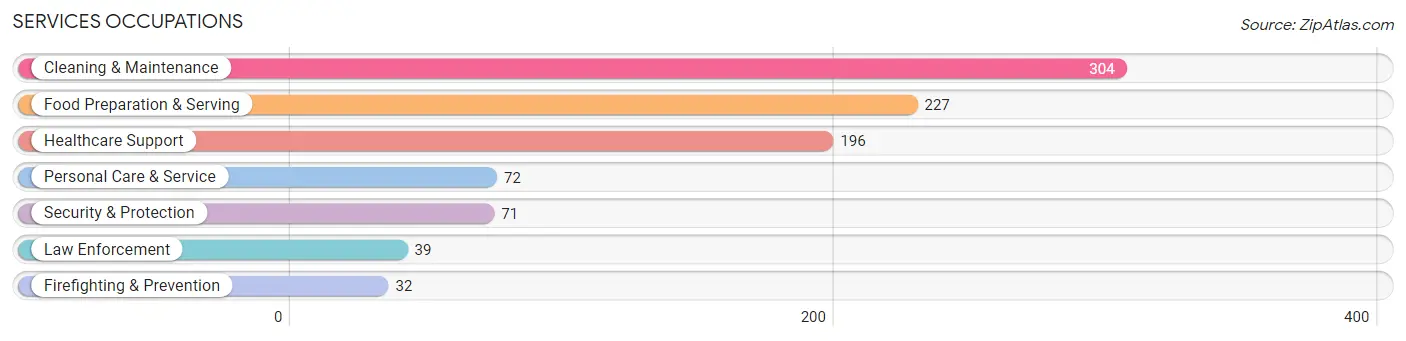
Services Occupations
The most common Services occupations in Pushmataha County are Cleaning & Maintenance (304 | 8.3%), Food Preparation & Serving (227 | 6.2%), Healthcare Support (196 | 5.4%), Personal Care & Service (72 | 2.0%), and Security & Protection (71 | 1.9%).
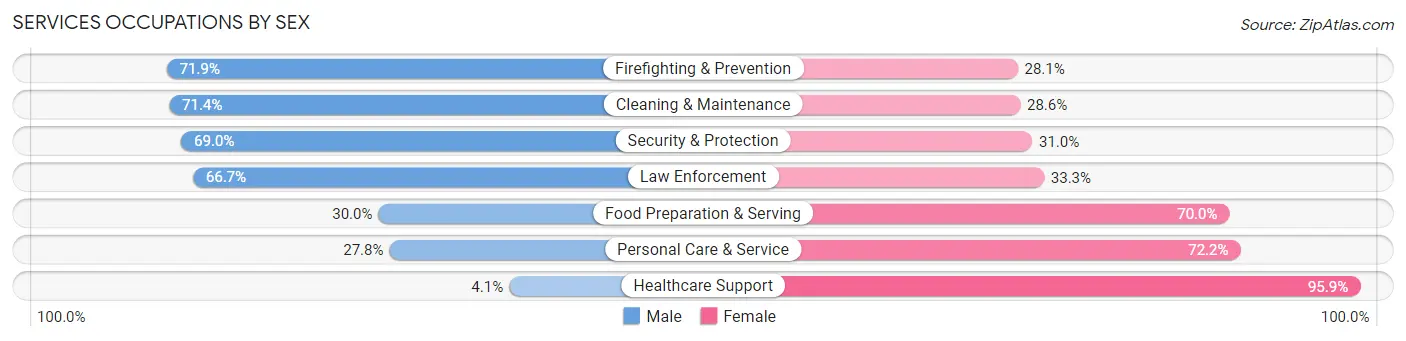
Services Occupations by Sex
Within the Services occupations in Pushmataha County, the most male-oriented occupations are Firefighting & Prevention (71.9%), Cleaning & Maintenance (71.4%), and Security & Protection (69.0%), while the most female-oriented occupations are Healthcare Support (95.9%), Personal Care & Service (72.2%), and Food Preparation & Serving (70.0%).
| Occupation | Male | Female |
| Healthcare Support | 8 (4.1%) | 188 (95.9%) |
| Security & Protection | 49 (69.0%) | 22 (31.0%) |
| Firefighting & Prevention | 23 (71.9%) | 9 (28.1%) |
| Law Enforcement | 26 (66.7%) | 13 (33.3%) |
| Food Preparation & Serving | 68 (30.0%) | 159 (70.0%) |
| Cleaning & Maintenance | 217 (71.4%) | 87 (28.6%) |
| Personal Care & Service | 20 (27.8%) | 52 (72.2%) |
| Total (Category) | 362 (41.6%) | 508 (58.4%) |
| Total (Overall) | 1,905 (52.1%) | 1,750 (47.9%) |
Sales and Office Occupations
The most common Sales and Office occupations in Pushmataha County are Office & Administration (455 | 12.4%), and Sales & Related (240 | 6.6%).
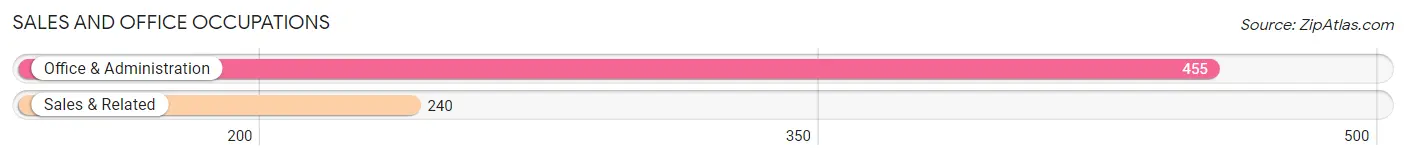
Sales and Office Occupations by Sex
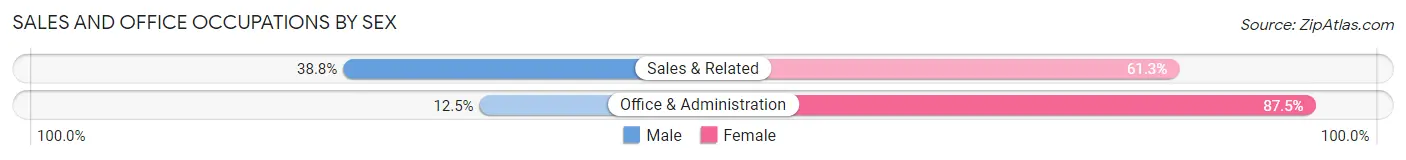
| Occupation | Male | Female |
| Sales & Related | 93 (38.8%) | 147 (61.3%) |
| Office & Administration | 57 (12.5%) | 398 (87.5%) |
| Total (Category) | 150 (21.6%) | 545 (78.4%) |
| Total (Overall) | 1,905 (52.1%) | 1,750 (47.9%) |
Natural Resources, Construction and Maintenance Occupations
The most common Natural Resources, Construction and Maintenance occupations in Pushmataha County are Construction & Extraction (372 | 10.2%), Installation, Maintenance & Repair (96 | 2.6%), and Farming, Fishing & Forestry (87 | 2.4%).
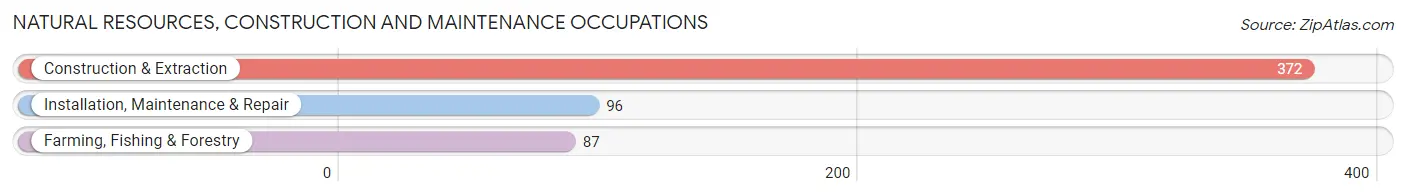
Natural Resources, Construction and Maintenance Occupations by Sex
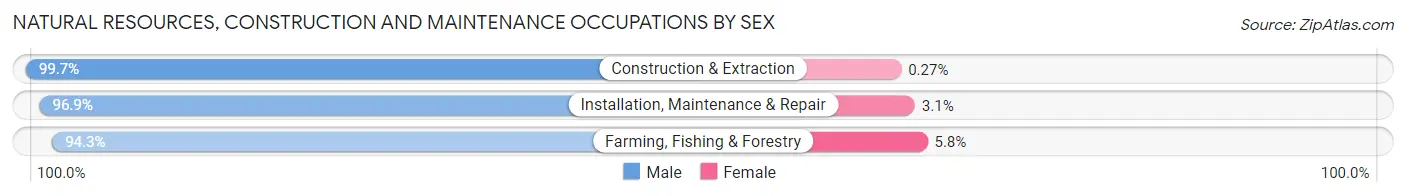
| Occupation | Male | Female |
| Farming, Fishing & Forestry | 82 (94.3%) | 5 (5.8%) |
| Construction & Extraction | 371 (99.7%) | 1 (0.3%) |
| Installation, Maintenance & Repair | 93 (96.9%) | 3 (3.1%) |
| Total (Category) | 546 (98.4%) | 9 (1.6%) |
| Total (Overall) | 1,905 (52.1%) | 1,750 (47.9%) |
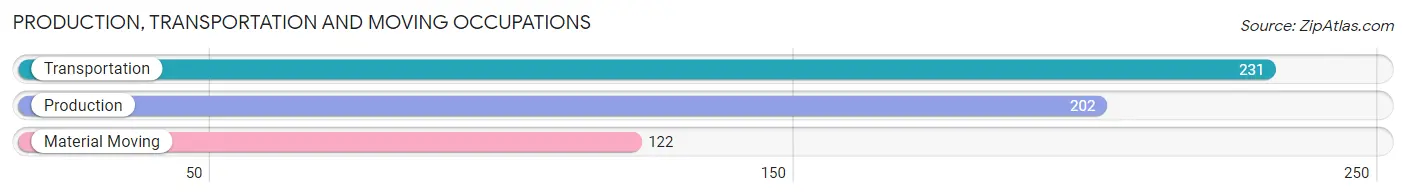
Production, Transportation and Moving Occupations
The most common Production, Transportation and Moving occupations in Pushmataha County are Transportation (231 | 6.3%), Production (202 | 5.5%), and Material Moving (122 | 3.3%).
Production, Transportation and Moving Occupations by Sex
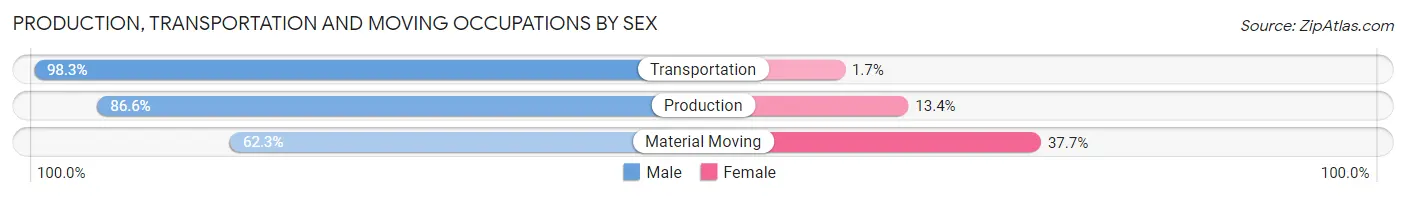
| Occupation | Male | Female |
| Production | 175 (86.6%) | 27 (13.4%) |
| Transportation | 227 (98.3%) | 4 (1.7%) |
| Material Moving | 76 (62.3%) | 46 (37.7%) |
| Total (Category) | 478 (86.1%) | 77 (13.9%) |
| Total (Overall) | 1,905 (52.1%) | 1,750 (47.9%) |
Employment Industries by Sex in Pushmataha County
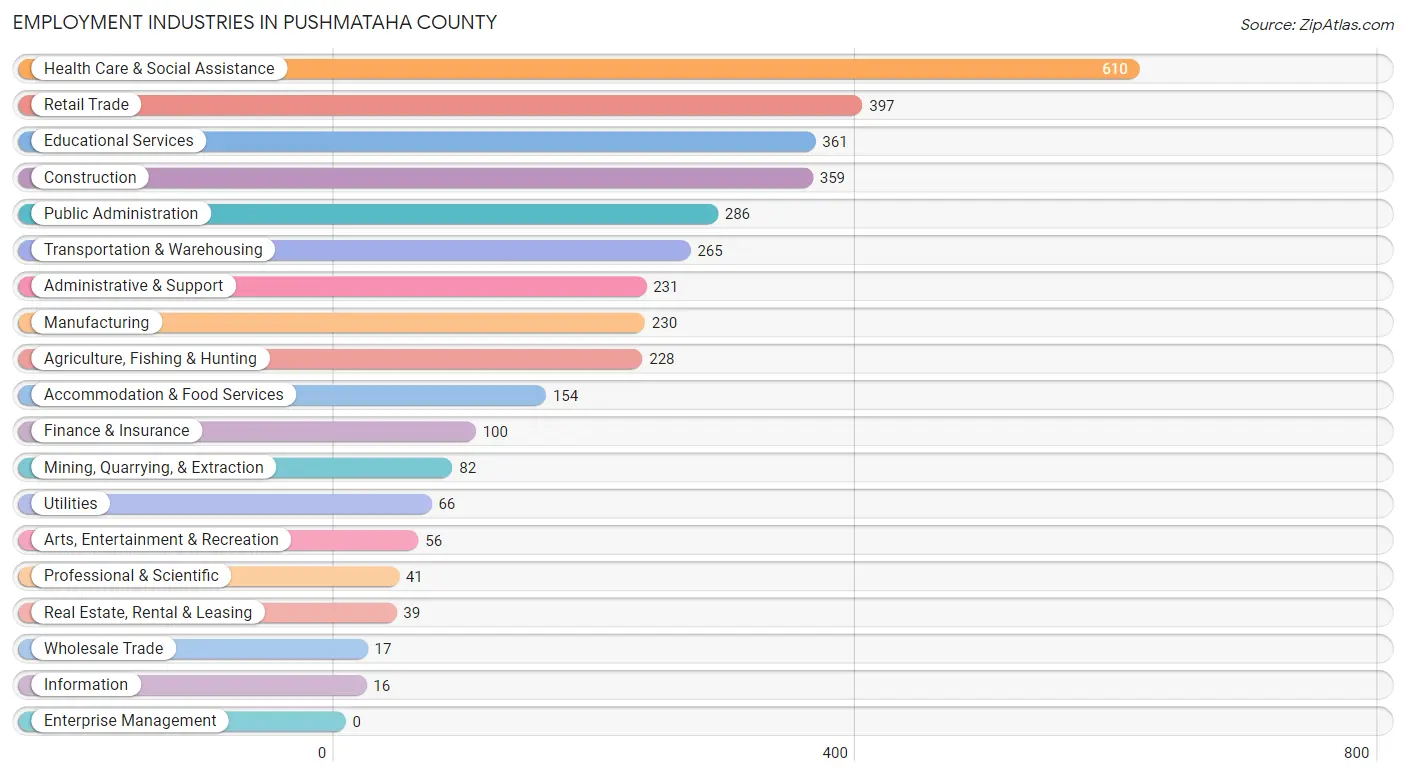
Employment Industries in Pushmataha County
The major employment industries in Pushmataha County include Health Care & Social Assistance (610 | 16.7%), Retail Trade (397 | 10.9%), Educational Services (361 | 9.9%), Construction (359 | 9.8%), and Public Administration (286 | 7.8%).
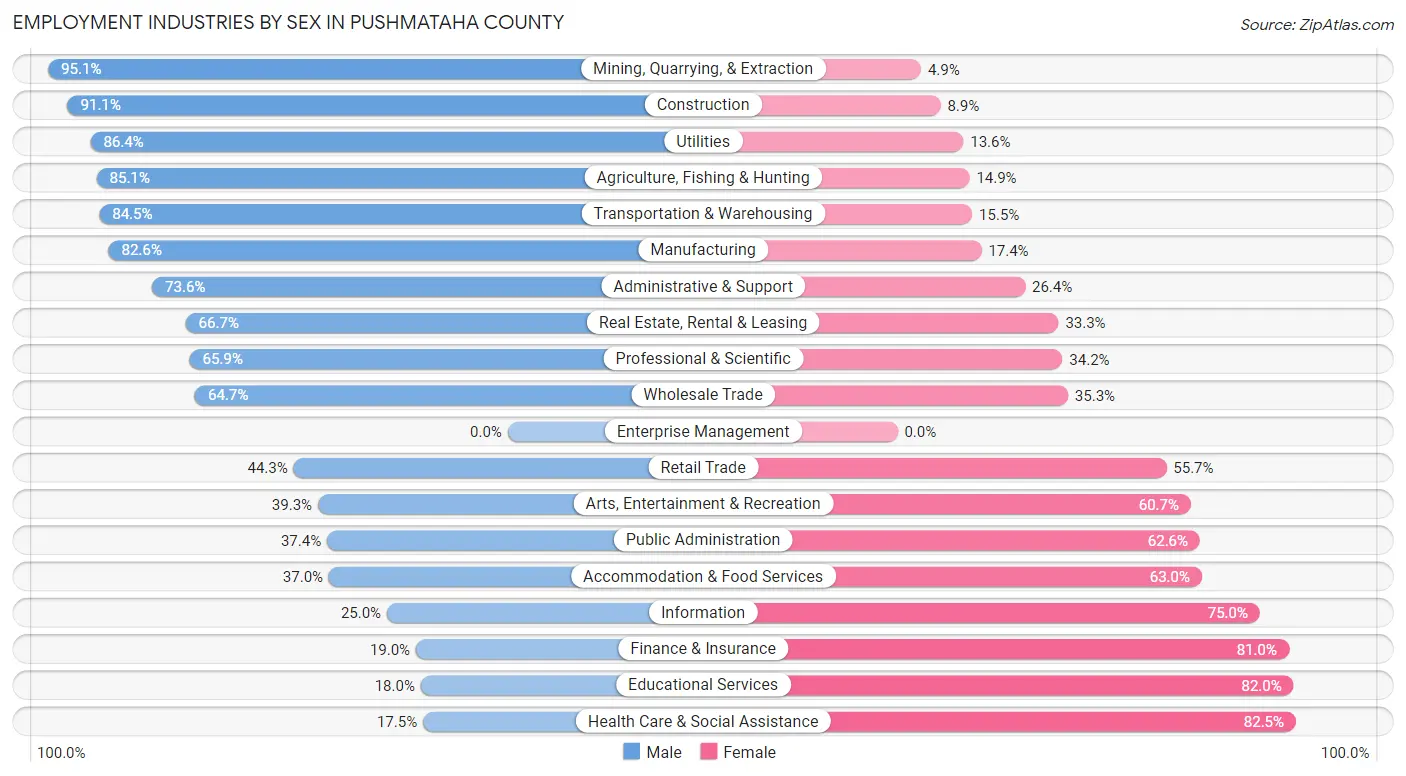
Employment Industries by Sex in Pushmataha County
The Pushmataha County industries that see more men than women are Mining, Quarrying, & Extraction (95.1%), Construction (91.1%), and Utilities (86.4%), whereas the industries that tend to have a higher number of women are Health Care & Social Assistance (82.5%), Educational Services (82.0%), and Finance & Insurance (81.0%).
| Industry | Male | Female |
| Agriculture, Fishing & Hunting | 194 (85.1%) | 34 (14.9%) |
| Mining, Quarrying, & Extraction | 78 (95.1%) | 4 (4.9%) |
| Construction | 327 (91.1%) | 32 (8.9%) |
| Manufacturing | 190 (82.6%) | 40 (17.4%) |
| Wholesale Trade | 11 (64.7%) | 6 (35.3%) |
| Retail Trade | 176 (44.3%) | 221 (55.7%) |
| Transportation & Warehousing | 224 (84.5%) | 41 (15.5%) |
| Utilities | 57 (86.4%) | 9 (13.6%) |
| Information | 4 (25.0%) | 12 (75.0%) |
| Finance & Insurance | 19 (19.0%) | 81 (81.0%) |
| Real Estate, Rental & Leasing | 26 (66.7%) | 13 (33.3%) |
| Professional & Scientific | 27 (65.8%) | 14 (34.2%) |
| Enterprise Management | 0 (0.0%) | 0 (0.0%) |
| Administrative & Support | 170 (73.6%) | 61 (26.4%) |
| Educational Services | 65 (18.0%) | 296 (82.0%) |
| Health Care & Social Assistance | 107 (17.5%) | 503 (82.5%) |
| Arts, Entertainment & Recreation | 22 (39.3%) | 34 (60.7%) |
| Accommodation & Food Services | 57 (37.0%) | 97 (63.0%) |
| Public Administration | 107 (37.4%) | 179 (62.6%) |
| Total | 1,905 (52.1%) | 1,750 (47.9%) |
Education in Pushmataha County
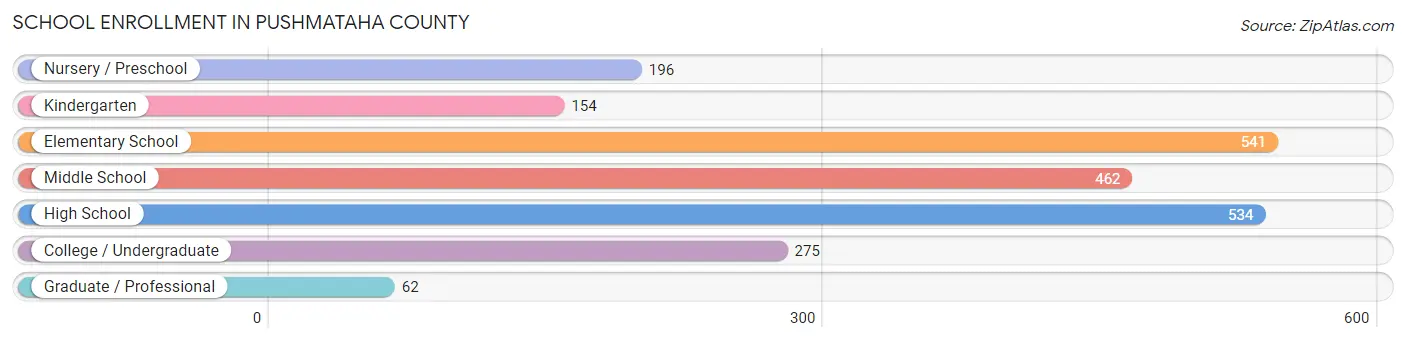
School Enrollment in Pushmataha County
The most common levels of schooling among the 2,224 students in Pushmataha County are elementary school (541 | 24.3%), high school (534 | 24.0%), and middle school (462 | 20.8%).
| School Level | # Students | % Students |
| Nursery / Preschool | 196 | 8.8% |
| Kindergarten | 154 | 6.9% |
| Elementary School | 541 | 24.3% |
| Middle School | 462 | 20.8% |
| High School | 534 | 24.0% |
| College / Undergraduate | 275 | 12.4% |
| Graduate / Professional | 62 | 2.8% |
| Total | 2,224 | 100.0% |
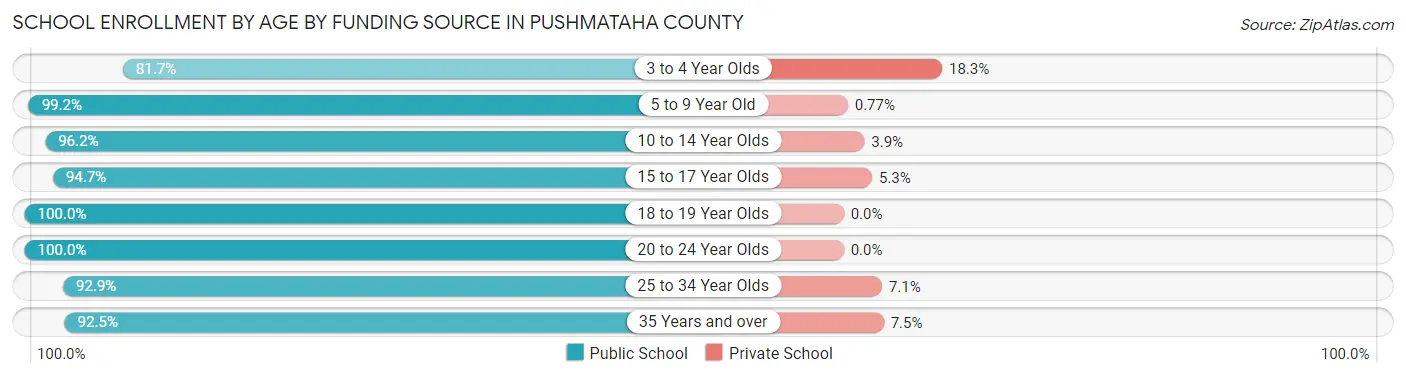
School Enrollment by Age by Funding Source in Pushmataha County
Out of a total of 2,224 students who are enrolled in schools in Pushmataha County, 85 (3.8%) attend a private institution, while the remaining 2,139 (96.2%) are enrolled in public schools. The age group of 3 to 4 year olds has the highest likelihood of being enrolled in private schools, with 24 (18.3% in the age bracket) enrolled. Conversely, the age group of 18 to 19 year olds has the lowest likelihood of being enrolled in a private school, with 199 (100.0% in the age bracket) attending a public institution.
| Age Bracket | Public School | Private School |
| 3 to 4 Year Olds | 107 (81.7%) | 24 (18.3%) |
| 5 to 9 Year Old | 646 (99.2%) | 5 (0.8%) |
| 10 to 14 Year Olds | 550 (96.2%) | 22 (3.8%) |
| 15 to 17 Year Olds | 377 (94.7%) | 21 (5.3%) |
| 18 to 19 Year Olds | 199 (100.0%) | 0 (0.0%) |
| 20 to 24 Year Olds | 108 (100.0%) | 0 (0.0%) |
| 25 to 34 Year Olds | 91 (92.9%) | 7 (7.1%) |
| 35 Years and over | 62 (92.5%) | 5 (7.5%) |
| Total | 2,139 (96.2%) | 85 (3.8%) |
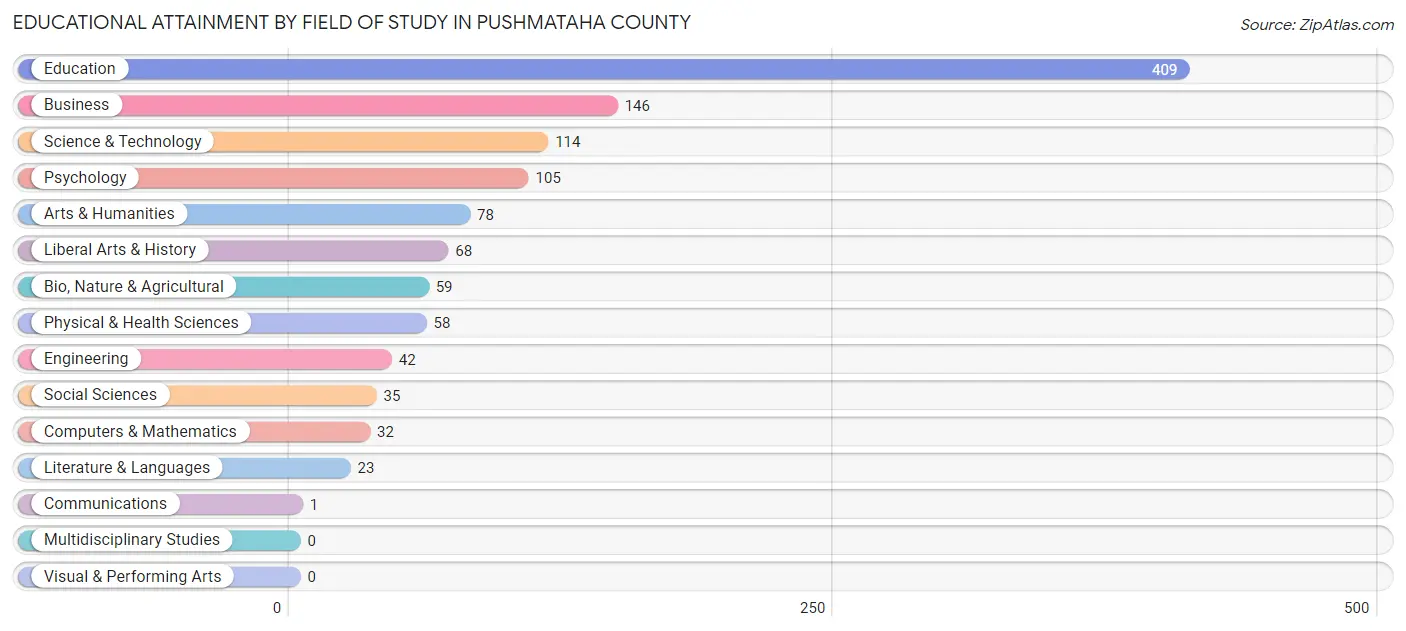
Educational Attainment by Field of Study in Pushmataha County
Education (409 | 35.0%), business (146 | 12.5%), science & technology (114 | 9.7%), psychology (105 | 9.0%), and arts & humanities (78 | 6.7%) are the most common fields of study among 1,170 individuals in Pushmataha County who have obtained a bachelor's degree or higher.
| Field of Study | # Graduates | % Graduates |
| Computers & Mathematics | 32 | 2.7% |
| Bio, Nature & Agricultural | 59 | 5.0% |
| Physical & Health Sciences | 58 | 5.0% |
| Psychology | 105 | 9.0% |
| Social Sciences | 35 | 3.0% |
| Engineering | 42 | 3.6% |
| Multidisciplinary Studies | 0 | 0.0% |
| Science & Technology | 114 | 9.7% |
| Business | 146 | 12.5% |
| Education | 409 | 35.0% |
| Literature & Languages | 23 | 2.0% |
| Liberal Arts & History | 68 | 5.8% |
| Visual & Performing Arts | 0 | 0.0% |
| Communications | 1 | 0.1% |
| Arts & Humanities | 78 | 6.7% |
| Total | 1,170 | 100.0% |
Transportation & Commute in Pushmataha County
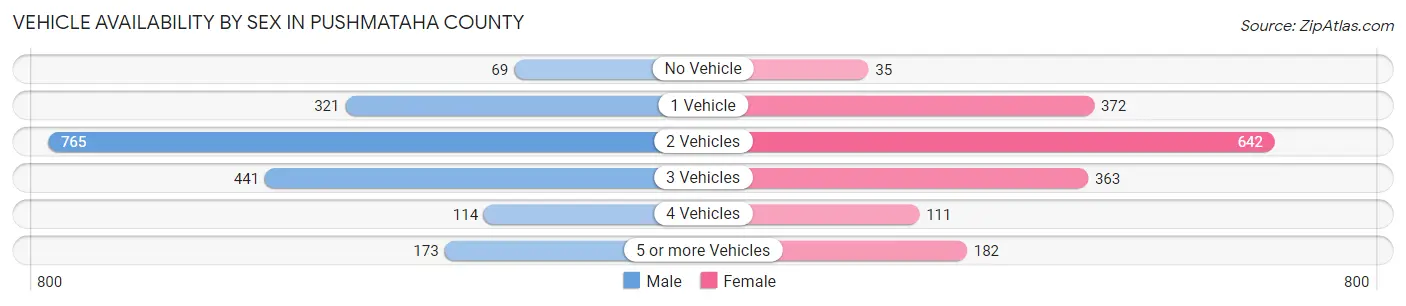
Vehicle Availability by Sex in Pushmataha County
The most prevalent vehicle ownership categories in Pushmataha County are males with 2 vehicles (765, accounting for 40.6%) and females with 2 vehicles (642, making up 44.9%).
| Vehicles Available | Male | Female |
| No Vehicle | 69 (3.7%) | 35 (2.1%) |
| 1 Vehicle | 321 (17.1%) | 372 (21.8%) |
| 2 Vehicles | 765 (40.6%) | 642 (37.7%) |
| 3 Vehicles | 441 (23.4%) | 363 (21.3%) |
| 4 Vehicles | 114 (6.0%) | 111 (6.5%) |
| 5 or more Vehicles | 173 (9.2%) | 182 (10.7%) |
| Total | 1,883 (100.0%) | 1,705 (100.0%) |
Commute Time in Pushmataha County
The most frequently occuring commute durations in Pushmataha County are 5 to 9 minutes (530 commuters, 15.7%), 30 to 34 minutes (459 commuters, 13.6%), and less than 5 minutes (390 commuters, 11.5%).
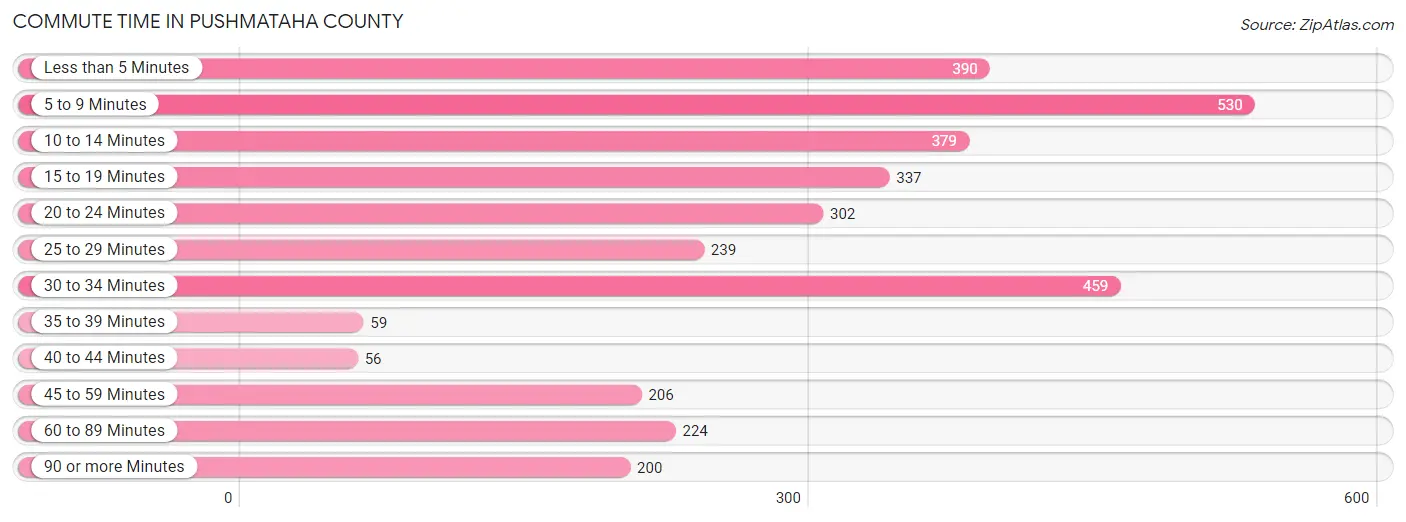
| Commute Time | # Commuters | % Commuters |
| Less than 5 Minutes | 390 | 11.5% |
| 5 to 9 Minutes | 530 | 15.7% |
| 10 to 14 Minutes | 379 | 11.2% |
| 15 to 19 Minutes | 337 | 10.0% |
| 20 to 24 Minutes | 302 | 8.9% |
| 25 to 29 Minutes | 239 | 7.1% |
| 30 to 34 Minutes | 459 | 13.6% |
| 35 to 39 Minutes | 59 | 1.8% |
| 40 to 44 Minutes | 56 | 1.7% |
| 45 to 59 Minutes | 206 | 6.1% |
| 60 to 89 Minutes | 224 | 6.6% |
| 90 or more Minutes | 200 | 5.9% |
Commute Time by Sex in Pushmataha County
The most common commute times in Pushmataha County are 30 to 34 minutes (243 commuters, 13.8%) for males and 5 to 9 minutes (320 commuters, 19.8%) for females.
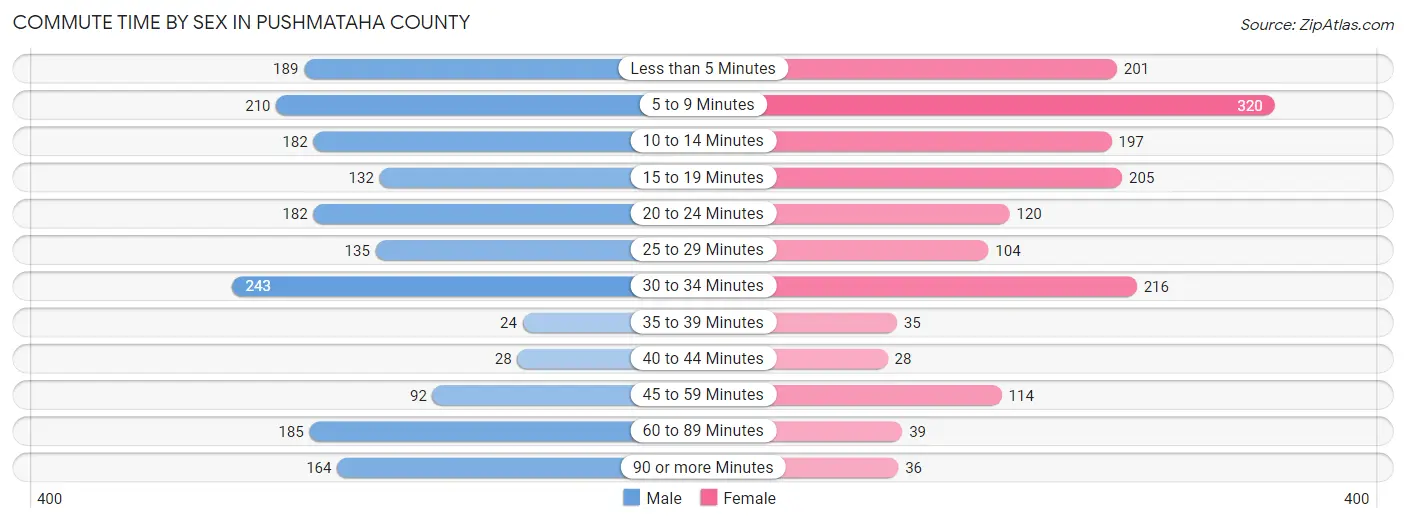
| Commute Time | Male | Female |
| Less than 5 Minutes | 189 (10.7%) | 201 (12.4%) |
| 5 to 9 Minutes | 210 (11.9%) | 320 (19.8%) |
| 10 to 14 Minutes | 182 (10.3%) | 197 (12.2%) |
| 15 to 19 Minutes | 132 (7.5%) | 205 (12.7%) |
| 20 to 24 Minutes | 182 (10.3%) | 120 (7.4%) |
| 25 to 29 Minutes | 135 (7.6%) | 104 (6.4%) |
| 30 to 34 Minutes | 243 (13.8%) | 216 (13.4%) |
| 35 to 39 Minutes | 24 (1.4%) | 35 (2.2%) |
| 40 to 44 Minutes | 28 (1.6%) | 28 (1.7%) |
| 45 to 59 Minutes | 92 (5.2%) | 114 (7.1%) |
| 60 to 89 Minutes | 185 (10.5%) | 39 (2.4%) |
| 90 or more Minutes | 164 (9.3%) | 36 (2.2%) |
Time of Departure to Work by Sex in Pushmataha County
The most frequent times of departure to work in Pushmataha County are 7:00 AM to 7:29 AM (281, 15.9%) for males and 7:00 AM to 7:29 AM (419, 25.9%) for females.
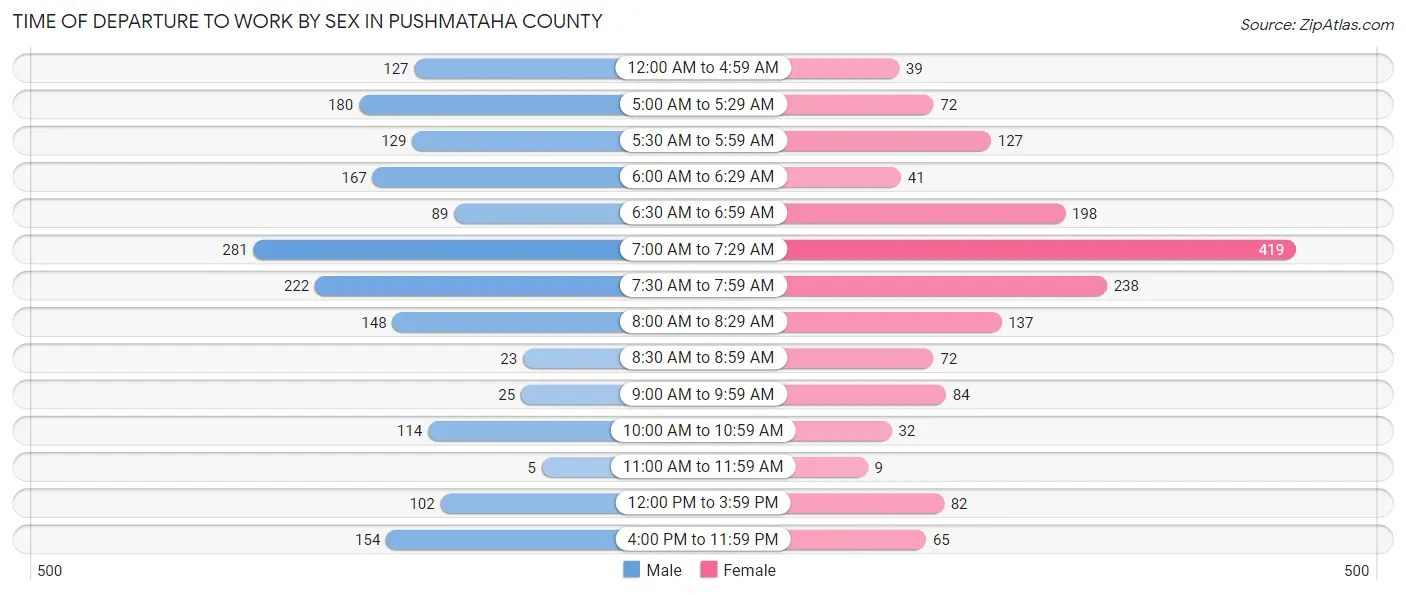
| Time of Departure | Male | Female |
| 12:00 AM to 4:59 AM | 127 (7.2%) | 39 (2.4%) |
| 5:00 AM to 5:29 AM | 180 (10.2%) | 72 (4.5%) |
| 5:30 AM to 5:59 AM | 129 (7.3%) | 127 (7.9%) |
| 6:00 AM to 6:29 AM | 167 (9.5%) | 41 (2.5%) |
| 6:30 AM to 6:59 AM | 89 (5.0%) | 198 (12.3%) |
| 7:00 AM to 7:29 AM | 281 (15.9%) | 419 (25.9%) |
| 7:30 AM to 7:59 AM | 222 (12.6%) | 238 (14.7%) |
| 8:00 AM to 8:29 AM | 148 (8.4%) | 137 (8.5%) |
| 8:30 AM to 8:59 AM | 23 (1.3%) | 72 (4.5%) |
| 9:00 AM to 9:59 AM | 25 (1.4%) | 84 (5.2%) |
| 10:00 AM to 10:59 AM | 114 (6.5%) | 32 (2.0%) |
| 11:00 AM to 11:59 AM | 5 (0.3%) | 9 (0.6%) |
| 12:00 PM to 3:59 PM | 102 (5.8%) | 82 (5.1%) |
| 4:00 PM to 11:59 PM | 154 (8.7%) | 65 (4.0%) |
| Total | 1,766 (100.0%) | 1,615 (100.0%) |
Housing Occupancy in Pushmataha County
Occupancy by Ownership in Pushmataha County
Of the total 4,229 dwellings in Pushmataha County, owner-occupied units account for 3,188 (75.4%), while renter-occupied units make up 1,041 (24.6%).
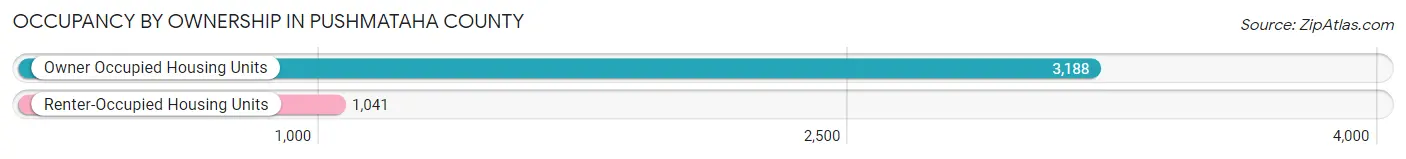
| Occupancy | # Housing Units | % Housing Units |
| Owner Occupied Housing Units | 3,188 | 75.4% |
| Renter-Occupied Housing Units | 1,041 | 24.6% |
| Total Occupied Housing Units | 4,229 | 100.0% |
Occupancy by Household Size in Pushmataha County
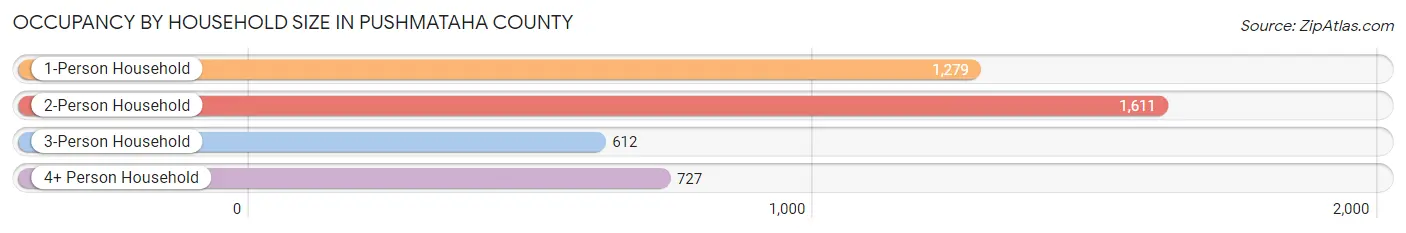
| Household Size | # Housing Units | % Housing Units |
| 1-Person Household | 1,279 | 30.2% |
| 2-Person Household | 1,611 | 38.1% |
| 3-Person Household | 612 | 14.5% |
| 4+ Person Household | 727 | 17.2% |
| Total Housing Units | 4,229 | 100.0% |
Occupancy by Ownership by Household Size in Pushmataha County
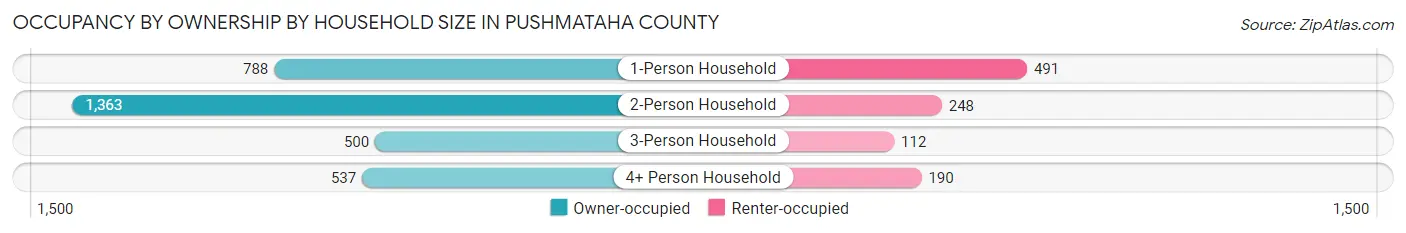
| Household Size | Owner-occupied | Renter-occupied |
| 1-Person Household | 788 (61.6%) | 491 (38.4%) |
| 2-Person Household | 1,363 (84.6%) | 248 (15.4%) |
| 3-Person Household | 500 (81.7%) | 112 (18.3%) |
| 4+ Person Household | 537 (73.9%) | 190 (26.1%) |
| Total Housing Units | 3,188 (75.4%) | 1,041 (24.6%) |
Occupancy by Educational Attainment in Pushmataha County
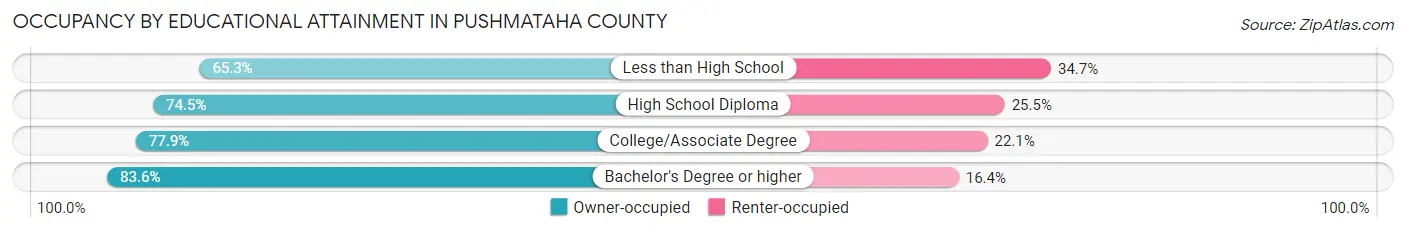
| Household Size | Owner-occupied | Renter-occupied |
| Less than High School | 422 (65.3%) | 224 (34.7%) |
| High School Diploma | 1,286 (74.5%) | 440 (25.5%) |
| College/Associate Degree | 995 (77.9%) | 282 (22.1%) |
| Bachelor's Degree or higher | 485 (83.6%) | 95 (16.4%) |
Occupancy by Age of Householder in Pushmataha County
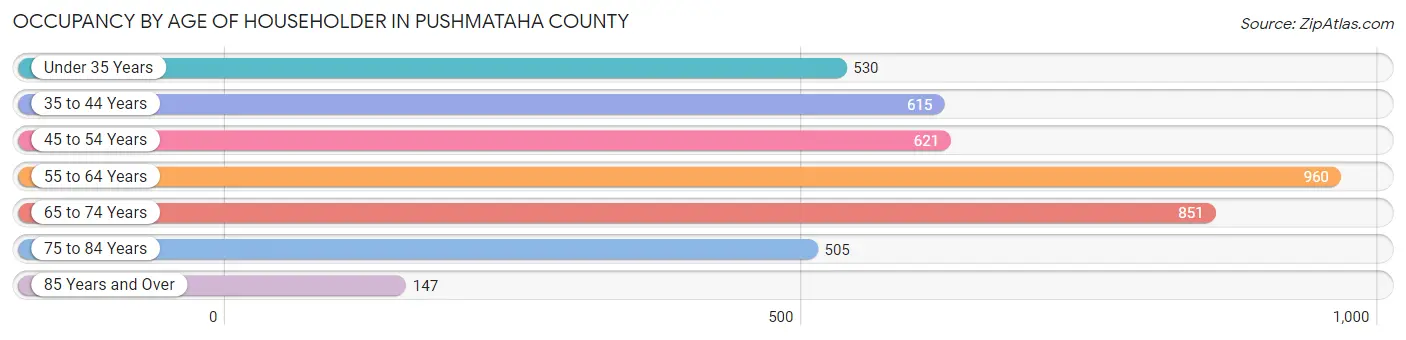
| Age Bracket | # Households | % Households |
| Under 35 Years | 530 | 12.5% |
| 35 to 44 Years | 615 | 14.5% |
| 45 to 54 Years | 621 | 14.7% |
| 55 to 64 Years | 960 | 22.7% |
| 65 to 74 Years | 851 | 20.1% |
| 75 to 84 Years | 505 | 11.9% |
| 85 Years and Over | 147 | 3.5% |
| Total | 4,229 | 100.0% |
Housing Finances in Pushmataha County
Median Income by Occupancy in Pushmataha County
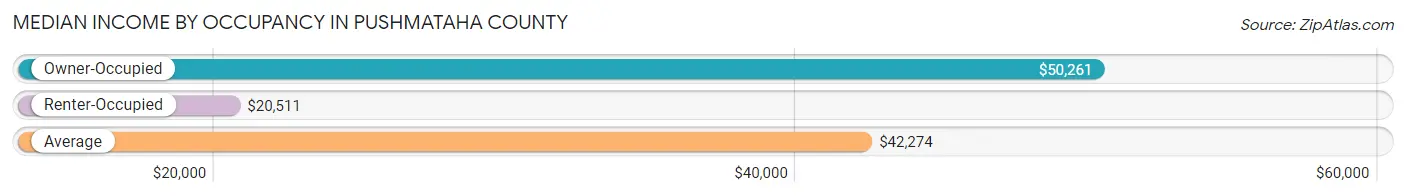
| Occupancy Type | # Households | Median Income |
| Owner-Occupied | 3,188 (75.4%) | $50,261 |
| Renter-Occupied | 1,041 (24.6%) | $20,511 |
| Average | 4,229 (100.0%) | $42,274 |
Occupancy by Householder Income Bracket in Pushmataha County
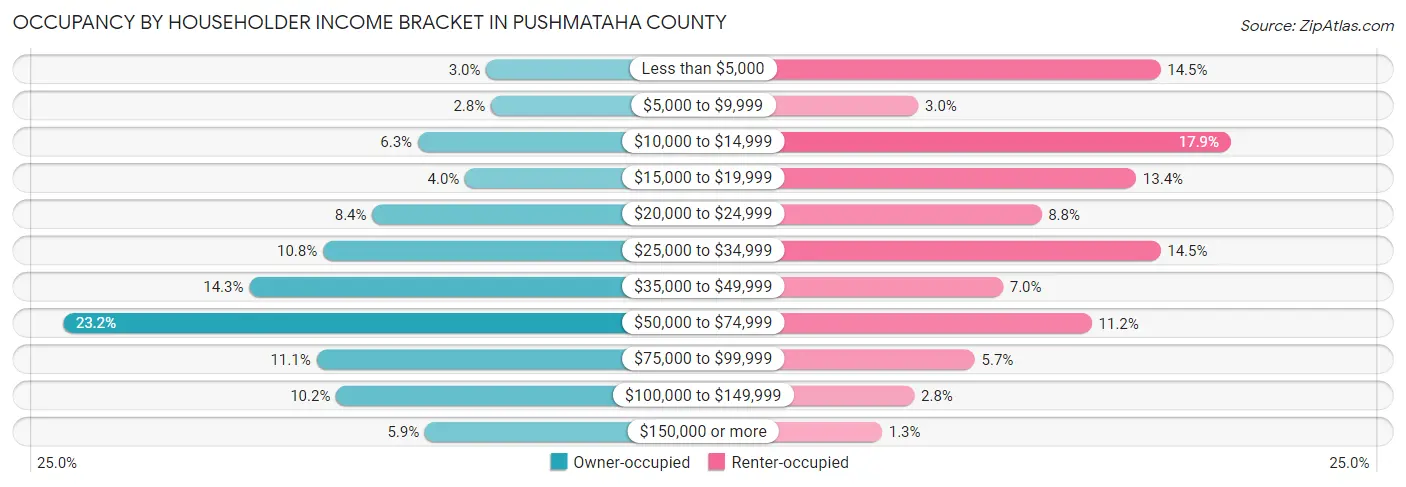
| Income Bracket | Owner-occupied | Renter-occupied |
| Less than $5,000 | 96 (3.0%) | 151 (14.5%) |
| $5,000 to $9,999 | 89 (2.8%) | 31 (3.0%) |
| $10,000 to $14,999 | 200 (6.3%) | 186 (17.9%) |
| $15,000 to $19,999 | 128 (4.0%) | 139 (13.4%) |
| $20,000 to $24,999 | 269 (8.4%) | 92 (8.8%) |
| $25,000 to $34,999 | 344 (10.8%) | 151 (14.5%) |
| $35,000 to $49,999 | 456 (14.3%) | 73 (7.0%) |
| $50,000 to $74,999 | 739 (23.2%) | 117 (11.2%) |
| $75,000 to $99,999 | 354 (11.1%) | 59 (5.7%) |
| $100,000 to $149,999 | 324 (10.2%) | 29 (2.8%) |
| $150,000 or more | 189 (5.9%) | 13 (1.3%) |
| Total | 3,188 (100.0%) | 1,041 (100.0%) |
Monthly Housing Cost Tiers in Pushmataha County
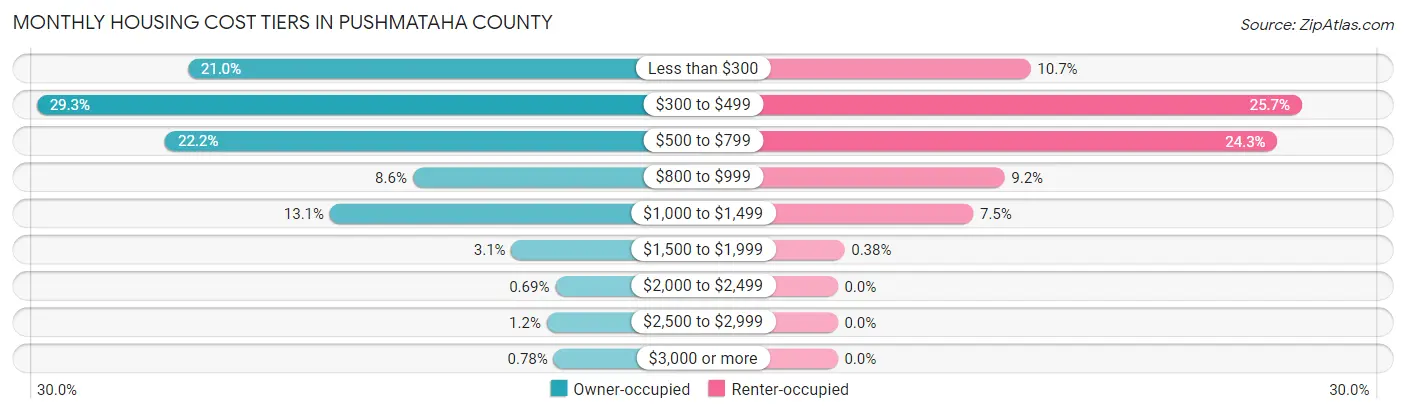
| Monthly Cost | Owner-occupied | Renter-occupied |
| Less than $300 | 669 (21.0%) | 111 (10.7%) |
| $300 to $499 | 935 (29.3%) | 267 (25.7%) |
| $500 to $799 | 709 (22.2%) | 253 (24.3%) |
| $800 to $999 | 273 (8.6%) | 96 (9.2%) |
| $1,000 to $1,499 | 419 (13.1%) | 78 (7.5%) |
| $1,500 to $1,999 | 99 (3.1%) | 4 (0.4%) |
| $2,000 to $2,499 | 22 (0.7%) | 0 (0.0%) |
| $2,500 to $2,999 | 37 (1.2%) | 0 (0.0%) |
| $3,000 or more | 25 (0.8%) | 0 (0.0%) |
| Total | 3,188 (100.0%) | 1,041 (100.0%) |
Physical Housing Characteristics in Pushmataha County
Housing Structures in Pushmataha County
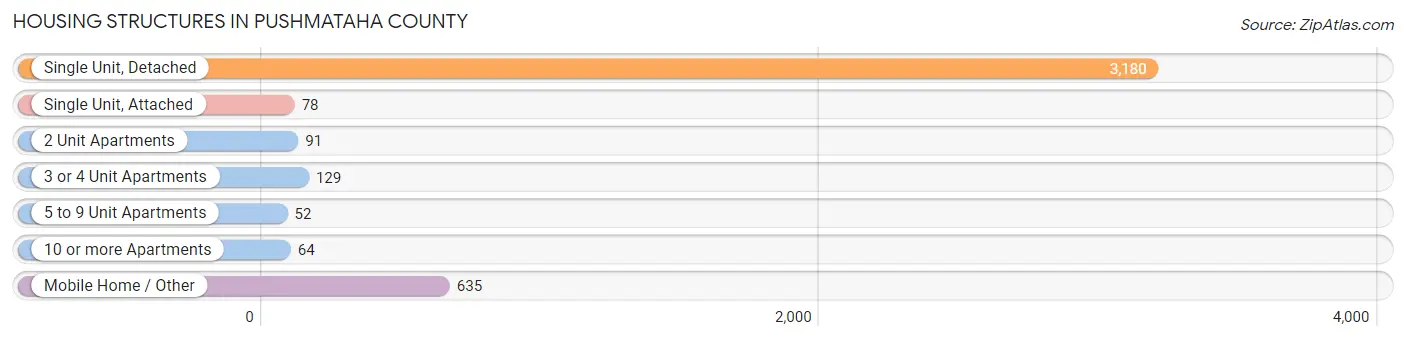
| Structure Type | # Housing Units | % Housing Units |
| Single Unit, Detached | 3,180 | 75.2% |
| Single Unit, Attached | 78 | 1.8% |
| 2 Unit Apartments | 91 | 2.1% |
| 3 or 4 Unit Apartments | 129 | 3.0% |
| 5 to 9 Unit Apartments | 52 | 1.2% |
| 10 or more Apartments | 64 | 1.5% |
| Mobile Home / Other | 635 | 15.0% |
| Total | 4,229 | 100.0% |
Housing Structures by Occupancy in Pushmataha County
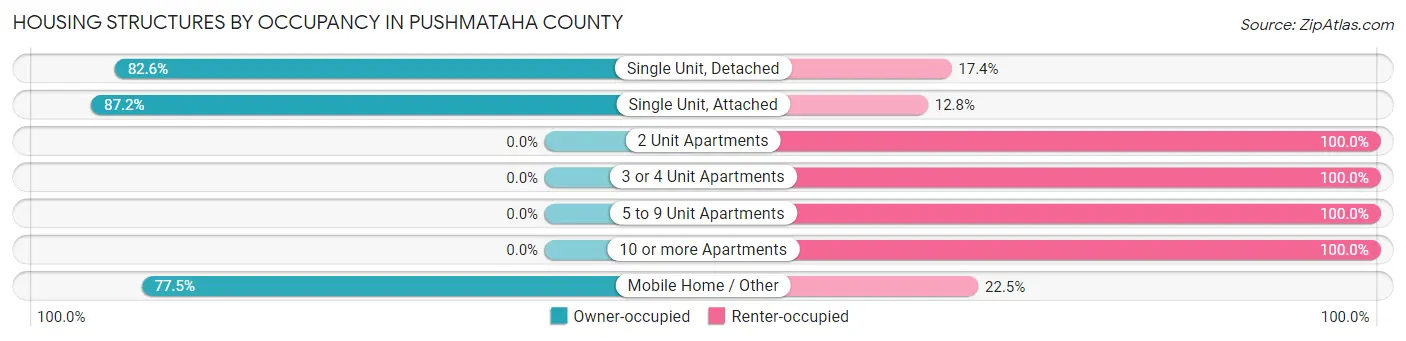
| Structure Type | Owner-occupied | Renter-occupied |
| Single Unit, Detached | 2,628 (82.6%) | 552 (17.4%) |
| Single Unit, Attached | 68 (87.2%) | 10 (12.8%) |
| 2 Unit Apartments | 0 (0.0%) | 91 (100.0%) |
| 3 or 4 Unit Apartments | 0 (0.0%) | 129 (100.0%) |
| 5 to 9 Unit Apartments | 0 (0.0%) | 52 (100.0%) |
| 10 or more Apartments | 0 (0.0%) | 64 (100.0%) |
| Mobile Home / Other | 492 (77.5%) | 143 (22.5%) |
| Total | 3,188 (75.4%) | 1,041 (24.6%) |
Housing Structures by Number of Rooms in Pushmataha County
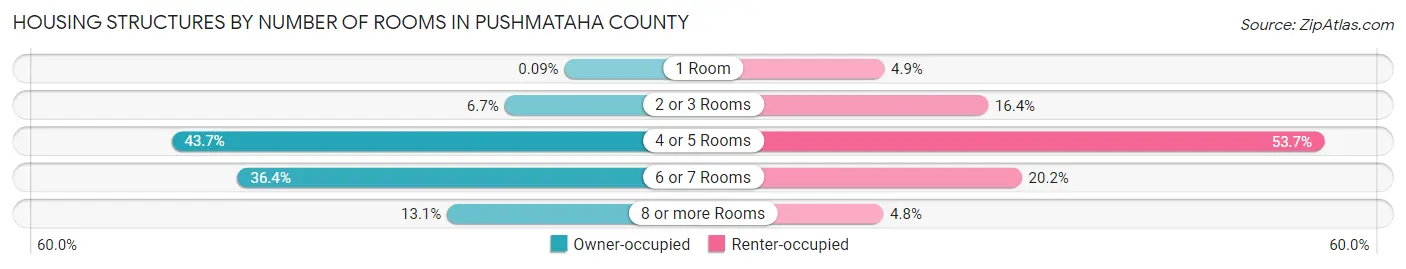
| Number of Rooms | Owner-occupied | Renter-occupied |
| 1 Room | 3 (0.1%) | 51 (4.9%) |
| 2 or 3 Rooms | 215 (6.7%) | 171 (16.4%) |
| 4 or 5 Rooms | 1,393 (43.7%) | 559 (53.7%) |
| 6 or 7 Rooms | 1,159 (36.4%) | 210 (20.2%) |
| 8 or more Rooms | 418 (13.1%) | 50 (4.8%) |
| Total | 3,188 (100.0%) | 1,041 (100.0%) |
Housing Structure by Heating Type in Pushmataha County
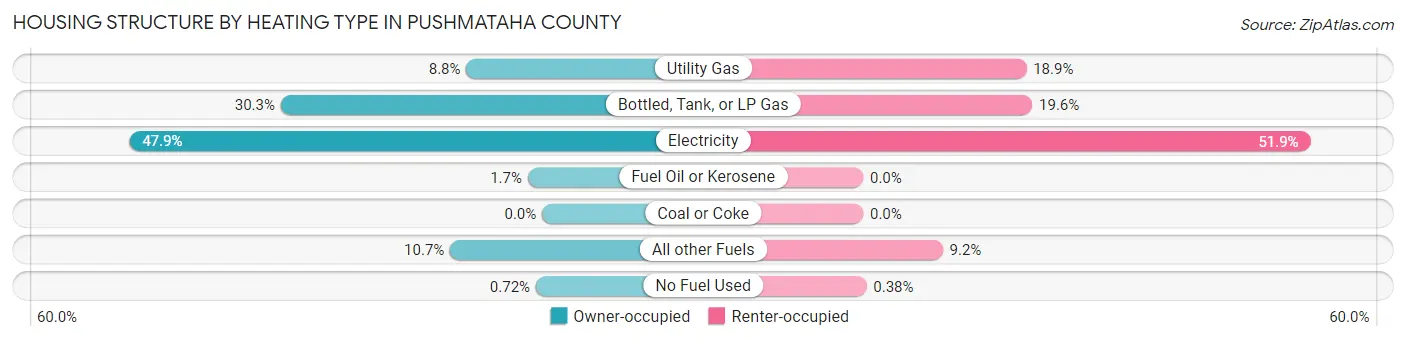
| Heating Type | Owner-occupied | Renter-occupied |
| Utility Gas | 280 (8.8%) | 197 (18.9%) |
| Bottled, Tank, or LP Gas | 966 (30.3%) | 204 (19.6%) |
| Electricity | 1,526 (47.9%) | 540 (51.9%) |
| Fuel Oil or Kerosene | 53 (1.7%) | 0 (0.0%) |
| Coal or Coke | 0 (0.0%) | 0 (0.0%) |
| All other Fuels | 340 (10.7%) | 96 (9.2%) |
| No Fuel Used | 23 (0.7%) | 4 (0.4%) |
| Total | 3,188 (100.0%) | 1,041 (100.0%) |
Household Vehicle Usage in Pushmataha County
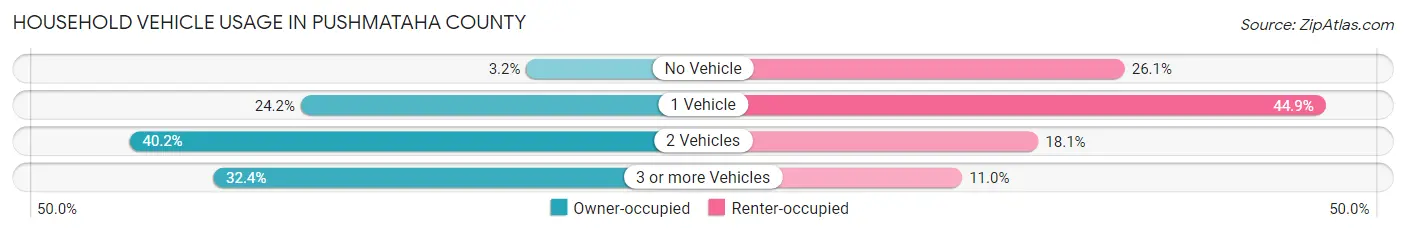
| Vehicles per Household | Owner-occupied | Renter-occupied |
| No Vehicle | 101 (3.2%) | 272 (26.1%) |
| 1 Vehicle | 772 (24.2%) | 467 (44.9%) |
| 2 Vehicles | 1,282 (40.2%) | 188 (18.1%) |
| 3 or more Vehicles | 1,033 (32.4%) | 114 (11.0%) |
| Total | 3,188 (100.0%) | 1,041 (100.0%) |
Real Estate & Mortgages in Pushmataha County
Real Estate and Mortgage Overview in Pushmataha County
| Characteristic | Without Mortgage | With Mortgage |
| Housing Units | 2,183 | 1,005 |
| Median Property Value | $98,500 | $112,000 |
| Median Household Income | $41,968 | $122 |
| Monthly Housing Costs | $388 | $23 |
| Real Estate Taxes | $433 | $101 |
Property Value by Mortgage Status in Pushmataha County
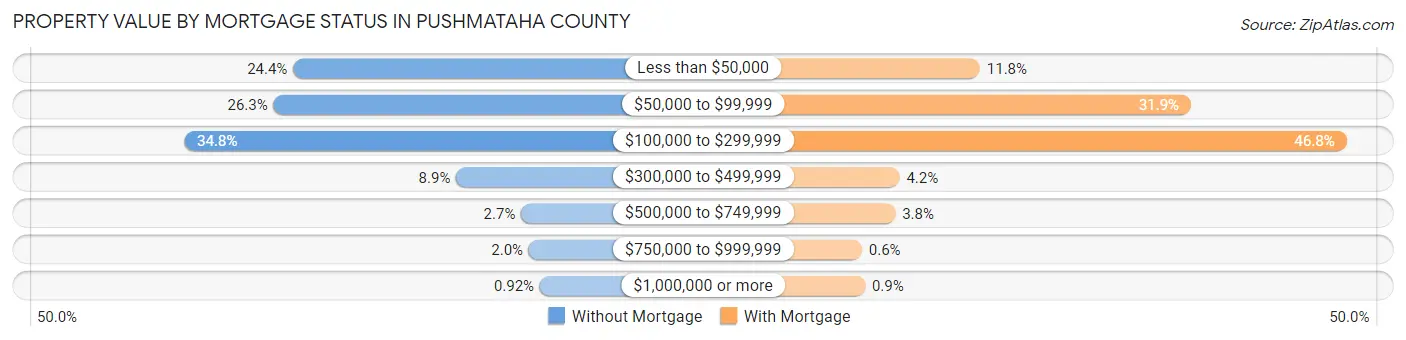
| Property Value | Without Mortgage | With Mortgage |
| Less than $50,000 | 533 (24.4%) | 119 (11.8%) |
| $50,000 to $99,999 | 574 (26.3%) | 321 (31.9%) |
| $100,000 to $299,999 | 760 (34.8%) | 470 (46.8%) |
| $300,000 to $499,999 | 194 (8.9%) | 42 (4.2%) |
| $500,000 to $749,999 | 59 (2.7%) | 38 (3.8%) |
| $750,000 to $999,999 | 43 (2.0%) | 6 (0.6%) |
| $1,000,000 or more | 20 (0.9%) | 9 (0.9%) |
| Total | 2,183 (100.0%) | 1,005 (100.0%) |
Household Income by Mortgage Status in Pushmataha County
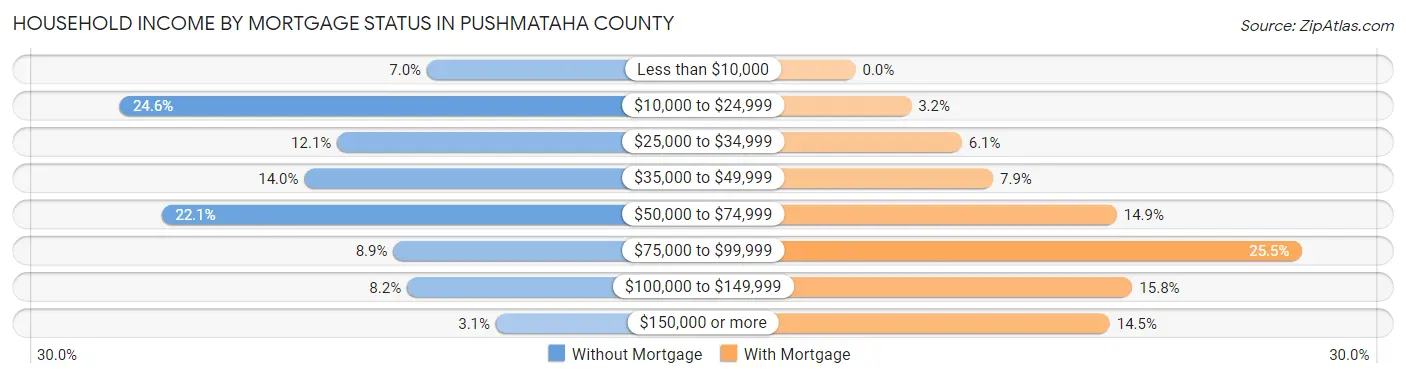
| Household Income | Without Mortgage | With Mortgage |
| Less than $10,000 | 153 (7.0%) | 0 (0.0%) |
| $10,000 to $24,999 | 536 (24.5%) | 32 (3.2%) |
| $25,000 to $34,999 | 265 (12.1%) | 61 (6.1%) |
| $35,000 to $49,999 | 306 (14.0%) | 79 (7.9%) |
| $50,000 to $74,999 | 483 (22.1%) | 150 (14.9%) |
| $75,000 to $99,999 | 195 (8.9%) | 256 (25.5%) |
| $100,000 to $149,999 | 178 (8.2%) | 159 (15.8%) |
| $150,000 or more | 67 (3.1%) | 146 (14.5%) |
| Total | 2,183 (100.0%) | 1,005 (100.0%) |
Property Value to Household Income Ratio in Pushmataha County
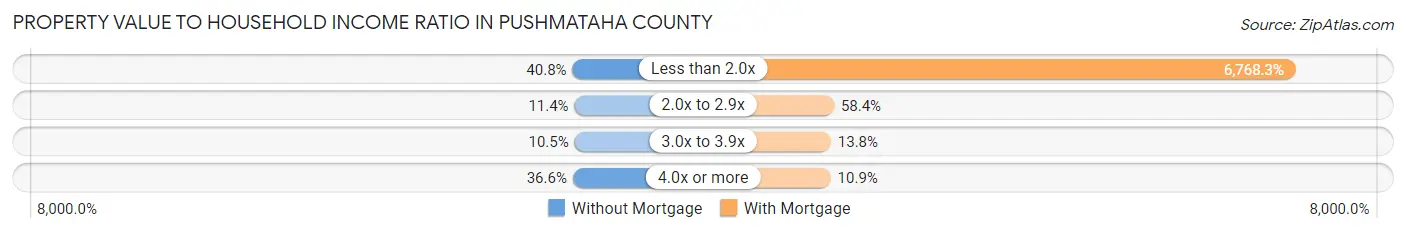
| Value-to-Income Ratio | Without Mortgage | With Mortgage |
| Less than 2.0x | 890 (40.8%) | 68,021 (6,768.3%) |
| 2.0x to 2.9x | 249 (11.4%) | 587 (58.4%) |
| 3.0x to 3.9x | 229 (10.5%) | 139 (13.8%) |
| 4.0x or more | 799 (36.6%) | 109 (10.8%) |
| Total | 2,183 (100.0%) | 1,005 (100.0%) |
Real Estate Taxes by Mortgage Status in Pushmataha County
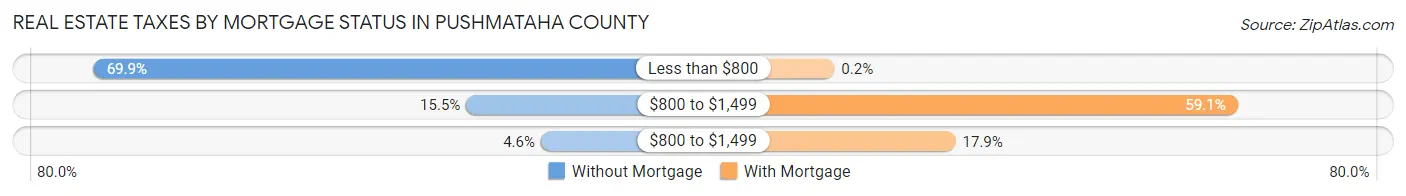
| Property Taxes | Without Mortgage | With Mortgage |
| Less than $800 | 1,526 (69.9%) | 2 (0.2%) |
| $800 to $1,499 | 338 (15.5%) | 594 (59.1%) |
| $800 to $1,499 | 100 (4.6%) | 180 (17.9%) |
| Total | 2,183 (100.0%) | 1,005 (100.0%) |
Health & Disability in Pushmataha County
Health Insurance Coverage by Age in Pushmataha County
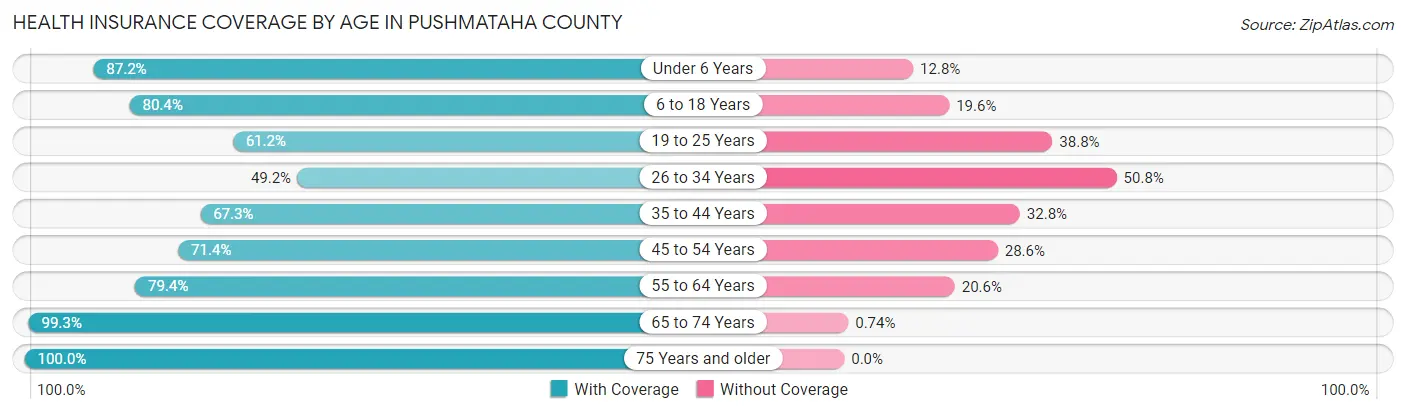
| Age Bracket | With Coverage | Without Coverage |
| Under 6 Years | 638 (87.2%) | 94 (12.8%) |
| 6 to 18 Years | 1,455 (80.4%) | 354 (19.6%) |
| 19 to 25 Years | 413 (61.2%) | 262 (38.8%) |
| 26 to 34 Years | 501 (49.2%) | 517 (50.8%) |
| 35 to 44 Years | 807 (67.2%) | 393 (32.8%) |
| 45 to 54 Years | 888 (71.4%) | 356 (28.6%) |
| 55 to 64 Years | 1,310 (79.4%) | 340 (20.6%) |
| 65 to 74 Years | 1,338 (99.3%) | 10 (0.7%) |
| 75 Years and older | 1,049 (100.0%) | 0 (0.0%) |
| Total | 8,399 (78.3%) | 2,326 (21.7%) |
Health Insurance Coverage by Citizenship Status in Pushmataha County
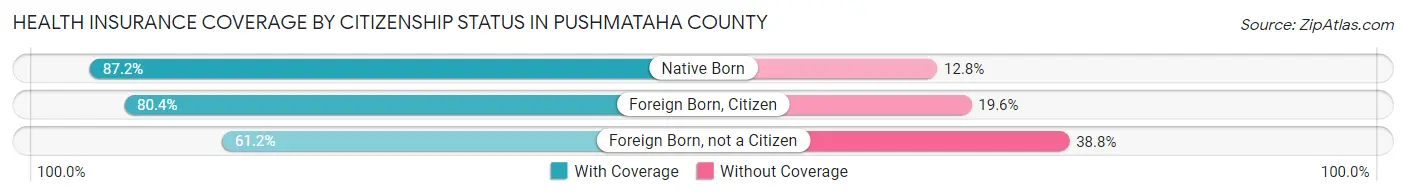
| Citizenship Status | With Coverage | Without Coverage |
| Native Born | 638 (87.2%) | 94 (12.8%) |
| Foreign Born, Citizen | 1,455 (80.4%) | 354 (19.6%) |
| Foreign Born, not a Citizen | 413 (61.2%) | 262 (38.8%) |
Health Insurance Coverage by Household Income in Pushmataha County
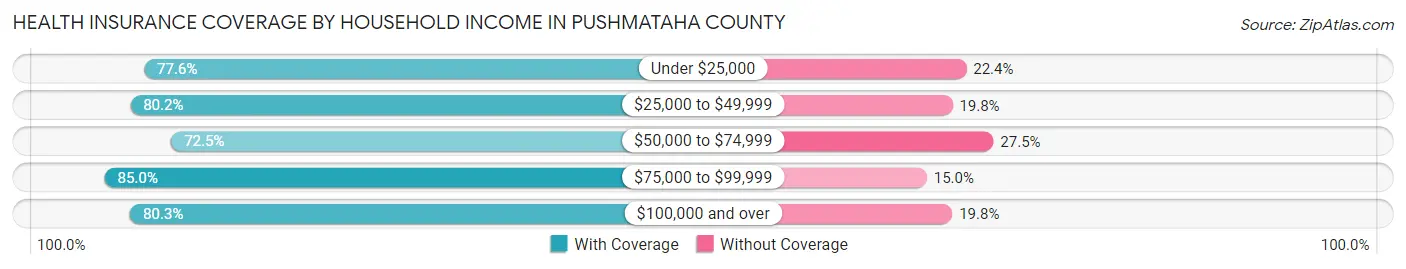
| Household Income | With Coverage | Without Coverage |
| Under $25,000 | 1,907 (77.6%) | 550 (22.4%) |
| $25,000 to $49,999 | 2,116 (80.2%) | 522 (19.8%) |
| $50,000 to $74,999 | 1,851 (72.5%) | 701 (27.5%) |
| $75,000 to $99,999 | 981 (85.0%) | 173 (15.0%) |
| $100,000 and over | 1,544 (80.2%) | 380 (19.8%) |
Public vs Private Health Insurance Coverage by Age in Pushmataha County
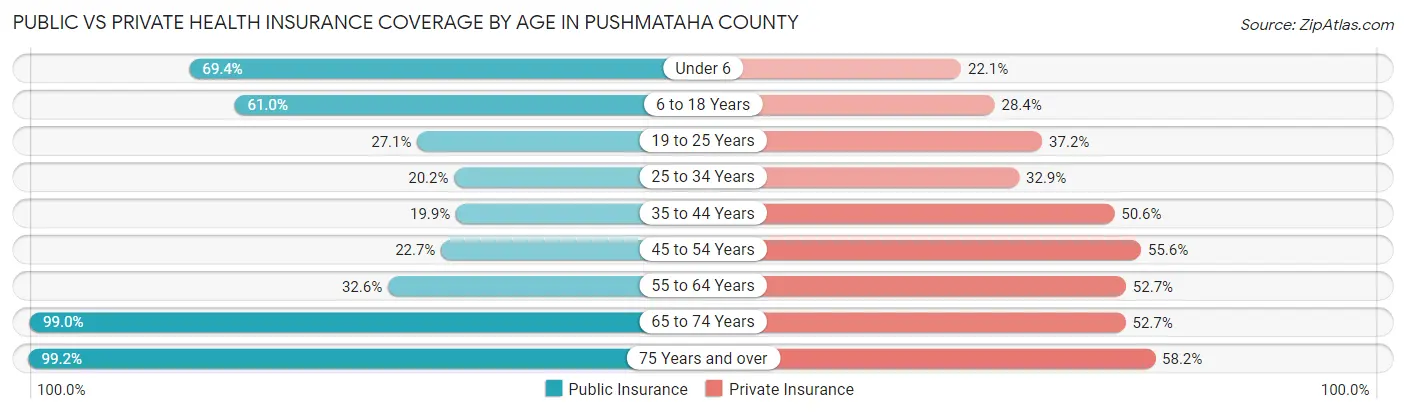
| Age Bracket | Public Insurance | Private Insurance |
| Under 6 | 508 (69.4%) | 162 (22.1%) |
| 6 to 18 Years | 1,104 (61.0%) | 513 (28.4%) |
| 19 to 25 Years | 183 (27.1%) | 251 (37.2%) |
| 25 to 34 Years | 206 (20.2%) | 335 (32.9%) |
| 35 to 44 Years | 239 (19.9%) | 607 (50.6%) |
| 45 to 54 Years | 282 (22.7%) | 691 (55.5%) |
| 55 to 64 Years | 537 (32.6%) | 870 (52.7%) |
| 65 to 74 Years | 1,334 (99.0%) | 710 (52.7%) |
| 75 Years and over | 1,041 (99.2%) | 610 (58.2%) |
| Total | 5,434 (50.7%) | 4,749 (44.3%) |
Disability Status by Sex by Age in Pushmataha County
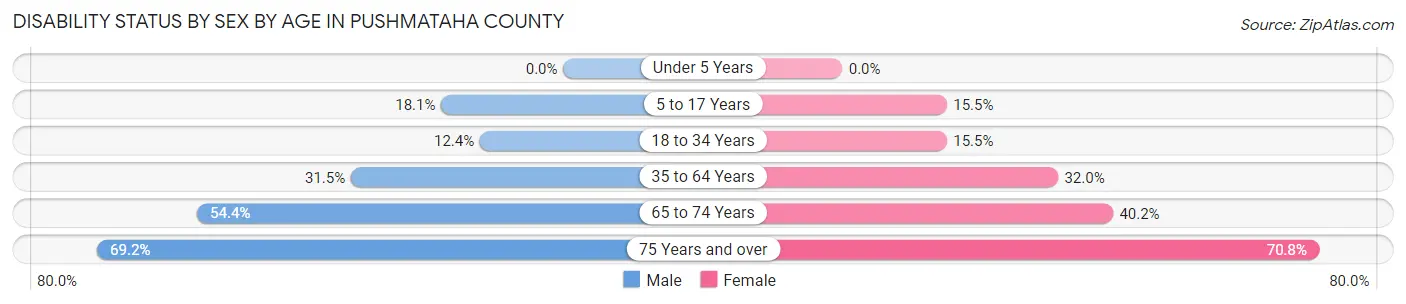
| Age Bracket | Male | Female |
| Under 5 Years | 0 (0.0%) | 0 (0.0%) |
| 5 to 17 Years | 162 (18.1%) | 131 (15.5%) |
| 18 to 34 Years | 120 (12.4%) | 146 (15.5%) |
| 35 to 64 Years | 630 (31.5%) | 671 (32.0%) |
| 65 to 74 Years | 342 (54.4%) | 289 (40.2%) |
| 75 Years and over | 344 (69.2%) | 391 (70.8%) |
Disability Class by Sex by Age in Pushmataha County
Disability Class: Hearing Difficulty
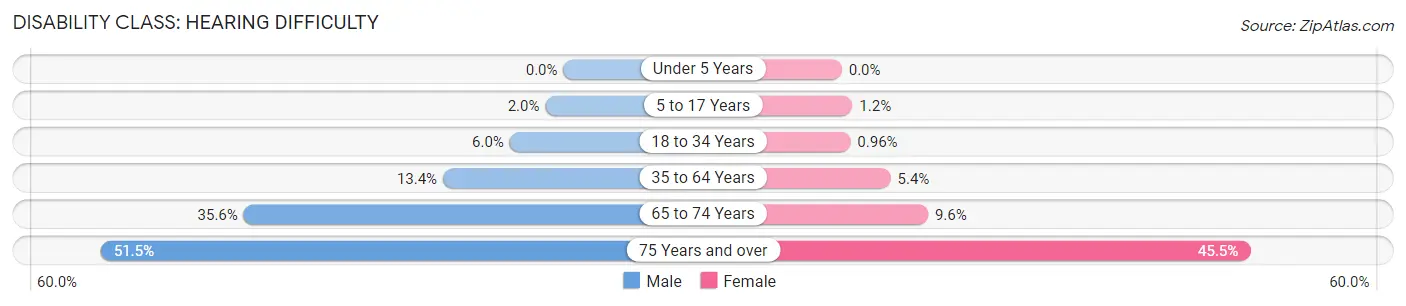
| Age Bracket | Male | Female |
| Under 5 Years | 0 (0.0%) | 0 (0.0%) |
| 5 to 17 Years | 18 (2.0%) | 10 (1.2%) |
| 18 to 34 Years | 58 (6.0%) | 9 (1.0%) |
| 35 to 64 Years | 268 (13.4%) | 114 (5.4%) |
| 65 to 74 Years | 224 (35.6%) | 69 (9.6%) |
| 75 Years and over | 256 (51.5%) | 251 (45.5%) |
Disability Class: Vision Difficulty
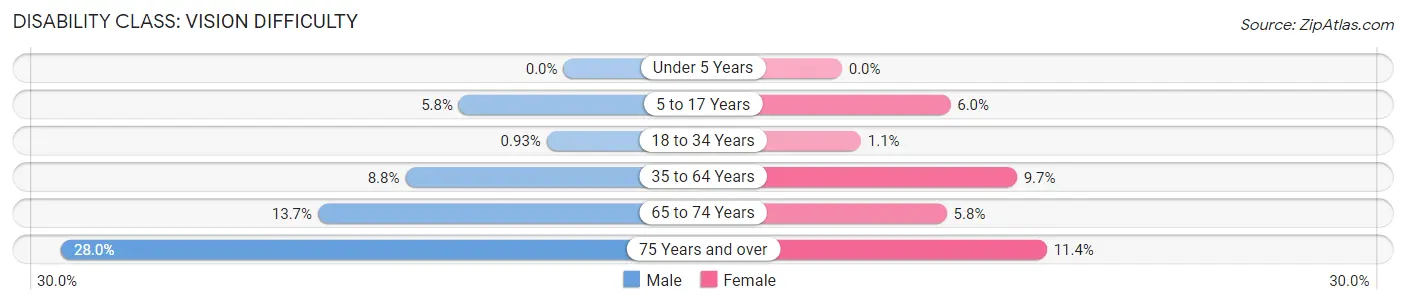
| Age Bracket | Male | Female |
| Under 5 Years | 0 (0.0%) | 0 (0.0%) |
| 5 to 17 Years | 52 (5.8%) | 51 (6.0%) |
| 18 to 34 Years | 9 (0.9%) | 10 (1.1%) |
| 35 to 64 Years | 176 (8.8%) | 204 (9.7%) |
| 65 to 74 Years | 86 (13.7%) | 42 (5.8%) |
| 75 Years and over | 139 (28.0%) | 63 (11.4%) |
Disability Class: Cognitive Difficulty
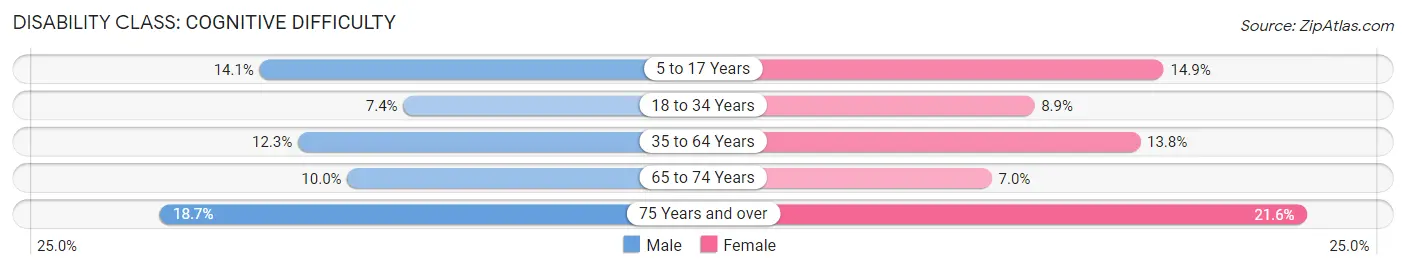
| Age Bracket | Male | Female |
| 5 to 17 Years | 126 (14.1%) | 126 (14.9%) |
| 18 to 34 Years | 72 (7.4%) | 84 (8.9%) |
| 35 to 64 Years | 246 (12.3%) | 290 (13.8%) |
| 65 to 74 Years | 63 (10.0%) | 50 (7.0%) |
| 75 Years and over | 93 (18.7%) | 119 (21.6%) |
Disability Class: Ambulatory Difficulty
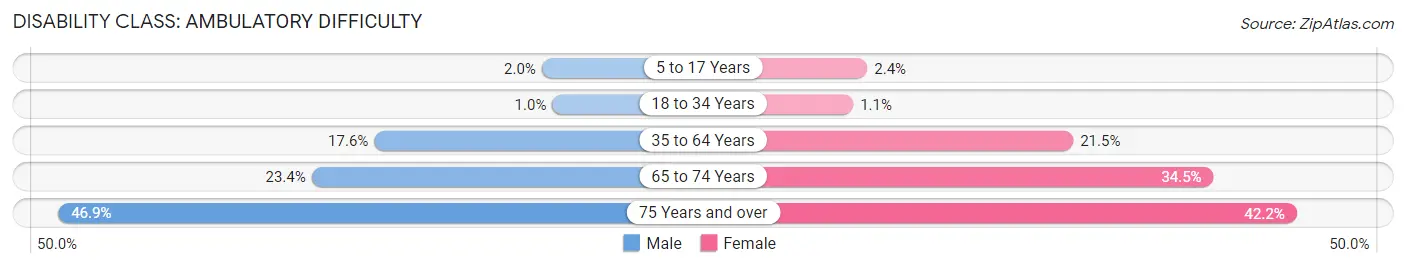
| Age Bracket | Male | Female |
| 5 to 17 Years | 18 (2.0%) | 20 (2.4%) |
| 18 to 34 Years | 10 (1.0%) | 10 (1.1%) |
| 35 to 64 Years | 351 (17.6%) | 450 (21.5%) |
| 65 to 74 Years | 147 (23.4%) | 248 (34.5%) |
| 75 Years and over | 233 (46.9%) | 233 (42.2%) |
Disability Class: Self-Care Difficulty
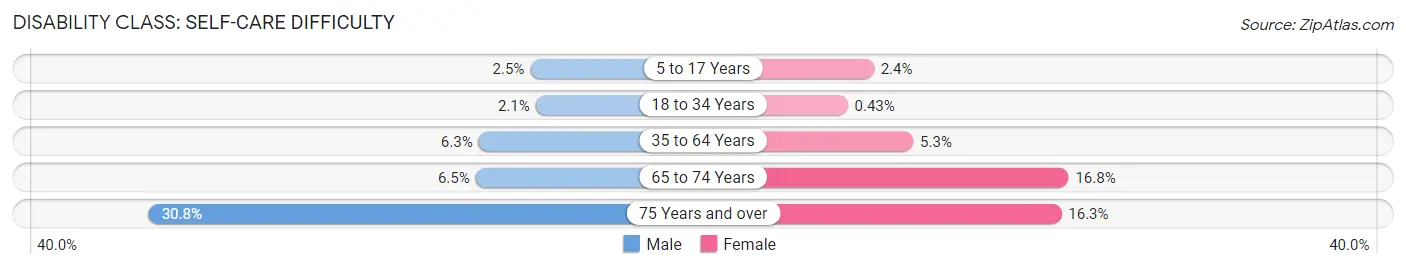
| Age Bracket | Male | Female |
| 5 to 17 Years | 22 (2.5%) | 20 (2.4%) |
| 18 to 34 Years | 20 (2.1%) | 4 (0.4%) |
| 35 to 64 Years | 126 (6.3%) | 111 (5.3%) |
| 65 to 74 Years | 41 (6.5%) | 121 (16.8%) |
| 75 Years and over | 153 (30.8%) | 90 (16.3%) |
Technology Access in Pushmataha County
Computing Device Access in Pushmataha County
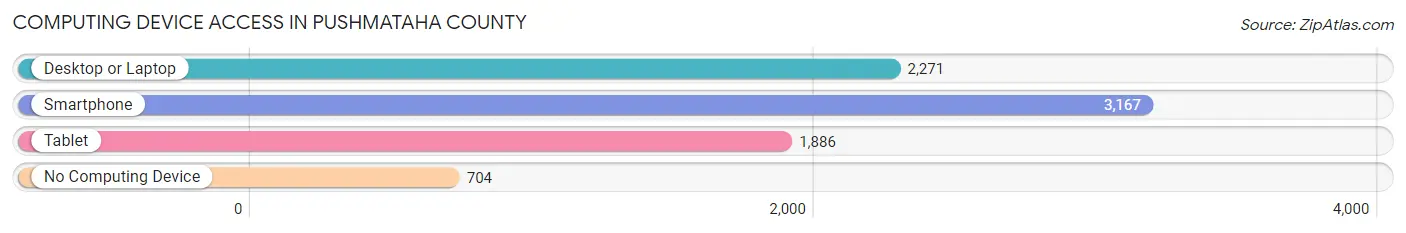
| Device Type | # Households | % Households |
| Desktop or Laptop | 2,271 | 53.7% |
| Smartphone | 3,167 | 74.9% |
| Tablet | 1,886 | 44.6% |
| No Computing Device | 704 | 16.7% |
| Total | 4,229 | 100.0% |
Internet Access in Pushmataha County
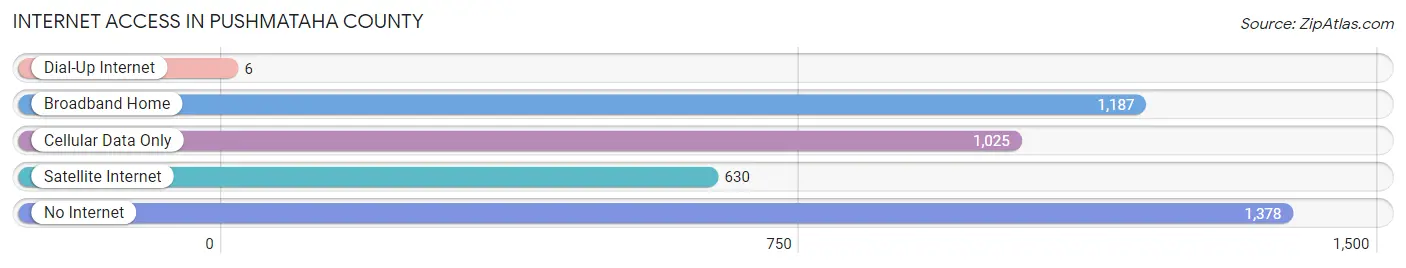
| Internet Type | # Households | % Households |
| Dial-Up Internet | 6 | 0.1% |
| Broadband Home | 1,187 | 28.1% |
| Cellular Data Only | 1,025 | 24.2% |
| Satellite Internet | 630 | 14.9% |
| No Internet | 1,378 | 32.6% |
| Total | 4,229 | 100.0% |
Pushmataha County Summary
Mataha County is located in southeastern Oklahoma and is part of the Choctaw Nation. It is bordered by McCurtain County to the north, Pushmataha County to the east, Atoka County to the south, and Le Flore County to the west. The county seat is Antlers, and the largest city is Clayton. The county was named after the Choctaw leader Pushmataha, who was a leader in the Choctaw Nation during the early 19th century.
Geography
Mataha County covers an area of 1,072 square miles and is located in the Ouachita Mountains region of Oklahoma. The terrain is mostly hilly and forested, with some open areas. The highest point in the county is located in the Ouachita Mountains, at an elevation of 1,890 feet. The county is drained by the Kiamichi River, which flows through the county from north to south.
Climate
Mataha County has a humid subtropical climate, with hot summers and mild winters. The average annual temperature is 64°F, and the average annual precipitation is 44 inches.
Demographics
As of the 2010 census, the population of Mataha County was 8,945. The racial makeup of the county was 79.3% White, 15.2% Native American, 0.3% Asian, 0.2% Black or African American, 0.1% Pacific Islander, and 4.9% from two or more races. The median household income was $30,945, and the median family income was $35,945.
Economy
Mataha County's economy is largely based on agriculture and forestry. The county is home to several large timber companies, and the timber industry is the largest employer in the county. Other major industries include cattle ranching, poultry farming, and oil and gas production. The county also has a growing tourism industry, with several popular attractions, including the Kiamichi Mountains, the Ouachita National Forest, and the Pushmataha Wildlife Management Area.
Education
Mataha County is served by the Pushmataha County School District, which operates seven elementary schools, two middle schools, and one high school. The county also has several private schools, including Clayton Christian Academy and Antlers Christian Academy.
Transportation
Mataha County is served by two major highways, US Highway 271 and State Highway 3. The county is also served by the Kiamichi Railroad, which runs through the county from north to south.
Conclusion
Mataha County is a rural county located in southeastern Oklahoma. It is home to a diverse population and a strong economy based on agriculture and forestry. The county is served by two major highways and the Kiamichi Railroad, and is home to several popular attractions. The county is served by the Pushmataha County School District, which operates seven elementary schools, two middle schools, and one high school.
Common Questions
What is Per Capita Income in Pushmataha County?
Per Capita income in Pushmataha County is $23,393.
What is the Median Family Income in Pushmataha County?
Median Family Income in Pushmataha County is $53,688.
What is the Median Household income in Pushmataha County?
Median Household Income in Pushmataha County is $42,274.
What is Income or Wage Gap in Pushmataha County?
Income or Wage Gap in Pushmataha County is 35.1%.
Women in Pushmataha County earn 64.9 cents for every dollar earned by a man.
What is Family Income Deficit in Pushmataha County?
Family Income Deficit in Pushmataha County is $9,833.
Families that are below poverty line in Pushmataha County earn $9,833 less on average than the poverty threshold level.
What is Inequality or Gini Index in Pushmataha County?
Inequality or Gini Index in Pushmataha County is 0.46.
What is the Total Population of Pushmataha County?
Total Population of Pushmataha County is 10,845.
What is the Total Male Population of Pushmataha County?
Total Male Population of Pushmataha County is 5,312.
What is the Total Female Population of Pushmataha County?
Total Female Population of Pushmataha County is 5,533.
What is the Ratio of Males per 100 Females in Pushmataha County?
There are 96.01 Males per 100 Females in Pushmataha County.
What is the Ratio of Females per 100 Males in Pushmataha County?
There are 104.16 Females per 100 Males in Pushmataha County.
What is the Median Population Age in Pushmataha County?
Median Population Age in Pushmataha County is 44.0 Years.
What is the Average Family Size in Pushmataha County
Average Family Size in Pushmataha County is 3.1 People.
What is the Average Household Size in Pushmataha County
Average Household Size in Pushmataha County is 2.5 People.
How Large is the Labor Force in Pushmataha County?
There are 4,019 People in the Labor Forcein in Pushmataha County.
What is the Percentage of People in the Labor Force in Pushmataha County?
45.8% of People are in the Labor Force in Pushmataha County.
What is the Unemployment Rate in Pushmataha County?
Unemployment Rate in Pushmataha County is 9.0%.