Pawnee County, OK Map & Demographics
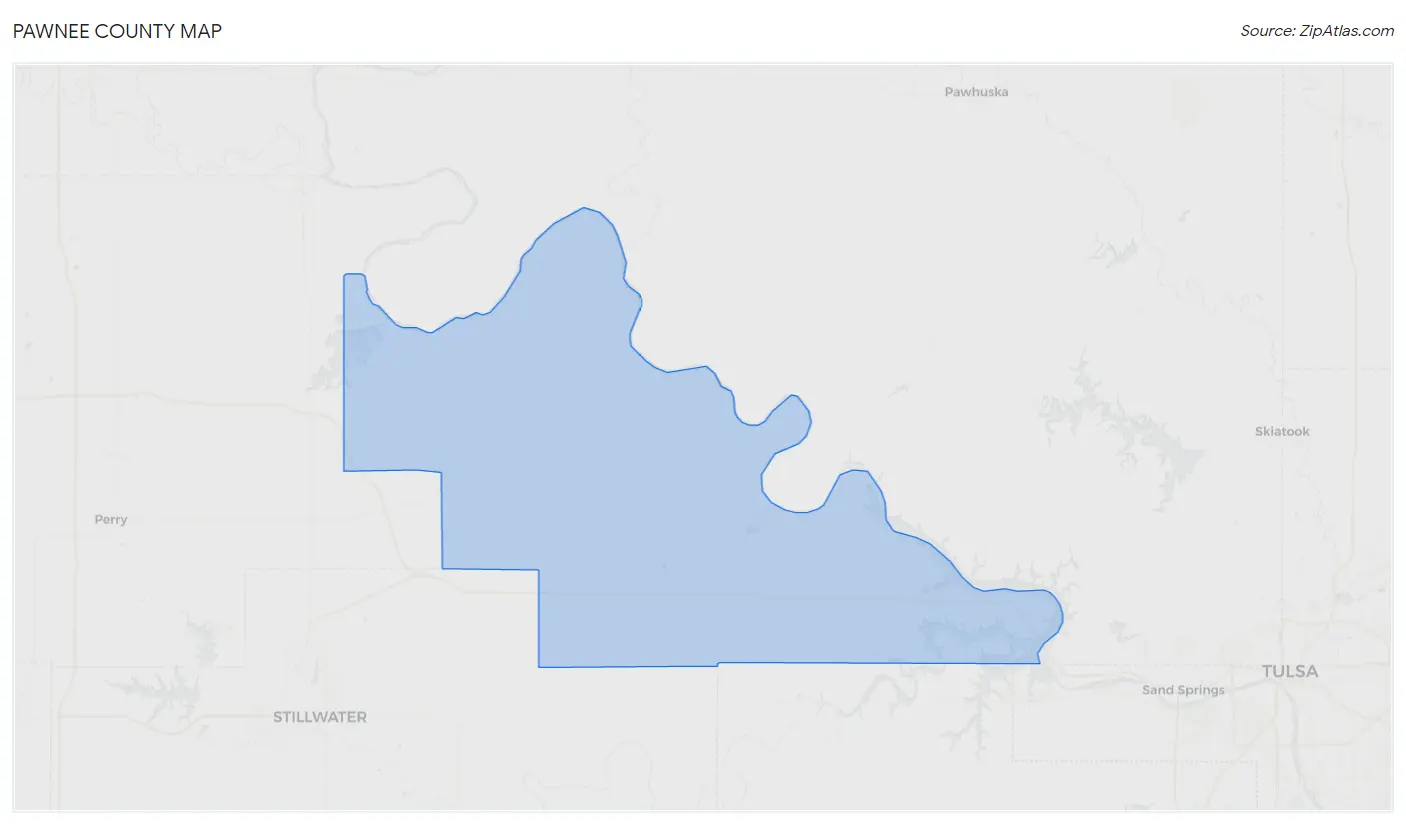
Pawnee County Map
Pawnee County Overview
$28,327
PER CAPITA INCOME
$69,395
AVG FAMILY INCOME
$56,279
AVG HOUSEHOLD INCOME
31.2%
WAGE / INCOME GAP [ % ]
68.8¢/ $1
WAGE / INCOME GAP [ $ ]
$11,217
FAMILY INCOME DEFICIT
0.43
INEQUALITY / GINI INDEX
15,682
TOTAL POPULATION
7,957
MALE POPULATION
7,725
FEMALE POPULATION
103.00
MALES / 100 FEMALES
97.08
FEMALES / 100 MALES
41.5
MEDIAN AGE
3.1
AVG FAMILY SIZE
2.6
AVG HOUSEHOLD SIZE
6,783
LABOR FORCE [ PEOPLE ]
54.6%
PERCENT IN LABOR FORCE
3.5%
UNEMPLOYMENT RATE
Pawnee County Area Codes
Income in Pawnee County
Income Overview in Pawnee County
Per Capita Income in Pawnee County is $28,327, while median incomes of families and households are $69,395 and $56,279 respectively.
| Characteristic | Number | Measure |
| Per Capita Income | 15,682 | $28,327 |
| Median Family Income | 4,232 | $69,395 |
| Mean Family Income | 4,232 | $85,430 |
| Median Household Income | 5,959 | $56,279 |
| Mean Household Income | 5,959 | $72,849 |
| Income Deficit | 4,232 | $11,217 |
| Wage / Income Gap (%) | 15,682 | 31.20% |
| Wage / Income Gap ($) | 15,682 | 68.80¢ per $1 |
| Gini / Inequality Index | 15,682 | 0.43 |
Earnings by Sex in Pawnee County
Average Earnings in Pawnee County are $37,815, $45,040 for men and $30,987 for women, a difference of 31.2%.
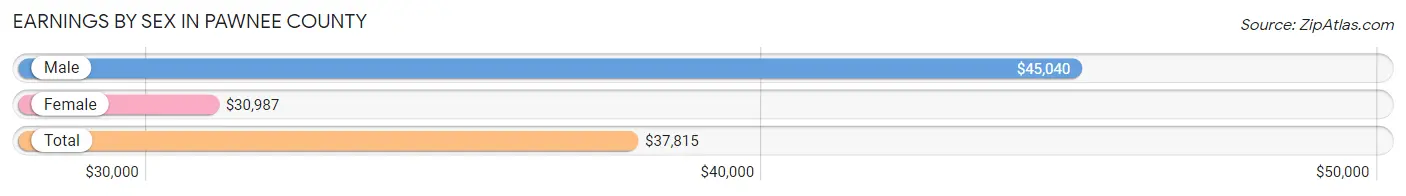
| Sex | Number | Average Earnings |
| Male | 3,948 (56.2%) | $45,040 |
| Female | 3,080 (43.8%) | $30,987 |
| Total | 7,028 (100.0%) | $37,815 |
Earnings by Sex by Income Bracket in Pawnee County
The most common earnings brackets in Pawnee County are $75,000 to $99,999 for men (495 | 12.5%) and $30,000 to $34,999 for women (261 | 8.5%).
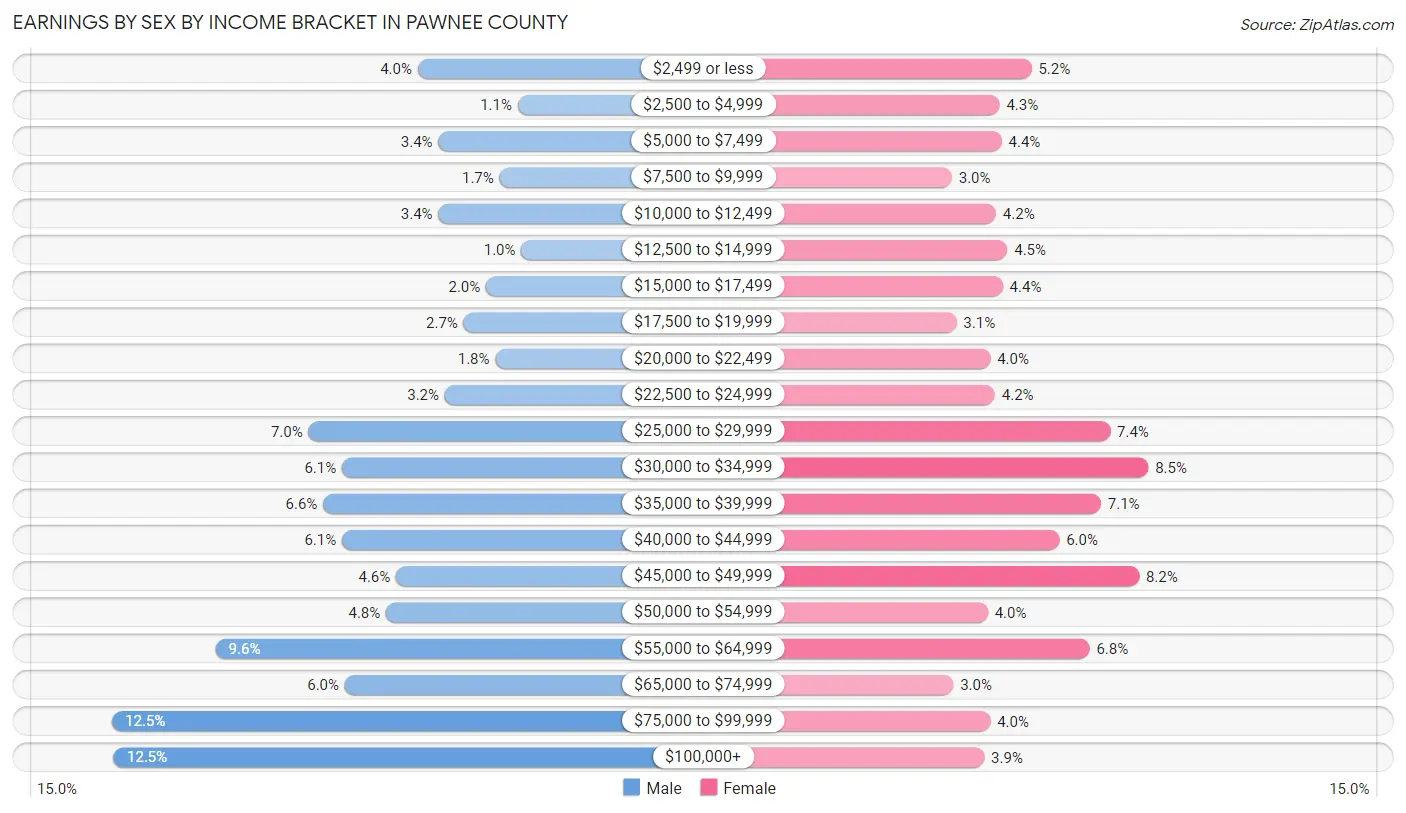
| Income | Male | Female |
| $2,499 or less | 156 (4.0%) | 160 (5.2%) |
| $2,500 to $4,999 | 45 (1.1%) | 132 (4.3%) |
| $5,000 to $7,499 | 133 (3.4%) | 134 (4.3%) |
| $7,500 to $9,999 | 65 (1.7%) | 91 (2.9%) |
| $10,000 to $12,499 | 133 (3.4%) | 129 (4.2%) |
| $12,500 to $14,999 | 41 (1.0%) | 139 (4.5%) |
| $15,000 to $17,499 | 80 (2.0%) | 135 (4.4%) |
| $17,500 to $19,999 | 105 (2.7%) | 95 (3.1%) |
| $20,000 to $22,499 | 70 (1.8%) | 124 (4.0%) |
| $22,500 to $24,999 | 126 (3.2%) | 128 (4.2%) |
| $25,000 to $29,999 | 277 (7.0%) | 228 (7.4%) |
| $30,000 to $34,999 | 240 (6.1%) | 261 (8.5%) |
| $35,000 to $39,999 | 261 (6.6%) | 220 (7.1%) |
| $40,000 to $44,999 | 240 (6.1%) | 184 (6.0%) |
| $45,000 to $49,999 | 180 (4.6%) | 253 (8.2%) |
| $50,000 to $54,999 | 191 (4.8%) | 122 (4.0%) |
| $55,000 to $64,999 | 380 (9.6%) | 210 (6.8%) |
| $65,000 to $74,999 | 237 (6.0%) | 92 (3.0%) |
| $75,000 to $99,999 | 495 (12.5%) | 124 (4.0%) |
| $100,000+ | 493 (12.5%) | 119 (3.9%) |
| Total | 3,948 (100.0%) | 3,080 (100.0%) |
Earnings by Sex by Educational Attainment in Pawnee County
Average earnings in Pawnee County are $51,191 for men and $34,112 for women, a difference of 33.4%. Men with an educational attainment of graduate degree enjoy the highest average annual earnings of $101,442, while those with less than high school education earn the least with $35,964. Women with an educational attainment of graduate degree earn the most with the average annual earnings of $57,917, while those with less than high school education have the smallest earnings of $12,656.
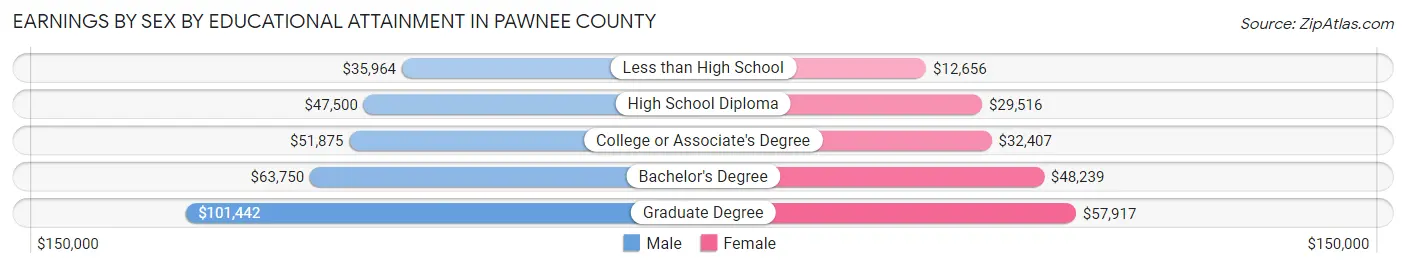
| Educational Attainment | Male Income | Female Income |
| Less than High School | $35,964 | $12,656 |
| High School Diploma | $47,500 | $29,516 |
| College or Associate's Degree | $51,875 | $32,407 |
| Bachelor's Degree | $63,750 | $48,239 |
| Graduate Degree | $101,442 | $57,917 |
| Total | $51,191 | $34,112 |
Family Income in Pawnee County
Family Income Brackets in Pawnee County
According to the Pawnee County family income data, there are 863 families falling into the $50,000 to $74,999 income range, which is the most common income bracket and makes up 20.4% of all families. Conversely, the $10,000 to $14,999 income bracket is the least frequent group with only 93 families (2.2%) belonging to this category.
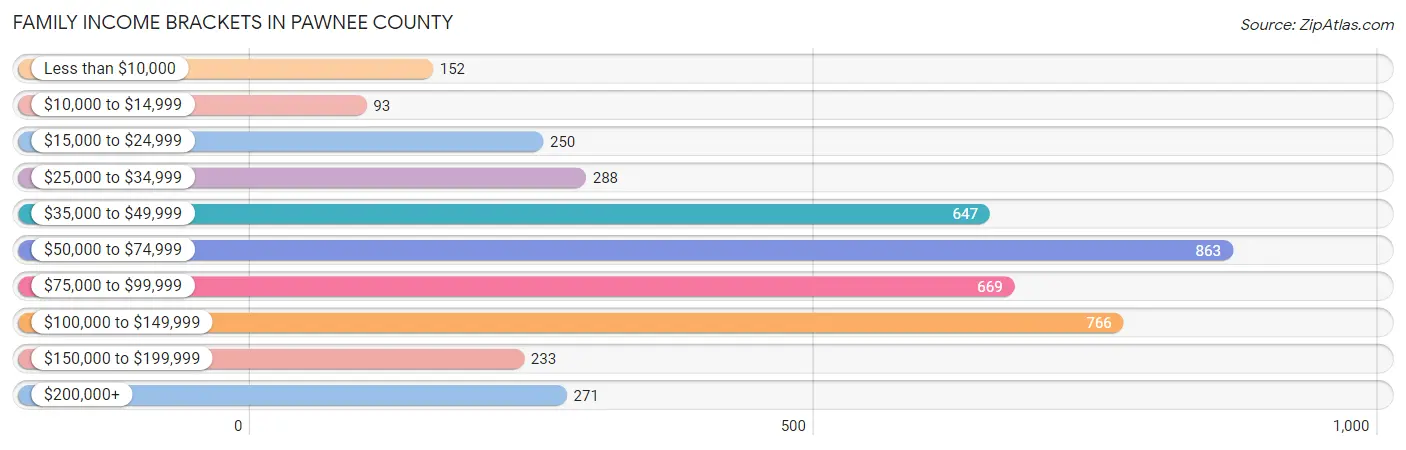
| Income Bracket | # Families | % Families |
| Less than $10,000 | 152 | 3.6% |
| $10,000 to $14,999 | 93 | 2.2% |
| $15,000 to $24,999 | 250 | 5.9% |
| $25,000 to $34,999 | 288 | 6.8% |
| $35,000 to $49,999 | 647 | 15.3% |
| $50,000 to $74,999 | 863 | 20.4% |
| $75,000 to $99,999 | 669 | 15.8% |
| $100,000 to $149,999 | 766 | 18.1% |
| $150,000 to $199,999 | 233 | 5.5% |
| $200,000+ | 271 | 6.4% |
Family Income by Famaliy Size in Pawnee County
4-person families (595 | 14.1%) account for the highest median family income in Pawnee County with $101,953 per family, while 2-person families (2,323 | 54.9%) have the highest median income of $31,060 per family member.
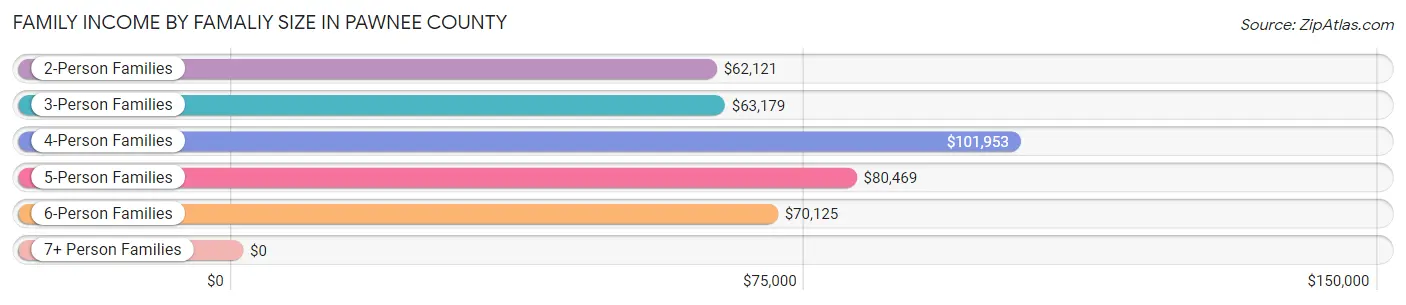
| Income Bracket | # Families | Median Income |
| 2-Person Families | 2,323 (54.9%) | $62,121 |
| 3-Person Families | 755 (17.8%) | $63,179 |
| 4-Person Families | 595 (14.1%) | $101,953 |
| 5-Person Families | 277 (6.6%) | $80,469 |
| 6-Person Families | 186 (4.4%) | $70,125 |
| 7+ Person Families | 96 (2.3%) | $0 |
| Total | 4,232 (100.0%) | $69,395 |
Family Income by Number of Earners in Pawnee County
The median family income in Pawnee County is $69,395, with families comprising 3+ earners (262) having the highest median family income of $124,250, while families with no earners (803) have the lowest median family income of $38,192, accounting for 6.2% and 19.0% of families, respectively.
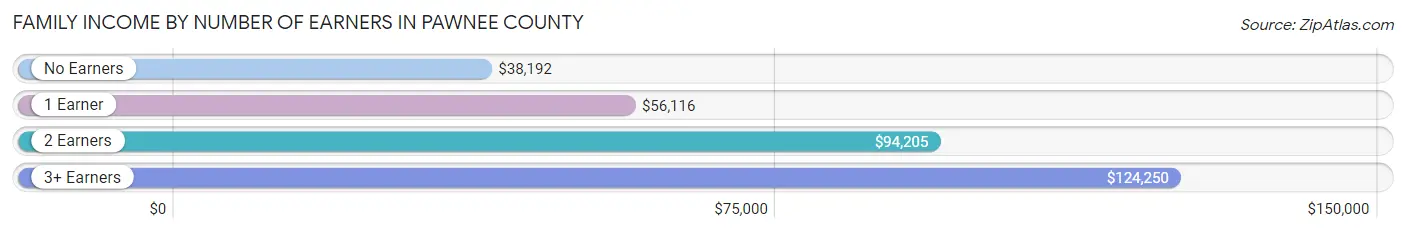
| Number of Earners | # Families | Median Income |
| No Earners | 803 (19.0%) | $38,192 |
| 1 Earner | 1,584 (37.4%) | $56,116 |
| 2 Earners | 1,583 (37.4%) | $94,205 |
| 3+ Earners | 262 (6.2%) | $124,250 |
| Total | 4,232 (100.0%) | $69,395 |
Household Income in Pawnee County
Household Income Brackets in Pawnee County
With 1,079 households falling in the category, the $50,000 to $74,999 income range is the most frequent in Pawnee County, accounting for 18.1% of all households. In contrast, only 244 households (4.1%) fall into the $150,000 to $199,999 income bracket, making it the least populous group.
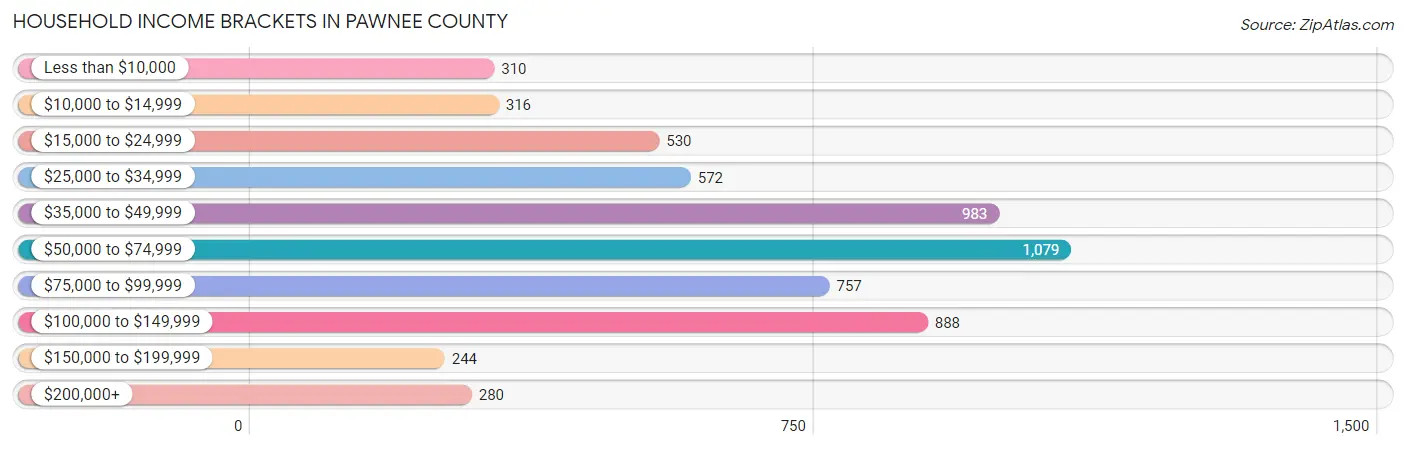
| Income Bracket | # Households | % Households |
| Less than $10,000 | 310 | 5.2% |
| $10,000 to $14,999 | 316 | 5.3% |
| $15,000 to $24,999 | 530 | 8.9% |
| $25,000 to $34,999 | 572 | 9.6% |
| $35,000 to $49,999 | 983 | 16.5% |
| $50,000 to $74,999 | 1,079 | 18.1% |
| $75,000 to $99,999 | 757 | 12.7% |
| $100,000 to $149,999 | 888 | 14.9% |
| $150,000 to $199,999 | 244 | 4.1% |
| $200,000+ | 280 | 4.7% |
Household Income by Householder Age in Pawnee County
The median household income in Pawnee County is $56,279, with the highest median household income of $70,205 found in the 25 to 44 years age bracket for the primary householder. A total of 1,601 households (26.9%) fall into this category. Meanwhile, the 15 to 24 years age bracket for the primary householder has the lowest median household income of $39,427, with 215 households (3.6%) in this group.
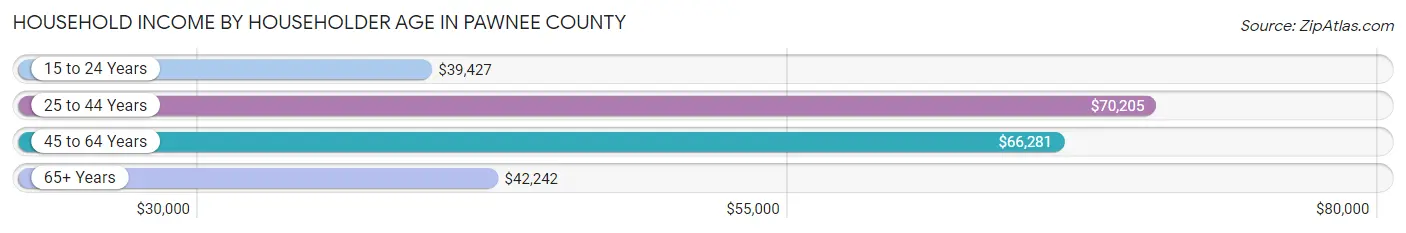
| Income Bracket | # Households | Median Income |
| 15 to 24 Years | 215 (3.6%) | $39,427 |
| 25 to 44 Years | 1,601 (26.9%) | $70,205 |
| 45 to 64 Years | 2,315 (38.9%) | $66,281 |
| 65+ Years | 1,828 (30.7%) | $42,242 |
| Total | 5,959 (100.0%) | $56,279 |
Poverty in Pawnee County
Income Below Poverty by Sex and Age in Pawnee County
With 14.1% poverty level for males and 16.1% for females among the residents of Pawnee County, 5 year old males and 5 year old females are the most vulnerable to poverty, with 24 males (30.4%) and 22 females (26.8%) in their respective age groups living below the poverty level.
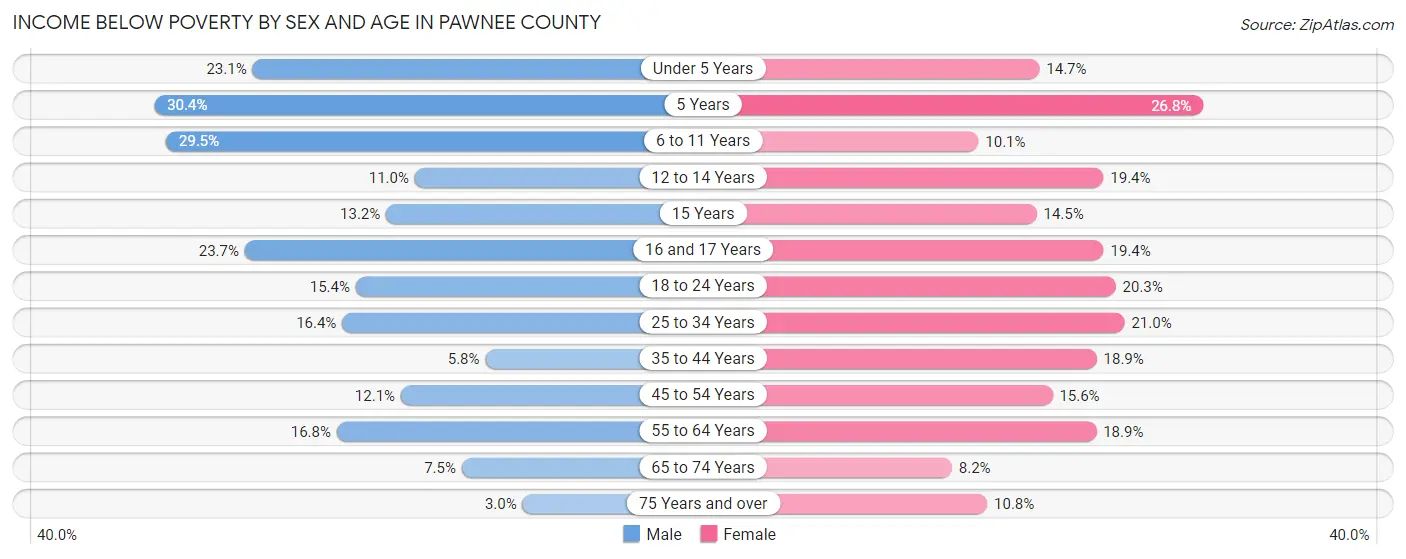
| Age Bracket | Male | Female |
| Under 5 Years | 108 (23.1%) | 60 (14.7%) |
| 5 Years | 24 (30.4%) | 22 (26.8%) |
| 6 to 11 Years | 170 (29.5%) | 57 (10.1%) |
| 12 to 14 Years | 47 (11.0%) | 67 (19.4%) |
| 15 Years | 20 (13.2%) | 12 (14.5%) |
| 16 and 17 Years | 48 (23.6%) | 42 (19.4%) |
| 18 to 24 Years | 102 (15.4%) | 112 (20.3%) |
| 25 to 34 Years | 145 (16.4%) | 174 (21.0%) |
| 35 to 44 Years | 54 (5.8%) | 175 (18.9%) |
| 45 to 54 Years | 120 (12.1%) | 153 (15.6%) |
| 55 to 64 Years | 182 (16.8%) | 204 (18.9%) |
| 65 to 74 Years | 63 (7.5%) | 75 (8.2%) |
| 75 Years and over | 16 (3.0%) | 67 (10.8%) |
| Total | 1,099 (14.1%) | 1,220 (16.1%) |
Income Above Poverty by Sex and Age in Pawnee County
According to the poverty statistics in Pawnee County, males aged 75 years and over and females aged 65 to 74 years are the age groups that are most secure financially, with 97.0% of males and 91.8% of females in these age groups living above the poverty line.
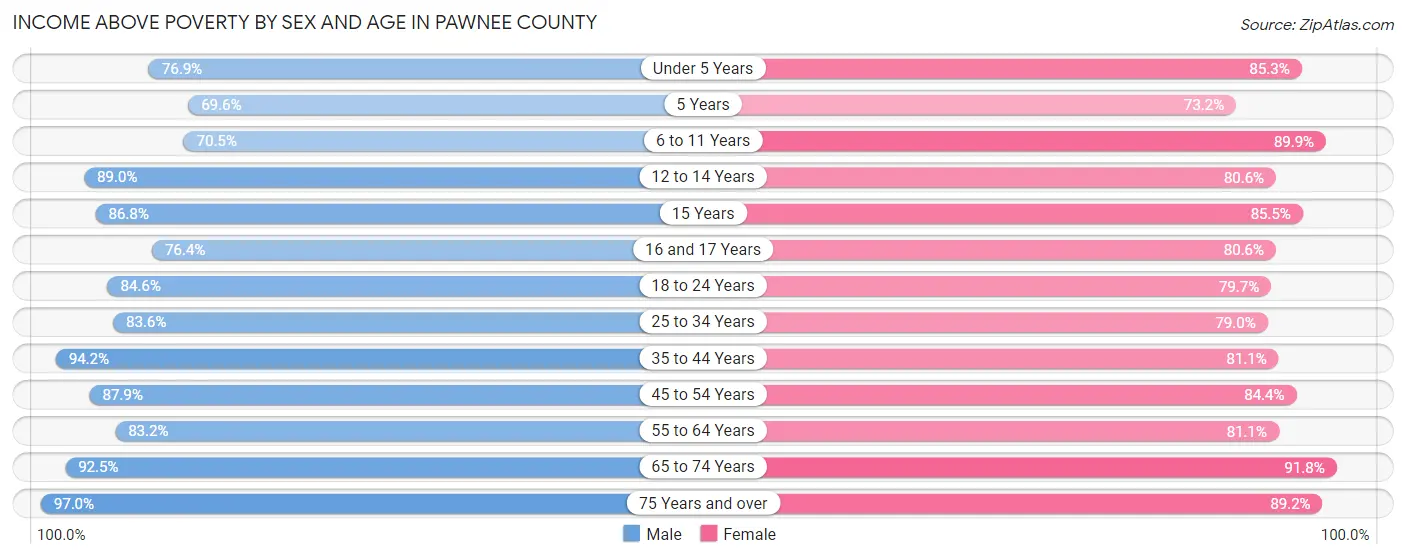
| Age Bracket | Male | Female |
| Under 5 Years | 360 (76.9%) | 349 (85.3%) |
| 5 Years | 55 (69.6%) | 60 (73.2%) |
| 6 to 11 Years | 406 (70.5%) | 505 (89.9%) |
| 12 to 14 Years | 379 (89.0%) | 278 (80.6%) |
| 15 Years | 132 (86.8%) | 71 (85.5%) |
| 16 and 17 Years | 155 (76.3%) | 174 (80.6%) |
| 18 to 24 Years | 560 (84.6%) | 439 (79.7%) |
| 25 to 34 Years | 738 (83.6%) | 655 (79.0%) |
| 35 to 44 Years | 879 (94.2%) | 750 (81.1%) |
| 45 to 54 Years | 875 (87.9%) | 825 (84.4%) |
| 55 to 64 Years | 900 (83.2%) | 876 (81.1%) |
| 65 to 74 Years | 772 (92.5%) | 843 (91.8%) |
| 75 Years and over | 512 (97.0%) | 554 (89.2%) |
| Total | 6,723 (86.0%) | 6,379 (84.0%) |
Income Below Poverty Among Married-Couple Families in Pawnee County
The poverty statistics for married-couple families in Pawnee County show that 5.5% or 178 of the total 3,246 families live below the poverty line. Families with 3 or 4 children have the highest poverty rate of 17.7%, comprising of 54 families. On the other hand, families with 5 or more children have the lowest poverty rate of 0.0%, which includes 0 families.
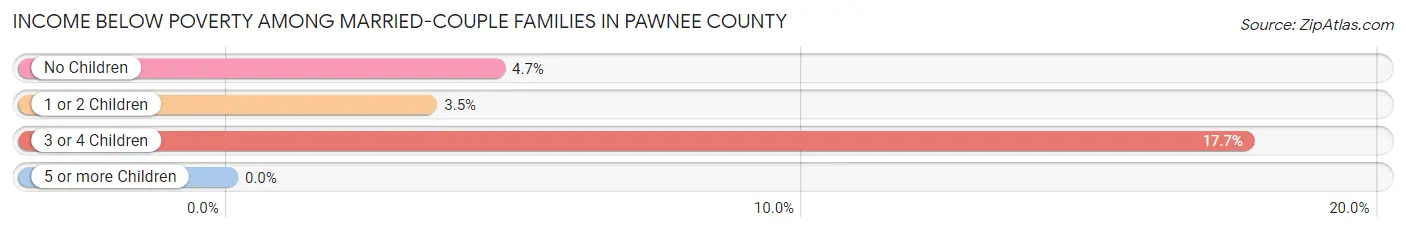
| Children | Above Poverty | Below Poverty |
| No Children | 1,886 (95.4%) | 92 (4.6%) |
| 1 or 2 Children | 890 (96.5%) | 32 (3.5%) |
| 3 or 4 Children | 251 (82.3%) | 54 (17.7%) |
| 5 or more Children | 41 (100.0%) | 0 (0.0%) |
| Total | 3,068 (94.5%) | 178 (5.5%) |
Income Below Poverty Among Single-Parent Households in Pawnee County
According to the poverty data in Pawnee County, 17.8% or 56 single-father households and 32.7% or 220 single-mother households are living below the poverty line. Among single-father households, those with 1 or 2 children have the highest poverty rate, with 52 households (33.1%) experiencing poverty. Likewise, among single-mother households, those with 5 or more children have the highest poverty rate, with 7 households (100.0%) falling below the poverty line.
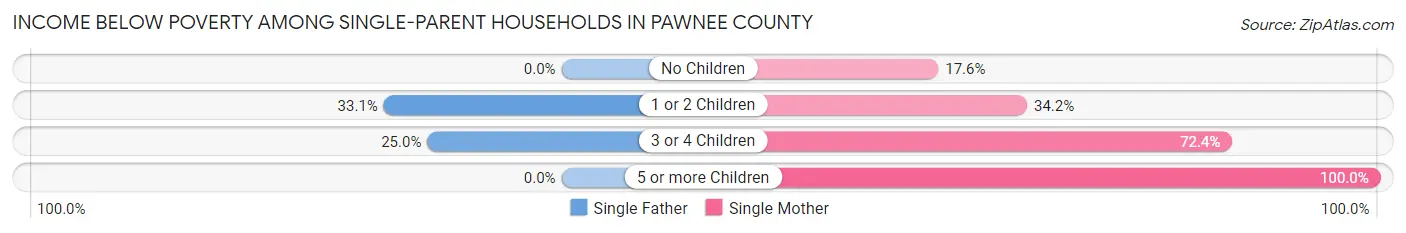
| Children | Single Father | Single Mother |
| No Children | 0 (0.0%) | 46 (17.6%) |
| 1 or 2 Children | 52 (33.1%) | 112 (34.2%) |
| 3 or 4 Children | 4 (25.0%) | 55 (72.4%) |
| 5 or more Children | 0 (0.0%) | 7 (100.0%) |
| Total | 56 (17.8%) | 220 (32.7%) |
Income Below Poverty Among Married-Couple vs Single-Parent Households in Pawnee County
The poverty data for Pawnee County shows that 178 of the married-couple family households (5.5%) and 276 of the single-parent households (28.0%) are living below the poverty level. Within the married-couple family households, those with 3 or 4 children have the highest poverty rate, with 54 households (17.7%) falling below the poverty line. Among the single-parent households, those with 5 or more children have the highest poverty rate, with 7 household (100.0%) living below poverty.
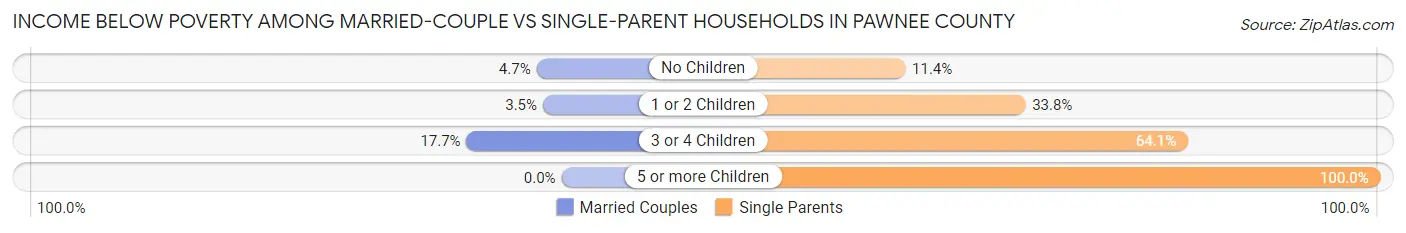
| Children | Married-Couple Families | Single-Parent Households |
| No Children | 92 (4.6%) | 46 (11.4%) |
| 1 or 2 Children | 32 (3.5%) | 164 (33.8%) |
| 3 or 4 Children | 54 (17.7%) | 59 (64.1%) |
| 5 or more Children | 0 (0.0%) | 7 (100.0%) |
| Total | 178 (5.5%) | 276 (28.0%) |
Race in Pawnee County
The most populous races in Pawnee County are White / Caucasian (11,985 | 76.4%), Two or more Races (1,884 | 12.0%), and Native / Alaskan (1,477 | 9.4%).
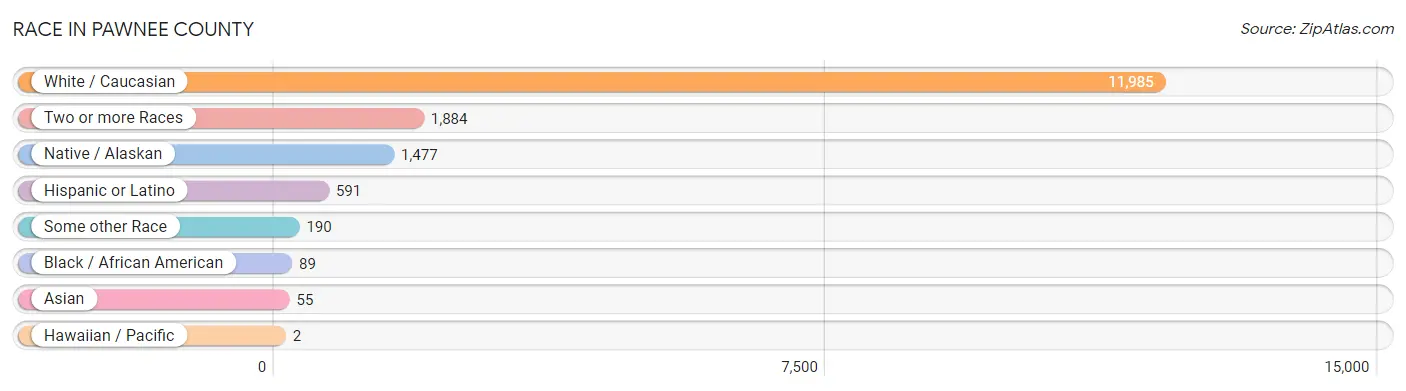
| Race | # Population | % Population |
| Asian | 55 | 0.4% |
| Black / African American | 89 | 0.6% |
| Hawaiian / Pacific | 2 | 0.0% |
| Hispanic or Latino | 591 | 3.8% |
| Native / Alaskan | 1,477 | 9.4% |
| White / Caucasian | 11,985 | 76.4% |
| Two or more Races | 1,884 | 12.0% |
| Some other Race | 190 | 1.2% |
| Total | 15,682 | 100.0% |
Ancestry in Pawnee County
The most populous ancestries reported in Pawnee County are German (2,399 | 15.3%), Irish (1,813 | 11.6%), English (1,675 | 10.7%), Cherokee (1,316 | 8.4%), and American (832 | 5.3%), together accounting for 51.2% of all Pawnee County residents.
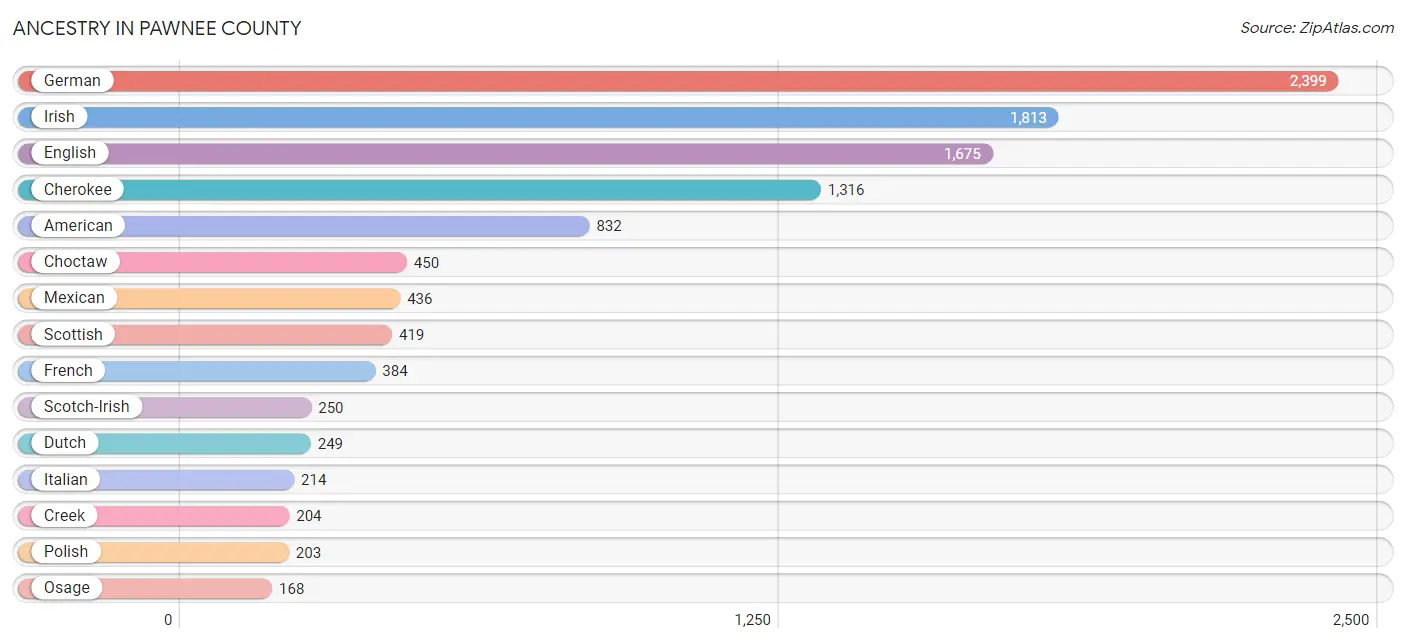
| Ancestry | # Population | % Population |
| Alaska Native | 4 | 0.0% |
| American | 832 | 5.3% |
| Apache | 23 | 0.2% |
| Arab | 86 | 0.5% |
| Armenian | 10 | 0.1% |
| Bhutanese | 7 | 0.0% |
| Blackfeet | 30 | 0.2% |
| British | 100 | 0.6% |
| Bulgarian | 7 | 0.0% |
| Burmese | 10 | 0.1% |
| Canadian | 2 | 0.0% |
| Central American | 18 | 0.1% |
| Cherokee | 1,316 | 8.4% |
| Cheyenne | 12 | 0.1% |
| Chickasaw | 72 | 0.5% |
| Choctaw | 450 | 2.9% |
| Colombian | 5 | 0.0% |
| Colville | 3 | 0.0% |
| Comanche | 23 | 0.2% |
| Creek | 204 | 1.3% |
| Croatian | 4 | 0.0% |
| Crow | 12 | 0.1% |
| Czech | 92 | 0.6% |
| Czechoslovakian | 5 | 0.0% |
| Danish | 72 | 0.5% |
| Delaware | 27 | 0.2% |
| Dutch | 249 | 1.6% |
| Dutch West Indian | 91 | 0.6% |
| Eastern European | 18 | 0.1% |
| Egyptian | 43 | 0.3% |
| English | 1,675 | 10.7% |
| European | 85 | 0.5% |
| Finnish | 24 | 0.2% |
| French | 384 | 2.5% |
| French Canadian | 28 | 0.2% |
| German | 2,399 | 15.3% |
| German Russian | 7 | 0.0% |
| Greek | 40 | 0.3% |
| Honduran | 18 | 0.1% |
| Hungarian | 7 | 0.0% |
| Inupiat | 5 | 0.0% |
| Iraqi | 12 | 0.1% |
| Irish | 1,813 | 11.6% |
| Iroquois | 14 | 0.1% |
| Italian | 214 | 1.4% |
| Kiowa | 12 | 0.1% |
| Korean | 19 | 0.1% |
| Lebanese | 8 | 0.1% |
| Mexican | 436 | 2.8% |
| Native Hawaiian | 19 | 0.1% |
| Navajo | 16 | 0.1% |
| Northern European | 15 | 0.1% |
| Norwegian | 111 | 0.7% |
| Osage | 168 | 1.1% |
| Pakistani | 13 | 0.1% |
| Palestinian | 19 | 0.1% |
| Polish | 203 | 1.3% |
| Potawatomi | 38 | 0.2% |
| Pueblo | 14 | 0.1% |
| Puerto Rican | 29 | 0.2% |
| Russian | 34 | 0.2% |
| Scandinavian | 73 | 0.5% |
| Scotch-Irish | 250 | 1.6% |
| Scottish | 419 | 2.7% |
| Seminole | 17 | 0.1% |
| Sioux | 27 | 0.2% |
| South American | 5 | 0.0% |
| Spaniard | 30 | 0.2% |
| Spanish | 28 | 0.2% |
| Sri Lankan | 32 | 0.2% |
| Subsaharan African | 20 | 0.1% |
| Swedish | 54 | 0.3% |
| Swiss | 17 | 0.1% |
| Thai | 22 | 0.1% |
| Welsh | 67 | 0.4% |
| Yugoslavian | 7 | 0.0% |
| Yuman | 6 | 0.0% | View All 77 Rows |
Immigrants in Pawnee County
The most numerous immigrant groups reported in Pawnee County came from Europe (70 | 0.4%), Latin America (39 | 0.3%), Eastern Europe (34 | 0.2%), Russia (34 | 0.2%), and England (31 | 0.2%), together accounting for 1.3% of all Pawnee County residents.
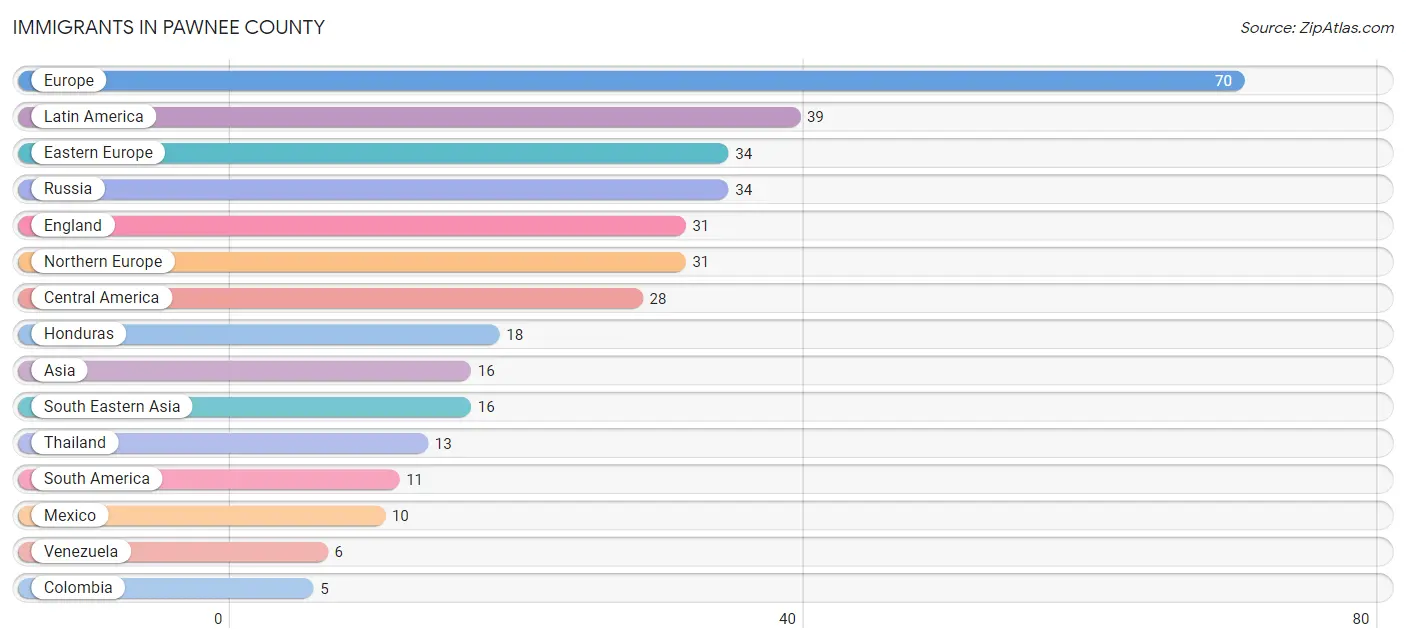
| Immigration Origin | # Population | % Population |
| Asia | 16 | 0.1% |
| Austria | 1 | 0.0% |
| Central America | 28 | 0.2% |
| Colombia | 5 | 0.0% |
| Eastern Europe | 34 | 0.2% |
| England | 31 | 0.2% |
| Europe | 70 | 0.4% |
| France | 2 | 0.0% |
| Germany | 2 | 0.0% |
| Honduras | 18 | 0.1% |
| Latin America | 39 | 0.3% |
| Mexico | 10 | 0.1% |
| Northern Europe | 31 | 0.2% |
| Philippines | 3 | 0.0% |
| Russia | 34 | 0.2% |
| South America | 11 | 0.1% |
| South Eastern Asia | 16 | 0.1% |
| Thailand | 13 | 0.1% |
| Venezuela | 6 | 0.0% |
| Western Europe | 5 | 0.0% | View All 20 Rows |
Sex and Age in Pawnee County
Sex and Age in Pawnee County
The most populous age groups in Pawnee County are 10 to 14 Years (612 | 7.7%) for men and 10 to 14 Years (579 | 7.5%) for women.
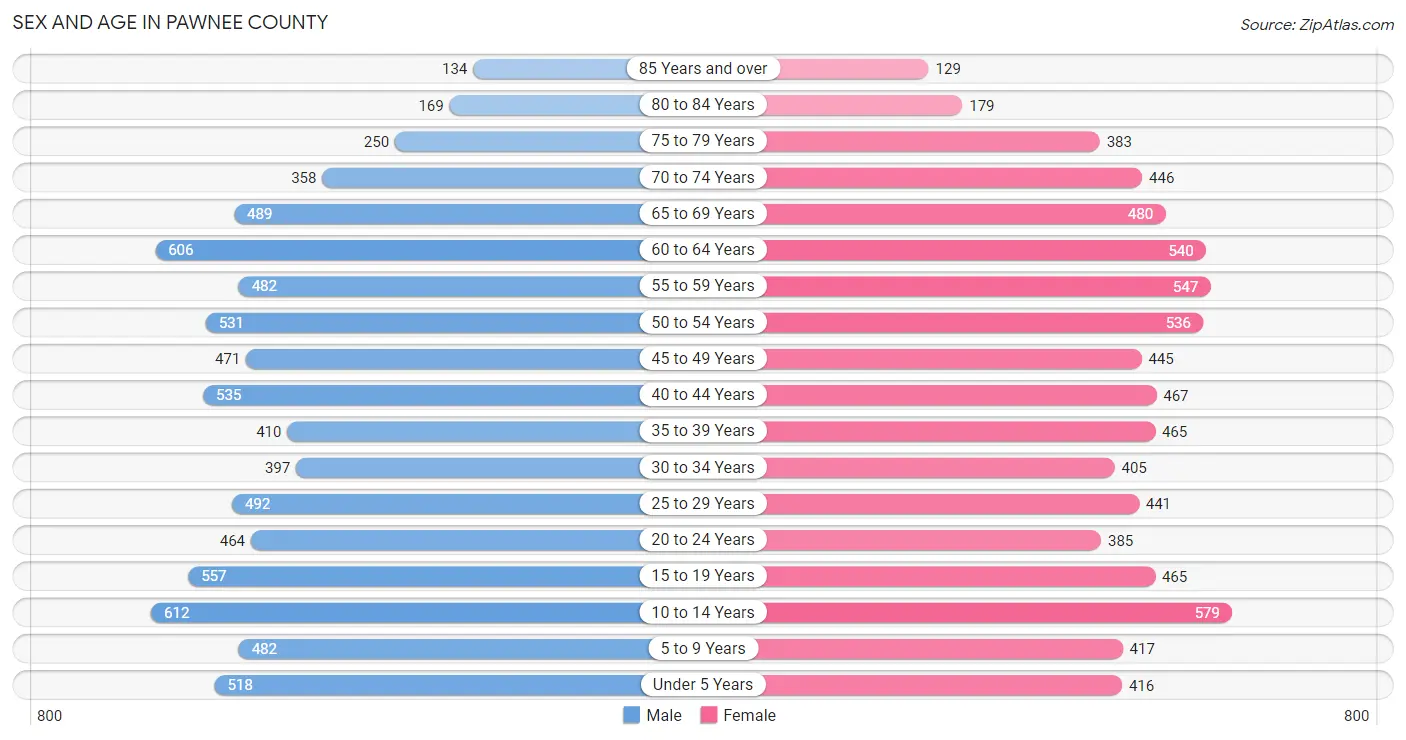
| Age Bracket | Male | Female |
| Under 5 Years | 518 (6.5%) | 416 (5.4%) |
| 5 to 9 Years | 482 (6.1%) | 417 (5.4%) |
| 10 to 14 Years | 612 (7.7%) | 579 (7.5%) |
| 15 to 19 Years | 557 (7.0%) | 465 (6.0%) |
| 20 to 24 Years | 464 (5.8%) | 385 (5.0%) |
| 25 to 29 Years | 492 (6.2%) | 441 (5.7%) |
| 30 to 34 Years | 397 (5.0%) | 405 (5.2%) |
| 35 to 39 Years | 410 (5.1%) | 465 (6.0%) |
| 40 to 44 Years | 535 (6.7%) | 467 (6.0%) |
| 45 to 49 Years | 471 (5.9%) | 445 (5.8%) |
| 50 to 54 Years | 531 (6.7%) | 536 (6.9%) |
| 55 to 59 Years | 482 (6.1%) | 547 (7.1%) |
| 60 to 64 Years | 606 (7.6%) | 540 (7.0%) |
| 65 to 69 Years | 489 (6.1%) | 480 (6.2%) |
| 70 to 74 Years | 358 (4.5%) | 446 (5.8%) |
| 75 to 79 Years | 250 (3.1%) | 383 (5.0%) |
| 80 to 84 Years | 169 (2.1%) | 179 (2.3%) |
| 85 Years and over | 134 (1.7%) | 129 (1.7%) |
| Total | 7,957 (100.0%) | 7,725 (100.0%) |
Families and Households in Pawnee County
Median Family Size in Pawnee County
The median family size in Pawnee County is 3.07 persons per family, with married-couple families (3,246 | 76.7%) accounting for the largest median family size of 3.12 persons per family. On the other hand, single male/father families (314 | 7.4%) represent the smallest median family size with 2.80 persons per family.
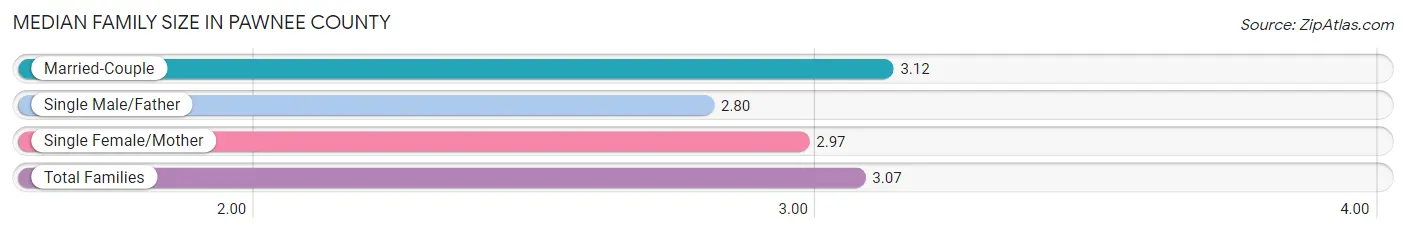
| Family Type | # Families | Family Size |
| Married-Couple | 3,246 (76.7%) | 3.12 |
| Single Male/Father | 314 (7.4%) | 2.80 |
| Single Female/Mother | 672 (15.9%) | 2.97 |
| Total Families | 4,232 (100.0%) | 3.07 |
Median Household Size in Pawnee County
The median household size in Pawnee County is 2.59 persons per household, with single female/mother households (672 | 11.3%) accounting for the largest median household size of 3.2 persons per household. non-family households (1,727 | 29.0%) represent the smallest median household size with 1.19 persons per household.
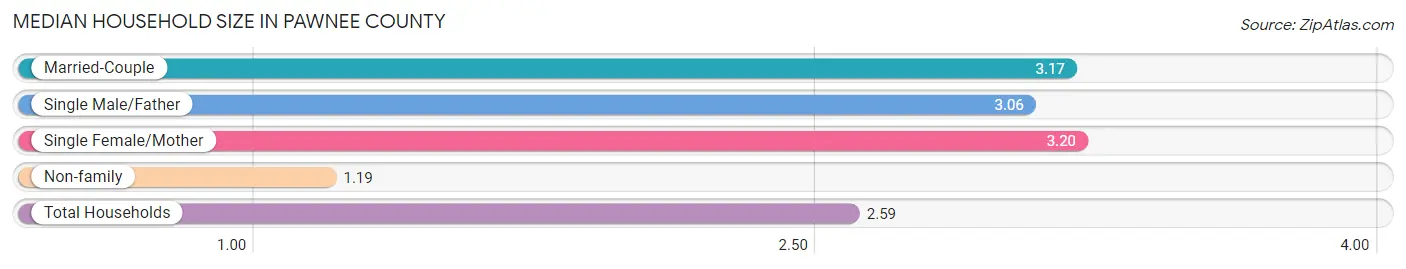
| Household Type | # Households | Household Size |
| Married-Couple | 3,246 (54.5%) | 3.17 |
| Single Male/Father | 314 (5.3%) | 3.06 |
| Single Female/Mother | 672 (11.3%) | 3.20 |
| Non-family | 1,727 (29.0%) | 1.19 |
| Total Households | 5,959 (100.0%) | 2.59 |
Household Size by Marriage Status in Pawnee County
Out of a total of 5,959 households in Pawnee County, 4,232 (71.0%) are family households, while 1,727 (29.0%) are nonfamily households. The most numerous type of family households are 2-person households, comprising 2,201, and the most common type of nonfamily households are 1-person households, comprising 1,475.
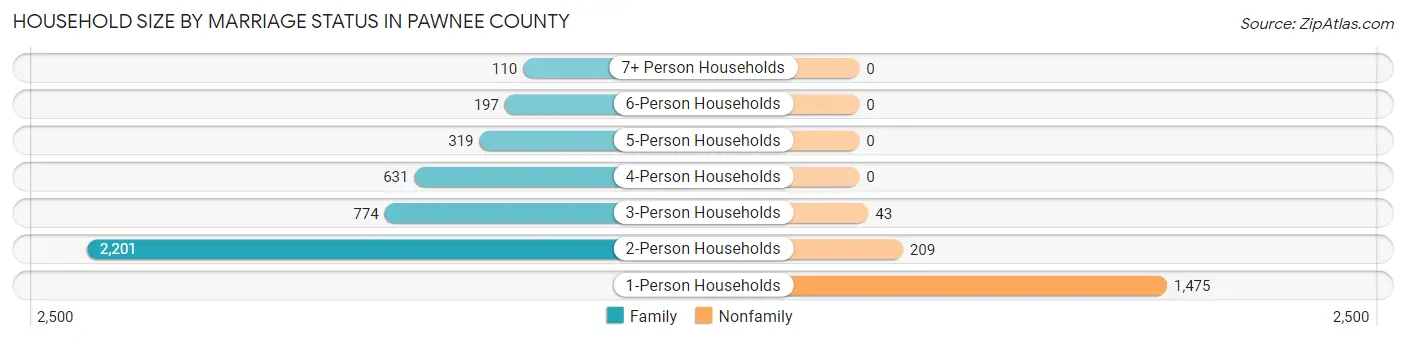
| Household Size | Family Households | Nonfamily Households |
| 1-Person Households | - | 1,475 (24.7%) |
| 2-Person Households | 2,201 (36.9%) | 209 (3.5%) |
| 3-Person Households | 774 (13.0%) | 43 (0.7%) |
| 4-Person Households | 631 (10.6%) | 0 (0.0%) |
| 5-Person Households | 319 (5.3%) | 0 (0.0%) |
| 6-Person Households | 197 (3.3%) | 0 (0.0%) |
| 7+ Person Households | 110 (1.8%) | 0 (0.0%) |
| Total | 4,232 (71.0%) | 1,727 (29.0%) |
Female Fertility in Pawnee County
Fertility by Age in Pawnee County
Average fertility rate in Pawnee County is 38.0 births per 1,000 women. Women in the age bracket of 20 to 34 years have the highest fertility rate with 64.0 births per 1,000 women. Women in the age bracket of 20 to 34 years acount for 65.8% of all women with births.
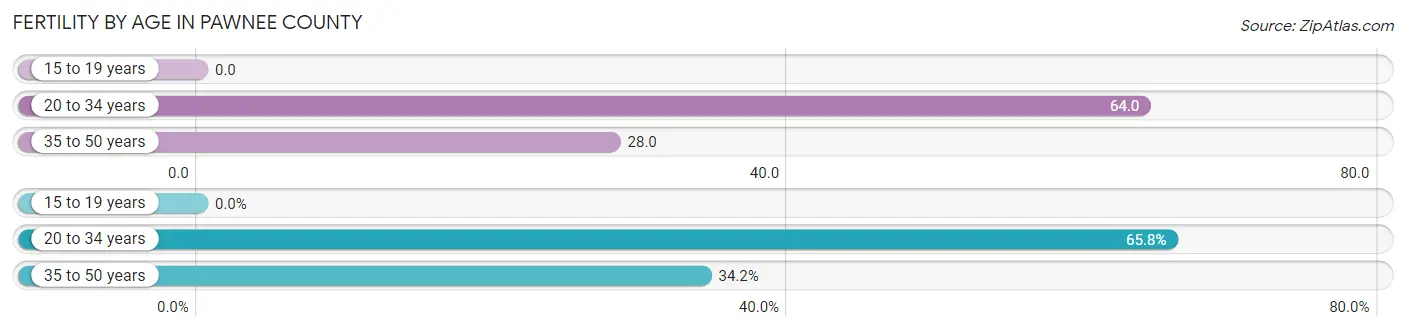
| Age Bracket | Women with Births | Births / 1,000 Women |
| 15 to 19 years | 0 (0.0%) | 0.0 |
| 20 to 34 years | 79 (65.8%) | 64.0 |
| 35 to 50 years | 41 (34.2%) | 28.0 |
| Total | 120 (100.0%) | 38.0 |
Fertility by Age by Marriage Status in Pawnee County
81.7% of women with births (120) in Pawnee County are married. The highest percentage of unmarried women with births falls into 20 to 34 years age bracket with 27.9% of them unmarried at the time of birth, while the lowest percentage of unmarried women with births belong to 35 to 50 years age bracket with 0.0% of them unmarried.
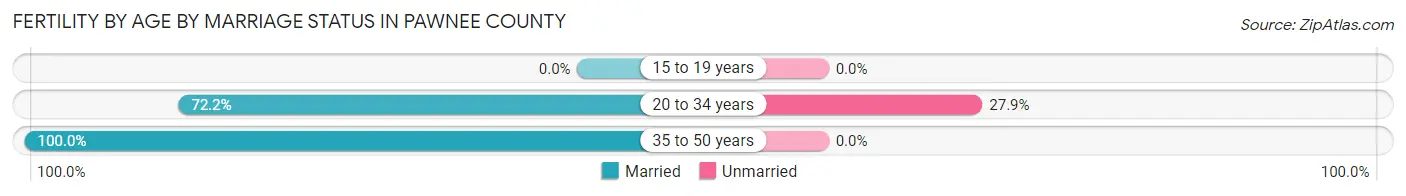
| Age Bracket | Married | Unmarried |
| 15 to 19 years | 0 (0.0%) | 0 (0.0%) |
| 20 to 34 years | 57 (72.2%) | 22 (27.9%) |
| 35 to 50 years | 41 (100.0%) | 0 (0.0%) |
| Total | 98 (81.7%) | 22 (18.3%) |
Fertility by Education in Pawnee County
Average fertility rate in Pawnee County is 38.0 births per 1,000 women. Women with the education attainment of college or associate's degree have the highest fertility rate of 50.0 births per 1,000 women, while women with the education attainment of graduate degree have the lowest fertility at 16.0 births per 1,000 women. Women with the education attainment of college or associate's degree represent 41.7% of all women with births.
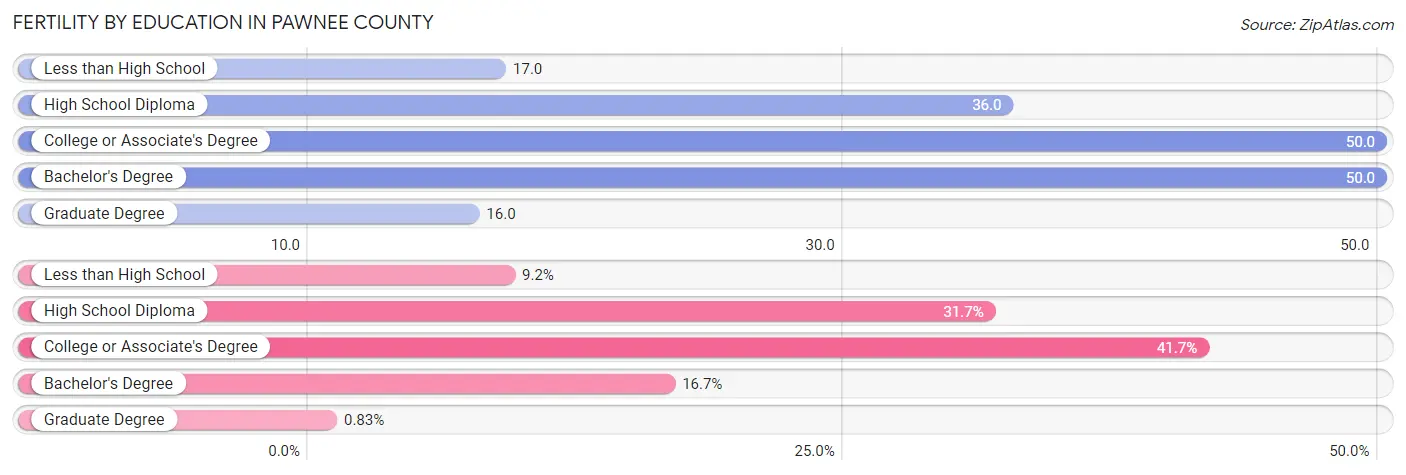
| Educational Attainment | Women with Births | Births / 1,000 Women |
| Less than High School | 11 (9.2%) | 17.0 |
| High School Diploma | 38 (31.7%) | 36.0 |
| College or Associate's Degree | 50 (41.7%) | 50.0 |
| Bachelor's Degree | 20 (16.7%) | 50.0 |
| Graduate Degree | 1 (0.8%) | 16.0 |
| Total | 120 (100.0%) | 38.0 |
Fertility by Education by Marriage Status in Pawnee County
18.3% of women with births in Pawnee County are unmarried. Women with the educational attainment of bachelor's degree are most likely to be married with 100.0% of them married at childbirth, while women with the educational attainment of less than high school are least likely to be married with 81.8% of them unmarried at childbirth.
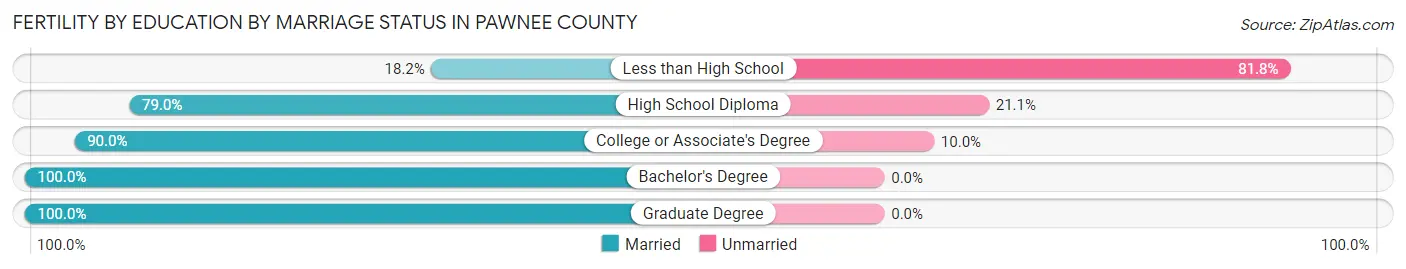
| Educational Attainment | Married | Unmarried |
| Less than High School | 2 (18.2%) | 9 (81.8%) |
| High School Diploma | 30 (78.9%) | 8 (21.0%) |
| College or Associate's Degree | 45 (90.0%) | 5 (10.0%) |
| Bachelor's Degree | 20 (100.0%) | 0 (0.0%) |
| Graduate Degree | 1 (100.0%) | 0 (0.0%) |
| Total | 98 (81.7%) | 22 (18.3%) |
Employment Characteristics in Pawnee County
Employment by Class of Employer in Pawnee County
Among the 6,520 employed individuals in Pawnee County, private company employees (4,305 | 66.0%), self-employed (not incorporated) (540 | 8.3%), and state government employees (479 | 7.3%) make up the most common classes of employment.
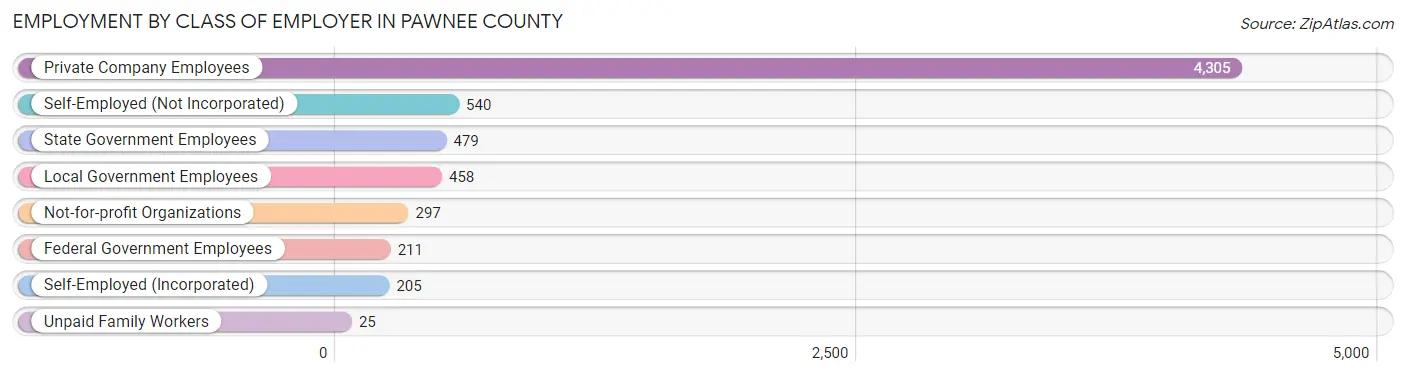
| Employer Class | # Employees | % Employees |
| Private Company Employees | 4,305 | 66.0% |
| Self-Employed (Incorporated) | 205 | 3.1% |
| Self-Employed (Not Incorporated) | 540 | 8.3% |
| Not-for-profit Organizations | 297 | 4.6% |
| Local Government Employees | 458 | 7.0% |
| State Government Employees | 479 | 7.3% |
| Federal Government Employees | 211 | 3.2% |
| Unpaid Family Workers | 25 | 0.4% |
| Total | 6,520 | 100.0% |
Employment Status by Age in Pawnee County
According to the labor force statistics for Pawnee County, out of the total population over 16 years of age (12,423), 54.6% or 6,783 individuals are in the labor force, with 3.5% or 237 of them unemployed. The age group with the highest labor force participation rate is 45 to 54 years, with 77.7% or 1,541 individuals in the labor force. Within the labor force, the 16 to 19 years age range has the highest percentage of unemployed individuals, with 23.3% or 60 of them being unemployed.
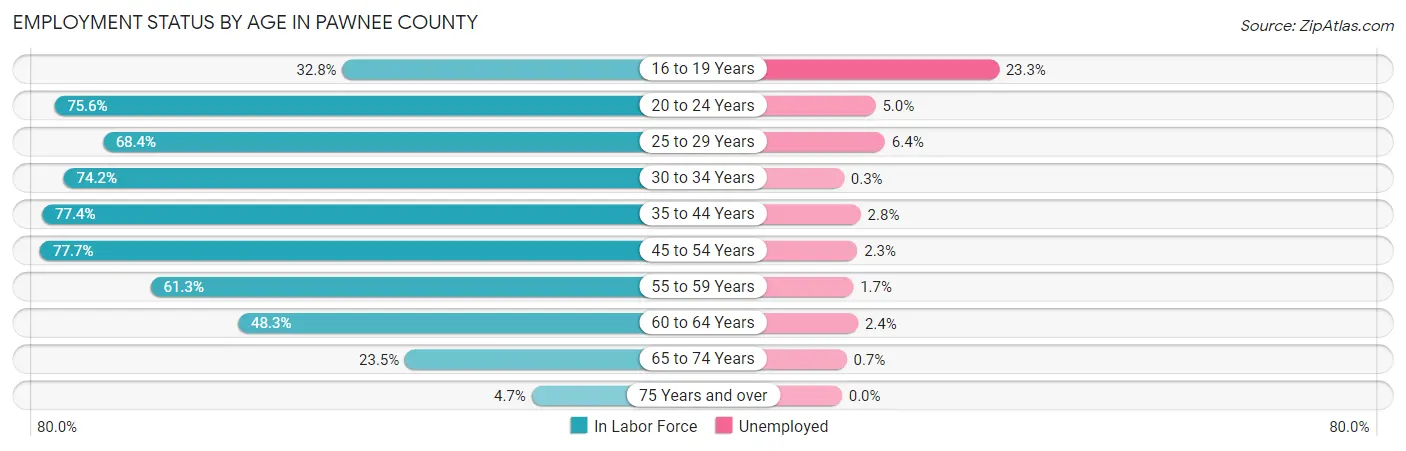
| Age Bracket | In Labor Force | Unemployed |
| 16 to 19 Years | 258 (32.8%) | 60 (23.3%) |
| 20 to 24 Years | 642 (75.6%) | 32 (5.0%) |
| 25 to 29 Years | 638 (68.4%) | 41 (6.4%) |
| 30 to 34 Years | 595 (74.2%) | 2 (0.3%) |
| 35 to 44 Years | 1,453 (77.4%) | 41 (2.8%) |
| 45 to 54 Years | 1,541 (77.7%) | 35 (2.3%) |
| 55 to 59 Years | 631 (61.3%) | 11 (1.7%) |
| 60 to 64 Years | 554 (48.3%) | 13 (2.4%) |
| 65 to 74 Years | 417 (23.5%) | 3 (0.7%) |
| 75 Years and over | 58 (4.7%) | 0 (0.0%) |
| Total | 6,783 (54.6%) | 237 (3.5%) |
Employment Status by Educational Attainment in Pawnee County
According to labor force statistics for Pawnee County, 69.6% of individuals (5,408) out of the total population between 25 and 64 years of age (7,770) are in the labor force, with 2.6% or 141 of them being unemployed. The group with the highest labor force participation rate are those with the educational attainment of bachelor's degree or higher, with 86.1% or 1,037 individuals in the labor force. Within the labor force, individuals with less than high school education have the highest percentage of unemployment, with 8.0% or 34 of them being unemployed.
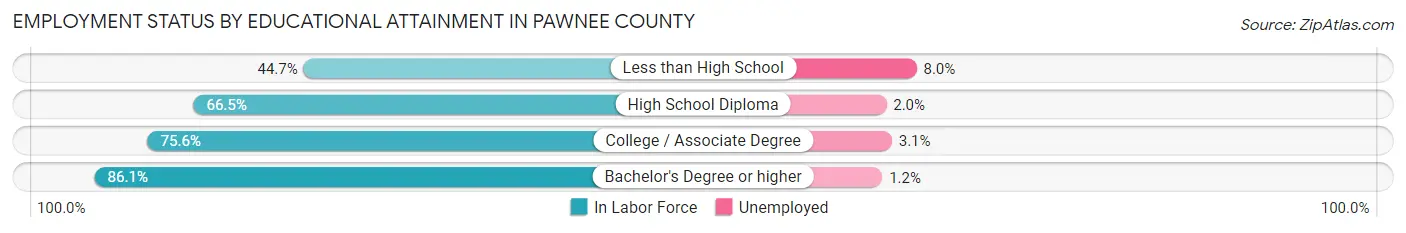
| Educational Attainment | In Labor Force | Unemployed |
| Less than High School | 426 (44.7%) | 76 (8.0%) |
| High School Diploma | 2,191 (66.5%) | 66 (2.0%) |
| College / Associate Degree | 1,754 (75.6%) | 72 (3.1%) |
| Bachelor's Degree or higher | 1,037 (86.1%) | 14 (1.2%) |
| Total | 5,408 (69.6%) | 202 (2.6%) |
Employment Occupations by Sex in Pawnee County
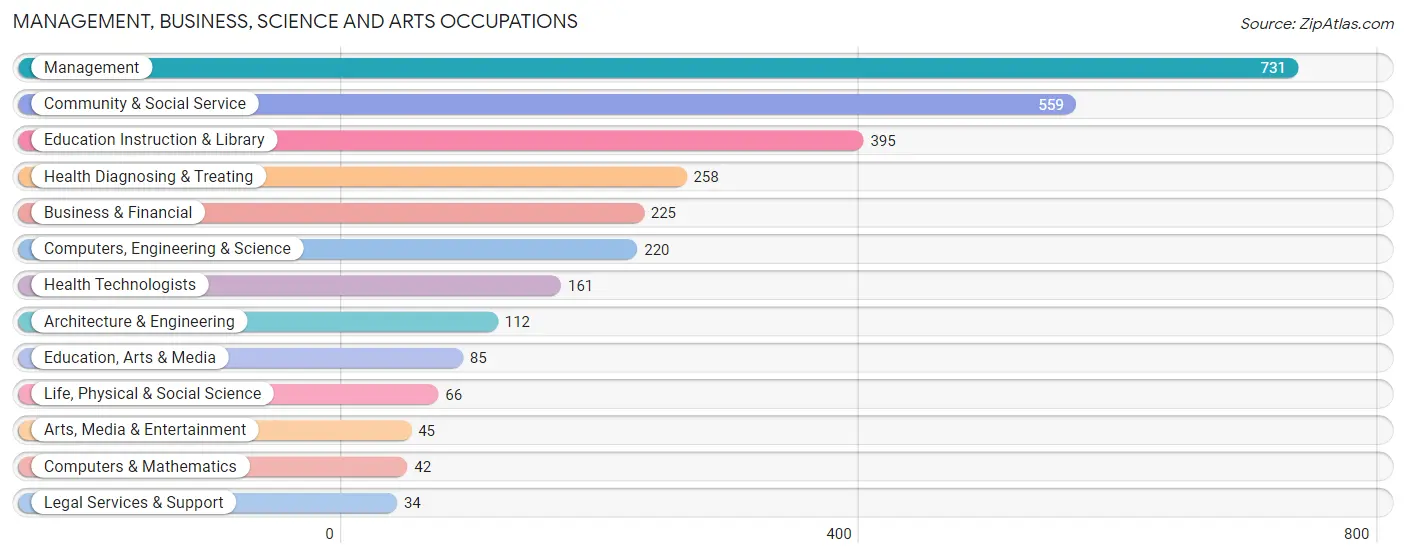
Management, Business, Science and Arts Occupations
The most common Management, Business, Science and Arts occupations in Pawnee County are Management (731 | 11.2%), Community & Social Service (559 | 8.5%), Education Instruction & Library (395 | 6.0%), Health Diagnosing & Treating (258 | 3.9%), and Business & Financial (225 | 3.4%).
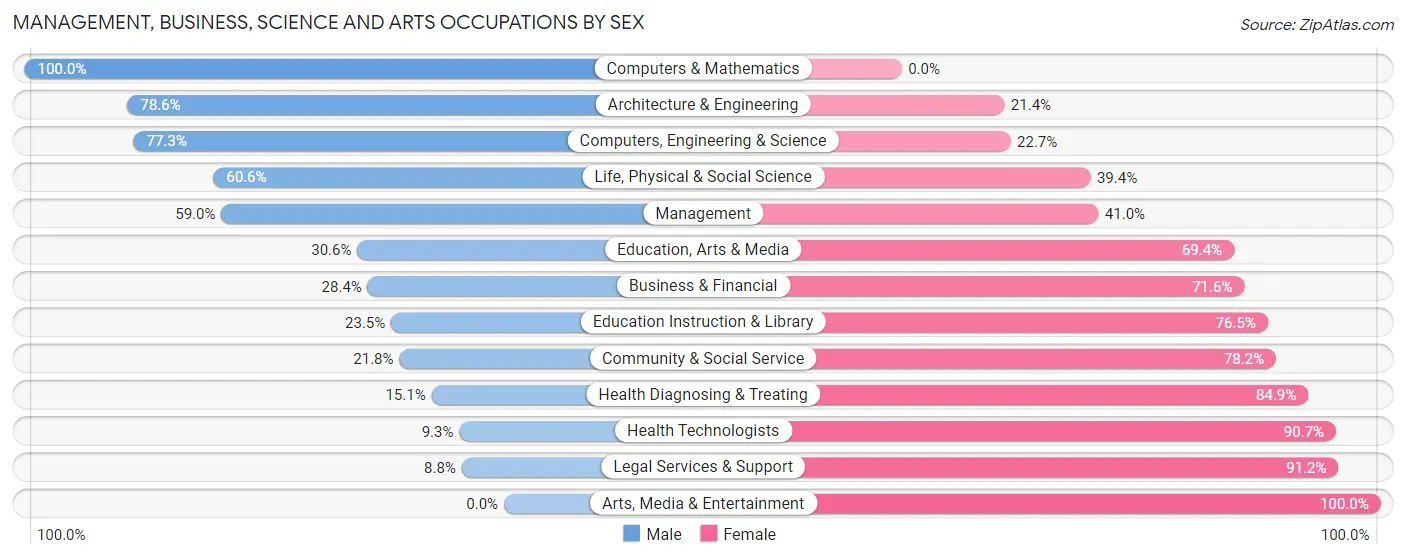
Management, Business, Science and Arts Occupations by Sex
Within the Management, Business, Science and Arts occupations in Pawnee County, the most male-oriented occupations are Computers & Mathematics (100.0%), Architecture & Engineering (78.6%), and Computers, Engineering & Science (77.3%), while the most female-oriented occupations are Arts, Media & Entertainment (100.0%), Legal Services & Support (91.2%), and Health Technologists (90.7%).
| Occupation | Male | Female |
| Management | 431 (59.0%) | 300 (41.0%) |
| Business & Financial | 64 (28.4%) | 161 (71.6%) |
| Computers, Engineering & Science | 170 (77.3%) | 50 (22.7%) |
| Computers & Mathematics | 42 (100.0%) | 0 (0.0%) |
| Architecture & Engineering | 88 (78.6%) | 24 (21.4%) |
| Life, Physical & Social Science | 40 (60.6%) | 26 (39.4%) |
| Community & Social Service | 122 (21.8%) | 437 (78.2%) |
| Education, Arts & Media | 26 (30.6%) | 59 (69.4%) |
| Legal Services & Support | 3 (8.8%) | 31 (91.2%) |
| Education Instruction & Library | 93 (23.5%) | 302 (76.5%) |
| Arts, Media & Entertainment | 0 (0.0%) | 45 (100.0%) |
| Health Diagnosing & Treating | 39 (15.1%) | 219 (84.9%) |
| Health Technologists | 15 (9.3%) | 146 (90.7%) |
| Total (Category) | 826 (41.4%) | 1,167 (58.6%) |
| Total (Overall) | 3,698 (56.5%) | 2,849 (43.5%) |
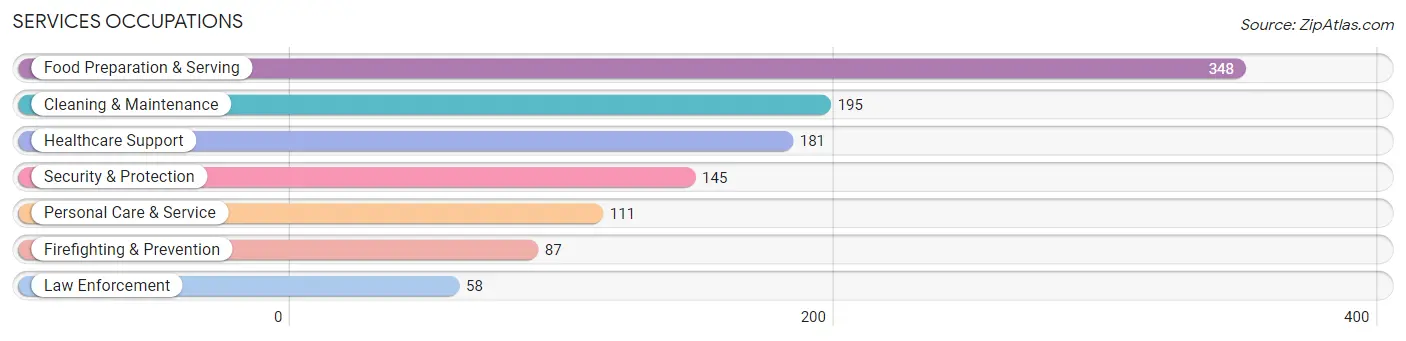
Services Occupations
The most common Services occupations in Pawnee County are Food Preparation & Serving (348 | 5.3%), Cleaning & Maintenance (195 | 3.0%), Healthcare Support (181 | 2.8%), Security & Protection (145 | 2.2%), and Personal Care & Service (111 | 1.7%).
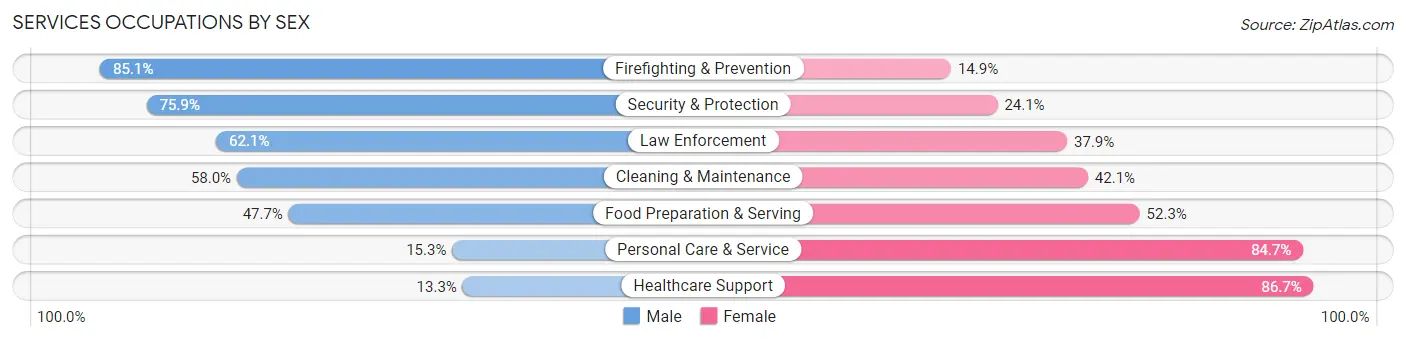
Services Occupations by Sex
Within the Services occupations in Pawnee County, the most male-oriented occupations are Firefighting & Prevention (85.1%), Security & Protection (75.9%), and Law Enforcement (62.1%), while the most female-oriented occupations are Healthcare Support (86.7%), Personal Care & Service (84.7%), and Food Preparation & Serving (52.3%).
| Occupation | Male | Female |
| Healthcare Support | 24 (13.3%) | 157 (86.7%) |
| Security & Protection | 110 (75.9%) | 35 (24.1%) |
| Firefighting & Prevention | 74 (85.1%) | 13 (14.9%) |
| Law Enforcement | 36 (62.1%) | 22 (37.9%) |
| Food Preparation & Serving | 166 (47.7%) | 182 (52.3%) |
| Cleaning & Maintenance | 113 (58.0%) | 82 (42.0%) |
| Personal Care & Service | 17 (15.3%) | 94 (84.7%) |
| Total (Category) | 430 (43.9%) | 550 (56.1%) |
| Total (Overall) | 3,698 (56.5%) | 2,849 (43.5%) |
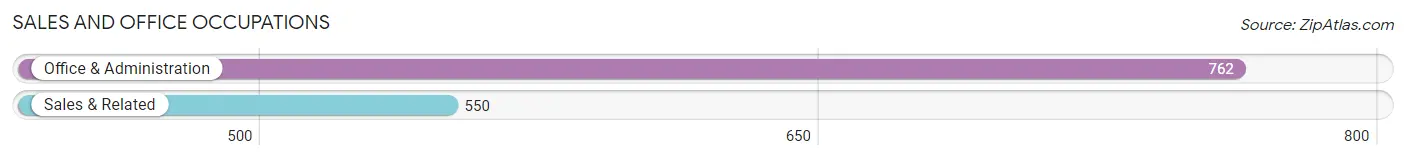
Sales and Office Occupations
The most common Sales and Office occupations in Pawnee County are Office & Administration (762 | 11.6%), and Sales & Related (550 | 8.4%).
Sales and Office Occupations by Sex
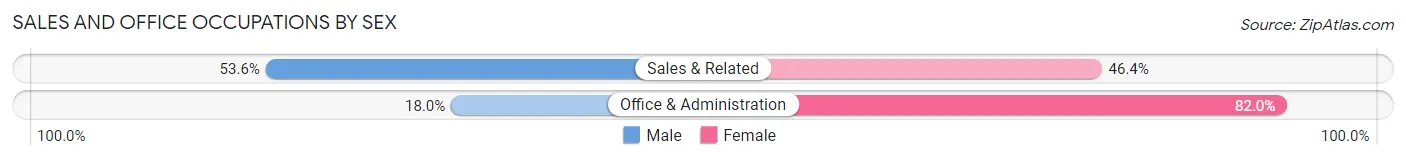
| Occupation | Male | Female |
| Sales & Related | 295 (53.6%) | 255 (46.4%) |
| Office & Administration | 137 (18.0%) | 625 (82.0%) |
| Total (Category) | 432 (32.9%) | 880 (67.1%) |
| Total (Overall) | 3,698 (56.5%) | 2,849 (43.5%) |
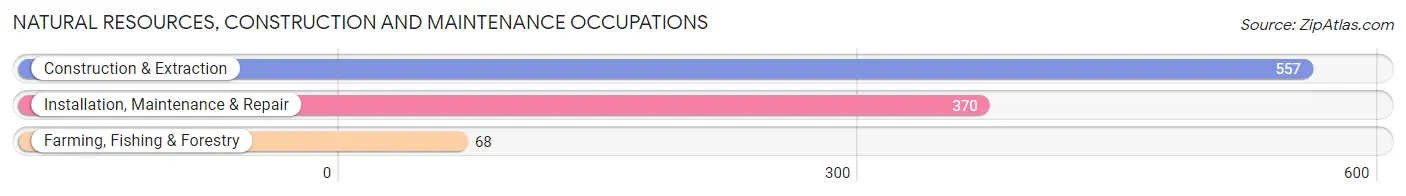
Natural Resources, Construction and Maintenance Occupations
The most common Natural Resources, Construction and Maintenance occupations in Pawnee County are Construction & Extraction (557 | 8.5%), Installation, Maintenance & Repair (370 | 5.7%), and Farming, Fishing & Forestry (68 | 1.0%).
Natural Resources, Construction and Maintenance Occupations by Sex
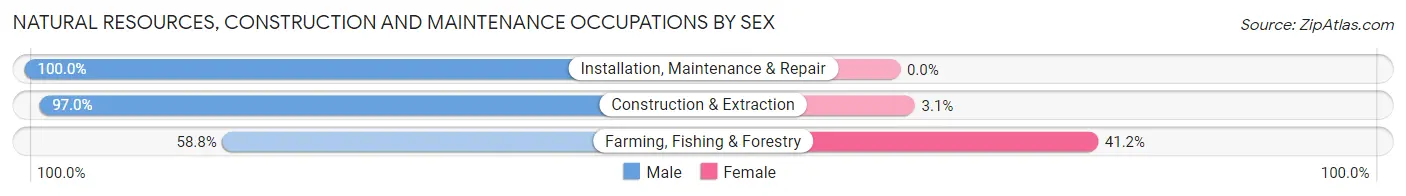
| Occupation | Male | Female |
| Farming, Fishing & Forestry | 40 (58.8%) | 28 (41.2%) |
| Construction & Extraction | 540 (97.0%) | 17 (3.0%) |
| Installation, Maintenance & Repair | 370 (100.0%) | 0 (0.0%) |
| Total (Category) | 950 (95.5%) | 45 (4.5%) |
| Total (Overall) | 3,698 (56.5%) | 2,849 (43.5%) |
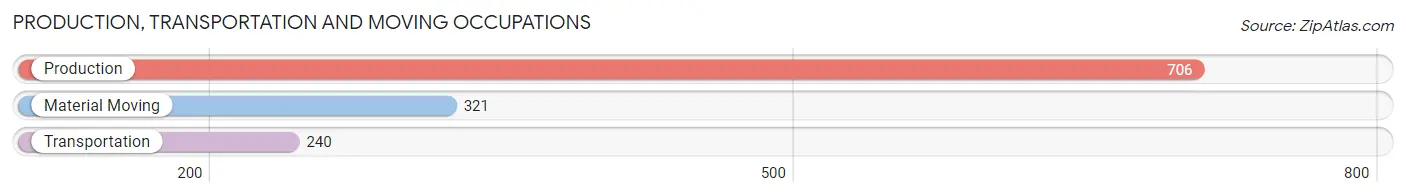
Production, Transportation and Moving Occupations
The most common Production, Transportation and Moving occupations in Pawnee County are Production (706 | 10.8%), Material Moving (321 | 4.9%), and Transportation (240 | 3.7%).
Production, Transportation and Moving Occupations by Sex
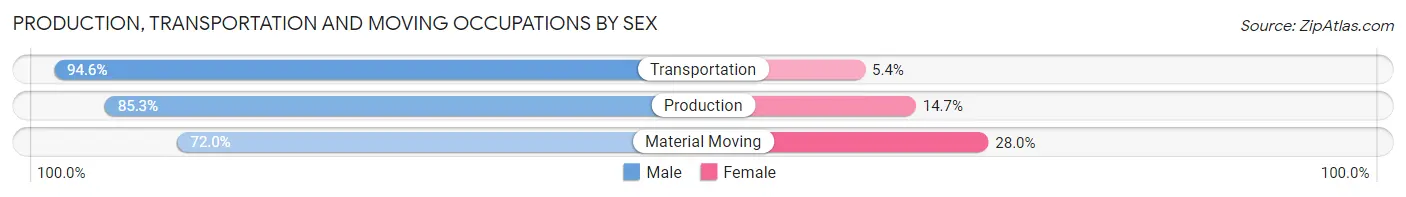
| Occupation | Male | Female |
| Production | 602 (85.3%) | 104 (14.7%) |
| Transportation | 227 (94.6%) | 13 (5.4%) |
| Material Moving | 231 (72.0%) | 90 (28.0%) |
| Total (Category) | 1,060 (83.7%) | 207 (16.3%) |
| Total (Overall) | 3,698 (56.5%) | 2,849 (43.5%) |
Employment Industries by Sex in Pawnee County
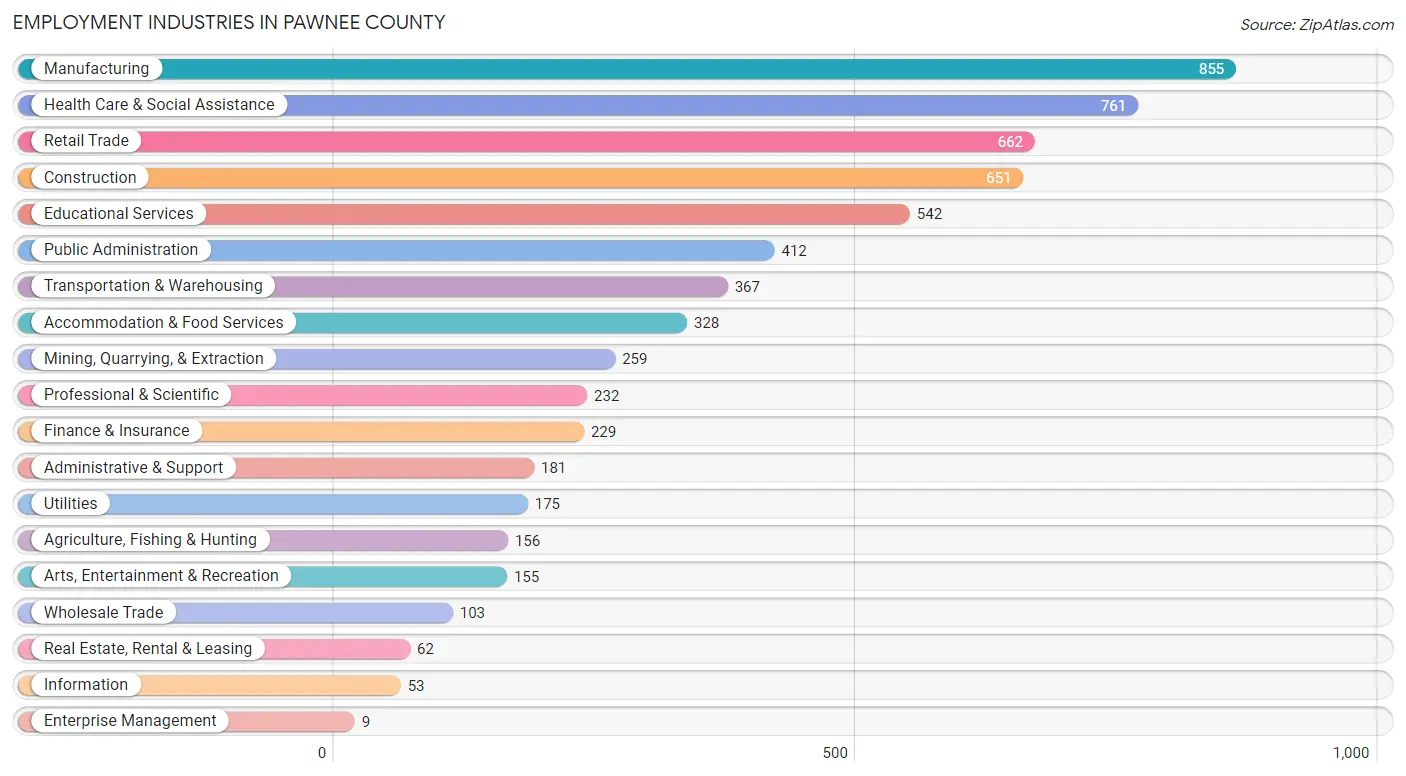
Employment Industries in Pawnee County
The major employment industries in Pawnee County include Manufacturing (855 | 13.1%), Health Care & Social Assistance (761 | 11.6%), Retail Trade (662 | 10.1%), Construction (651 | 9.9%), and Educational Services (542 | 8.3%).
Employment Industries by Sex in Pawnee County
The Pawnee County industries that see more men than women are Utilities (92.0%), Real Estate, Rental & Leasing (90.3%), and Construction (87.9%), whereas the industries that tend to have a higher number of women are Health Care & Social Assistance (84.9%), Finance & Insurance (75.5%), and Professional & Scientific (71.1%).
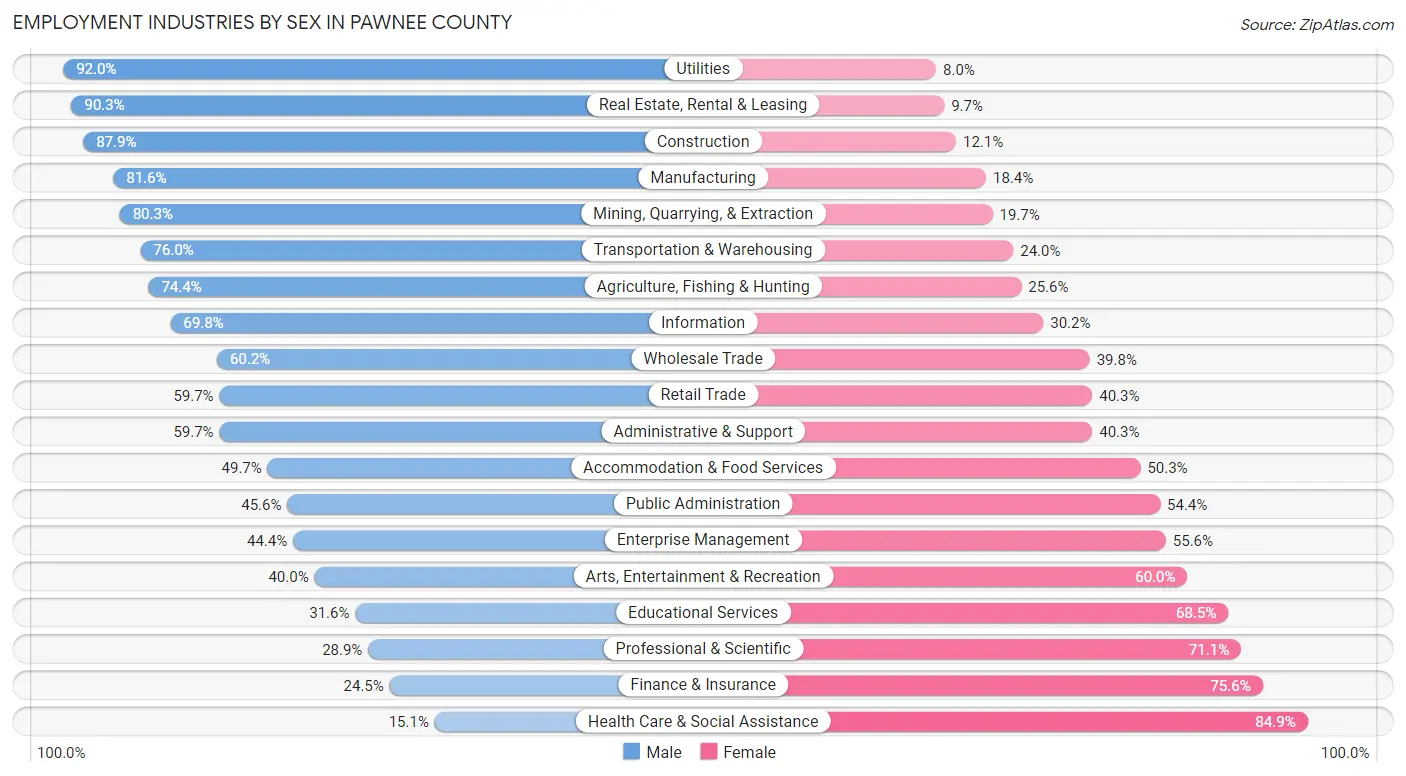
| Industry | Male | Female |
| Agriculture, Fishing & Hunting | 116 (74.4%) | 40 (25.6%) |
| Mining, Quarrying, & Extraction | 208 (80.3%) | 51 (19.7%) |
| Construction | 572 (87.9%) | 79 (12.1%) |
| Manufacturing | 698 (81.6%) | 157 (18.4%) |
| Wholesale Trade | 62 (60.2%) | 41 (39.8%) |
| Retail Trade | 395 (59.7%) | 267 (40.3%) |
| Transportation & Warehousing | 279 (76.0%) | 88 (24.0%) |
| Utilities | 161 (92.0%) | 14 (8.0%) |
| Information | 37 (69.8%) | 16 (30.2%) |
| Finance & Insurance | 56 (24.4%) | 173 (75.5%) |
| Real Estate, Rental & Leasing | 56 (90.3%) | 6 (9.7%) |
| Professional & Scientific | 67 (28.9%) | 165 (71.1%) |
| Enterprise Management | 4 (44.4%) | 5 (55.6%) |
| Administrative & Support | 108 (59.7%) | 73 (40.3%) |
| Educational Services | 171 (31.6%) | 371 (68.4%) |
| Health Care & Social Assistance | 115 (15.1%) | 646 (84.9%) |
| Arts, Entertainment & Recreation | 62 (40.0%) | 93 (60.0%) |
| Accommodation & Food Services | 163 (49.7%) | 165 (50.3%) |
| Public Administration | 188 (45.6%) | 224 (54.4%) |
| Total | 3,698 (56.5%) | 2,849 (43.5%) |
Education in Pawnee County
School Enrollment in Pawnee County
The most common levels of schooling among the 3,214 students in Pawnee County are middle school (923 | 28.7%), high school (842 | 26.2%), and elementary school (763 | 23.7%).
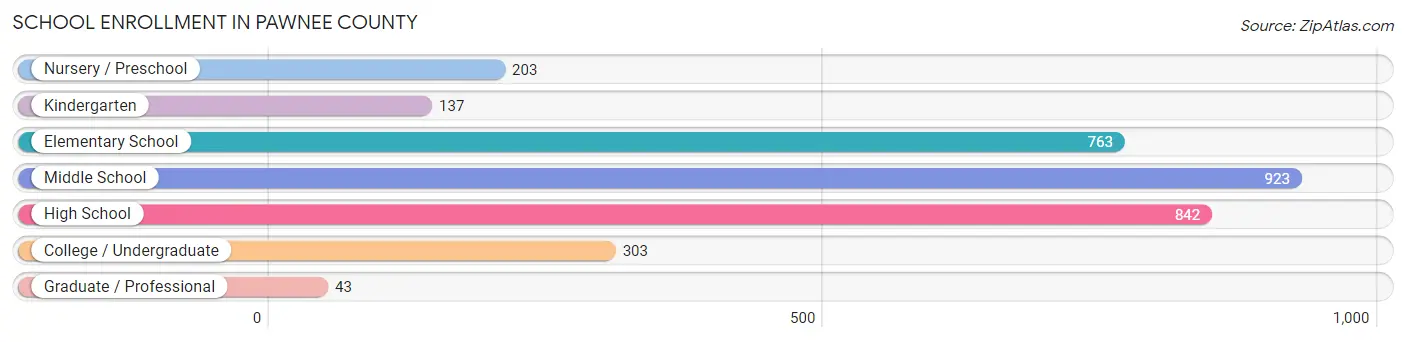
| School Level | # Students | % Students |
| Nursery / Preschool | 203 | 6.3% |
| Kindergarten | 137 | 4.3% |
| Elementary School | 763 | 23.7% |
| Middle School | 923 | 28.7% |
| High School | 842 | 26.2% |
| College / Undergraduate | 303 | 9.4% |
| Graduate / Professional | 43 | 1.3% |
| Total | 3,214 | 100.0% |
School Enrollment by Age by Funding Source in Pawnee County
Out of a total of 3,214 students who are enrolled in schools in Pawnee County, 328 (10.2%) attend a private institution, while the remaining 2,886 (89.8%) are enrolled in public schools. The age group of 25 to 34 year olds has the highest likelihood of being enrolled in private schools, with 30 (30.0% in the age bracket) enrolled. Conversely, the age group of 18 to 19 year olds has the lowest likelihood of being enrolled in a private school, with 128 (100.0% in the age bracket) attending a public institution.
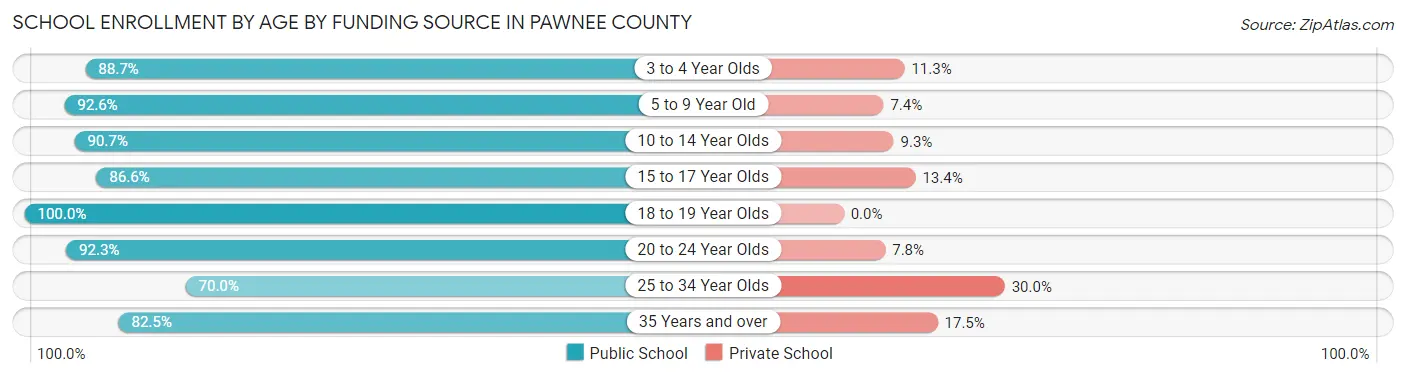
| Age Bracket | Public School | Private School |
| 3 to 4 Year Olds | 133 (88.7%) | 17 (11.3%) |
| 5 to 9 Year Old | 749 (92.6%) | 60 (7.4%) |
| 10 to 14 Year Olds | 1,043 (90.7%) | 107 (9.3%) |
| 15 to 17 Year Olds | 544 (86.6%) | 84 (13.4%) |
| 18 to 19 Year Olds | 128 (100.0%) | 0 (0.0%) |
| 20 to 24 Year Olds | 119 (92.2%) | 10 (7.7%) |
| 25 to 34 Year Olds | 70 (70.0%) | 30 (30.0%) |
| 35 Years and over | 99 (82.5%) | 21 (17.5%) |
| Total | 2,886 (89.8%) | 328 (10.2%) |
Educational Attainment by Field of Study in Pawnee County
Education (485 | 26.1%), business (426 | 22.9%), science & technology (226 | 12.1%), bio, nature & agricultural (145 | 7.8%), and psychology (108 | 5.8%) are the most common fields of study among 1,862 individuals in Pawnee County who have obtained a bachelor's degree or higher.
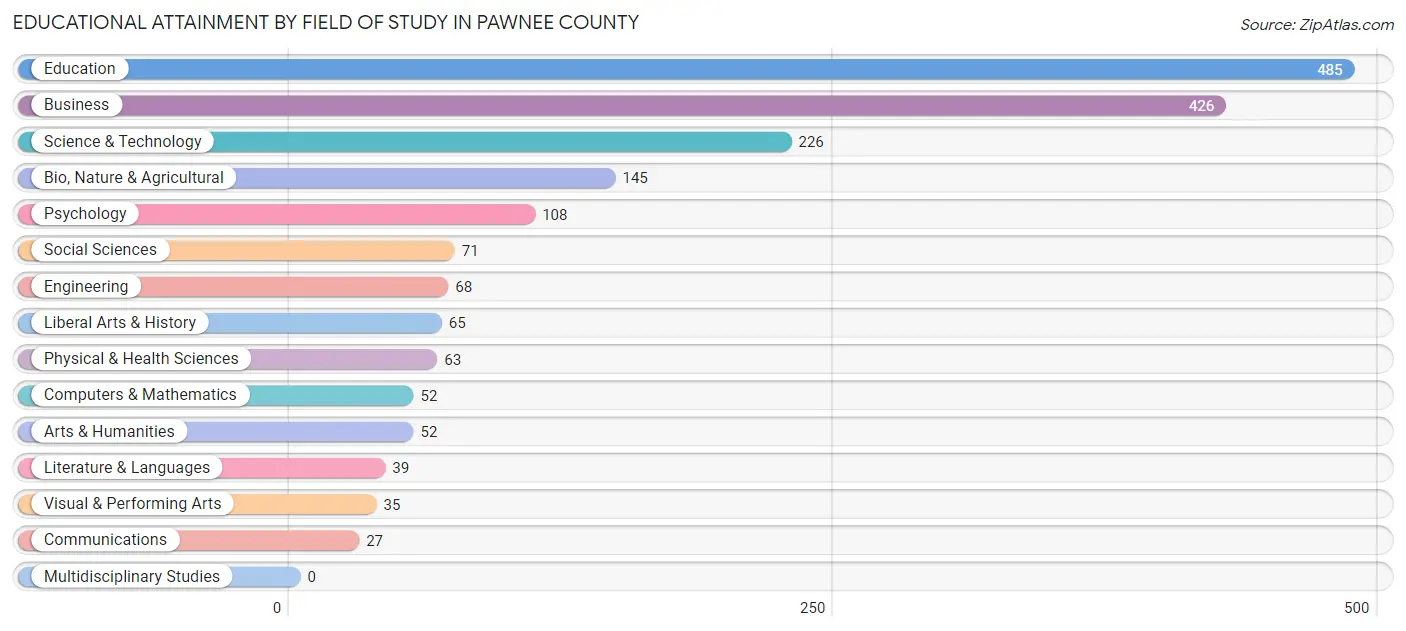
| Field of Study | # Graduates | % Graduates |
| Computers & Mathematics | 52 | 2.8% |
| Bio, Nature & Agricultural | 145 | 7.8% |
| Physical & Health Sciences | 63 | 3.4% |
| Psychology | 108 | 5.8% |
| Social Sciences | 71 | 3.8% |
| Engineering | 68 | 3.6% |
| Multidisciplinary Studies | 0 | 0.0% |
| Science & Technology | 226 | 12.1% |
| Business | 426 | 22.9% |
| Education | 485 | 26.1% |
| Literature & Languages | 39 | 2.1% |
| Liberal Arts & History | 65 | 3.5% |
| Visual & Performing Arts | 35 | 1.9% |
| Communications | 27 | 1.5% |
| Arts & Humanities | 52 | 2.8% |
| Total | 1,862 | 100.0% |
Transportation & Commute in Pawnee County
Vehicle Availability by Sex in Pawnee County
The most prevalent vehicle ownership categories in Pawnee County are males with 2 vehicles (1,396, accounting for 38.1%) and females with 2 vehicles (965, making up 49.1%).
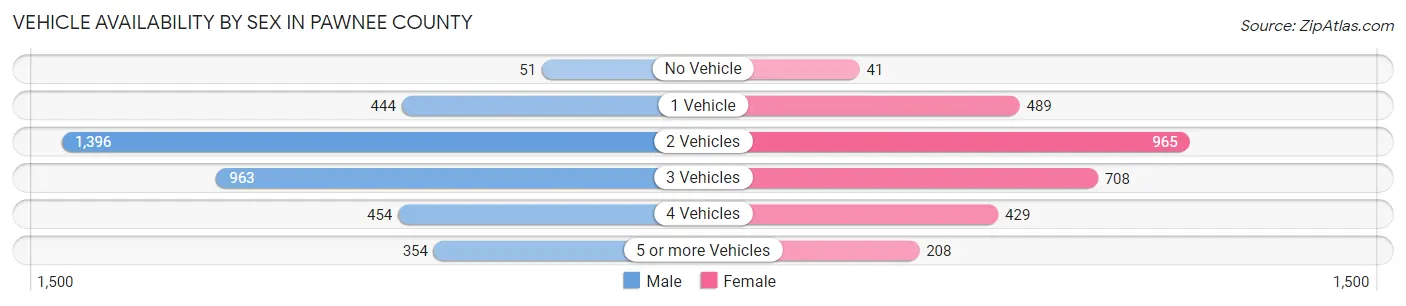
| Vehicles Available | Male | Female |
| No Vehicle | 51 (1.4%) | 41 (1.4%) |
| 1 Vehicle | 444 (12.1%) | 489 (17.2%) |
| 2 Vehicles | 1,396 (38.1%) | 965 (34.0%) |
| 3 Vehicles | 963 (26.3%) | 708 (24.9%) |
| 4 Vehicles | 454 (12.4%) | 429 (15.1%) |
| 5 or more Vehicles | 354 (9.7%) | 208 (7.3%) |
| Total | 3,662 (100.0%) | 2,840 (100.0%) |
Commute Time in Pawnee County
The most frequently occuring commute durations in Pawnee County are 30 to 34 minutes (909 commuters, 14.7%), 5 to 9 minutes (862 commuters, 14.0%), and 45 to 59 minutes (785 commuters, 12.7%).
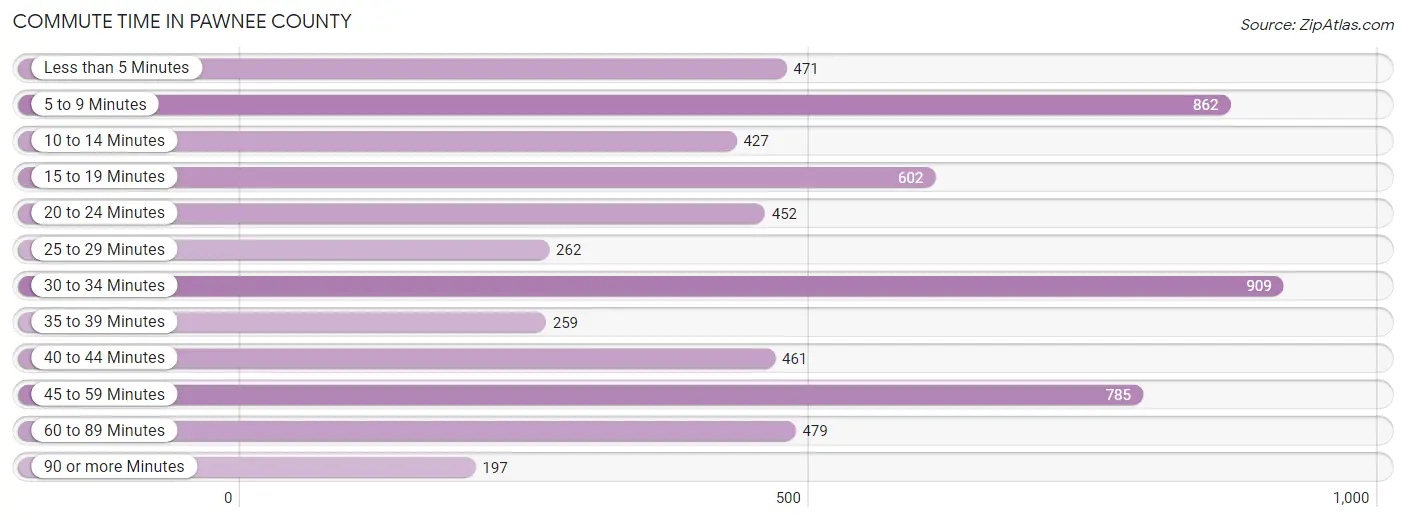
| Commute Time | # Commuters | % Commuters |
| Less than 5 Minutes | 471 | 7.6% |
| 5 to 9 Minutes | 862 | 14.0% |
| 10 to 14 Minutes | 427 | 6.9% |
| 15 to 19 Minutes | 602 | 9.8% |
| 20 to 24 Minutes | 452 | 7.3% |
| 25 to 29 Minutes | 262 | 4.3% |
| 30 to 34 Minutes | 909 | 14.7% |
| 35 to 39 Minutes | 259 | 4.2% |
| 40 to 44 Minutes | 461 | 7.5% |
| 45 to 59 Minutes | 785 | 12.7% |
| 60 to 89 Minutes | 479 | 7.8% |
| 90 or more Minutes | 197 | 3.2% |
Commute Time by Sex in Pawnee County
The most common commute times in Pawnee County are 30 to 34 minutes (561 commuters, 15.9%) for males and 5 to 9 minutes (456 commuters, 17.2%) for females.
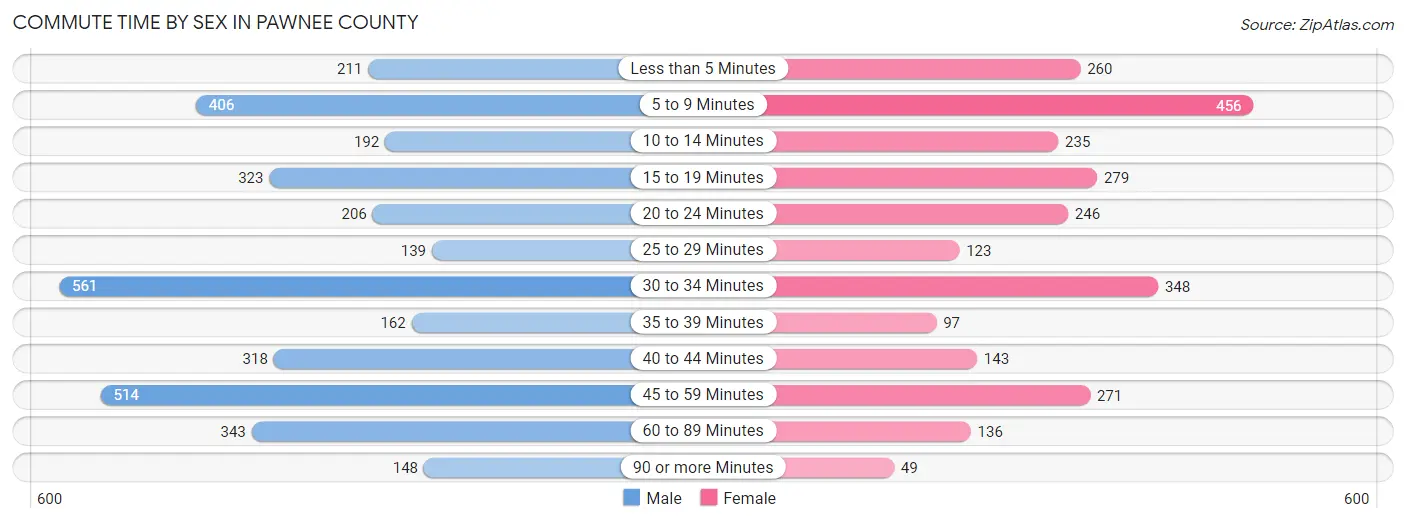
| Commute Time | Male | Female |
| Less than 5 Minutes | 211 (6.0%) | 260 (9.8%) |
| 5 to 9 Minutes | 406 (11.5%) | 456 (17.2%) |
| 10 to 14 Minutes | 192 (5.4%) | 235 (8.9%) |
| 15 to 19 Minutes | 323 (9.2%) | 279 (10.6%) |
| 20 to 24 Minutes | 206 (5.9%) | 246 (9.3%) |
| 25 to 29 Minutes | 139 (4.0%) | 123 (4.6%) |
| 30 to 34 Minutes | 561 (15.9%) | 348 (13.2%) |
| 35 to 39 Minutes | 162 (4.6%) | 97 (3.7%) |
| 40 to 44 Minutes | 318 (9.0%) | 143 (5.4%) |
| 45 to 59 Minutes | 514 (14.6%) | 271 (10.2%) |
| 60 to 89 Minutes | 343 (9.7%) | 136 (5.1%) |
| 90 or more Minutes | 148 (4.2%) | 49 (1.8%) |
Time of Departure to Work by Sex in Pawnee County
The most frequent times of departure to work in Pawnee County are 6:00 AM to 6:29 AM (562, 16.0%) for males and 7:30 AM to 7:59 AM (528, 20.0%) for females.
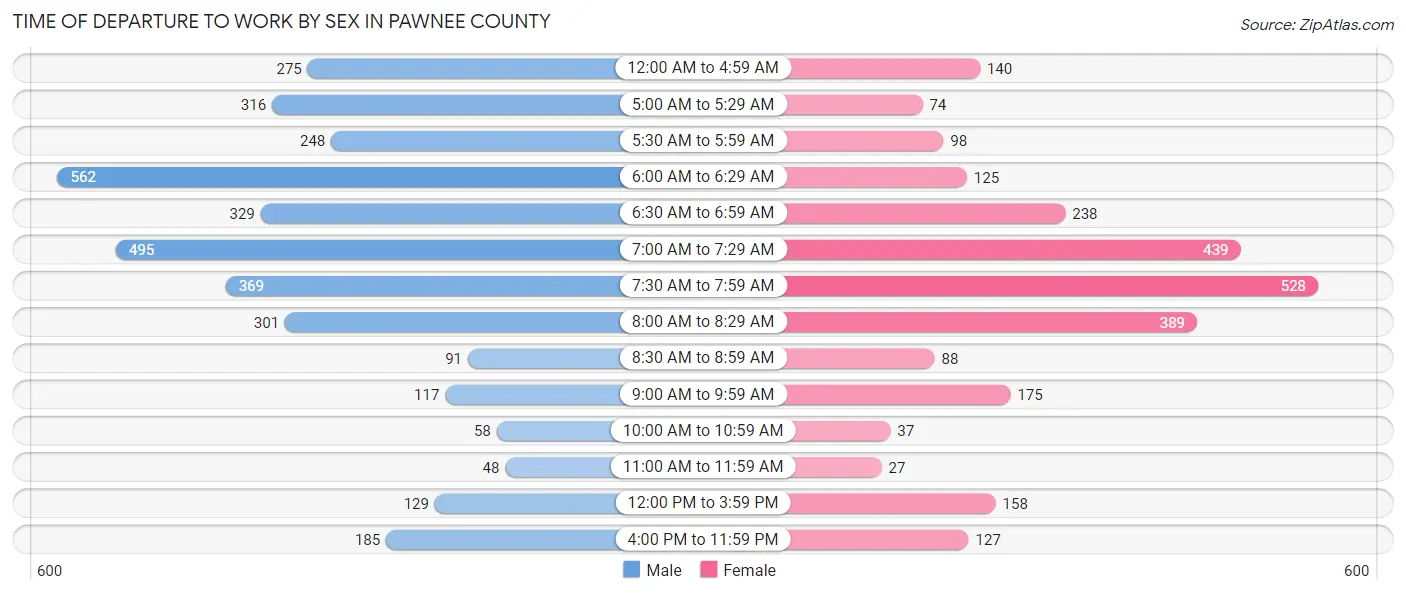
| Time of Departure | Male | Female |
| 12:00 AM to 4:59 AM | 275 (7.8%) | 140 (5.3%) |
| 5:00 AM to 5:29 AM | 316 (9.0%) | 74 (2.8%) |
| 5:30 AM to 5:59 AM | 248 (7.0%) | 98 (3.7%) |
| 6:00 AM to 6:29 AM | 562 (16.0%) | 125 (4.7%) |
| 6:30 AM to 6:59 AM | 329 (9.3%) | 238 (9.0%) |
| 7:00 AM to 7:29 AM | 495 (14.1%) | 439 (16.6%) |
| 7:30 AM to 7:59 AM | 369 (10.5%) | 528 (20.0%) |
| 8:00 AM to 8:29 AM | 301 (8.5%) | 389 (14.7%) |
| 8:30 AM to 8:59 AM | 91 (2.6%) | 88 (3.3%) |
| 9:00 AM to 9:59 AM | 117 (3.3%) | 175 (6.6%) |
| 10:00 AM to 10:59 AM | 58 (1.7%) | 37 (1.4%) |
| 11:00 AM to 11:59 AM | 48 (1.4%) | 27 (1.0%) |
| 12:00 PM to 3:59 PM | 129 (3.7%) | 158 (6.0%) |
| 4:00 PM to 11:59 PM | 185 (5.2%) | 127 (4.8%) |
| Total | 3,523 (100.0%) | 2,643 (100.0%) |
Housing Occupancy in Pawnee County
Occupancy by Ownership in Pawnee County
Of the total 5,959 dwellings in Pawnee County, owner-occupied units account for 4,632 (77.7%), while renter-occupied units make up 1,327 (22.3%).
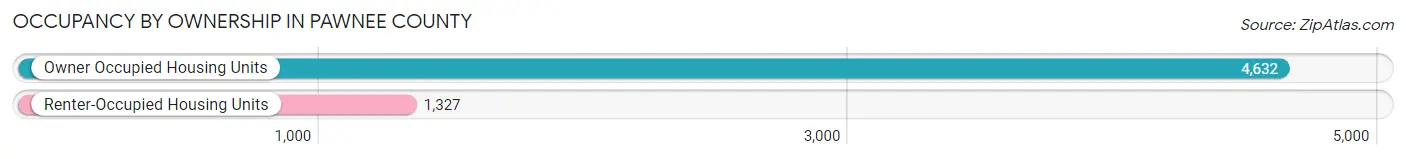
| Occupancy | # Housing Units | % Housing Units |
| Owner Occupied Housing Units | 4,632 | 77.7% |
| Renter-Occupied Housing Units | 1,327 | 22.3% |
| Total Occupied Housing Units | 5,959 | 100.0% |
Occupancy by Household Size in Pawnee County
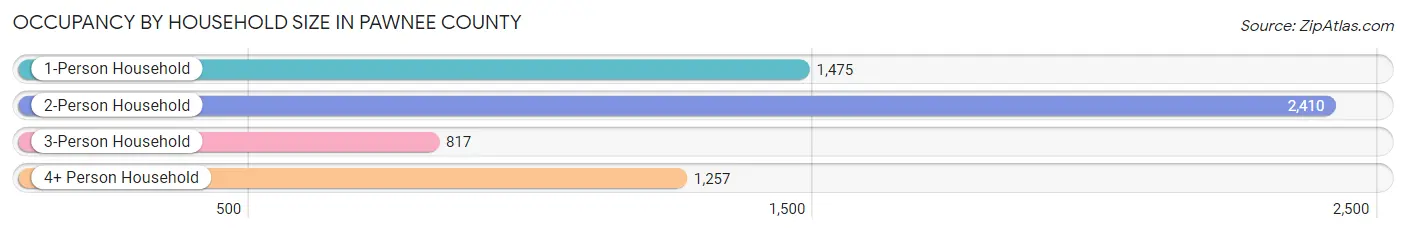
| Household Size | # Housing Units | % Housing Units |
| 1-Person Household | 1,475 | 24.7% |
| 2-Person Household | 2,410 | 40.4% |
| 3-Person Household | 817 | 13.7% |
| 4+ Person Household | 1,257 | 21.1% |
| Total Housing Units | 5,959 | 100.0% |
Occupancy by Ownership by Household Size in Pawnee County
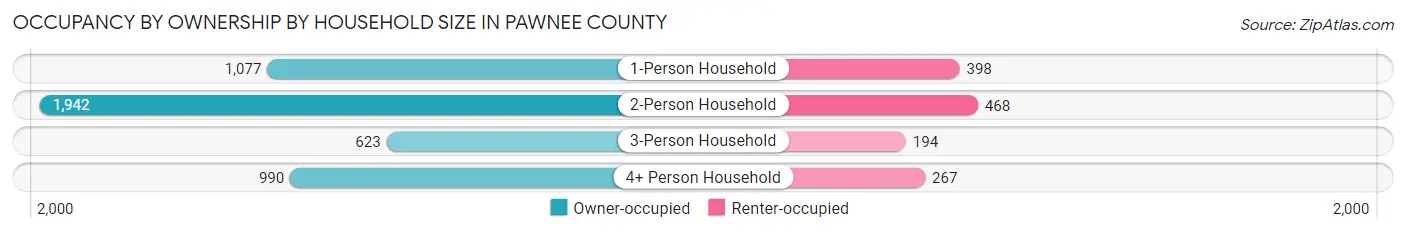
| Household Size | Owner-occupied | Renter-occupied |
| 1-Person Household | 1,077 (73.0%) | 398 (27.0%) |
| 2-Person Household | 1,942 (80.6%) | 468 (19.4%) |
| 3-Person Household | 623 (76.2%) | 194 (23.7%) |
| 4+ Person Household | 990 (78.8%) | 267 (21.2%) |
| Total Housing Units | 4,632 (77.7%) | 1,327 (22.3%) |
Occupancy by Educational Attainment in Pawnee County
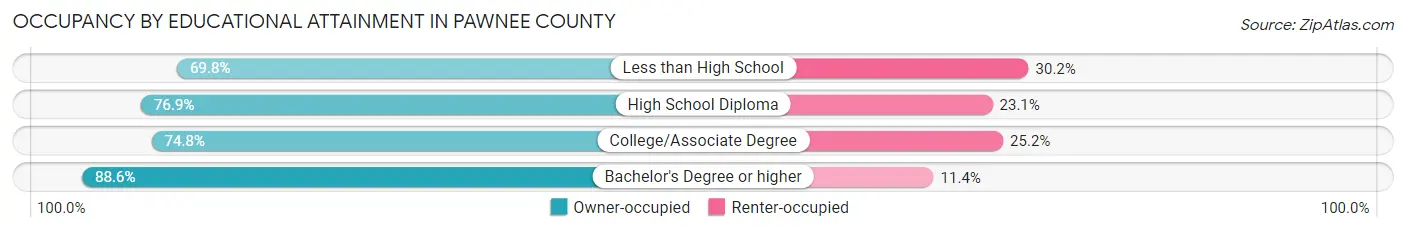
| Household Size | Owner-occupied | Renter-occupied |
| Less than High School | 448 (69.8%) | 194 (30.2%) |
| High School Diploma | 1,873 (76.9%) | 562 (23.1%) |
| College/Associate Degree | 1,316 (74.8%) | 443 (25.2%) |
| Bachelor's Degree or higher | 995 (88.6%) | 128 (11.4%) |
Occupancy by Age of Householder in Pawnee County
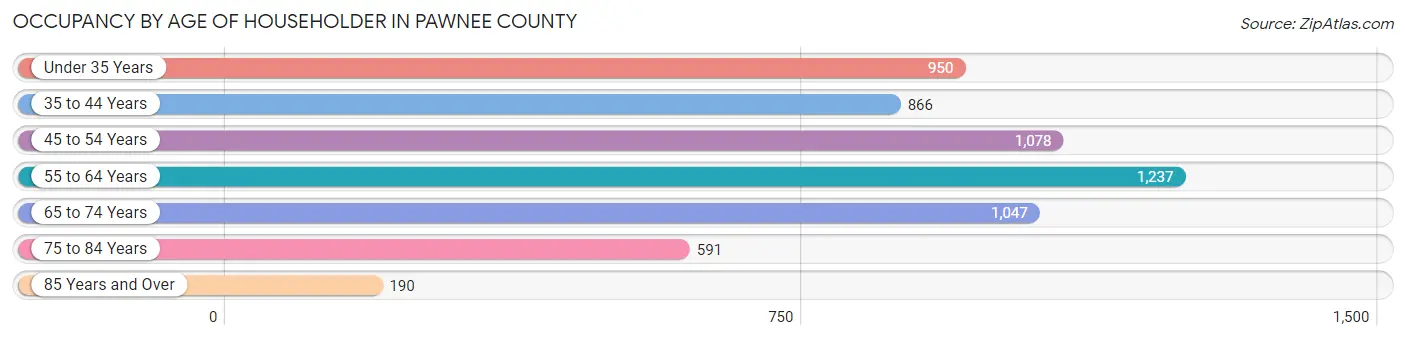
| Age Bracket | # Households | % Households |
| Under 35 Years | 950 | 15.9% |
| 35 to 44 Years | 866 | 14.5% |
| 45 to 54 Years | 1,078 | 18.1% |
| 55 to 64 Years | 1,237 | 20.8% |
| 65 to 74 Years | 1,047 | 17.6% |
| 75 to 84 Years | 591 | 9.9% |
| 85 Years and Over | 190 | 3.2% |
| Total | 5,959 | 100.0% |
Housing Finances in Pawnee County
Median Income by Occupancy in Pawnee County
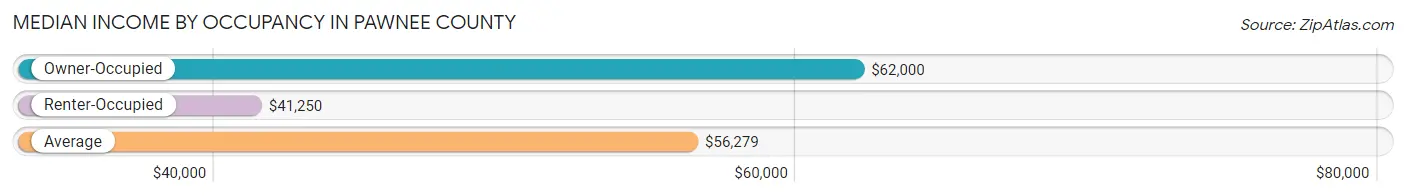
| Occupancy Type | # Households | Median Income |
| Owner-Occupied | 4,632 (77.7%) | $62,000 |
| Renter-Occupied | 1,327 (22.3%) | $41,250 |
| Average | 5,959 (100.0%) | $56,279 |
Occupancy by Householder Income Bracket in Pawnee County
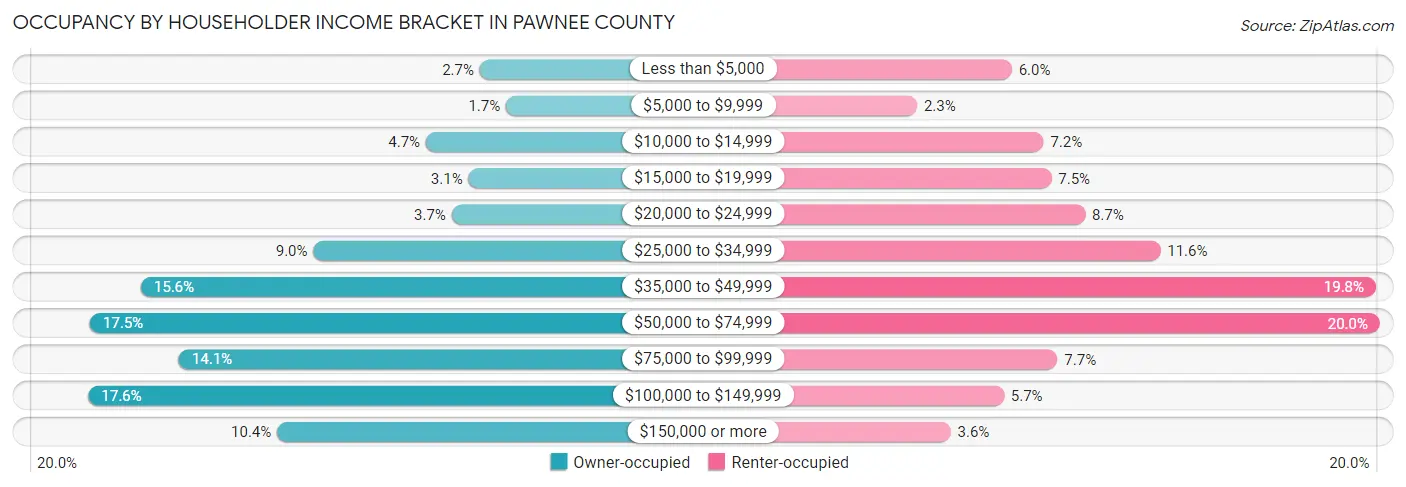
| Income Bracket | Owner-occupied | Renter-occupied |
| Less than $5,000 | 123 (2.7%) | 79 (5.9%) |
| $5,000 to $9,999 | 77 (1.7%) | 31 (2.3%) |
| $10,000 to $14,999 | 218 (4.7%) | 95 (7.2%) |
| $15,000 to $19,999 | 143 (3.1%) | 99 (7.5%) |
| $20,000 to $24,999 | 173 (3.7%) | 116 (8.7%) |
| $25,000 to $34,999 | 417 (9.0%) | 154 (11.6%) |
| $35,000 to $49,999 | 721 (15.6%) | 263 (19.8%) |
| $50,000 to $74,999 | 811 (17.5%) | 265 (20.0%) |
| $75,000 to $99,999 | 654 (14.1%) | 102 (7.7%) |
| $100,000 to $149,999 | 814 (17.6%) | 75 (5.7%) |
| $150,000 or more | 481 (10.4%) | 48 (3.6%) |
| Total | 4,632 (100.0%) | 1,327 (100.0%) |
Monthly Housing Cost Tiers in Pawnee County
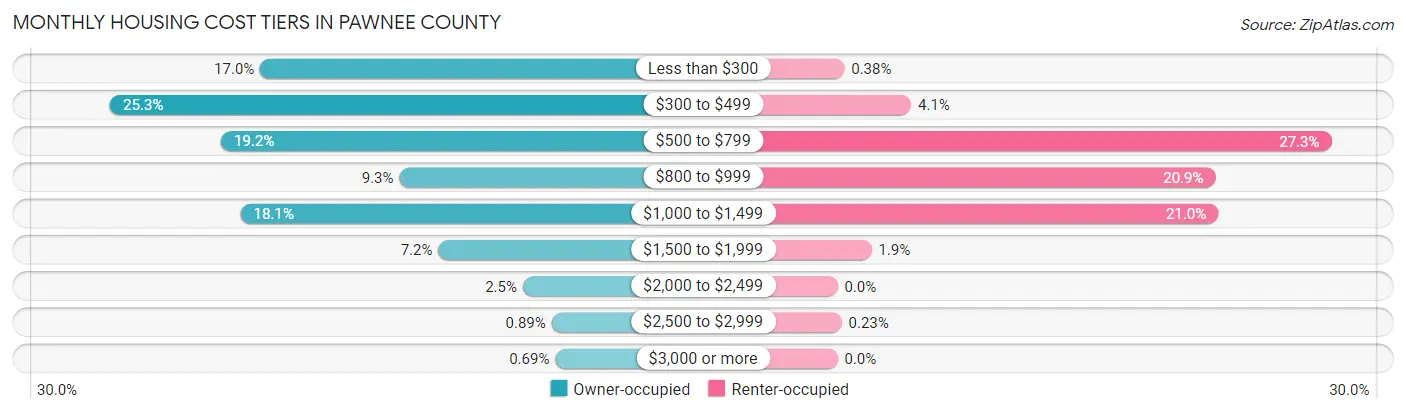
| Monthly Cost | Owner-occupied | Renter-occupied |
| Less than $300 | 787 (17.0%) | 5 (0.4%) |
| $300 to $499 | 1,171 (25.3%) | 54 (4.1%) |
| $500 to $799 | 887 (19.2%) | 362 (27.3%) |
| $800 to $999 | 431 (9.3%) | 277 (20.9%) |
| $1,000 to $1,499 | 837 (18.1%) | 279 (21.0%) |
| $1,500 to $1,999 | 331 (7.1%) | 25 (1.9%) |
| $2,000 to $2,499 | 115 (2.5%) | 0 (0.0%) |
| $2,500 to $2,999 | 41 (0.9%) | 3 (0.2%) |
| $3,000 or more | 32 (0.7%) | 0 (0.0%) |
| Total | 4,632 (100.0%) | 1,327 (100.0%) |
Physical Housing Characteristics in Pawnee County
Housing Structures in Pawnee County
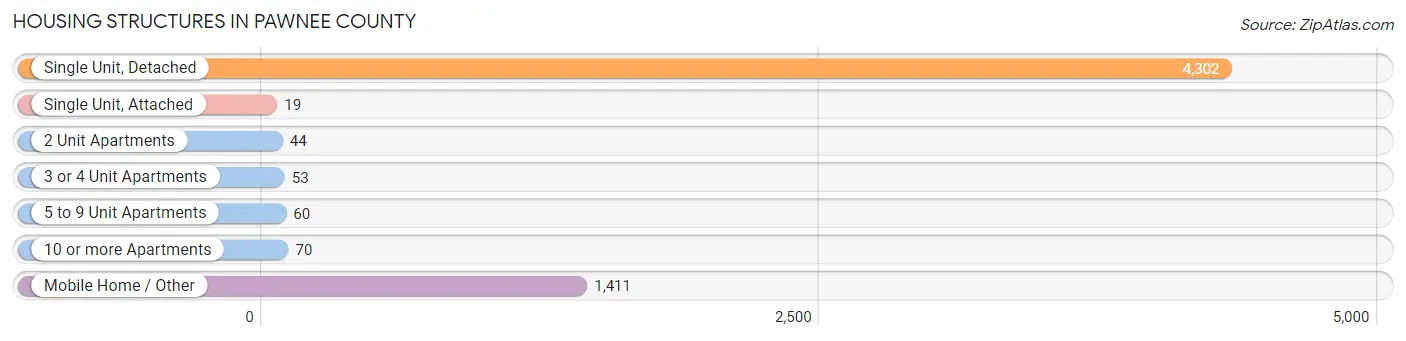
| Structure Type | # Housing Units | % Housing Units |
| Single Unit, Detached | 4,302 | 72.2% |
| Single Unit, Attached | 19 | 0.3% |
| 2 Unit Apartments | 44 | 0.7% |
| 3 or 4 Unit Apartments | 53 | 0.9% |
| 5 to 9 Unit Apartments | 60 | 1.0% |
| 10 or more Apartments | 70 | 1.2% |
| Mobile Home / Other | 1,411 | 23.7% |
| Total | 5,959 | 100.0% |
Housing Structures by Occupancy in Pawnee County
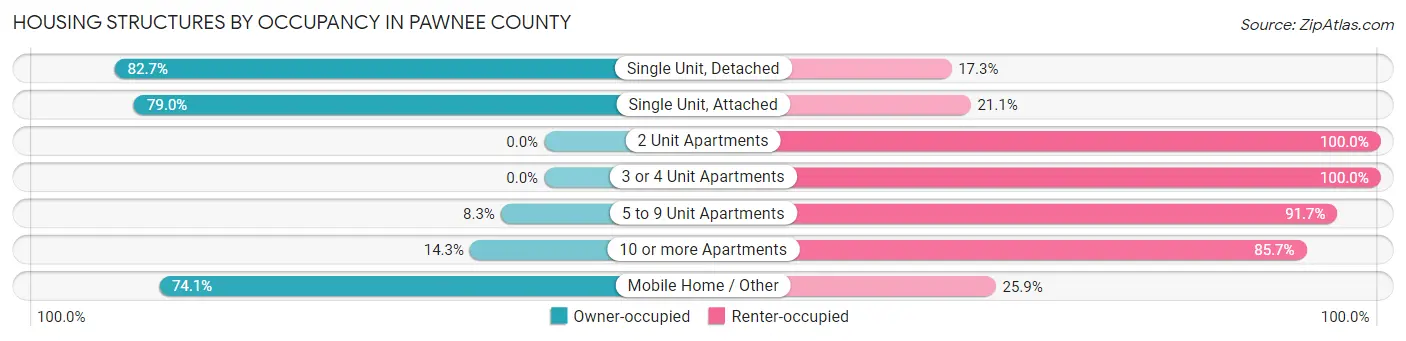
| Structure Type | Owner-occupied | Renter-occupied |
| Single Unit, Detached | 3,556 (82.7%) | 746 (17.3%) |
| Single Unit, Attached | 15 (78.9%) | 4 (21.0%) |
| 2 Unit Apartments | 0 (0.0%) | 44 (100.0%) |
| 3 or 4 Unit Apartments | 0 (0.0%) | 53 (100.0%) |
| 5 to 9 Unit Apartments | 5 (8.3%) | 55 (91.7%) |
| 10 or more Apartments | 10 (14.3%) | 60 (85.7%) |
| Mobile Home / Other | 1,046 (74.1%) | 365 (25.9%) |
| Total | 4,632 (77.7%) | 1,327 (22.3%) |
Housing Structures by Number of Rooms in Pawnee County
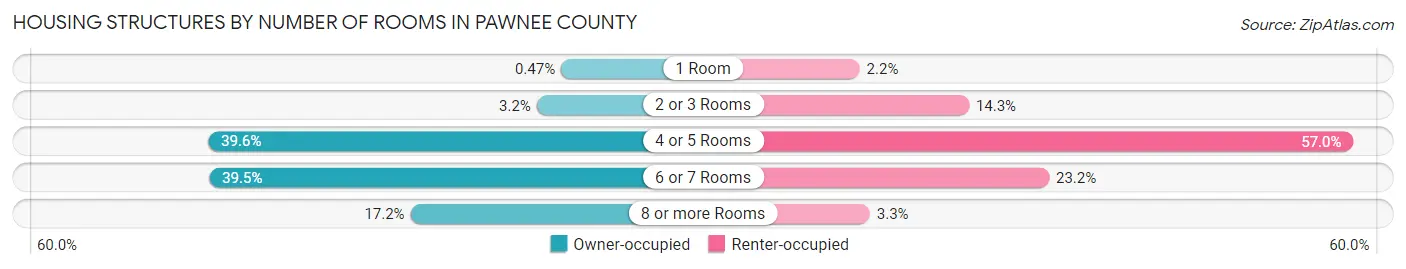
| Number of Rooms | Owner-occupied | Renter-occupied |
| 1 Room | 22 (0.5%) | 29 (2.2%) |
| 2 or 3 Rooms | 147 (3.2%) | 190 (14.3%) |
| 4 or 5 Rooms | 1,836 (39.6%) | 756 (57.0%) |
| 6 or 7 Rooms | 1,831 (39.5%) | 308 (23.2%) |
| 8 or more Rooms | 796 (17.2%) | 44 (3.3%) |
| Total | 4,632 (100.0%) | 1,327 (100.0%) |
Housing Structure by Heating Type in Pawnee County
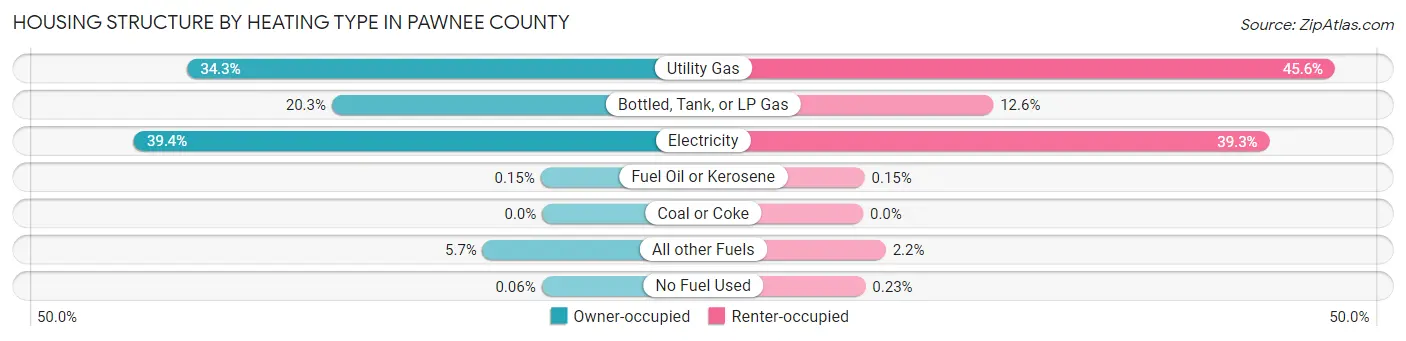
| Heating Type | Owner-occupied | Renter-occupied |
| Utility Gas | 1,588 (34.3%) | 605 (45.6%) |
| Bottled, Tank, or LP Gas | 941 (20.3%) | 167 (12.6%) |
| Electricity | 1,827 (39.4%) | 521 (39.3%) |
| Fuel Oil or Kerosene | 7 (0.2%) | 2 (0.2%) |
| Coal or Coke | 0 (0.0%) | 0 (0.0%) |
| All other Fuels | 266 (5.7%) | 29 (2.2%) |
| No Fuel Used | 3 (0.1%) | 3 (0.2%) |
| Total | 4,632 (100.0%) | 1,327 (100.0%) |
Household Vehicle Usage in Pawnee County
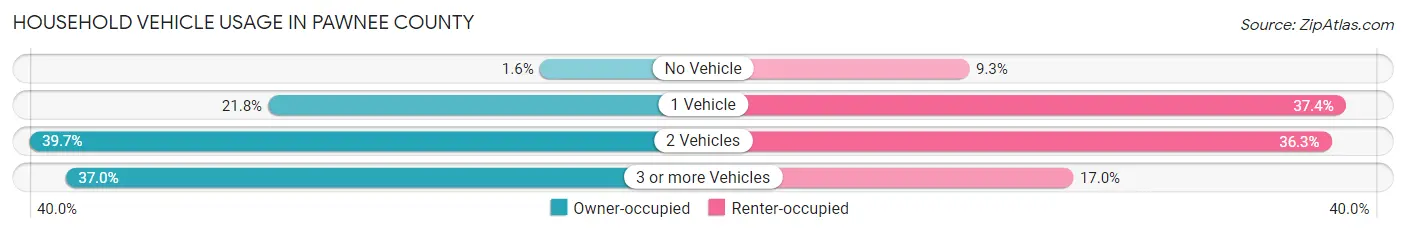
| Vehicles per Household | Owner-occupied | Renter-occupied |
| No Vehicle | 72 (1.5%) | 123 (9.3%) |
| 1 Vehicle | 1,011 (21.8%) | 496 (37.4%) |
| 2 Vehicles | 1,837 (39.7%) | 482 (36.3%) |
| 3 or more Vehicles | 1,712 (37.0%) | 226 (17.0%) |
| Total | 4,632 (100.0%) | 1,327 (100.0%) |
Real Estate & Mortgages in Pawnee County
Real Estate and Mortgage Overview in Pawnee County
| Characteristic | Without Mortgage | With Mortgage |
| Housing Units | 2,780 | 1,852 |
| Median Property Value | $92,800 | $145,700 |
| Median Household Income | $48,714 | $316 |
| Monthly Housing Costs | $396 | $32 |
| Real Estate Taxes | $568 | $66 |
Property Value by Mortgage Status in Pawnee County
| Property Value | Without Mortgage | With Mortgage |
| Less than $50,000 | 710 (25.5%) | 119 (6.4%) |
| $50,000 to $99,999 | 794 (28.6%) | 383 (20.7%) |
| $100,000 to $299,999 | 1,028 (37.0%) | 1,111 (60.0%) |
| $300,000 to $499,999 | 143 (5.1%) | 188 (10.2%) |
| $500,000 to $749,999 | 84 (3.0%) | 23 (1.2%) |
| $750,000 to $999,999 | 14 (0.5%) | 20 (1.1%) |
| $1,000,000 or more | 7 (0.3%) | 8 (0.4%) |
| Total | 2,780 (100.0%) | 1,852 (100.0%) |
Household Income by Mortgage Status in Pawnee County
| Household Income | Without Mortgage | With Mortgage |
| Less than $10,000 | 166 (6.0%) | 60 (3.2%) |
| $10,000 to $24,999 | 429 (15.4%) | 34 (1.8%) |
| $25,000 to $34,999 | 324 (11.7%) | 105 (5.7%) |
| $35,000 to $49,999 | 507 (18.2%) | 93 (5.0%) |
| $50,000 to $74,999 | 456 (16.4%) | 214 (11.6%) |
| $75,000 to $99,999 | 341 (12.3%) | 355 (19.2%) |
| $100,000 to $149,999 | 392 (14.1%) | 313 (16.9%) |
| $150,000 or more | 165 (5.9%) | 422 (22.8%) |
| Total | 2,780 (100.0%) | 1,852 (100.0%) |
Property Value to Household Income Ratio in Pawnee County
| Value-to-Income Ratio | Without Mortgage | With Mortgage |
| Less than 2.0x | 1,488 (53.5%) | 86,106 (4,649.3%) |
| 2.0x to 2.9x | 410 (14.7%) | 998 (53.9%) |
| 3.0x to 3.9x | 231 (8.3%) | 455 (24.6%) |
| 4.0x or more | 583 (21.0%) | 157 (8.5%) |
| Total | 2,780 (100.0%) | 1,852 (100.0%) |
Real Estate Taxes by Mortgage Status in Pawnee County
| Property Taxes | Without Mortgage | With Mortgage |
| Less than $800 | 1,604 (57.7%) | 5 (0.3%) |
| $800 to $1,499 | 513 (18.4%) | 554 (29.9%) |
| $800 to $1,499 | 452 (16.3%) | 678 (36.6%) |
| Total | 2,780 (100.0%) | 1,852 (100.0%) |
Health & Disability in Pawnee County
Health Insurance Coverage by Age in Pawnee County
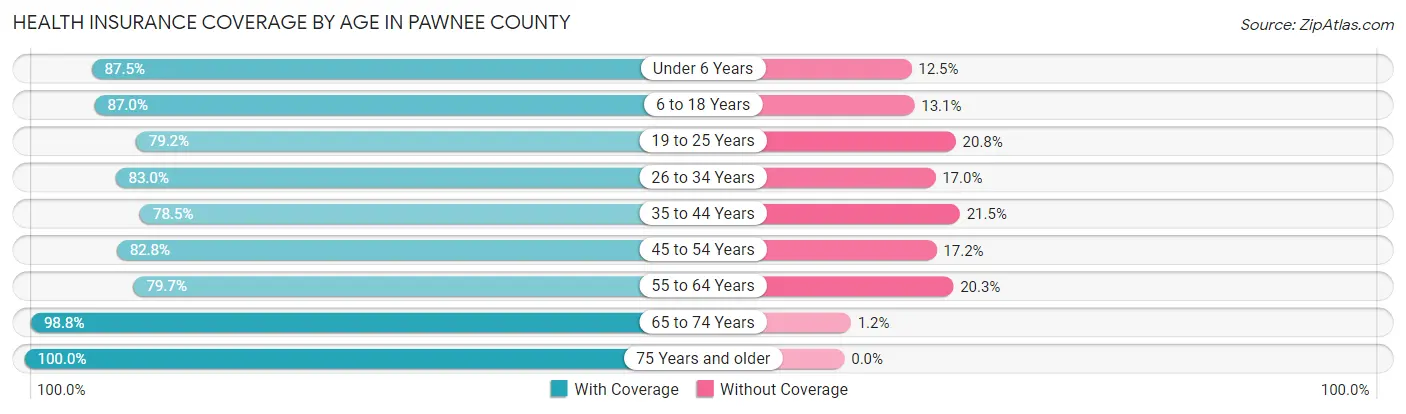
| Age Bracket | With Coverage | Without Coverage |
| Under 6 Years | 958 (87.5%) | 137 (12.5%) |
| 6 to 18 Years | 2,425 (87.0%) | 364 (13.1%) |
| 19 to 25 Years | 954 (79.2%) | 250 (20.8%) |
| 26 to 34 Years | 1,258 (83.0%) | 257 (17.0%) |
| 35 to 44 Years | 1,458 (78.5%) | 400 (21.5%) |
| 45 to 54 Years | 1,634 (82.8%) | 339 (17.2%) |
| 55 to 64 Years | 1,723 (79.7%) | 439 (20.3%) |
| 65 to 74 Years | 1,732 (98.8%) | 21 (1.2%) |
| 75 Years and older | 1,149 (100.0%) | 0 (0.0%) |
| Total | 13,291 (85.8%) | 2,207 (14.2%) |
Health Insurance Coverage by Citizenship Status in Pawnee County
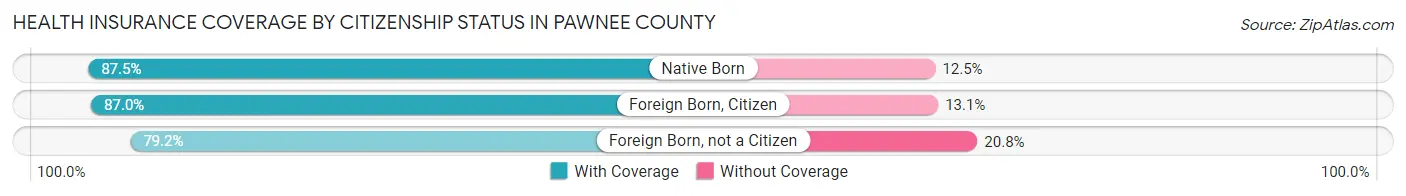
| Citizenship Status | With Coverage | Without Coverage |
| Native Born | 958 (87.5%) | 137 (12.5%) |
| Foreign Born, Citizen | 2,425 (87.0%) | 364 (13.1%) |
| Foreign Born, not a Citizen | 954 (79.2%) | 250 (20.8%) |
Health Insurance Coverage by Household Income in Pawnee County
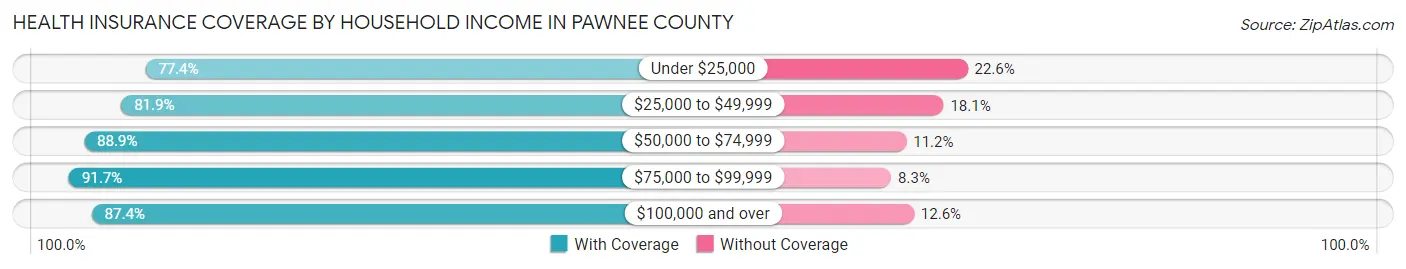
| Household Income | With Coverage | Without Coverage |
| Under $25,000 | 1,628 (77.4%) | 476 (22.6%) |
| $25,000 to $49,999 | 2,804 (81.9%) | 620 (18.1%) |
| $50,000 to $74,999 | 2,646 (88.8%) | 332 (11.2%) |
| $75,000 to $99,999 | 2,196 (91.7%) | 199 (8.3%) |
| $100,000 and over | 3,978 (87.4%) | 572 (12.6%) |
Public vs Private Health Insurance Coverage by Age in Pawnee County
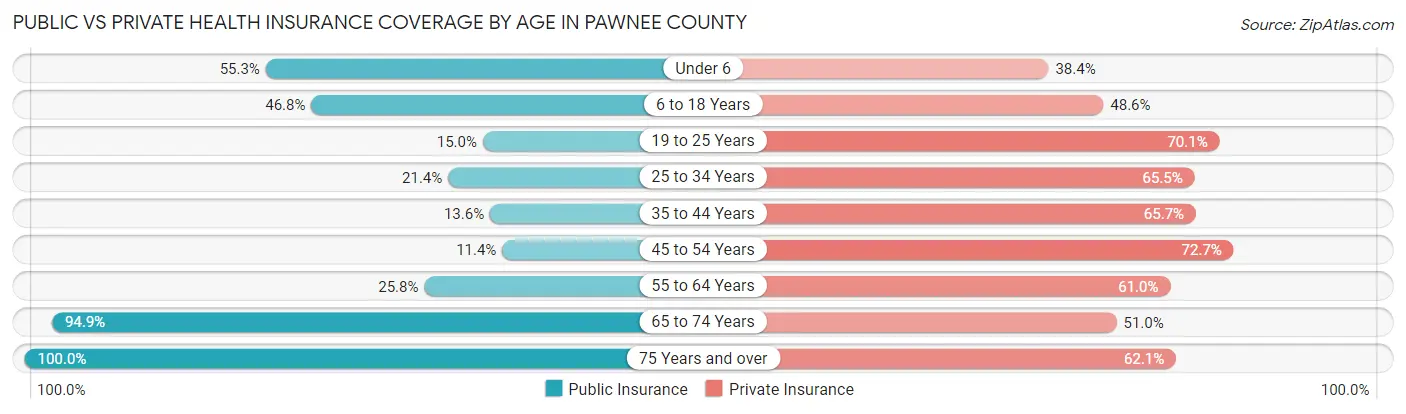
| Age Bracket | Public Insurance | Private Insurance |
| Under 6 | 605 (55.2%) | 420 (38.4%) |
| 6 to 18 Years | 1,305 (46.8%) | 1,354 (48.5%) |
| 19 to 25 Years | 180 (14.9%) | 844 (70.1%) |
| 25 to 34 Years | 324 (21.4%) | 992 (65.5%) |
| 35 to 44 Years | 253 (13.6%) | 1,221 (65.7%) |
| 45 to 54 Years | 224 (11.4%) | 1,435 (72.7%) |
| 55 to 64 Years | 558 (25.8%) | 1,318 (61.0%) |
| 65 to 74 Years | 1,664 (94.9%) | 894 (51.0%) |
| 75 Years and over | 1,149 (100.0%) | 713 (62.1%) |
| Total | 6,262 (40.4%) | 9,191 (59.3%) |
Disability Status by Sex by Age in Pawnee County
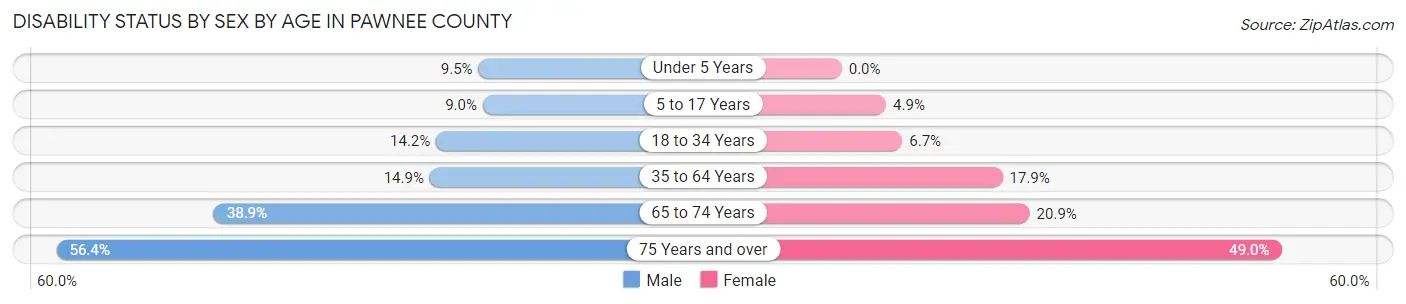
| Age Bracket | Male | Female |
| Under 5 Years | 49 (9.5%) | 0 (0.0%) |
| 5 to 17 Years | 130 (9.0%) | 64 (4.9%) |
| 18 to 34 Years | 219 (14.2%) | 93 (6.7%) |
| 35 to 64 Years | 448 (14.9%) | 534 (17.9%) |
| 65 to 74 Years | 325 (38.9%) | 192 (20.9%) |
| 75 Years and over | 298 (56.4%) | 304 (48.9%) |
Disability Class by Sex by Age in Pawnee County
Disability Class: Hearing Difficulty
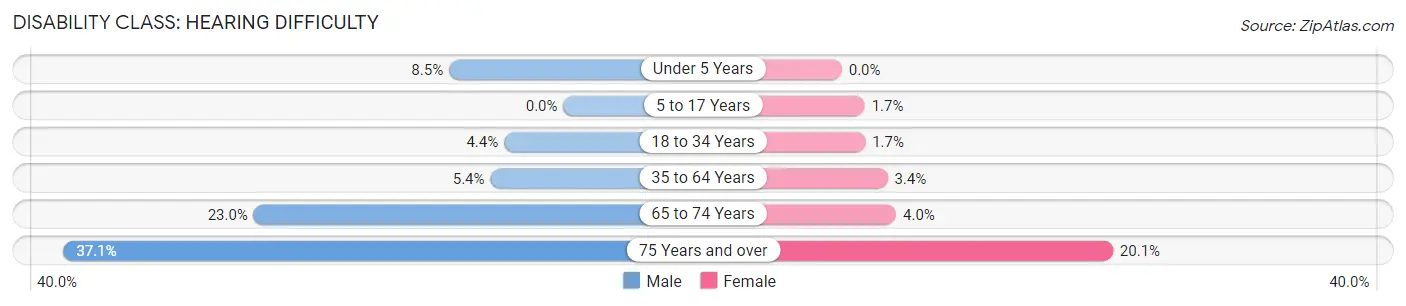
| Age Bracket | Male | Female |
| Under 5 Years | 44 (8.5%) | 0 (0.0%) |
| 5 to 17 Years | 0 (0.0%) | 22 (1.7%) |
| 18 to 34 Years | 68 (4.4%) | 24 (1.7%) |
| 35 to 64 Years | 163 (5.4%) | 101 (3.4%) |
| 65 to 74 Years | 192 (23.0%) | 37 (4.0%) |
| 75 Years and over | 196 (37.1%) | 125 (20.1%) |
Disability Class: Vision Difficulty
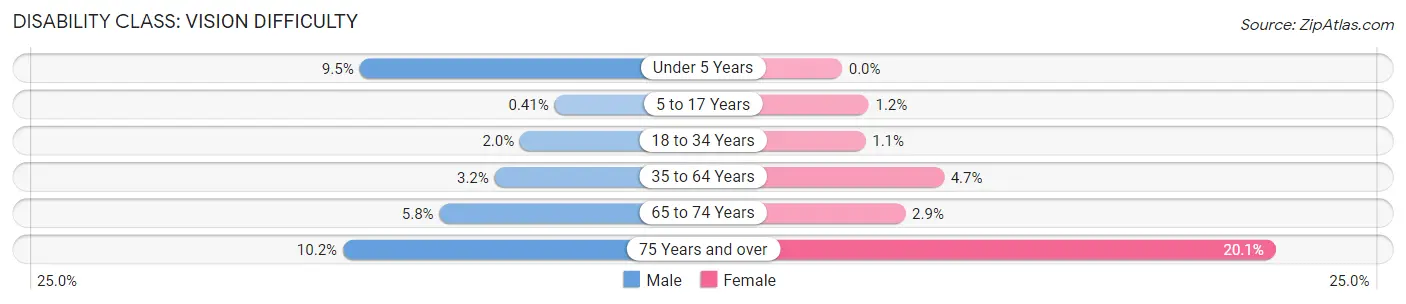
| Age Bracket | Male | Female |
| Under 5 Years | 49 (9.5%) | 0 (0.0%) |
| 5 to 17 Years | 6 (0.4%) | 16 (1.2%) |
| 18 to 34 Years | 31 (2.0%) | 15 (1.1%) |
| 35 to 64 Years | 96 (3.2%) | 141 (4.7%) |
| 65 to 74 Years | 48 (5.8%) | 27 (2.9%) |
| 75 Years and over | 54 (10.2%) | 125 (20.1%) |
Disability Class: Cognitive Difficulty
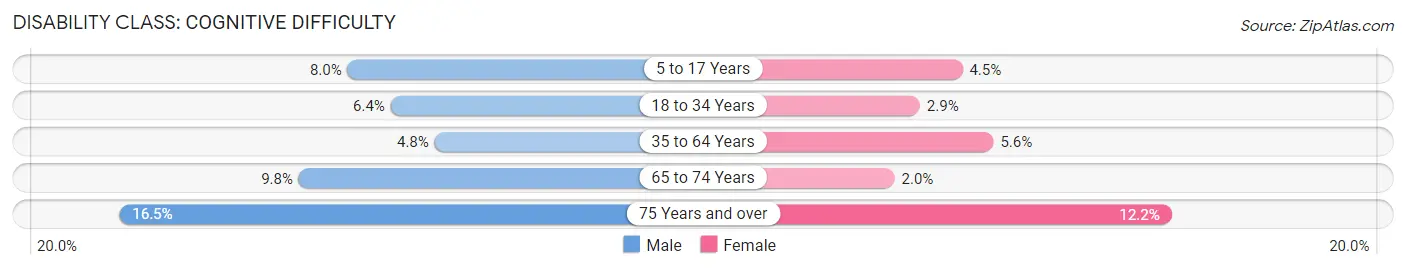
| Age Bracket | Male | Female |
| 5 to 17 Years | 116 (8.0%) | 58 (4.5%) |
| 18 to 34 Years | 99 (6.4%) | 40 (2.9%) |
| 35 to 64 Years | 144 (4.8%) | 168 (5.6%) |
| 65 to 74 Years | 82 (9.8%) | 18 (2.0%) |
| 75 Years and over | 87 (16.5%) | 76 (12.2%) |
Disability Class: Ambulatory Difficulty
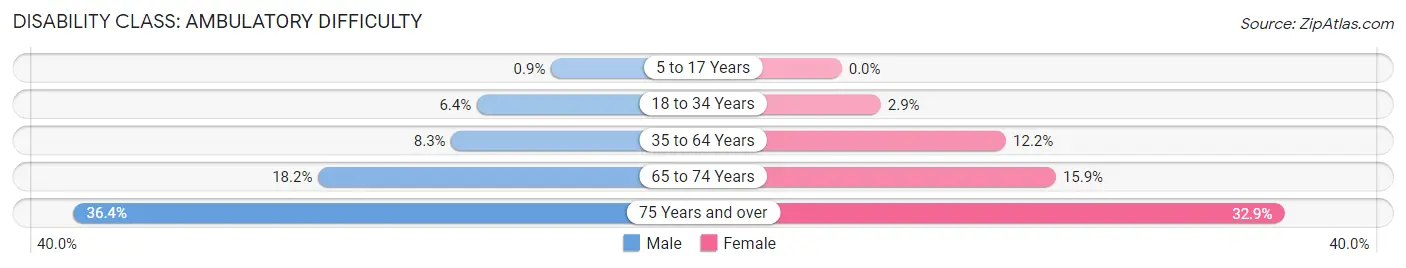
| Age Bracket | Male | Female |
| 5 to 17 Years | 13 (0.9%) | 0 (0.0%) |
| 18 to 34 Years | 99 (6.4%) | 40 (2.9%) |
| 35 to 64 Years | 250 (8.3%) | 364 (12.2%) |
| 65 to 74 Years | 152 (18.2%) | 146 (15.9%) |
| 75 Years and over | 192 (36.4%) | 204 (32.9%) |
Disability Class: Self-Care Difficulty
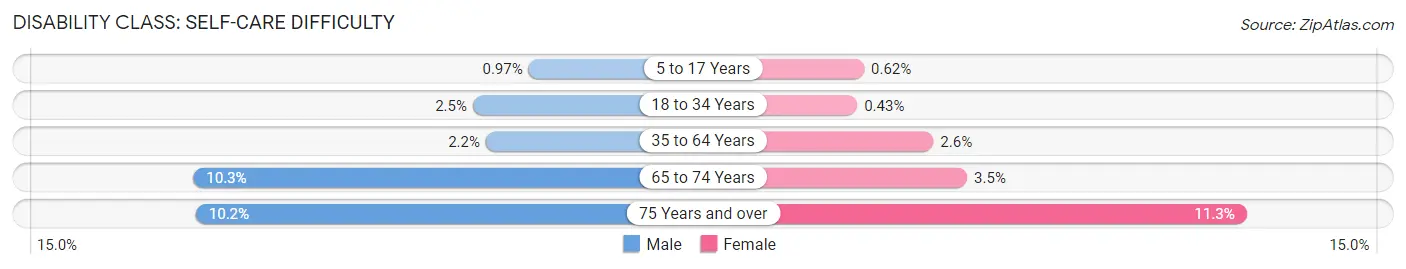
| Age Bracket | Male | Female |
| 5 to 17 Years | 14 (1.0%) | 8 (0.6%) |
| 18 to 34 Years | 39 (2.5%) | 6 (0.4%) |
| 35 to 64 Years | 65 (2.2%) | 76 (2.5%) |
| 65 to 74 Years | 86 (10.3%) | 32 (3.5%) |
| 75 Years and over | 54 (10.2%) | 70 (11.3%) |
Technology Access in Pawnee County
Computing Device Access in Pawnee County
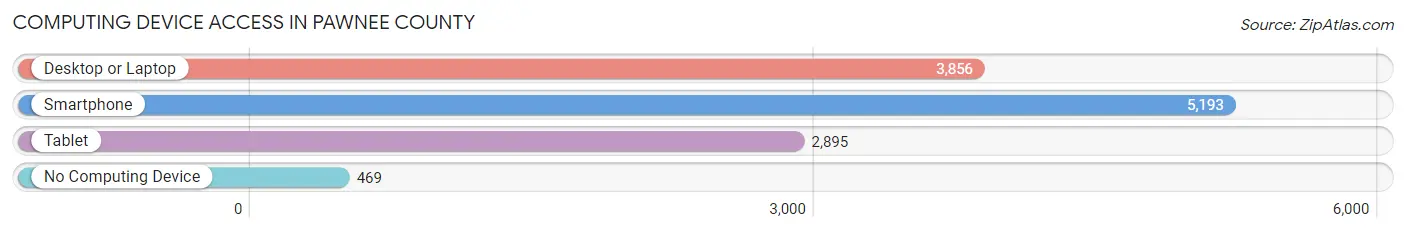
| Device Type | # Households | % Households |
| Desktop or Laptop | 3,856 | 64.7% |
| Smartphone | 5,193 | 87.2% |
| Tablet | 2,895 | 48.6% |
| No Computing Device | 469 | 7.9% |
| Total | 5,959 | 100.0% |
Internet Access in Pawnee County
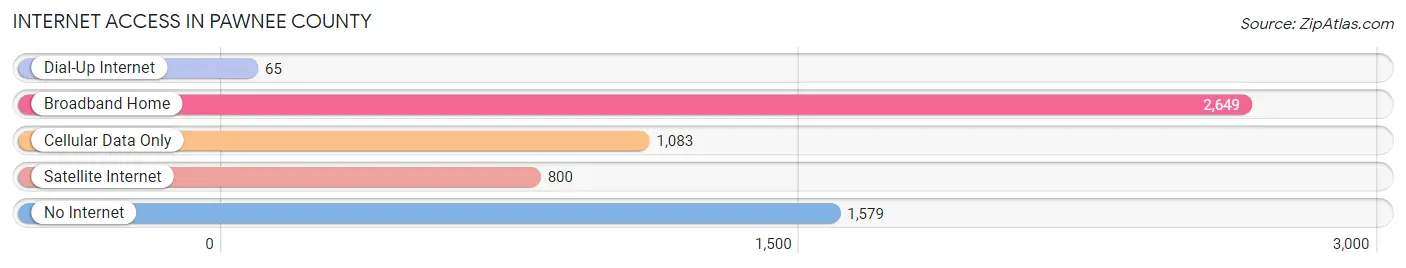
| Internet Type | # Households | % Households |
| Dial-Up Internet | 65 | 1.1% |
| Broadband Home | 2,649 | 44.5% |
| Cellular Data Only | 1,083 | 18.2% |
| Satellite Internet | 800 | 13.4% |
| No Internet | 1,579 | 26.5% |
| Total | 5,959 | 100.0% |
Pawnee County Summary
Pawnee County is located in the north-central region of Oklahoma, and is bordered by Noble County to the north, Payne County to the east, Creek County to the south, and Osage County to the west. The county seat is Pawnee, and the county was named for the Pawnee Native American tribe. As of the 2010 census, the population of Pawnee County was 16,577.
Geography
Pawnee County covers an area of 845 square miles, and is located in the Osage Plains region of Oklahoma. The terrain is mostly flat, with some rolling hills in the northern part of the county. The Arkansas River runs through the county, and there are several small lakes and ponds scattered throughout the area. The county is home to several wildlife refuges, including the Pawnee National Grassland, which is managed by the U.S. Fish and Wildlife Service.
Climate
Pawnee County has a humid subtropical climate, with hot summers and mild winters. The average annual temperature is 61°F, and the average annual precipitation is 36 inches.
Demographics
As of the 2010 census, the population of Pawnee County was 16,577, with a population density of 19.5 people per square mile. The racial makeup of the county was 79.2% White, 8.2% Native American, 0.7% Black or African American, 0.3% Asian, 0.1% Pacific Islander, and 10.5% from other races. The median household income was $37,945, and the median family income was $45,938.
Economy
The economy of Pawnee County is largely based on agriculture, with wheat, corn, and soybeans being the main crops. The county is also home to several oil and gas fields, and there are several manufacturing and service industries in the area. The county is home to several large employers, including the Pawnee County Hospital, the Pawnee County Sheriff's Office, and the Pawnee County Courthouse.
History
Pawnee County was established in 1890, and was named for the Pawnee Native American tribe. The county was originally part of the Creek Nation, and was opened to settlement in 1889. The first settlers arrived in the area in 1890, and the county was officially organized in 1891. The county seat was established in Pawnee, and the first courthouse was built in 1892.
The county experienced rapid growth in the early 20th century, and by 1910 the population had reached 10,000. The county continued to grow throughout the 20th century, and by 2000 the population had reached 16,577.
Today, Pawnee County is a thriving agricultural and oil and gas producing region. The county is home to several large employers, and is a popular destination for outdoor recreation. The county is also home to several historic sites, including the Pawnee Bill Ranch and Museum, the Pawnee County Courthouse, and the Pawnee National Grassland.
Common Questions
What is Per Capita Income in Pawnee County?
Per Capita income in Pawnee County is $28,327.
What is the Median Family Income in Pawnee County?
Median Family Income in Pawnee County is $69,395.
What is the Median Household income in Pawnee County?
Median Household Income in Pawnee County is $56,279.
What is Income or Wage Gap in Pawnee County?
Income or Wage Gap in Pawnee County is 31.2%.
Women in Pawnee County earn 68.8 cents for every dollar earned by a man.
What is Family Income Deficit in Pawnee County?
Family Income Deficit in Pawnee County is $11,217.
Families that are below poverty line in Pawnee County earn $11,217 less on average than the poverty threshold level.
What is Inequality or Gini Index in Pawnee County?
Inequality or Gini Index in Pawnee County is 0.43.
What is the Total Population of Pawnee County?
Total Population of Pawnee County is 15,682.
What is the Total Male Population of Pawnee County?
Total Male Population of Pawnee County is 7,957.
What is the Total Female Population of Pawnee County?
Total Female Population of Pawnee County is 7,725.
What is the Ratio of Males per 100 Females in Pawnee County?
There are 103.00 Males per 100 Females in Pawnee County.
What is the Ratio of Females per 100 Males in Pawnee County?
There are 97.08 Females per 100 Males in Pawnee County.
What is the Median Population Age in Pawnee County?
Median Population Age in Pawnee County is 41.5 Years.
What is the Average Family Size in Pawnee County
Average Family Size in Pawnee County is 3.1 People.
What is the Average Household Size in Pawnee County
Average Household Size in Pawnee County is 2.6 People.
How Large is the Labor Force in Pawnee County?
There are 6,783 People in the Labor Forcein in Pawnee County.
What is the Percentage of People in the Labor Force in Pawnee County?
54.6% of People are in the Labor Force in Pawnee County.
What is the Unemployment Rate in Pawnee County?
Unemployment Rate in Pawnee County is 3.5%.