Ottawa County, OK Map & Demographics
Ottawa County Map
Ottawa County Overview
$24,354
PER CAPITA INCOME
$56,443
AVG FAMILY INCOME
$46,186
AVG HOUSEHOLD INCOME
25.1%
WAGE / INCOME GAP [ % ]
74.9¢/ $1
WAGE / INCOME GAP [ $ ]
$11,068
FAMILY INCOME DEFICIT
0.45
INEQUALITY / GINI INDEX
30,472
TOTAL POPULATION
15,060
MALE POPULATION
15,412
FEMALE POPULATION
97.72
MALES / 100 FEMALES
102.34
FEMALES / 100 MALES
37.6
MEDIAN AGE
3.1
AVG FAMILY SIZE
2.5
AVG HOUSEHOLD SIZE
12,865
LABOR FORCE [ PEOPLE ]
54.2%
PERCENT IN LABOR FORCE
3.8%
UNEMPLOYMENT RATE
Ottawa County Area Codes
Income in Ottawa County
Income Overview in Ottawa County
Per Capita Income in Ottawa County is $24,354, while median incomes of families and households are $56,443 and $46,186 respectively.
| Characteristic | Number | Measure |
| Per Capita Income | 30,472 | $24,354 |
| Median Family Income | 7,572 | $56,443 |
| Mean Family Income | 7,572 | $70,999 |
| Median Household Income | 11,718 | $46,186 |
| Mean Household Income | 11,718 | $61,156 |
| Income Deficit | 7,572 | $11,068 |
| Wage / Income Gap (%) | 30,472 | 25.15% |
| Wage / Income Gap ($) | 30,472 | 74.85¢ per $1 |
| Gini / Inequality Index | 30,472 | 0.45 |
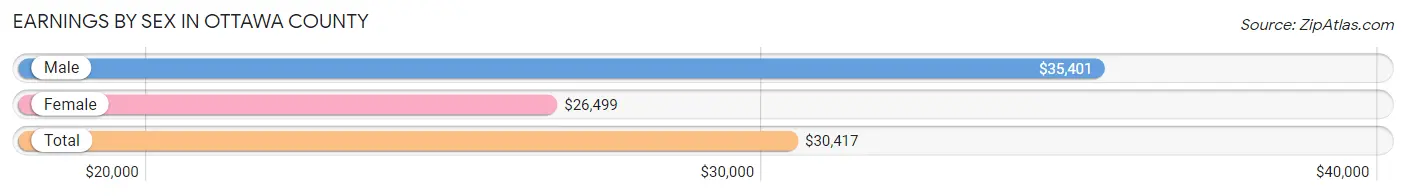
Earnings by Sex in Ottawa County
Average Earnings in Ottawa County are $30,417, $35,401 for men and $26,499 for women, a difference of 25.2%.
| Sex | Number | Average Earnings |
| Male | 7,019 (50.9%) | $35,401 |
| Female | 6,759 (49.1%) | $26,499 |
| Total | 13,778 (100.0%) | $30,417 |
Earnings by Sex by Income Bracket in Ottawa County
The most common earnings brackets in Ottawa County are $30,000 to $34,999 for men (600 | 8.6%) and $25,000 to $29,999 for women (746 | 11.0%).
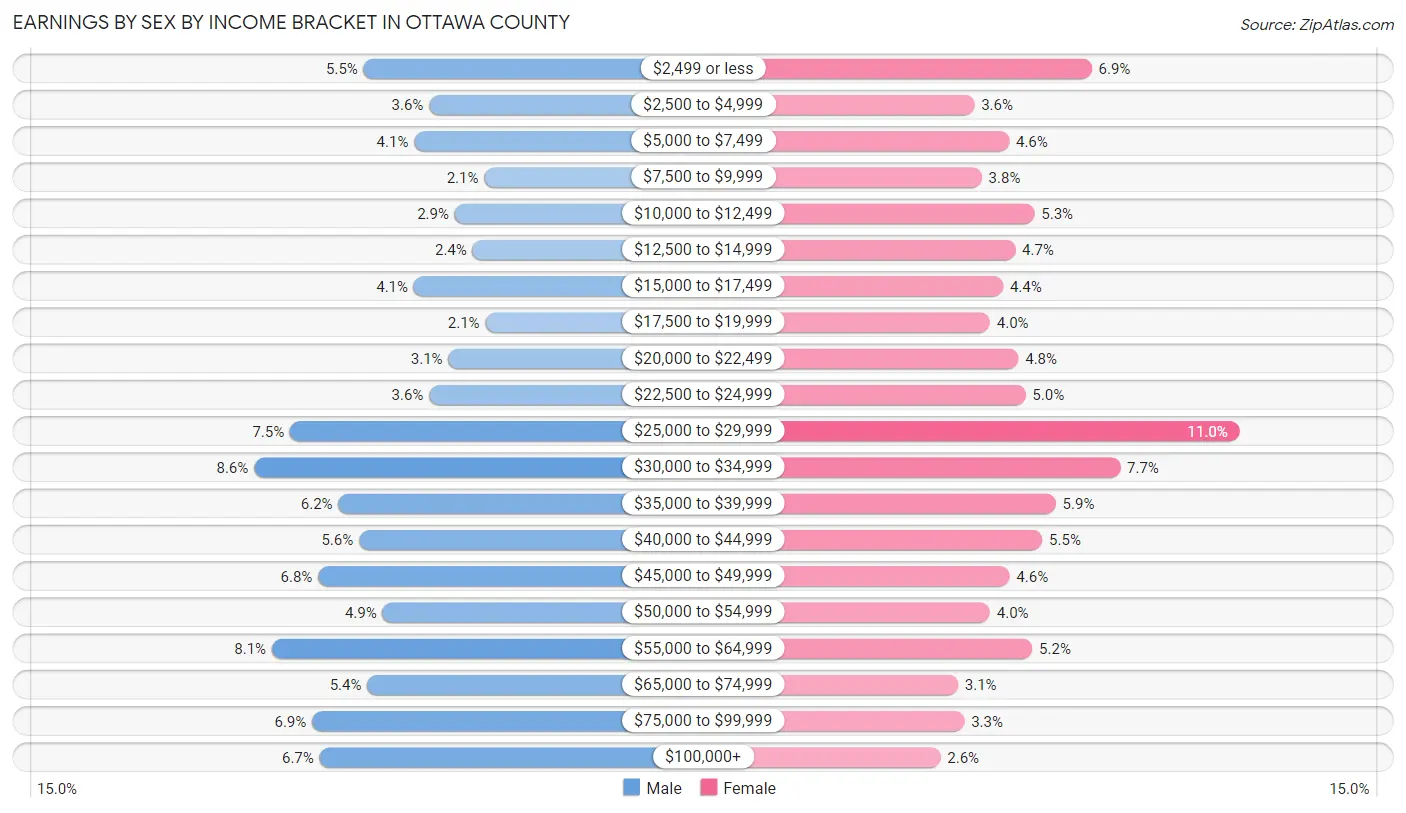
| Income | Male | Female |
| $2,499 or less | 384 (5.5%) | 465 (6.9%) |
| $2,500 to $4,999 | 255 (3.6%) | 242 (3.6%) |
| $5,000 to $7,499 | 284 (4.1%) | 308 (4.6%) |
| $7,500 to $9,999 | 146 (2.1%) | 256 (3.8%) |
| $10,000 to $12,499 | 204 (2.9%) | 356 (5.3%) |
| $12,500 to $14,999 | 169 (2.4%) | 320 (4.7%) |
| $15,000 to $17,499 | 285 (4.1%) | 297 (4.4%) |
| $17,500 to $19,999 | 144 (2.1%) | 272 (4.0%) |
| $20,000 to $22,499 | 217 (3.1%) | 326 (4.8%) |
| $22,500 to $24,999 | 255 (3.6%) | 339 (5.0%) |
| $25,000 to $29,999 | 529 (7.5%) | 746 (11.0%) |
| $30,000 to $34,999 | 600 (8.6%) | 519 (7.7%) |
| $35,000 to $39,999 | 434 (6.2%) | 397 (5.9%) |
| $40,000 to $44,999 | 393 (5.6%) | 371 (5.5%) |
| $45,000 to $49,999 | 474 (6.8%) | 309 (4.6%) |
| $50,000 to $54,999 | 347 (4.9%) | 272 (4.0%) |
| $55,000 to $64,999 | 565 (8.1%) | 352 (5.2%) |
| $65,000 to $74,999 | 377 (5.4%) | 211 (3.1%) |
| $75,000 to $99,999 | 486 (6.9%) | 223 (3.3%) |
| $100,000+ | 471 (6.7%) | 178 (2.6%) |
| Total | 7,019 (100.0%) | 6,759 (100.0%) |
Earnings by Sex by Educational Attainment in Ottawa County
Average earnings in Ottawa County are $41,182 for men and $29,537 for women, a difference of 28.3%. Men with an educational attainment of graduate degree enjoy the highest average annual earnings of $58,125, while those with less than high school education earn the least with $31,047. Women with an educational attainment of graduate degree earn the most with the average annual earnings of $59,643, while those with less than high school education have the smallest earnings of $21,080.
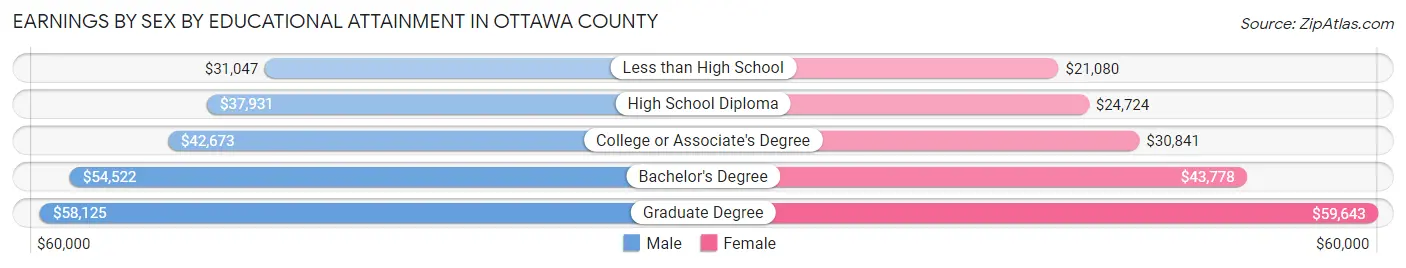
| Educational Attainment | Male Income | Female Income |
| Less than High School | $31,047 | $21,080 |
| High School Diploma | $37,931 | $24,724 |
| College or Associate's Degree | $42,673 | $30,841 |
| Bachelor's Degree | $54,522 | $43,778 |
| Graduate Degree | $58,125 | $59,643 |
| Total | $41,182 | $29,537 |
Family Income in Ottawa County
Family Income Brackets in Ottawa County
According to the Ottawa County family income data, there are 1,681 families falling into the $50,000 to $74,999 income range, which is the most common income bracket and makes up 22.2% of all families. Conversely, the $200,000+ income bracket is the least frequent group with only 212 families (2.8%) belonging to this category.
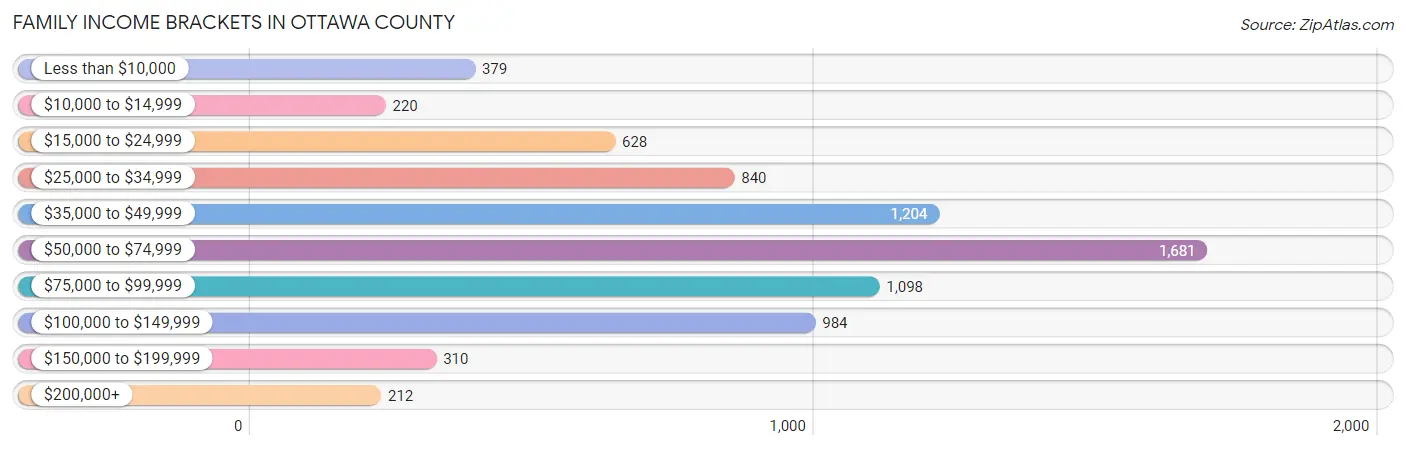
| Income Bracket | # Families | % Families |
| Less than $10,000 | 379 | 5.0% |
| $10,000 to $14,999 | 220 | 2.9% |
| $15,000 to $24,999 | 628 | 8.3% |
| $25,000 to $34,999 | 840 | 11.1% |
| $35,000 to $49,999 | 1,204 | 15.9% |
| $50,000 to $74,999 | 1,681 | 22.2% |
| $75,000 to $99,999 | 1,098 | 14.5% |
| $100,000 to $149,999 | 984 | 13.0% |
| $150,000 to $199,999 | 310 | 4.1% |
| $200,000+ | 212 | 2.8% |
Family Income by Famaliy Size in Ottawa County
6-person families (258 | 3.4%) account for the highest median family income in Ottawa County with $67,500 per family, while 2-person families (3,687 | 48.7%) have the highest median income of $26,404 per family member.
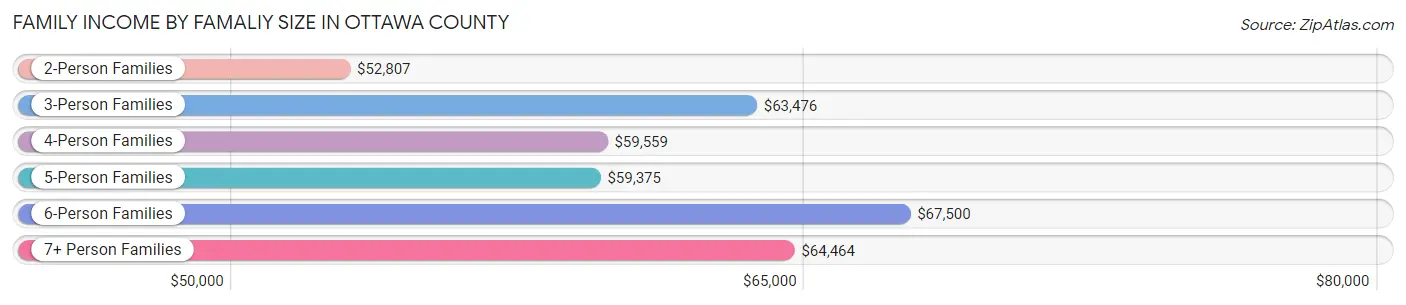
| Income Bracket | # Families | Median Income |
| 2-Person Families | 3,687 (48.7%) | $52,807 |
| 3-Person Families | 1,648 (21.8%) | $63,476 |
| 4-Person Families | 1,224 (16.2%) | $59,559 |
| 5-Person Families | 623 (8.2%) | $59,375 |
| 6-Person Families | 258 (3.4%) | $67,500 |
| 7+ Person Families | 132 (1.7%) | $64,464 |
| Total | 7,572 (100.0%) | $56,443 |
Family Income by Number of Earners in Ottawa County
The median family income in Ottawa County is $56,443, with families comprising 3+ earners (534) having the highest median family income of $108,214, while families with no earners (1,502) have the lowest median family income of $32,324, accounting for 7.0% and 19.8% of families, respectively.
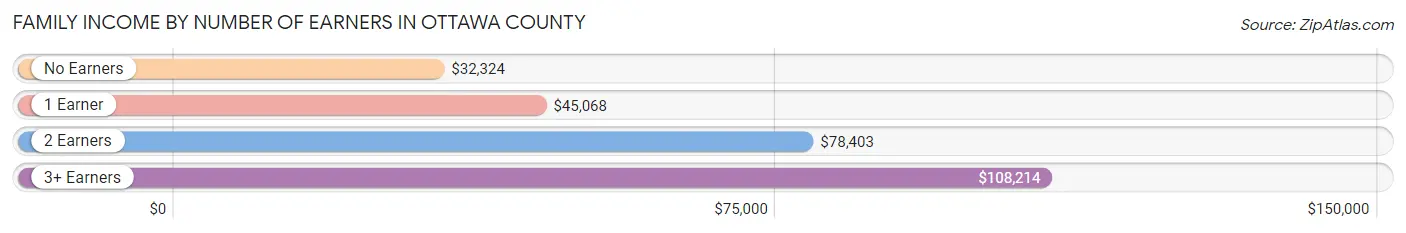
| Number of Earners | # Families | Median Income |
| No Earners | 1,502 (19.8%) | $32,324 |
| 1 Earner | 2,808 (37.1%) | $45,068 |
| 2 Earners | 2,728 (36.0%) | $78,403 |
| 3+ Earners | 534 (7.0%) | $108,214 |
| Total | 7,572 (100.0%) | $56,443 |
Household Income in Ottawa County
Household Income Brackets in Ottawa County
With 2,355 households falling in the category, the $50,000 to $74,999 income range is the most frequent in Ottawa County, accounting for 20.1% of all households. In contrast, only 258 households (2.2%) fall into the $200,000+ income bracket, making it the least populous group.
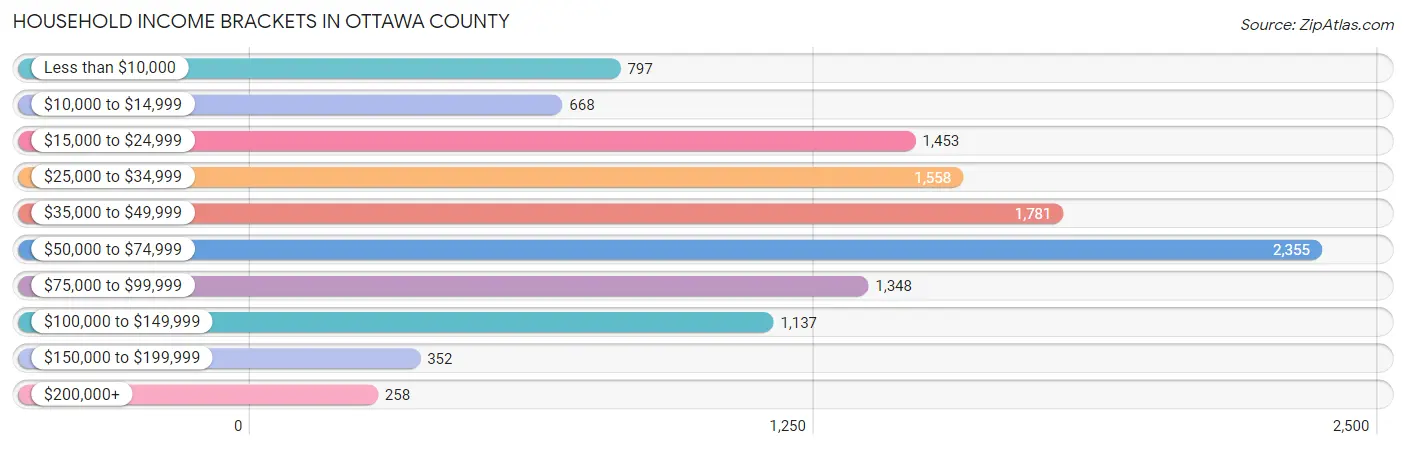
| Income Bracket | # Households | % Households |
| Less than $10,000 | 797 | 6.8% |
| $10,000 to $14,999 | 668 | 5.7% |
| $15,000 to $24,999 | 1,453 | 12.4% |
| $25,000 to $34,999 | 1,558 | 13.3% |
| $35,000 to $49,999 | 1,781 | 15.2% |
| $50,000 to $74,999 | 2,355 | 20.1% |
| $75,000 to $99,999 | 1,348 | 11.5% |
| $100,000 to $149,999 | 1,137 | 9.7% |
| $150,000 to $199,999 | 352 | 3.0% |
| $200,000+ | 258 | 2.2% |
Household Income by Householder Age in Ottawa County
The median household income in Ottawa County is $46,186, with the highest median household income of $54,087 found in the 45 to 64 years age bracket for the primary householder. A total of 4,076 households (34.8%) fall into this category. Meanwhile, the 65+ years age bracket for the primary householder has the lowest median household income of $35,408, with 3,596 households (30.7%) in this group.
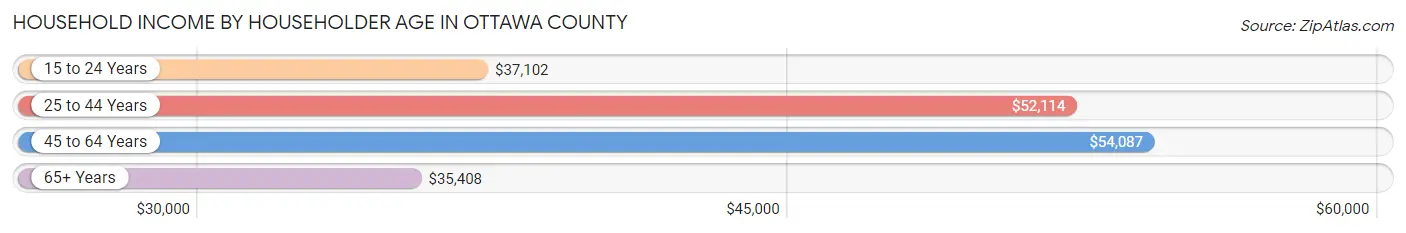
| Income Bracket | # Households | Median Income |
| 15 to 24 Years | 545 (4.6%) | $37,102 |
| 25 to 44 Years | 3,501 (29.9%) | $52,114 |
| 45 to 64 Years | 4,076 (34.8%) | $54,087 |
| 65+ Years | 3,596 (30.7%) | $35,408 |
| Total | 11,718 (100.0%) | $46,186 |
Poverty in Ottawa County
Income Below Poverty by Sex and Age in Ottawa County
With 18.5% poverty level for males and 22.3% for females among the residents of Ottawa County, under 5 year old males and under 5 year old females are the most vulnerable to poverty, with 354 males (35.5%) and 317 females (34.3%) in their respective age groups living below the poverty level.
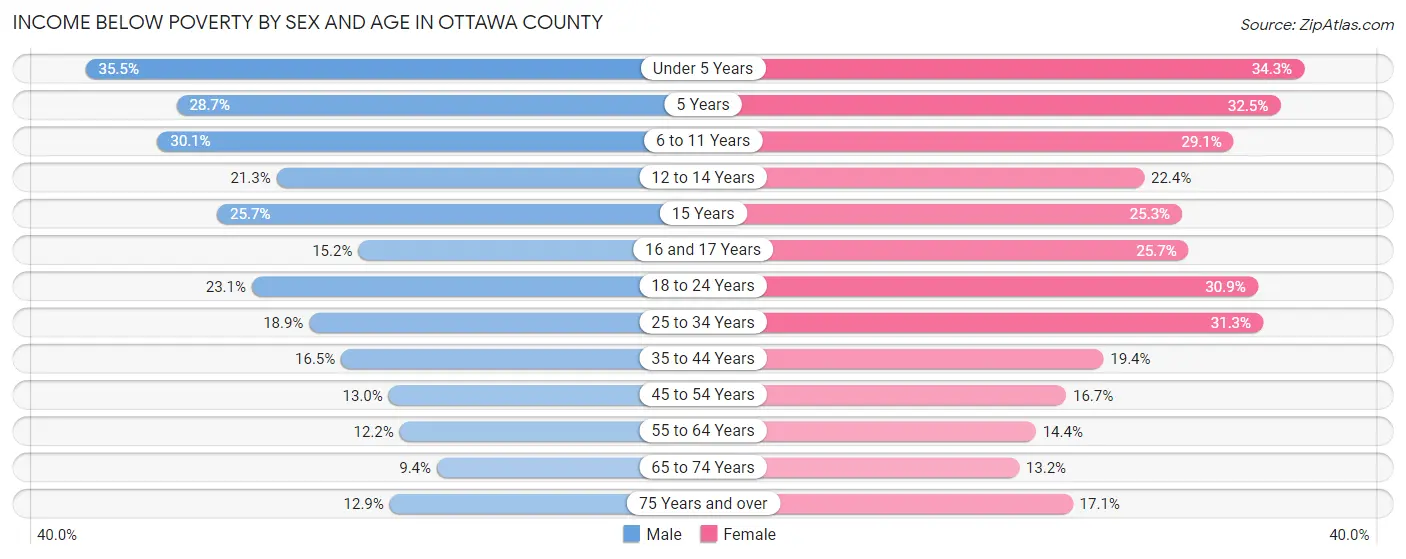
| Age Bracket | Male | Female |
| Under 5 Years | 354 (35.5%) | 317 (34.3%) |
| 5 Years | 56 (28.7%) | 96 (32.5%) |
| 6 to 11 Years | 399 (30.1%) | 359 (29.1%) |
| 12 to 14 Years | 147 (21.3%) | 127 (22.4%) |
| 15 Years | 46 (25.7%) | 51 (25.3%) |
| 16 and 17 Years | 69 (15.2%) | 96 (25.7%) |
| 18 to 24 Years | 290 (23.1%) | 374 (30.9%) |
| 25 to 34 Years | 330 (18.9%) | 577 (31.3%) |
| 35 to 44 Years | 267 (16.5%) | 329 (19.4%) |
| 45 to 54 Years | 225 (13.0%) | 282 (16.7%) |
| 55 to 64 Years | 222 (12.2%) | 278 (14.4%) |
| 65 to 74 Years | 138 (9.4%) | 221 (13.2%) |
| 75 Years and over | 121 (12.9%) | 206 (17.1%) |
| Total | 2,664 (18.5%) | 3,313 (22.3%) |
Income Above Poverty by Sex and Age in Ottawa County
According to the poverty statistics in Ottawa County, males aged 65 to 74 years and females aged 65 to 74 years are the age groups that are most secure financially, with 90.6% of males and 86.9% of females in these age groups living above the poverty line.
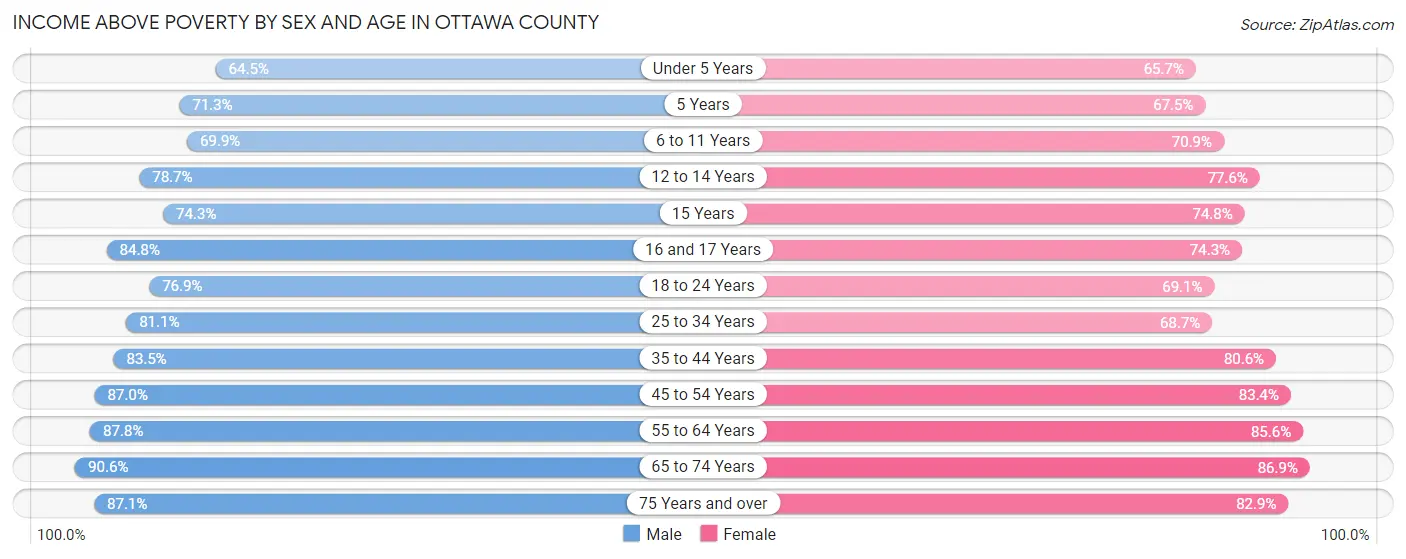
| Age Bracket | Male | Female |
| Under 5 Years | 644 (64.5%) | 607 (65.7%) |
| 5 Years | 139 (71.3%) | 199 (67.5%) |
| 6 to 11 Years | 925 (69.9%) | 875 (70.9%) |
| 12 to 14 Years | 543 (78.7%) | 439 (77.6%) |
| 15 Years | 133 (74.3%) | 151 (74.8%) |
| 16 and 17 Years | 384 (84.8%) | 277 (74.3%) |
| 18 to 24 Years | 964 (76.9%) | 838 (69.1%) |
| 25 to 34 Years | 1,419 (81.1%) | 1,269 (68.7%) |
| 35 to 44 Years | 1,351 (83.5%) | 1,365 (80.6%) |
| 45 to 54 Years | 1,508 (87.0%) | 1,412 (83.4%) |
| 55 to 64 Years | 1,603 (87.8%) | 1,652 (85.6%) |
| 65 to 74 Years | 1,331 (90.6%) | 1,460 (86.9%) |
| 75 Years and over | 817 (87.1%) | 996 (82.9%) |
| Total | 11,761 (81.5%) | 11,540 (77.7%) |
Income Below Poverty Among Married-Couple Families in Ottawa County
The poverty statistics for married-couple families in Ottawa County show that 8.3% or 439 of the total 5,267 families live below the poverty line. Families with 3 or 4 children have the highest poverty rate of 25.4%, comprising of 122 families. On the other hand, families with no children have the lowest poverty rate of 5.7%, which includes 181 families.
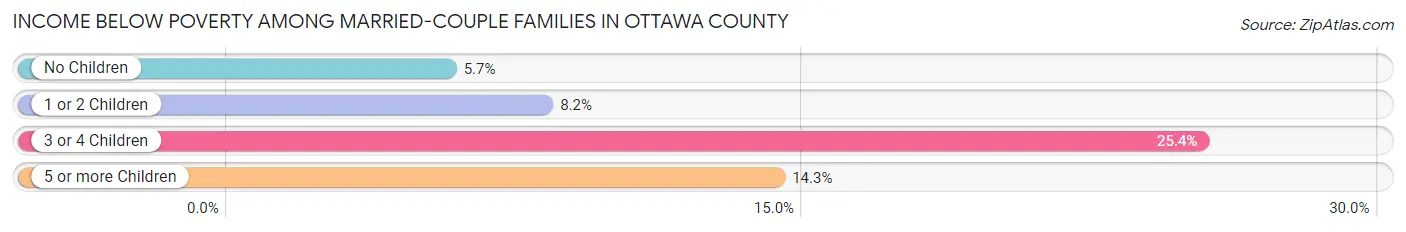
| Children | Above Poverty | Below Poverty |
| No Children | 2,989 (94.3%) | 181 (5.7%) |
| 1 or 2 Children | 1,438 (91.8%) | 129 (8.2%) |
| 3 or 4 Children | 359 (74.6%) | 122 (25.4%) |
| 5 or more Children | 42 (85.7%) | 7 (14.3%) |
| Total | 4,828 (91.7%) | 439 (8.3%) |
Income Below Poverty Among Single-Parent Households in Ottawa County
According to the poverty data in Ottawa County, 21.2% or 162 single-father households and 38.6% or 594 single-mother households are living below the poverty line. Among single-father households, those with 1 or 2 children have the highest poverty rate, with 106 households (28.4%) experiencing poverty. Likewise, among single-mother households, those with 5 or more children have the highest poverty rate, with 32 households (100.0%) falling below the poverty line.
| Children | Single Father | Single Mother |
| No Children | 30 (11.5%) | 40 (8.4%) |
| 1 or 2 Children | 106 (28.4%) | 322 (42.8%) |
| 3 or 4 Children | 26 (23.0%) | 200 (71.9%) |
| 5 or more Children | 0 (0.0%) | 32 (100.0%) |
| Total | 162 (21.2%) | 594 (38.6%) |
Income Below Poverty Among Married-Couple vs Single-Parent Households in Ottawa County
The poverty data for Ottawa County shows that 439 of the married-couple family households (8.3%) and 756 of the single-parent households (32.8%) are living below the poverty level. Within the married-couple family households, those with 3 or 4 children have the highest poverty rate, with 122 households (25.4%) falling below the poverty line. Among the single-parent households, those with 5 or more children have the highest poverty rate, with 32 household (64.0%) living below poverty.
| Children | Married-Couple Families | Single-Parent Households |
| No Children | 181 (5.7%) | 70 (9.5%) |
| 1 or 2 Children | 129 (8.2%) | 428 (38.0%) |
| 3 or 4 Children | 122 (25.4%) | 226 (57.8%) |
| 5 or more Children | 7 (14.3%) | 32 (64.0%) |
| Total | 439 (8.3%) | 756 (32.8%) |
Race in Ottawa County
The most populous races in Ottawa County are White / Caucasian (19,641 | 64.5%), Native / Alaskan (6,011 | 19.7%), and Two or more Races (3,154 | 10.3%).
| Race | # Population | % Population |
| Asian | 222 | 0.7% |
| Black / African American | 356 | 1.2% |
| Hawaiian / Pacific | 217 | 0.7% |
| Hispanic or Latino | 1,872 | 6.1% |
| Native / Alaskan | 6,011 | 19.7% |
| White / Caucasian | 19,641 | 64.5% |
| Two or more Races | 3,154 | 10.3% |
| Some other Race | 871 | 2.9% |
| Total | 30,472 | 100.0% |
Ancestry in Ottawa County
The most populous ancestries reported in Ottawa County are Cherokee (4,440 | 14.6%), German (4,131 | 13.6%), Irish (2,927 | 9.6%), English (2,577 | 8.5%), and Mexican (1,588 | 5.2%), together accounting for 51.4% of all Ottawa County residents.
| Ancestry | # Population | % Population |
| African | 22 | 0.1% |
| Alaska Native | 14 | 0.1% |
| Aleut | 1 | 0.0% |
| Alsatian | 1 | 0.0% |
| American | 1,450 | 4.8% |
| Apache | 9 | 0.0% |
| Arab | 25 | 0.1% |
| Arapaho | 4 | 0.0% |
| Australian | 4 | 0.0% |
| Austrian | 18 | 0.1% |
| Bangladeshi | 21 | 0.1% |
| Belgian | 6 | 0.0% |
| Bhutanese | 35 | 0.1% |
| Blackfeet | 46 | 0.2% |
| British | 154 | 0.5% |
| Bulgarian | 3 | 0.0% |
| Burmese | 59 | 0.2% |
| Cajun | 11 | 0.0% |
| Canadian | 24 | 0.1% |
| Celtic | 2 | 0.0% |
| Central American | 72 | 0.2% |
| Cherokee | 4,440 | 14.6% |
| Chickasaw | 53 | 0.2% |
| Chippewa | 8 | 0.0% |
| Choctaw | 218 | 0.7% |
| Colombian | 5 | 0.0% |
| Comanche | 23 | 0.1% |
| Costa Rican | 2 | 0.0% |
| Creek | 137 | 0.4% |
| Croatian | 10 | 0.0% |
| Cuban | 3 | 0.0% |
| Czech | 32 | 0.1% |
| Czechoslovakian | 25 | 0.1% |
| Danish | 27 | 0.1% |
| Delaware | 31 | 0.1% |
| Dutch | 559 | 1.8% |
| Dutch West Indian | 101 | 0.3% |
| Eastern European | 22 | 0.1% |
| Ecuadorian | 9 | 0.0% |
| English | 2,577 | 8.5% |
| European | 424 | 1.4% |
| Fijian | 17 | 0.1% |
| Filipino | 8 | 0.0% |
| Finnish | 7 | 0.0% |
| French | 412 | 1.3% |
| French American Indian | 3 | 0.0% |
| French Canadian | 32 | 0.1% |
| German | 4,131 | 13.6% |
| German Russian | 2 | 0.0% |
| Ghanaian | 1 | 0.0% |
| Greek | 23 | 0.1% |
| Guamanian / Chamorro | 2 | 0.0% |
| Guatemalan | 60 | 0.2% |
| Honduran | 3 | 0.0% |
| Hopi | 5 | 0.0% |
| Hungarian | 28 | 0.1% |
| Icelander | 1 | 0.0% |
| Indian (Asian) | 74 | 0.2% |
| Inupiat | 2 | 0.0% |
| Irish | 2,927 | 9.6% |
| Iroquois | 962 | 3.2% |
| Italian | 429 | 1.4% |
| Jamaican | 4 | 0.0% |
| Japanese | 4 | 0.0% |
| Kenyan | 6 | 0.0% |
| Kiowa | 5 | 0.0% |
| Korean | 78 | 0.3% |
| Lebanese | 11 | 0.0% |
| Lithuanian | 5 | 0.0% |
| Lumbee | 6 | 0.0% |
| Malaysian | 4 | 0.0% |
| Mexican | 1,588 | 5.2% |
| Mexican American Indian | 26 | 0.1% |
| Moroccan | 4 | 0.0% |
| Native Hawaiian | 86 | 0.3% |
| Navajo | 23 | 0.1% |
| Nigerian | 14 | 0.1% |
| Northern European | 16 | 0.1% |
| Norwegian | 195 | 0.6% |
| Osage | 86 | 0.3% |
| Ottawa | 185 | 0.6% |
| Pakistani | 9 | 0.0% |
| Palestinian | 6 | 0.0% |
| Panamanian | 4 | 0.0% |
| Paraguayan | 8 | 0.0% |
| Pennsylvania German | 7 | 0.0% |
| Polish | 214 | 0.7% |
| Portuguese | 20 | 0.1% |
| Potawatomi | 62 | 0.2% |
| Pueblo | 3 | 0.0% |
| Puerto Rican | 48 | 0.2% |
| Romanian | 6 | 0.0% |
| Russian | 20 | 0.1% |
| Salvadoran | 3 | 0.0% |
| Samoan | 8 | 0.0% |
| Scandinavian | 92 | 0.3% |
| Scotch-Irish | 183 | 0.6% |
| Scottish | 479 | 1.6% |
| Seminole | 42 | 0.1% |
| Senegalese | 9 | 0.0% |
| Shoshone | 44 | 0.1% |
| Sioux | 49 | 0.2% |
| Slavic | 7 | 0.0% |
| South American | 39 | 0.1% |
| South American Indian | 8 | 0.0% |
| Spaniard | 24 | 0.1% |
| Spanish | 20 | 0.1% |
| Sri Lankan | 36 | 0.1% |
| Subsaharan African | 47 | 0.2% |
| Swedish | 194 | 0.6% |
| Swiss | 34 | 0.1% |
| Syrian | 2 | 0.0% |
| Thai | 21 | 0.1% |
| Tlingit-Haida | 1 | 0.0% |
| Ukrainian | 32 | 0.1% |
| Venezuelan | 9 | 0.0% |
| Welsh | 74 | 0.2% |
| Yugoslavian | 4 | 0.0% | View All 118 Rows |
Immigrants in Ottawa County
The most numerous immigrant groups reported in Ottawa County came from Latin America (463 | 1.5%), Central America (437 | 1.4%), Mexico (353 | 1.2%), Oceania (121 | 0.4%), and Asia (114 | 0.4%), together accounting for 4.9% of all Ottawa County residents.
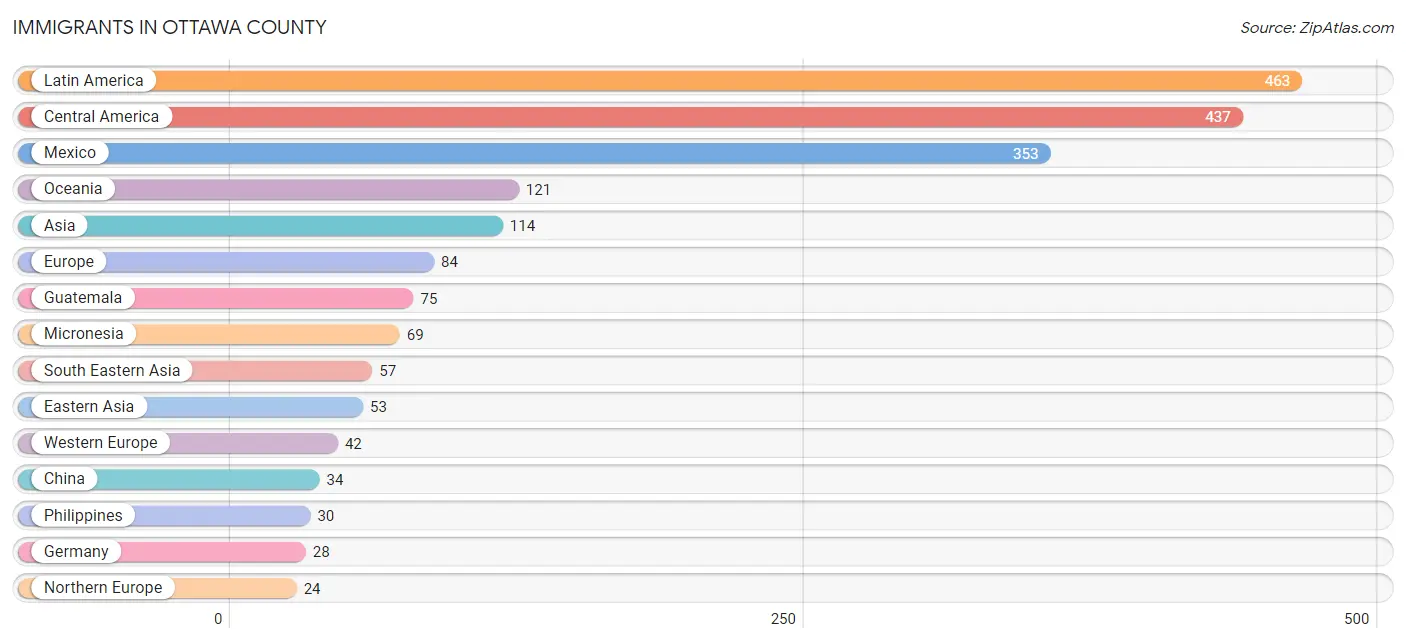
| Immigration Origin | # Population | % Population |
| Africa | 20 | 0.1% |
| Asia | 114 | 0.4% |
| Bahamas | 16 | 0.1% |
| Bangladesh | 2 | 0.0% |
| Belgium | 14 | 0.1% |
| Canada | 20 | 0.1% |
| Caribbean | 21 | 0.1% |
| Central America | 437 | 1.4% |
| China | 34 | 0.1% |
| Costa Rica | 2 | 0.0% |
| Croatia | 10 | 0.0% |
| Czechoslovakia | 2 | 0.0% |
| Denmark | 8 | 0.0% |
| Eastern Africa | 9 | 0.0% |
| Eastern Asia | 53 | 0.2% |
| Eastern Europe | 14 | 0.1% |
| England | 9 | 0.0% |
| Europe | 84 | 0.3% |
| Germany | 28 | 0.1% |
| Ghana | 1 | 0.0% |
| Guatemala | 75 | 0.3% |
| Honduras | 3 | 0.0% |
| Indonesia | 1 | 0.0% |
| Iraq | 2 | 0.0% |
| Jamaica | 2 | 0.0% |
| Japan | 3 | 0.0% |
| Kenya | 5 | 0.0% |
| Korea | 16 | 0.1% |
| Laos | 6 | 0.0% |
| Latin America | 463 | 1.5% |
| Malaysia | 3 | 0.0% |
| Mexico | 353 | 1.2% |
| Micronesia | 69 | 0.2% |
| Morocco | 4 | 0.0% |
| Nigeria | 1 | 0.0% |
| Northern Africa | 4 | 0.0% |
| Northern Europe | 24 | 0.1% |
| Oceania | 121 | 0.4% |
| Panama | 4 | 0.0% |
| Philippines | 30 | 0.1% |
| Poland | 2 | 0.0% |
| South Africa | 5 | 0.0% |
| South America | 5 | 0.0% |
| South Central Asia | 2 | 0.0% |
| South Eastern Asia | 57 | 0.2% |
| Southern Europe | 4 | 0.0% |
| Spain | 4 | 0.0% |
| Taiwan | 12 | 0.0% |
| Thailand | 6 | 0.0% |
| Trinidad and Tobago | 3 | 0.0% |
| Venezuela | 5 | 0.0% |
| Vietnam | 11 | 0.0% |
| Western Africa | 2 | 0.0% |
| Western Asia | 2 | 0.0% |
| Western Europe | 42 | 0.1% | View All 55 Rows |
Sex and Age in Ottawa County
Sex and Age in Ottawa County
The most populous age groups in Ottawa County are 15 to 19 Years (1,234 | 8.2%) for men and 5 to 9 Years (1,122 | 7.3%) for women.
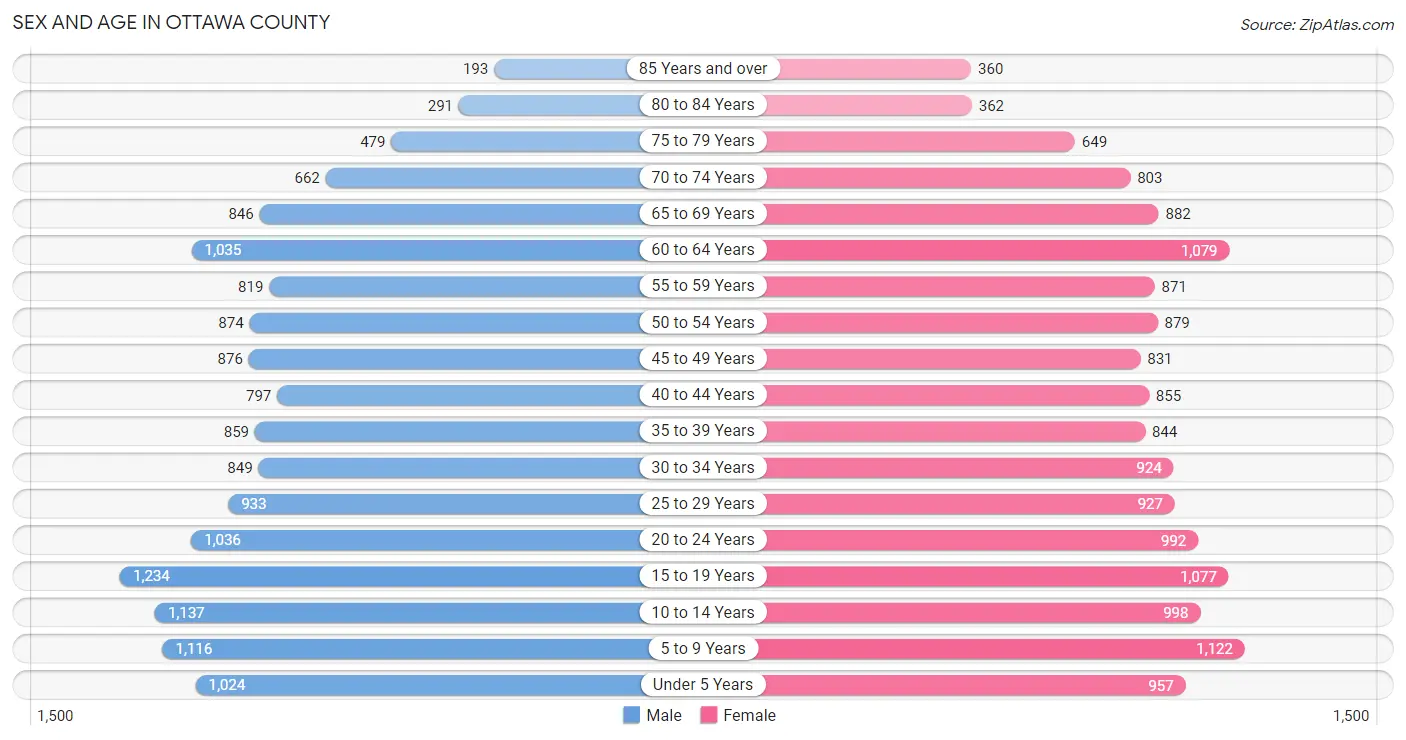
| Age Bracket | Male | Female |
| Under 5 Years | 1,024 (6.8%) | 957 (6.2%) |
| 5 to 9 Years | 1,116 (7.4%) | 1,122 (7.3%) |
| 10 to 14 Years | 1,137 (7.5%) | 998 (6.5%) |
| 15 to 19 Years | 1,234 (8.2%) | 1,077 (7.0%) |
| 20 to 24 Years | 1,036 (6.9%) | 992 (6.4%) |
| 25 to 29 Years | 933 (6.2%) | 927 (6.0%) |
| 30 to 34 Years | 849 (5.6%) | 924 (6.0%) |
| 35 to 39 Years | 859 (5.7%) | 844 (5.5%) |
| 40 to 44 Years | 797 (5.3%) | 855 (5.6%) |
| 45 to 49 Years | 876 (5.8%) | 831 (5.4%) |
| 50 to 54 Years | 874 (5.8%) | 879 (5.7%) |
| 55 to 59 Years | 819 (5.4%) | 871 (5.7%) |
| 60 to 64 Years | 1,035 (6.9%) | 1,079 (7.0%) |
| 65 to 69 Years | 846 (5.6%) | 882 (5.7%) |
| 70 to 74 Years | 662 (4.4%) | 803 (5.2%) |
| 75 to 79 Years | 479 (3.2%) | 649 (4.2%) |
| 80 to 84 Years | 291 (1.9%) | 362 (2.4%) |
| 85 Years and over | 193 (1.3%) | 360 (2.3%) |
| Total | 15,060 (100.0%) | 15,412 (100.0%) |
Families and Households in Ottawa County
Median Family Size in Ottawa County
The median family size in Ottawa County is 3.10 persons per family, with single female/mother families (1,540 | 20.3%) accounting for the largest median family size of 3.2 persons per family. On the other hand, single male/father families (765 | 10.1%) represent the smallest median family size with 3.01 persons per family.
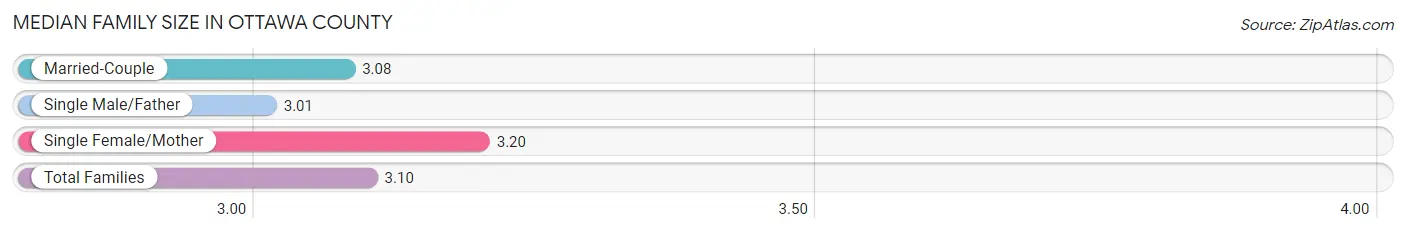
| Family Type | # Families | Family Size |
| Married-Couple | 5,267 (69.6%) | 3.08 |
| Single Male/Father | 765 (10.1%) | 3.01 |
| Single Female/Mother | 1,540 (20.3%) | 3.20 |
| Total Families | 7,572 (100.0%) | 3.10 |
Median Household Size in Ottawa County
The median household size in Ottawa County is 2.50 persons per household, with single male/father households (765 | 6.5%) accounting for the largest median household size of 3.46 persons per household. non-family households (4,146 | 35.4%) represent the smallest median household size with 1.21 persons per household.
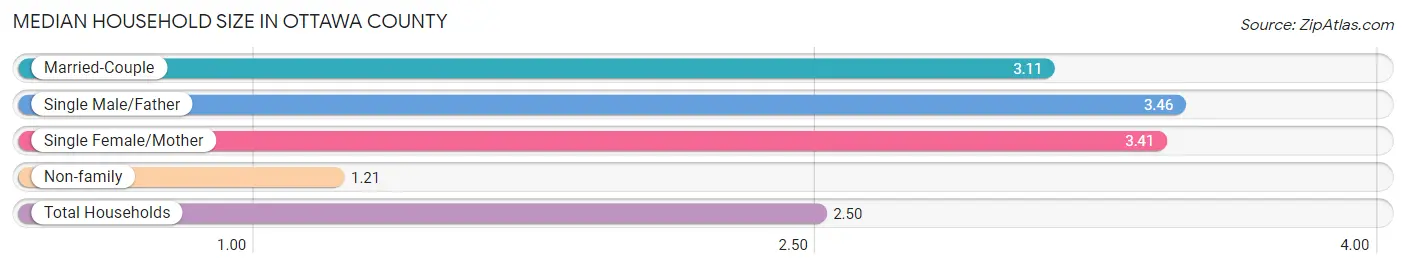
| Household Type | # Households | Household Size |
| Married-Couple | 5,267 (45.0%) | 3.11 |
| Single Male/Father | 765 (6.5%) | 3.46 |
| Single Female/Mother | 1,540 (13.1%) | 3.41 |
| Non-family | 4,146 (35.4%) | 1.21 |
| Total Households | 11,718 (100.0%) | 2.50 |
Household Size by Marriage Status in Ottawa County
Out of a total of 11,718 households in Ottawa County, 7,572 (64.6%) are family households, while 4,146 (35.4%) are nonfamily households. The most numerous type of family households are 2-person households, comprising 3,421, and the most common type of nonfamily households are 1-person households, comprising 3,464.
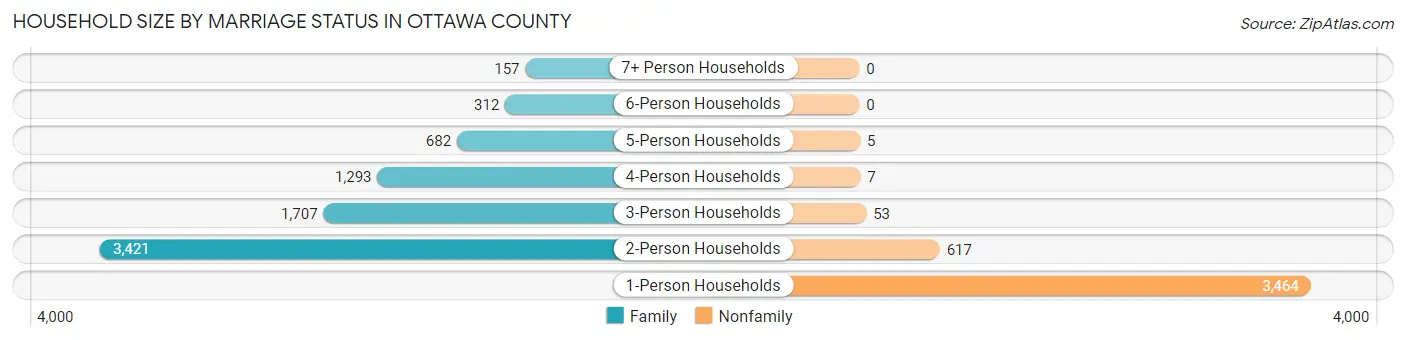
| Household Size | Family Households | Nonfamily Households |
| 1-Person Households | - | 3,464 (29.6%) |
| 2-Person Households | 3,421 (29.2%) | 617 (5.3%) |
| 3-Person Households | 1,707 (14.6%) | 53 (0.4%) |
| 4-Person Households | 1,293 (11.0%) | 7 (0.1%) |
| 5-Person Households | 682 (5.8%) | 5 (0.0%) |
| 6-Person Households | 312 (2.7%) | 0 (0.0%) |
| 7+ Person Households | 157 (1.3%) | 0 (0.0%) |
| Total | 7,572 (64.6%) | 4,146 (35.4%) |
Female Fertility in Ottawa County
Fertility by Age in Ottawa County
Average fertility rate in Ottawa County is 72.0 births per 1,000 women. Women in the age bracket of 20 to 34 years have the highest fertility rate with 126.0 births per 1,000 women. Women in the age bracket of 20 to 34 years acount for 75.9% of all women with births.
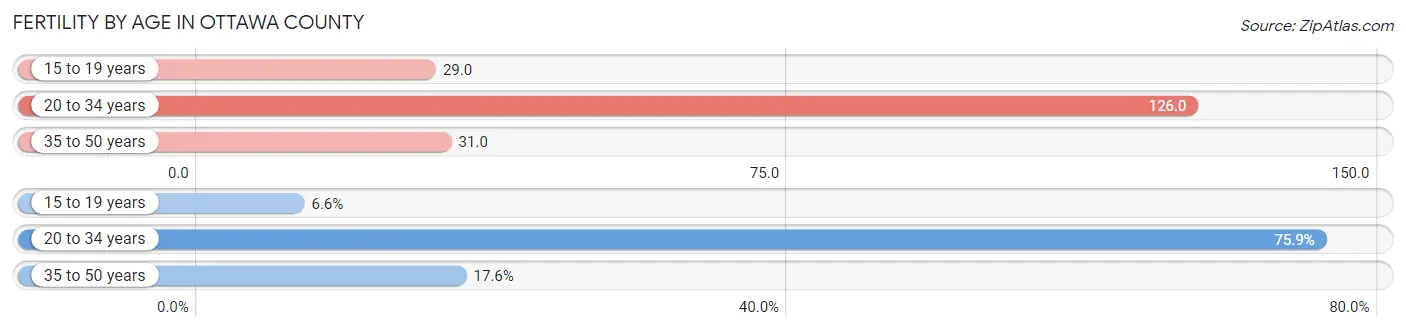
| Age Bracket | Women with Births | Births / 1,000 Women |
| 15 to 19 years | 31 (6.6%) | 29.0 |
| 20 to 34 years | 359 (75.9%) | 126.0 |
| 35 to 50 years | 83 (17.5%) | 31.0 |
| Total | 473 (100.0%) | 72.0 |
Fertility by Age by Marriage Status in Ottawa County
60.9% of women with births (473) in Ottawa County are married. The highest percentage of unmarried women with births falls into 15 to 19 years age bracket with 74.2% of them unmarried at the time of birth, while the lowest percentage of unmarried women with births belong to 35 to 50 years age bracket with 22.9% of them unmarried.
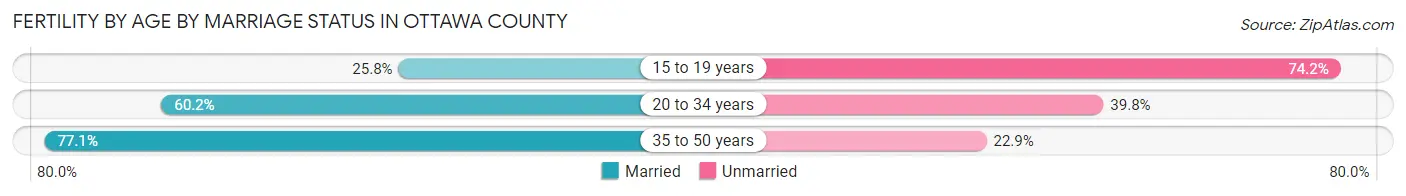
| Age Bracket | Married | Unmarried |
| 15 to 19 years | 8 (25.8%) | 23 (74.2%) |
| 20 to 34 years | 216 (60.2%) | 143 (39.8%) |
| 35 to 50 years | 64 (77.1%) | 19 (22.9%) |
| Total | 288 (60.9%) | 185 (39.1%) |
Fertility by Education in Ottawa County
Average fertility rate in Ottawa County is 72.0 births per 1,000 women. Women with the education attainment of bachelor's degree have the highest fertility rate of 92.0 births per 1,000 women, while women with the education attainment of less than high school have the lowest fertility at 43.0 births per 1,000 women. Women with the education attainment of college or associate's degree represent 39.1% of all women with births.
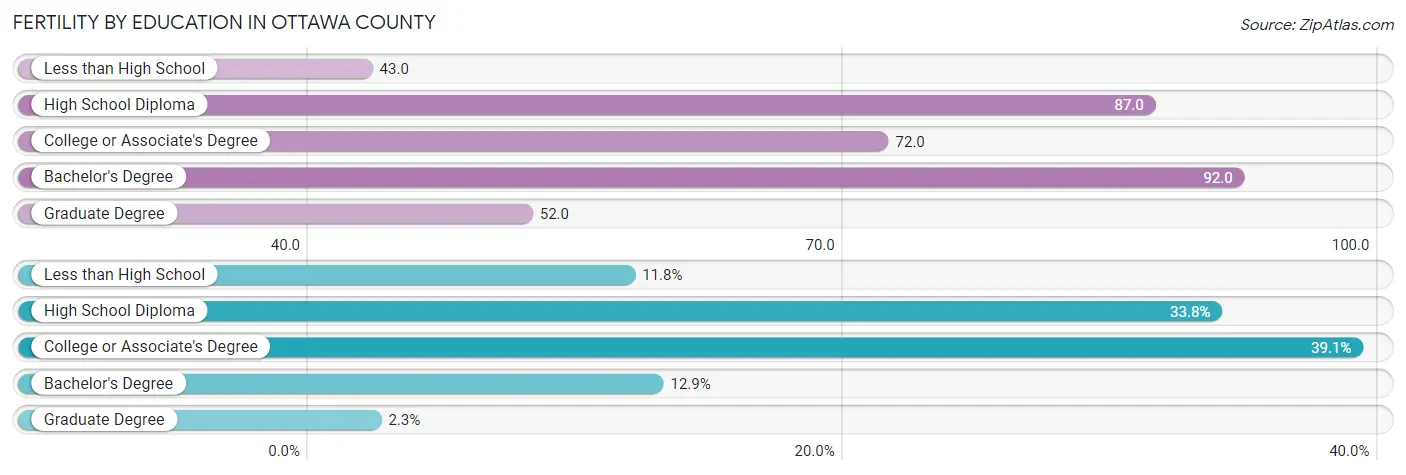
| Educational Attainment | Women with Births | Births / 1,000 Women |
| Less than High School | 56 (11.8%) | 43.0 |
| High School Diploma | 160 (33.8%) | 87.0 |
| College or Associate's Degree | 185 (39.1%) | 72.0 |
| Bachelor's Degree | 61 (12.9%) | 92.0 |
| Graduate Degree | 11 (2.3%) | 52.0 |
| Total | 473 (100.0%) | 72.0 |
Fertility by Education by Marriage Status in Ottawa County
39.1% of women with births in Ottawa County are unmarried. Women with the educational attainment of graduate degree are most likely to be married with 100.0% of them married at childbirth, while women with the educational attainment of high school diploma are least likely to be married with 60.6% of them unmarried at childbirth.
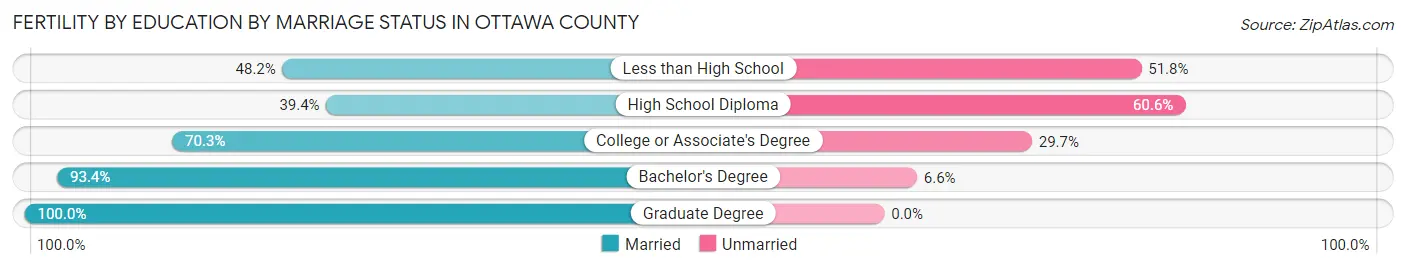
| Educational Attainment | Married | Unmarried |
| Less than High School | 27 (48.2%) | 29 (51.8%) |
| High School Diploma | 63 (39.4%) | 97 (60.6%) |
| College or Associate's Degree | 130 (70.3%) | 55 (29.7%) |
| Bachelor's Degree | 57 (93.4%) | 4 (6.6%) |
| Graduate Degree | 11 (100.0%) | 0 (0.0%) |
| Total | 288 (60.9%) | 185 (39.1%) |
Employment Characteristics in Ottawa County
Employment by Class of Employer in Ottawa County
Among the 12,105 employed individuals in Ottawa County, private company employees (7,627 | 63.0%), local government employees (881 | 7.3%), and not-for-profit organizations (869 | 7.2%) make up the most common classes of employment.
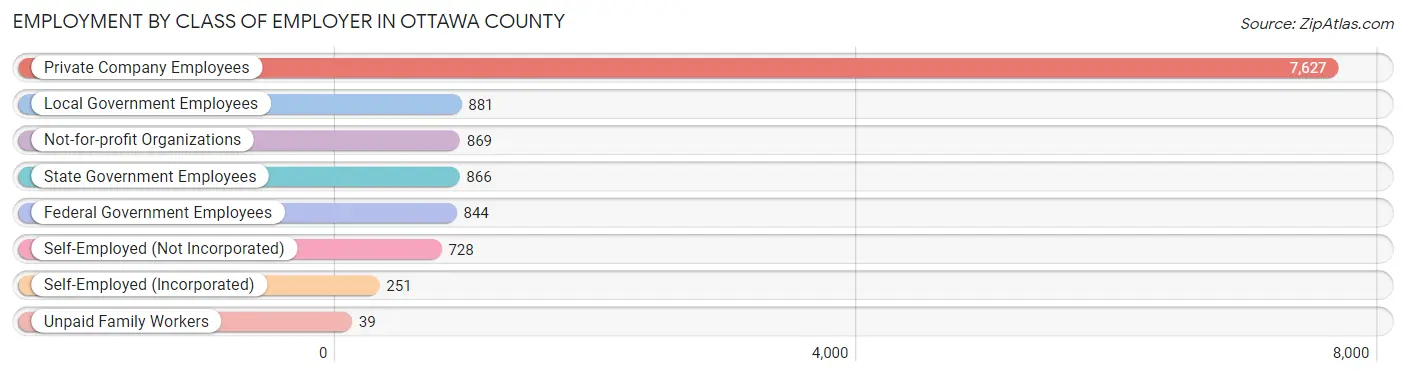
| Employer Class | # Employees | % Employees |
| Private Company Employees | 7,627 | 63.0% |
| Self-Employed (Incorporated) | 251 | 2.1% |
| Self-Employed (Not Incorporated) | 728 | 6.0% |
| Not-for-profit Organizations | 869 | 7.2% |
| Local Government Employees | 881 | 7.3% |
| State Government Employees | 866 | 7.1% |
| Federal Government Employees | 844 | 7.0% |
| Unpaid Family Workers | 39 | 0.3% |
| Total | 12,105 | 100.0% |
Employment Status by Age in Ottawa County
According to the labor force statistics for Ottawa County, out of the total population over 16 years of age (23,737), 54.2% or 12,865 individuals are in the labor force, with 3.8% or 489 of them unemployed. The age group with the highest labor force participation rate is 30 to 34 years, with 78.0% or 1,383 individuals in the labor force. Within the labor force, the 30 to 34 years age range has the highest percentage of unemployed individuals, with 7.1% or 98 of them being unemployed.
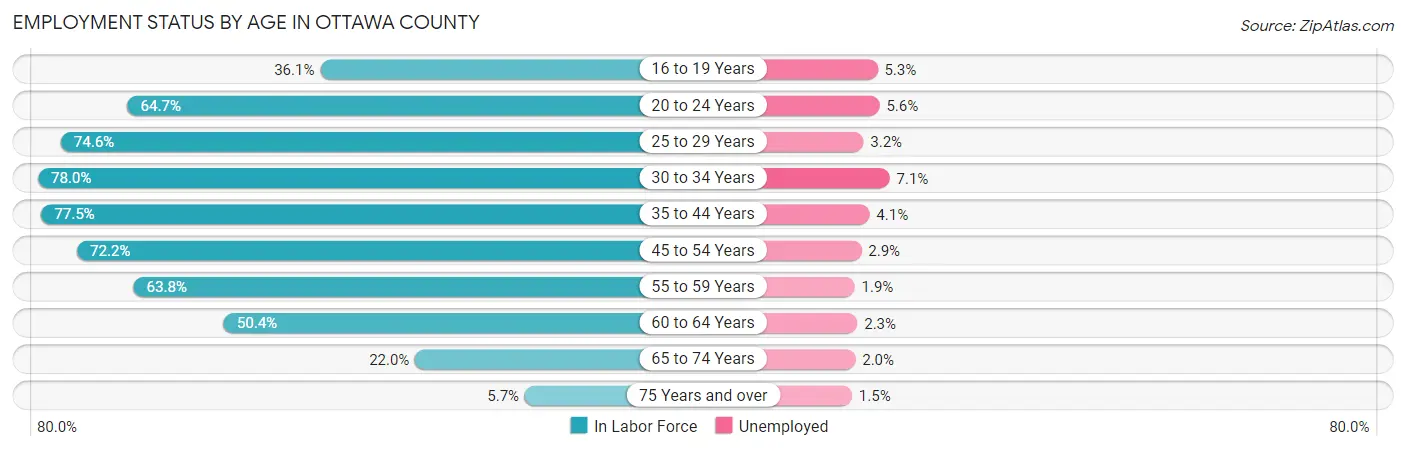
| Age Bracket | In Labor Force | Unemployed |
| 16 to 19 Years | 697 (36.1%) | 37 (5.3%) |
| 20 to 24 Years | 1,312 (64.7%) | 73 (5.6%) |
| 25 to 29 Years | 1,388 (74.6%) | 44 (3.2%) |
| 30 to 34 Years | 1,383 (78.0%) | 98 (7.1%) |
| 35 to 44 Years | 2,600 (77.5%) | 107 (4.1%) |
| 45 to 54 Years | 2,498 (72.2%) | 72 (2.9%) |
| 55 to 59 Years | 1,078 (63.8%) | 20 (1.9%) |
| 60 to 64 Years | 1,065 (50.4%) | 24 (2.3%) |
| 65 to 74 Years | 702 (22.0%) | 14 (2.0%) |
| 75 Years and over | 133 (5.7%) | 2 (1.5%) |
| Total | 12,865 (54.2%) | 489 (3.8%) |
Employment Status by Educational Attainment in Ottawa County
According to labor force statistics for Ottawa County, 70.3% of individuals (10,019) out of the total population between 25 and 64 years of age (14,252) are in the labor force, with 3.6% or 361 of them being unemployed. The group with the highest labor force participation rate are those with the educational attainment of bachelor's degree or higher, with 86.8% or 1,911 individuals in the labor force. Within the labor force, individuals with less than high school education have the highest percentage of unemployment, with 5.3% or 48 of them being unemployed.
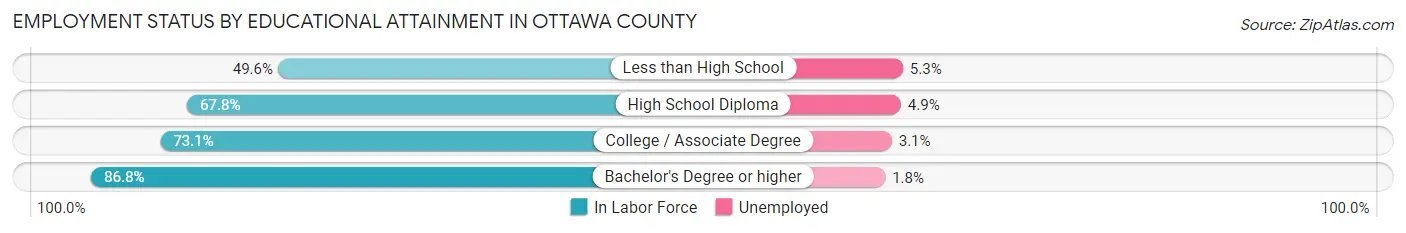
| Educational Attainment | In Labor Force | Unemployed |
| Less than High School | 910 (49.6%) | 97 (5.3%) |
| High School Diploma | 3,454 (67.8%) | 250 (4.9%) |
| College / Associate Degree | 3,743 (73.1%) | 159 (3.1%) |
| Bachelor's Degree or higher | 1,911 (86.8%) | 40 (1.8%) |
| Total | 10,019 (70.3%) | 513 (3.6%) |
Employment Occupations by Sex in Ottawa County
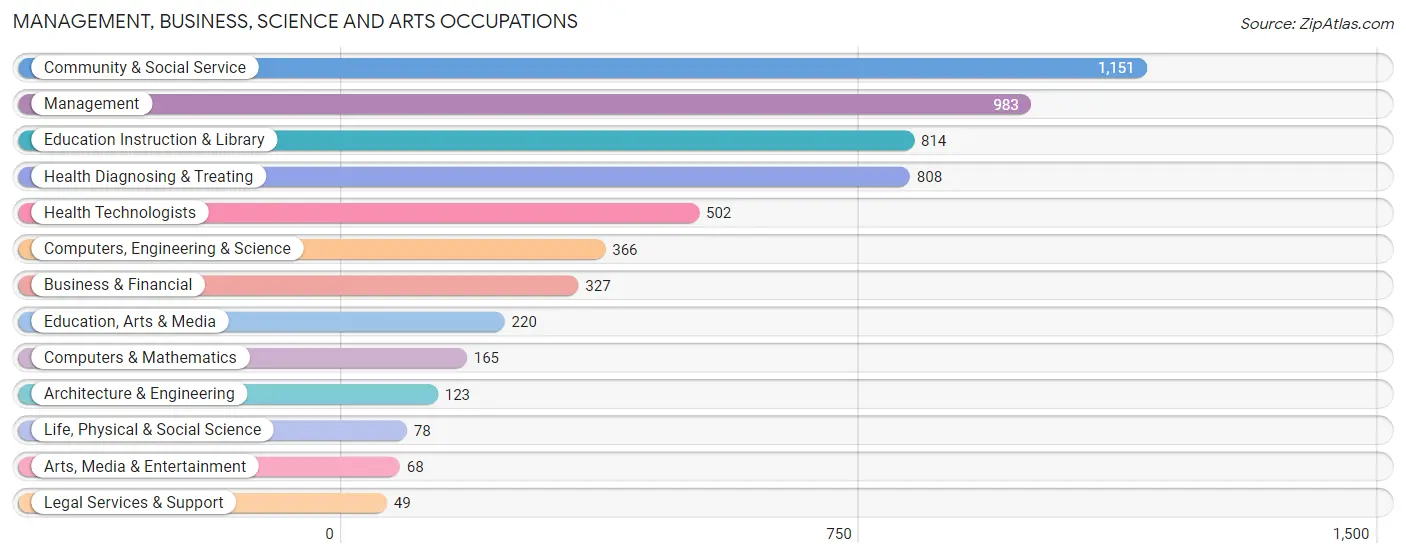
Management, Business, Science and Arts Occupations
The most common Management, Business, Science and Arts occupations in Ottawa County are Community & Social Service (1,151 | 9.3%), Management (983 | 8.0%), Education Instruction & Library (814 | 6.6%), Health Diagnosing & Treating (808 | 6.5%), and Health Technologists (502 | 4.1%).
Management, Business, Science and Arts Occupations by Sex
Within the Management, Business, Science and Arts occupations in Ottawa County, the most male-oriented occupations are Architecture & Engineering (89.4%), Computers & Mathematics (84.2%), and Computers, Engineering & Science (81.4%), while the most female-oriented occupations are Health Technologists (85.7%), Education Instruction & Library (82.7%), and Health Diagnosing & Treating (80.4%).
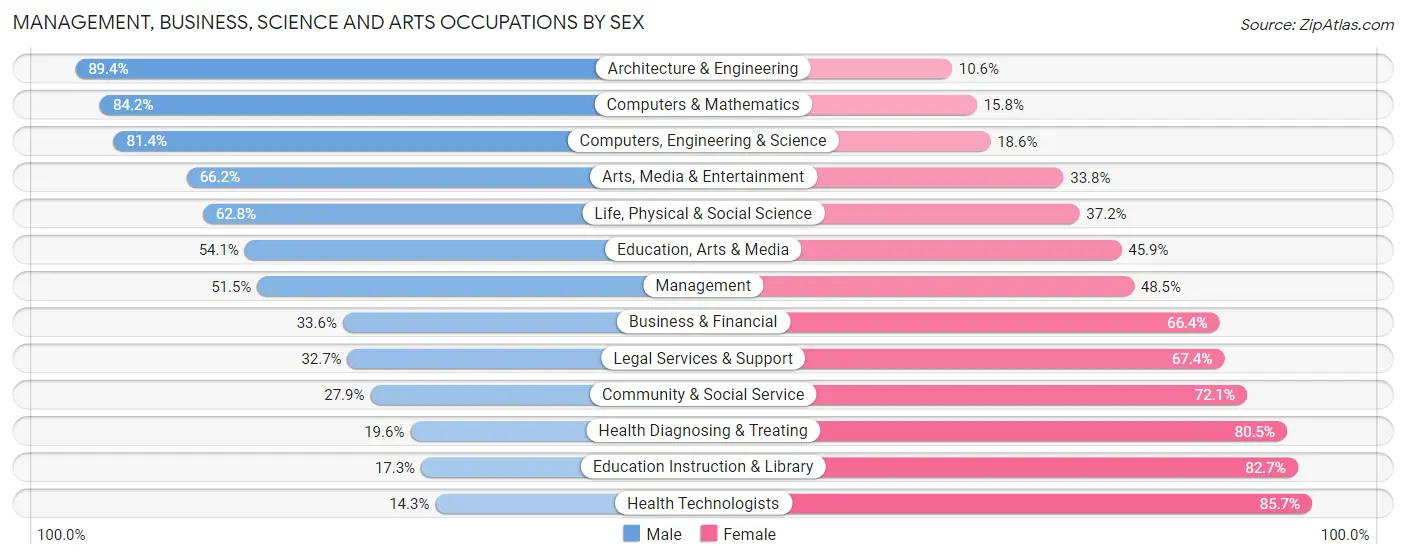
| Occupation | Male | Female |
| Management | 506 (51.5%) | 477 (48.5%) |
| Business & Financial | 110 (33.6%) | 217 (66.4%) |
| Computers, Engineering & Science | 298 (81.4%) | 68 (18.6%) |
| Computers & Mathematics | 139 (84.2%) | 26 (15.8%) |
| Architecture & Engineering | 110 (89.4%) | 13 (10.6%) |
| Life, Physical & Social Science | 49 (62.8%) | 29 (37.2%) |
| Community & Social Service | 321 (27.9%) | 830 (72.1%) |
| Education, Arts & Media | 119 (54.1%) | 101 (45.9%) |
| Legal Services & Support | 16 (32.7%) | 33 (67.3%) |
| Education Instruction & Library | 141 (17.3%) | 673 (82.7%) |
| Arts, Media & Entertainment | 45 (66.2%) | 23 (33.8%) |
| Health Diagnosing & Treating | 158 (19.6%) | 650 (80.4%) |
| Health Technologists | 72 (14.3%) | 430 (85.7%) |
| Total (Category) | 1,393 (38.3%) | 2,242 (61.7%) |
| Total (Overall) | 6,256 (50.6%) | 6,108 (49.4%) |
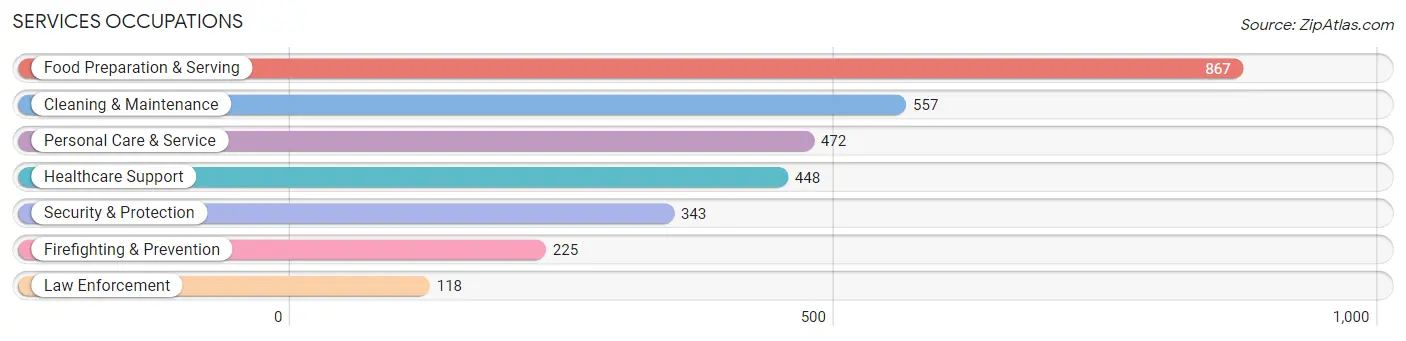
Services Occupations
The most common Services occupations in Ottawa County are Food Preparation & Serving (867 | 7.0%), Cleaning & Maintenance (557 | 4.5%), Personal Care & Service (472 | 3.8%), Healthcare Support (448 | 3.6%), and Security & Protection (343 | 2.8%).
Services Occupations by Sex
Within the Services occupations in Ottawa County, the most male-oriented occupations are Law Enforcement (92.4%), Security & Protection (81.0%), and Firefighting & Prevention (75.1%), while the most female-oriented occupations are Healthcare Support (87.3%), Personal Care & Service (76.1%), and Food Preparation & Serving (59.5%).
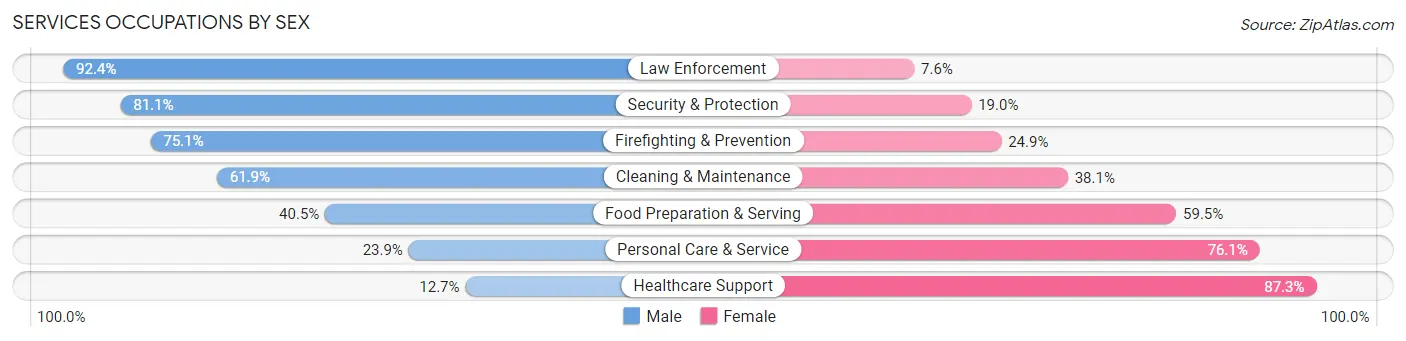
| Occupation | Male | Female |
| Healthcare Support | 57 (12.7%) | 391 (87.3%) |
| Security & Protection | 278 (81.0%) | 65 (19.0%) |
| Firefighting & Prevention | 169 (75.1%) | 56 (24.9%) |
| Law Enforcement | 109 (92.4%) | 9 (7.6%) |
| Food Preparation & Serving | 351 (40.5%) | 516 (59.5%) |
| Cleaning & Maintenance | 345 (61.9%) | 212 (38.1%) |
| Personal Care & Service | 113 (23.9%) | 359 (76.1%) |
| Total (Category) | 1,144 (42.6%) | 1,543 (57.4%) |
| Total (Overall) | 6,256 (50.6%) | 6,108 (49.4%) |
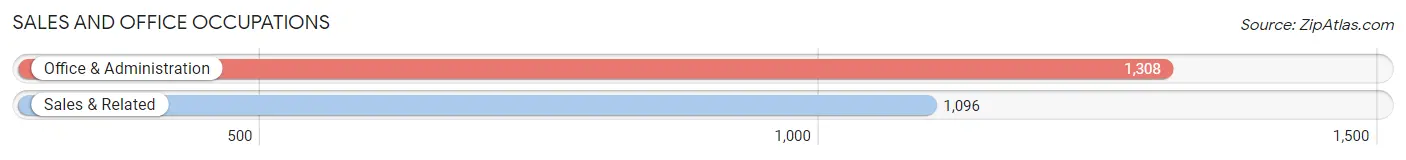
Sales and Office Occupations
The most common Sales and Office occupations in Ottawa County are Office & Administration (1,308 | 10.6%), and Sales & Related (1,096 | 8.9%).
Sales and Office Occupations by Sex
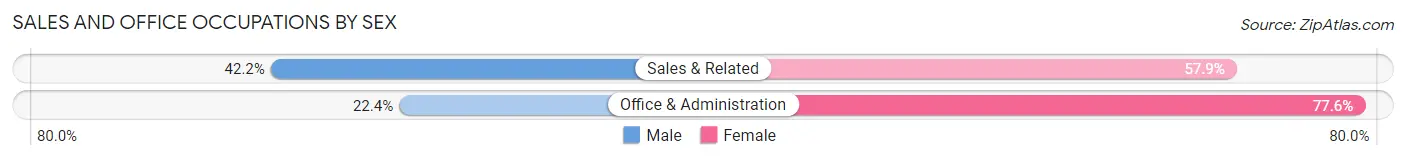
| Occupation | Male | Female |
| Sales & Related | 462 (42.1%) | 634 (57.9%) |
| Office & Administration | 293 (22.4%) | 1,015 (77.6%) |
| Total (Category) | 755 (31.4%) | 1,649 (68.6%) |
| Total (Overall) | 6,256 (50.6%) | 6,108 (49.4%) |
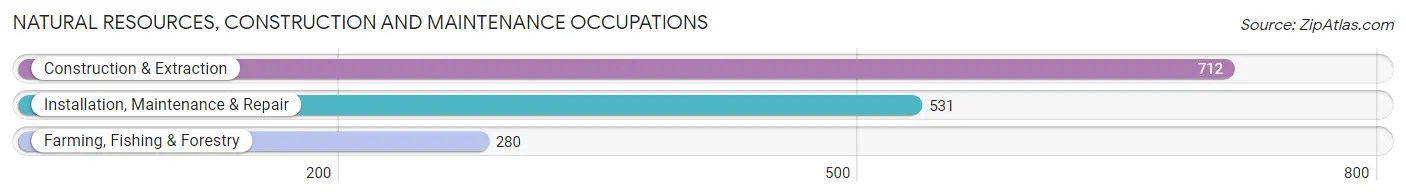
Natural Resources, Construction and Maintenance Occupations
The most common Natural Resources, Construction and Maintenance occupations in Ottawa County are Construction & Extraction (712 | 5.8%), Installation, Maintenance & Repair (531 | 4.3%), and Farming, Fishing & Forestry (280 | 2.3%).
Natural Resources, Construction and Maintenance Occupations by Sex
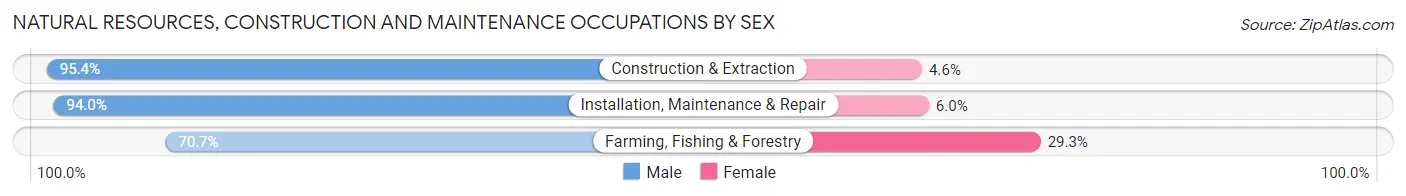
| Occupation | Male | Female |
| Farming, Fishing & Forestry | 198 (70.7%) | 82 (29.3%) |
| Construction & Extraction | 679 (95.4%) | 33 (4.6%) |
| Installation, Maintenance & Repair | 499 (94.0%) | 32 (6.0%) |
| Total (Category) | 1,376 (90.3%) | 147 (9.7%) |
| Total (Overall) | 6,256 (50.6%) | 6,108 (49.4%) |
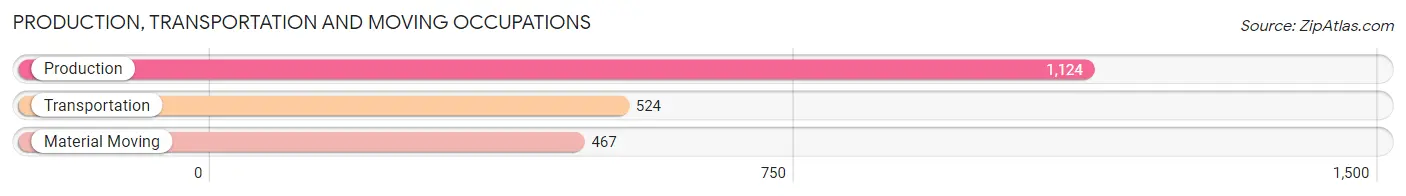
Production, Transportation and Moving Occupations
The most common Production, Transportation and Moving occupations in Ottawa County are Production (1,124 | 9.1%), Transportation (524 | 4.2%), and Material Moving (467 | 3.8%).
Production, Transportation and Moving Occupations by Sex
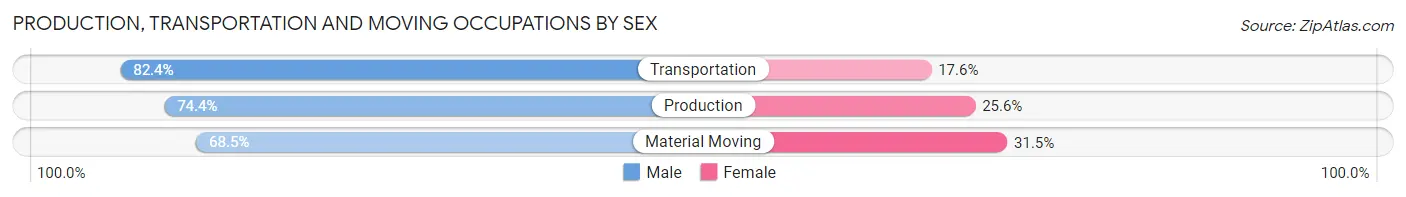
| Occupation | Male | Female |
| Production | 836 (74.4%) | 288 (25.6%) |
| Transportation | 432 (82.4%) | 92 (17.6%) |
| Material Moving | 320 (68.5%) | 147 (31.5%) |
| Total (Category) | 1,588 (75.1%) | 527 (24.9%) |
| Total (Overall) | 6,256 (50.6%) | 6,108 (49.4%) |
Employment Industries by Sex in Ottawa County
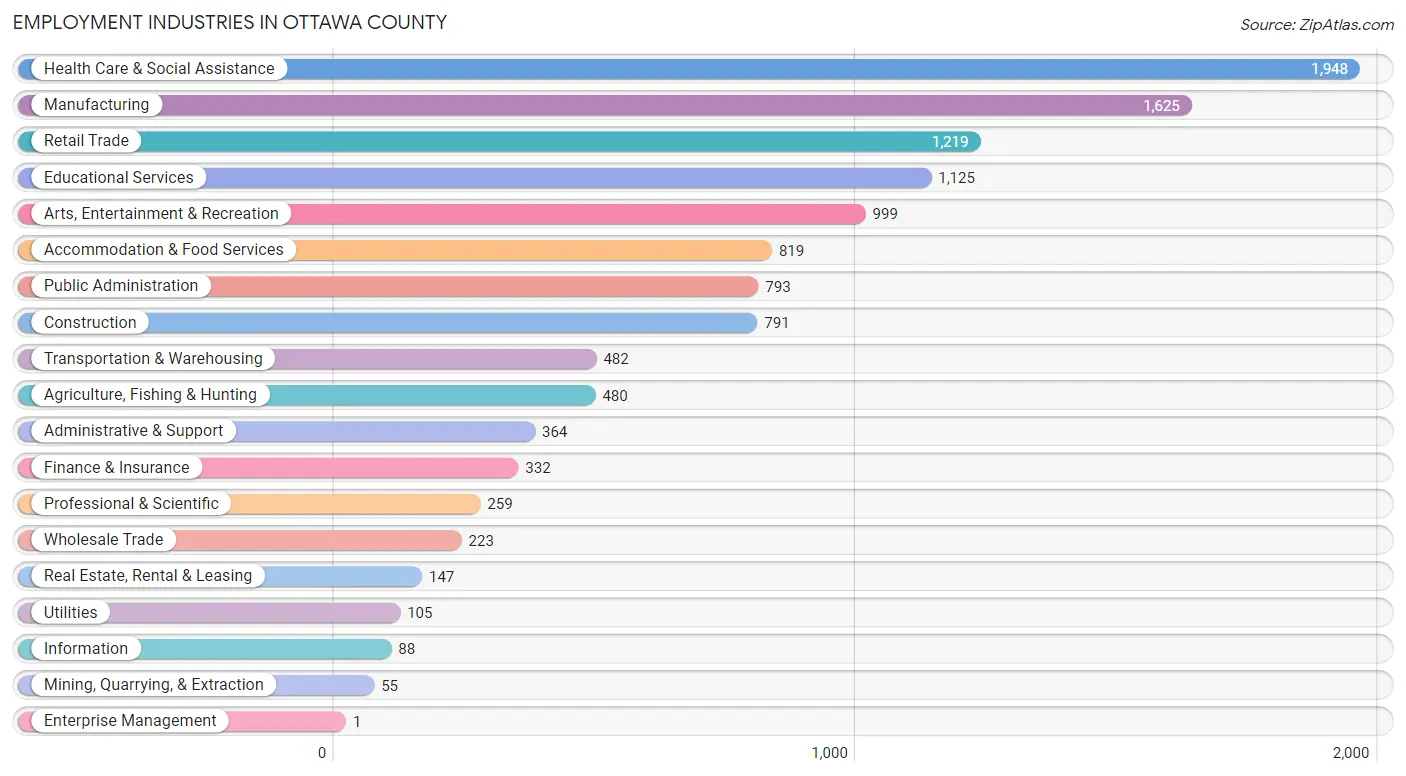
Employment Industries in Ottawa County
The major employment industries in Ottawa County include Health Care & Social Assistance (1,948 | 15.8%), Manufacturing (1,625 | 13.1%), Retail Trade (1,219 | 9.9%), Educational Services (1,125 | 9.1%), and Arts, Entertainment & Recreation (999 | 8.1%).
Employment Industries by Sex in Ottawa County
The Ottawa County industries that see more men than women are Construction (94.4%), Mining, Quarrying, & Extraction (92.7%), and Utilities (79.0%), whereas the industries that tend to have a higher number of women are Enterprise Management (100.0%), Health Care & Social Assistance (81.6%), and Finance & Insurance (71.1%).
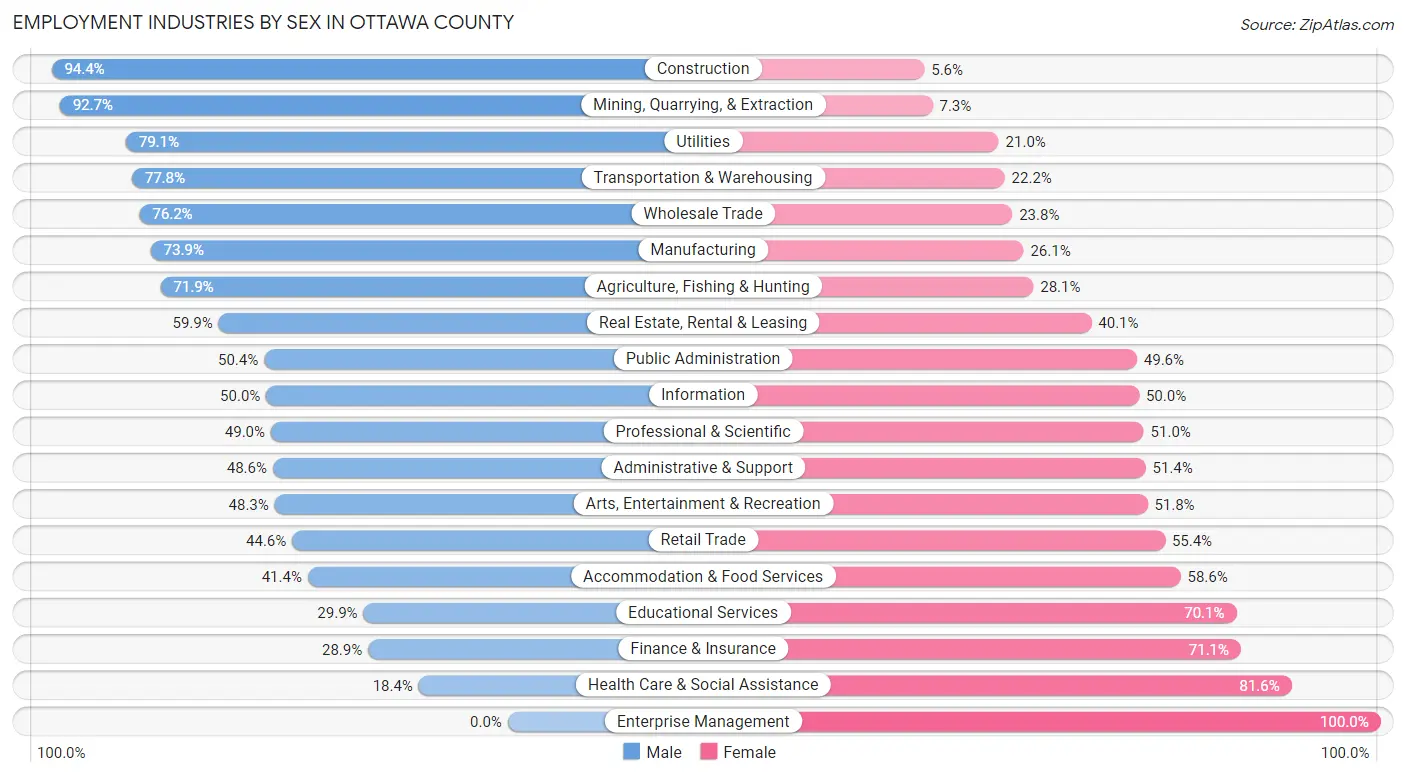
| Industry | Male | Female |
| Agriculture, Fishing & Hunting | 345 (71.9%) | 135 (28.1%) |
| Mining, Quarrying, & Extraction | 51 (92.7%) | 4 (7.3%) |
| Construction | 747 (94.4%) | 44 (5.6%) |
| Manufacturing | 1,201 (73.9%) | 424 (26.1%) |
| Wholesale Trade | 170 (76.2%) | 53 (23.8%) |
| Retail Trade | 544 (44.6%) | 675 (55.4%) |
| Transportation & Warehousing | 375 (77.8%) | 107 (22.2%) |
| Utilities | 83 (79.0%) | 22 (20.9%) |
| Information | 44 (50.0%) | 44 (50.0%) |
| Finance & Insurance | 96 (28.9%) | 236 (71.1%) |
| Real Estate, Rental & Leasing | 88 (59.9%) | 59 (40.1%) |
| Professional & Scientific | 127 (49.0%) | 132 (51.0%) |
| Enterprise Management | 0 (0.0%) | 1 (100.0%) |
| Administrative & Support | 177 (48.6%) | 187 (51.4%) |
| Educational Services | 336 (29.9%) | 789 (70.1%) |
| Health Care & Social Assistance | 359 (18.4%) | 1,589 (81.6%) |
| Arts, Entertainment & Recreation | 482 (48.2%) | 517 (51.7%) |
| Accommodation & Food Services | 339 (41.4%) | 480 (58.6%) |
| Public Administration | 400 (50.4%) | 393 (49.6%) |
| Total | 6,256 (50.6%) | 6,108 (49.4%) |
Education in Ottawa County
School Enrollment in Ottawa County
The most common levels of schooling among the 7,641 students in Ottawa County are elementary school (1,782 | 23.3%), high school (1,659 | 21.7%), and middle school (1,607 | 21.0%).
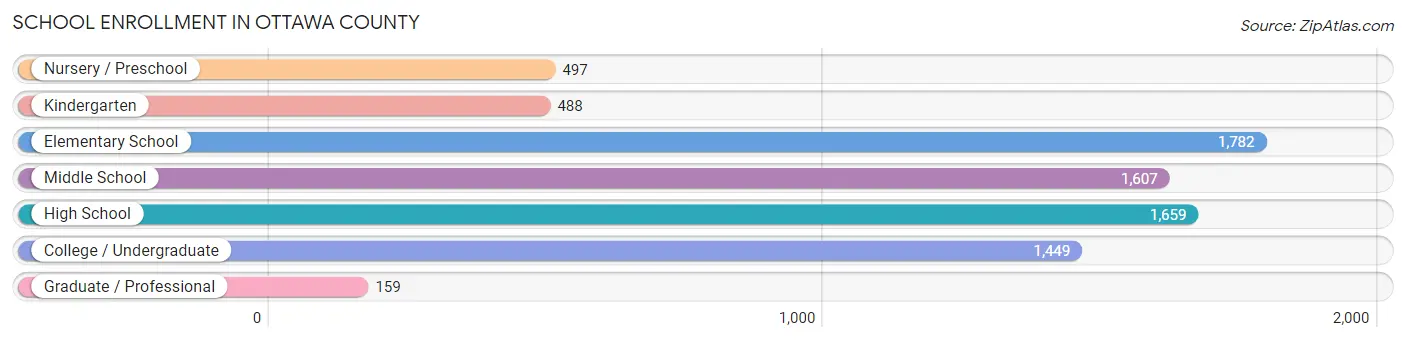
| School Level | # Students | % Students |
| Nursery / Preschool | 497 | 6.5% |
| Kindergarten | 488 | 6.4% |
| Elementary School | 1,782 | 23.3% |
| Middle School | 1,607 | 21.0% |
| High School | 1,659 | 21.7% |
| College / Undergraduate | 1,449 | 19.0% |
| Graduate / Professional | 159 | 2.1% |
| Total | 7,641 | 100.0% |
School Enrollment by Age by Funding Source in Ottawa County
Out of a total of 7,641 students who are enrolled in schools in Ottawa County, 558 (7.3%) attend a private institution, while the remaining 7,083 (92.7%) are enrolled in public schools. The age group of 35 years and over has the highest likelihood of being enrolled in private schools, with 56 (21.0% in the age bracket) enrolled. Conversely, the age group of 20 to 24 year olds has the lowest likelihood of being enrolled in a private school, with 594 (96.1% in the age bracket) attending a public institution.
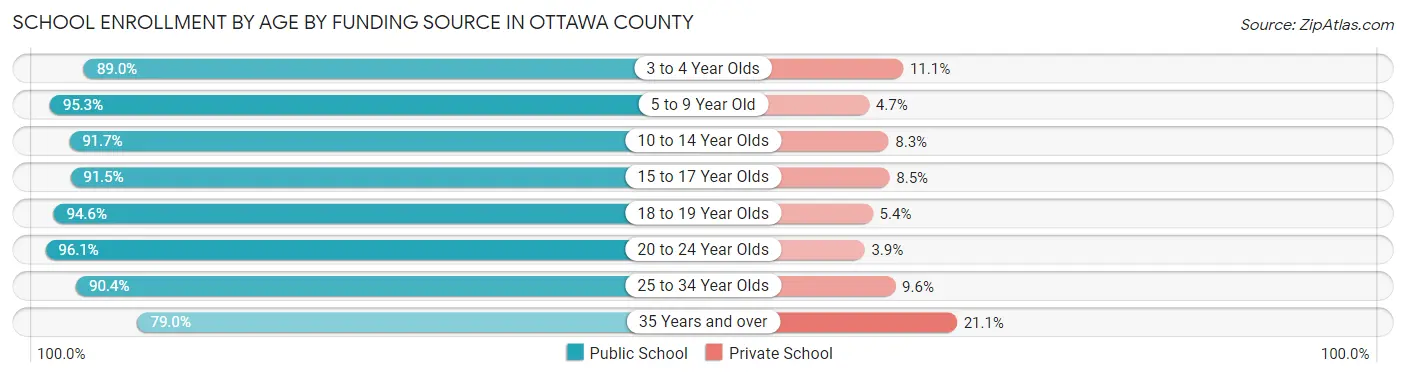
| Age Bracket | Public School | Private School |
| 3 to 4 Year Olds | 338 (88.9%) | 42 (11.1%) |
| 5 to 9 Year Old | 1,987 (95.3%) | 98 (4.7%) |
| 10 to 14 Year Olds | 1,906 (91.7%) | 173 (8.3%) |
| 15 to 17 Year Olds | 1,065 (91.5%) | 99 (8.5%) |
| 18 to 19 Year Olds | 736 (94.6%) | 42 (5.4%) |
| 20 to 24 Year Olds | 594 (96.1%) | 24 (3.9%) |
| 25 to 34 Year Olds | 245 (90.4%) | 26 (9.6%) |
| 35 Years and over | 210 (78.9%) | 56 (21.0%) |
| Total | 7,083 (92.7%) | 558 (7.3%) |
Educational Attainment by Field of Study in Ottawa County
Education (865 | 27.0%), business (532 | 16.6%), science & technology (437 | 13.6%), arts & humanities (263 | 8.2%), and bio, nature & agricultural (260 | 8.1%) are the most common fields of study among 3,207 individuals in Ottawa County who have obtained a bachelor's degree or higher.
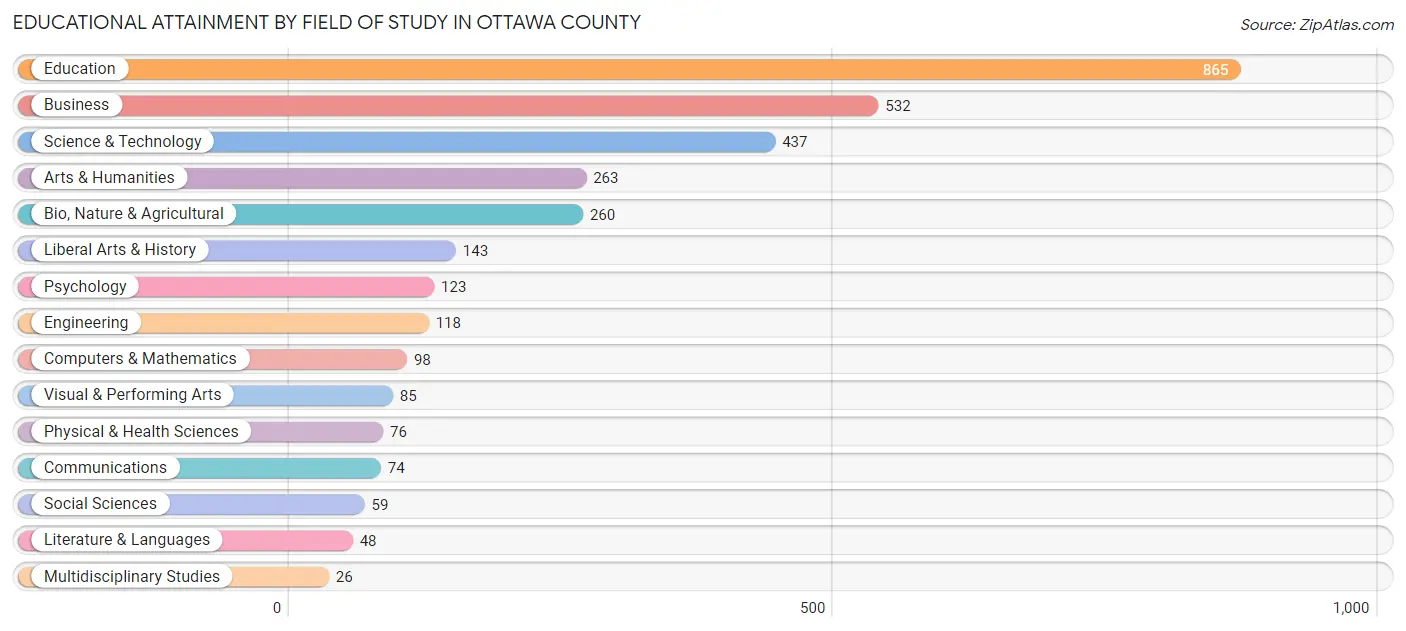
| Field of Study | # Graduates | % Graduates |
| Computers & Mathematics | 98 | 3.1% |
| Bio, Nature & Agricultural | 260 | 8.1% |
| Physical & Health Sciences | 76 | 2.4% |
| Psychology | 123 | 3.8% |
| Social Sciences | 59 | 1.8% |
| Engineering | 118 | 3.7% |
| Multidisciplinary Studies | 26 | 0.8% |
| Science & Technology | 437 | 13.6% |
| Business | 532 | 16.6% |
| Education | 865 | 27.0% |
| Literature & Languages | 48 | 1.5% |
| Liberal Arts & History | 143 | 4.5% |
| Visual & Performing Arts | 85 | 2.6% |
| Communications | 74 | 2.3% |
| Arts & Humanities | 263 | 8.2% |
| Total | 3,207 | 100.0% |
Transportation & Commute in Ottawa County
Vehicle Availability by Sex in Ottawa County
The most prevalent vehicle ownership categories in Ottawa County are males with 2 vehicles (2,285, accounting for 38.1%) and females with 2 vehicles (2,259, making up 39.2%).
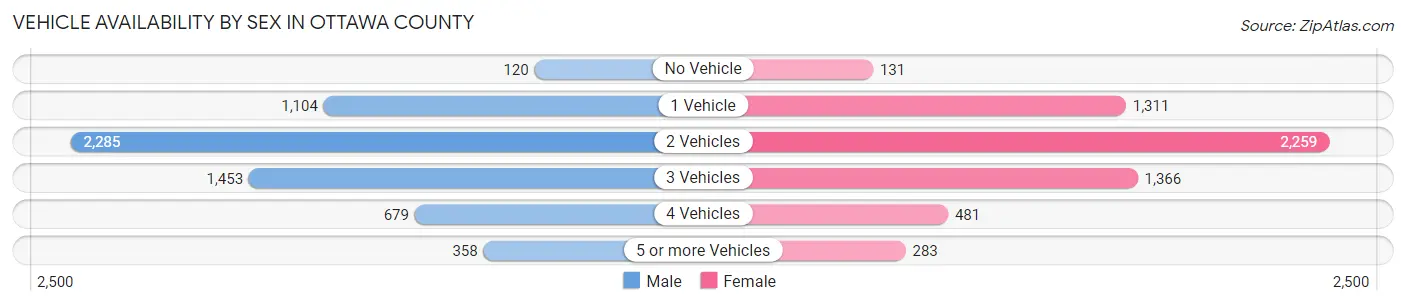
| Vehicles Available | Male | Female |
| No Vehicle | 120 (2.0%) | 131 (2.2%) |
| 1 Vehicle | 1,104 (18.4%) | 1,311 (22.5%) |
| 2 Vehicles | 2,285 (38.1%) | 2,259 (38.7%) |
| 3 Vehicles | 1,453 (24.2%) | 1,366 (23.4%) |
| 4 Vehicles | 679 (11.3%) | 481 (8.3%) |
| 5 or more Vehicles | 358 (6.0%) | 283 (4.9%) |
| Total | 5,999 (100.0%) | 5,831 (100.0%) |
Commute Time in Ottawa County
The most frequently occuring commute durations in Ottawa County are 5 to 9 minutes (2,260 commuters, 19.4%), 10 to 14 minutes (2,126 commuters, 18.2%), and 15 to 19 minutes (1,683 commuters, 14.4%).
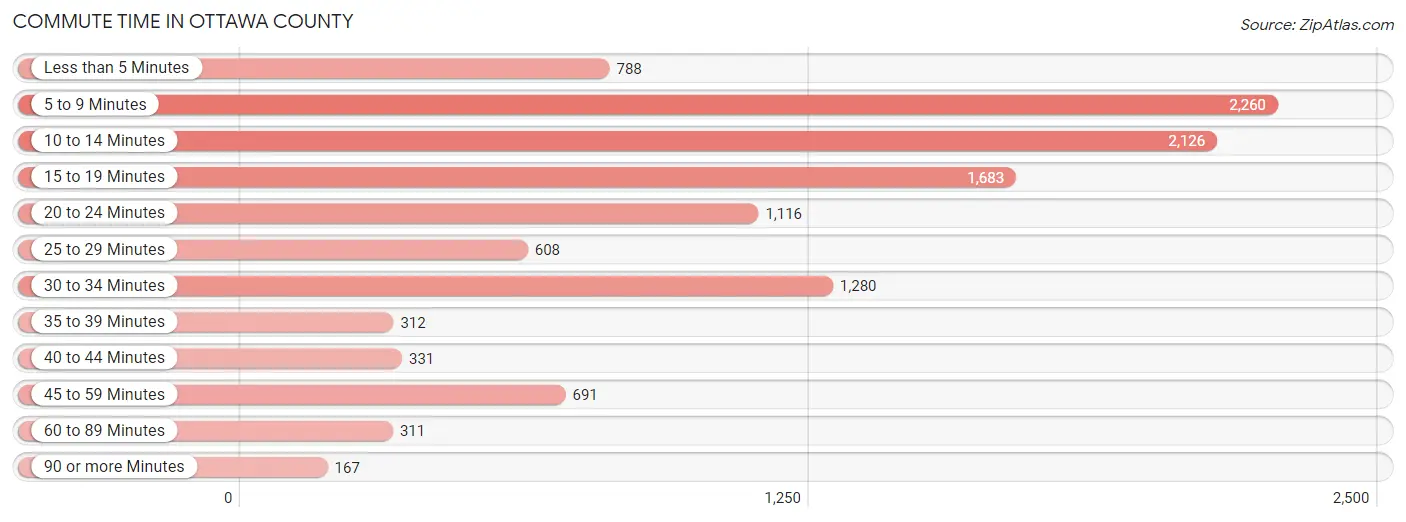
| Commute Time | # Commuters | % Commuters |
| Less than 5 Minutes | 788 | 6.8% |
| 5 to 9 Minutes | 2,260 | 19.4% |
| 10 to 14 Minutes | 2,126 | 18.2% |
| 15 to 19 Minutes | 1,683 | 14.4% |
| 20 to 24 Minutes | 1,116 | 9.6% |
| 25 to 29 Minutes | 608 | 5.2% |
| 30 to 34 Minutes | 1,280 | 11.0% |
| 35 to 39 Minutes | 312 | 2.7% |
| 40 to 44 Minutes | 331 | 2.8% |
| 45 to 59 Minutes | 691 | 5.9% |
| 60 to 89 Minutes | 311 | 2.7% |
| 90 or more Minutes | 167 | 1.4% |
Commute Time by Sex in Ottawa County
The most common commute times in Ottawa County are 5 to 9 minutes (1,057 commuters, 18.0%) for males and 5 to 9 minutes (1,203 commuters, 20.8%) for females.
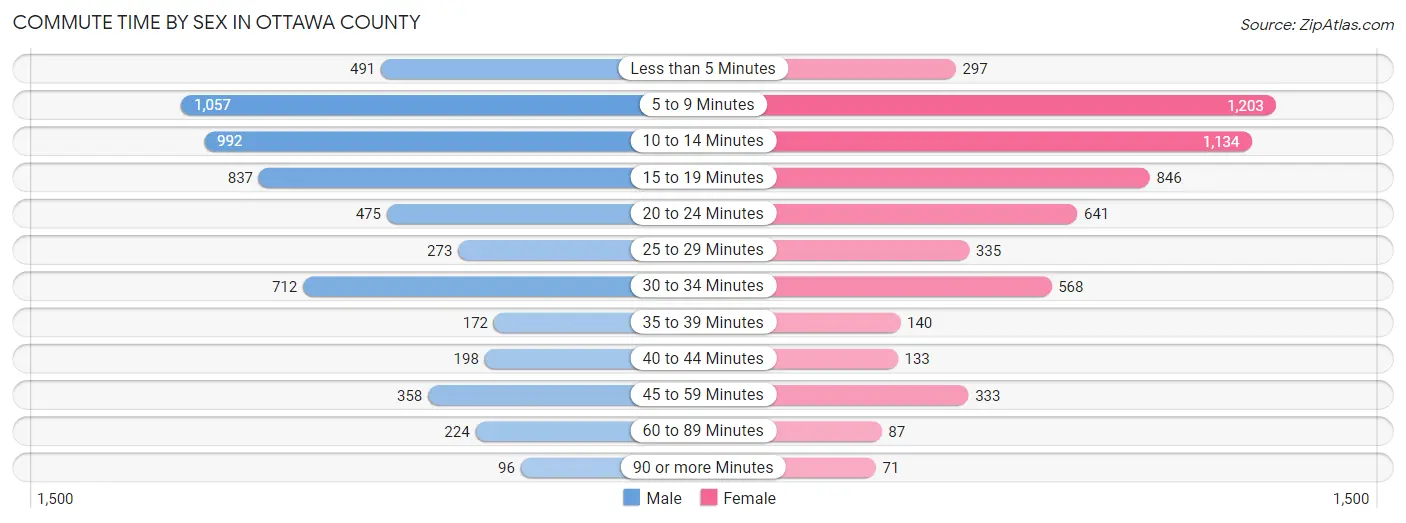
| Commute Time | Male | Female |
| Less than 5 Minutes | 491 (8.3%) | 297 (5.1%) |
| 5 to 9 Minutes | 1,057 (18.0%) | 1,203 (20.8%) |
| 10 to 14 Minutes | 992 (16.9%) | 1,134 (19.6%) |
| 15 to 19 Minutes | 837 (14.2%) | 846 (14.6%) |
| 20 to 24 Minutes | 475 (8.1%) | 641 (11.1%) |
| 25 to 29 Minutes | 273 (4.6%) | 335 (5.8%) |
| 30 to 34 Minutes | 712 (12.1%) | 568 (9.8%) |
| 35 to 39 Minutes | 172 (2.9%) | 140 (2.4%) |
| 40 to 44 Minutes | 198 (3.4%) | 133 (2.3%) |
| 45 to 59 Minutes | 358 (6.1%) | 333 (5.8%) |
| 60 to 89 Minutes | 224 (3.8%) | 87 (1.5%) |
| 90 or more Minutes | 96 (1.6%) | 71 (1.2%) |
Time of Departure to Work by Sex in Ottawa County
The most frequent times of departure to work in Ottawa County are 7:00 AM to 7:29 AM (837, 14.2%) for males and 7:30 AM to 7:59 AM (1,020, 17.6%) for females.
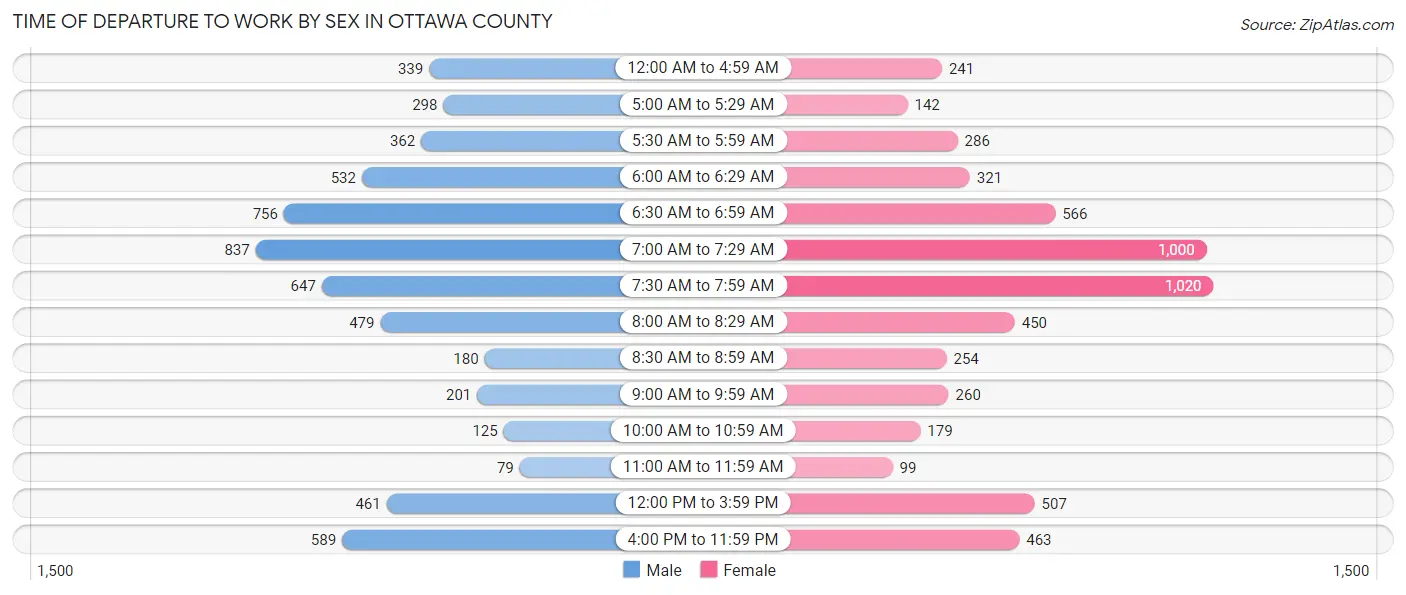
| Time of Departure | Male | Female |
| 12:00 AM to 4:59 AM | 339 (5.8%) | 241 (4.2%) |
| 5:00 AM to 5:29 AM | 298 (5.1%) | 142 (2.5%) |
| 5:30 AM to 5:59 AM | 362 (6.1%) | 286 (4.9%) |
| 6:00 AM to 6:29 AM | 532 (9.0%) | 321 (5.6%) |
| 6:30 AM to 6:59 AM | 756 (12.9%) | 566 (9.8%) |
| 7:00 AM to 7:29 AM | 837 (14.2%) | 1,000 (17.3%) |
| 7:30 AM to 7:59 AM | 647 (11.0%) | 1,020 (17.6%) |
| 8:00 AM to 8:29 AM | 479 (8.1%) | 450 (7.8%) |
| 8:30 AM to 8:59 AM | 180 (3.1%) | 254 (4.4%) |
| 9:00 AM to 9:59 AM | 201 (3.4%) | 260 (4.5%) |
| 10:00 AM to 10:59 AM | 125 (2.1%) | 179 (3.1%) |
| 11:00 AM to 11:59 AM | 79 (1.3%) | 99 (1.7%) |
| 12:00 PM to 3:59 PM | 461 (7.8%) | 507 (8.8%) |
| 4:00 PM to 11:59 PM | 589 (10.0%) | 463 (8.0%) |
| Total | 5,885 (100.0%) | 5,788 (100.0%) |
Housing Occupancy in Ottawa County
Occupancy by Ownership in Ottawa County
Of the total 11,718 dwellings in Ottawa County, owner-occupied units account for 7,906 (67.5%), while renter-occupied units make up 3,812 (32.5%).
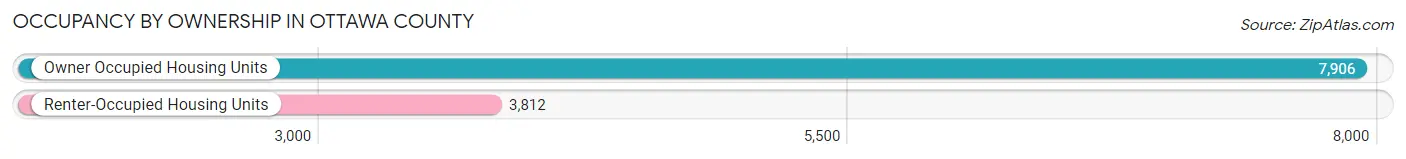
| Occupancy | # Housing Units | % Housing Units |
| Owner Occupied Housing Units | 7,906 | 67.5% |
| Renter-Occupied Housing Units | 3,812 | 32.5% |
| Total Occupied Housing Units | 11,718 | 100.0% |
Occupancy by Household Size in Ottawa County
| Household Size | # Housing Units | % Housing Units |
| 1-Person Household | 3,464 | 29.6% |
| 2-Person Household | 4,038 | 34.5% |
| 3-Person Household | 1,760 | 15.0% |
| 4+ Person Household | 2,456 | 21.0% |
| Total Housing Units | 11,718 | 100.0% |
Occupancy by Ownership by Household Size in Ottawa County
| Household Size | Owner-occupied | Renter-occupied |
| 1-Person Household | 2,100 (60.6%) | 1,364 (39.4%) |
| 2-Person Household | 3,040 (75.3%) | 998 (24.7%) |
| 3-Person Household | 1,134 (64.4%) | 626 (35.6%) |
| 4+ Person Household | 1,632 (66.4%) | 824 (33.6%) |
| Total Housing Units | 7,906 (67.5%) | 3,812 (32.5%) |
Occupancy by Educational Attainment in Ottawa County
| Household Size | Owner-occupied | Renter-occupied |
| Less than High School | 831 (60.0%) | 555 (40.0%) |
| High School Diploma | 2,426 (64.7%) | 1,322 (35.3%) |
| College/Associate Degree | 3,088 (66.7%) | 1,543 (33.3%) |
| Bachelor's Degree or higher | 1,561 (79.9%) | 392 (20.1%) |
Occupancy by Age of Householder in Ottawa County
| Age Bracket | # Households | % Households |
| Under 35 Years | 2,211 | 18.9% |
| 35 to 44 Years | 1,835 | 15.7% |
| 45 to 54 Years | 1,852 | 15.8% |
| 55 to 64 Years | 2,224 | 19.0% |
| 65 to 74 Years | 2,046 | 17.5% |
| 75 to 84 Years | 1,217 | 10.4% |
| 85 Years and Over | 333 | 2.8% |
| Total | 11,718 | 100.0% |
Housing Finances in Ottawa County
Median Income by Occupancy in Ottawa County
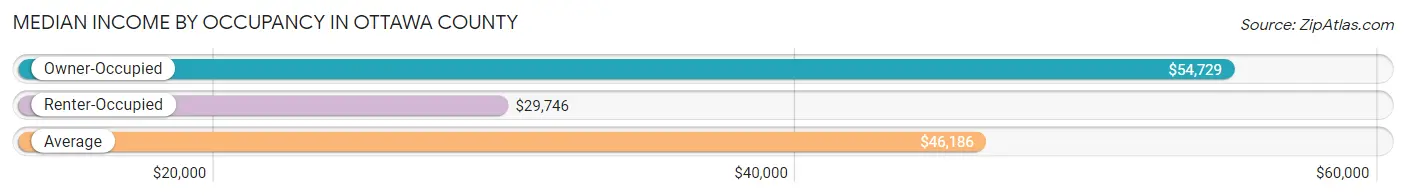
| Occupancy Type | # Households | Median Income |
| Owner-Occupied | 7,906 (67.5%) | $54,729 |
| Renter-Occupied | 3,812 (32.5%) | $29,746 |
| Average | 11,718 (100.0%) | $46,186 |
Occupancy by Householder Income Bracket in Ottawa County
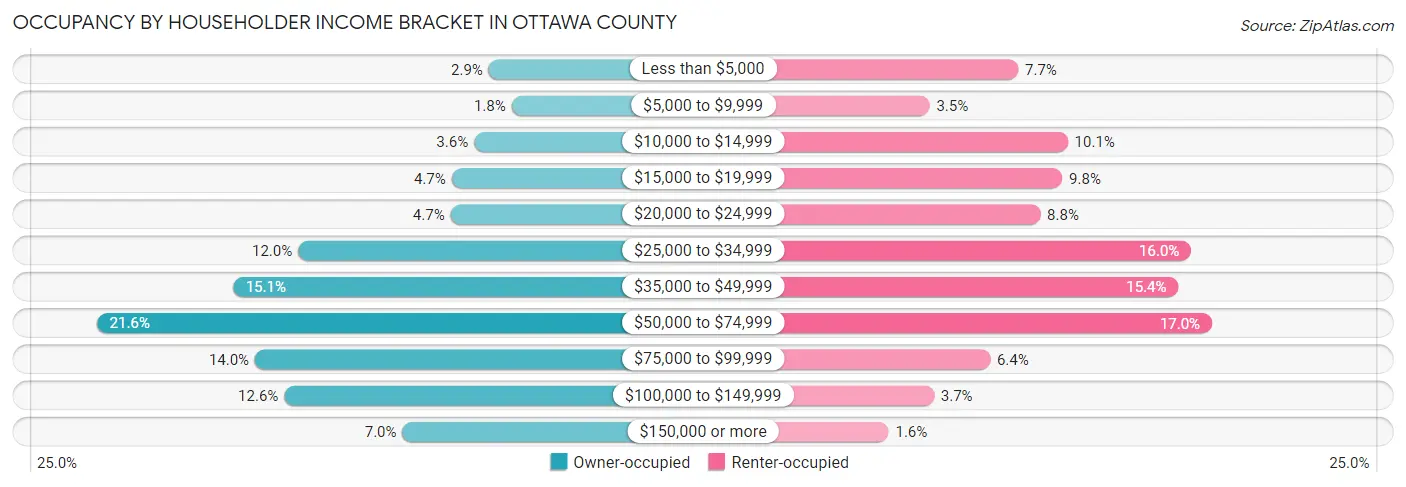
| Income Bracket | Owner-occupied | Renter-occupied |
| Less than $5,000 | 229 (2.9%) | 295 (7.7%) |
| $5,000 to $9,999 | 143 (1.8%) | 134 (3.5%) |
| $10,000 to $14,999 | 285 (3.6%) | 385 (10.1%) |
| $15,000 to $19,999 | 369 (4.7%) | 375 (9.8%) |
| $20,000 to $24,999 | 373 (4.7%) | 335 (8.8%) |
| $25,000 to $34,999 | 947 (12.0%) | 609 (16.0%) |
| $35,000 to $49,999 | 1,193 (15.1%) | 586 (15.4%) |
| $50,000 to $74,999 | 1,705 (21.6%) | 647 (17.0%) |
| $75,000 to $99,999 | 1,109 (14.0%) | 244 (6.4%) |
| $100,000 to $149,999 | 999 (12.6%) | 142 (3.7%) |
| $150,000 or more | 554 (7.0%) | 60 (1.6%) |
| Total | 7,906 (100.0%) | 3,812 (100.0%) |
Monthly Housing Cost Tiers in Ottawa County
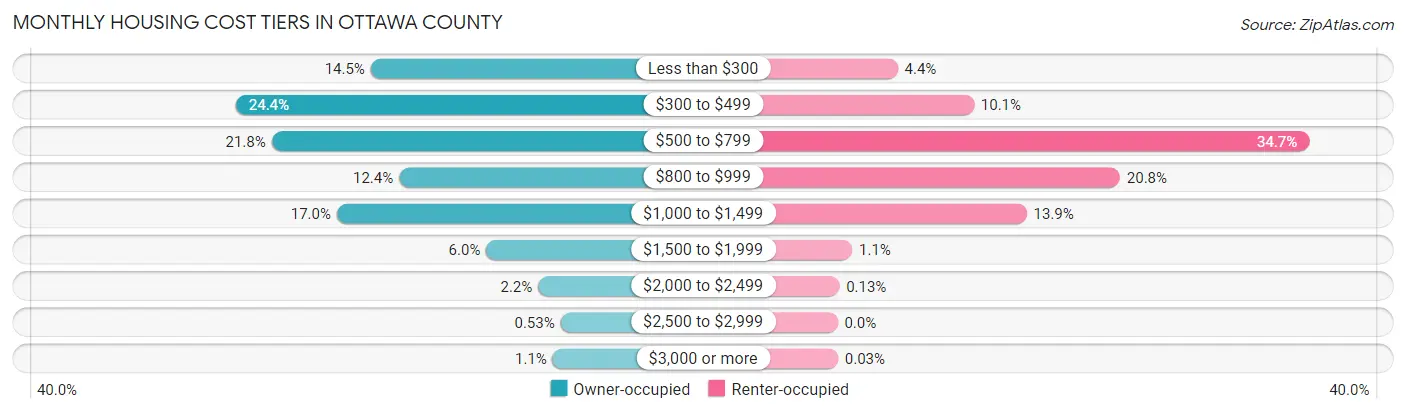
| Monthly Cost | Owner-occupied | Renter-occupied |
| Less than $300 | 1,147 (14.5%) | 169 (4.4%) |
| $300 to $499 | 1,932 (24.4%) | 383 (10.1%) |
| $500 to $799 | 1,724 (21.8%) | 1,324 (34.7%) |
| $800 to $999 | 982 (12.4%) | 793 (20.8%) |
| $1,000 to $1,499 | 1,345 (17.0%) | 531 (13.9%) |
| $1,500 to $1,999 | 474 (6.0%) | 41 (1.1%) |
| $2,000 to $2,499 | 172 (2.2%) | 5 (0.1%) |
| $2,500 to $2,999 | 42 (0.5%) | 0 (0.0%) |
| $3,000 or more | 88 (1.1%) | 1 (0.0%) |
| Total | 7,906 (100.0%) | 3,812 (100.0%) |
Physical Housing Characteristics in Ottawa County
Housing Structures in Ottawa County
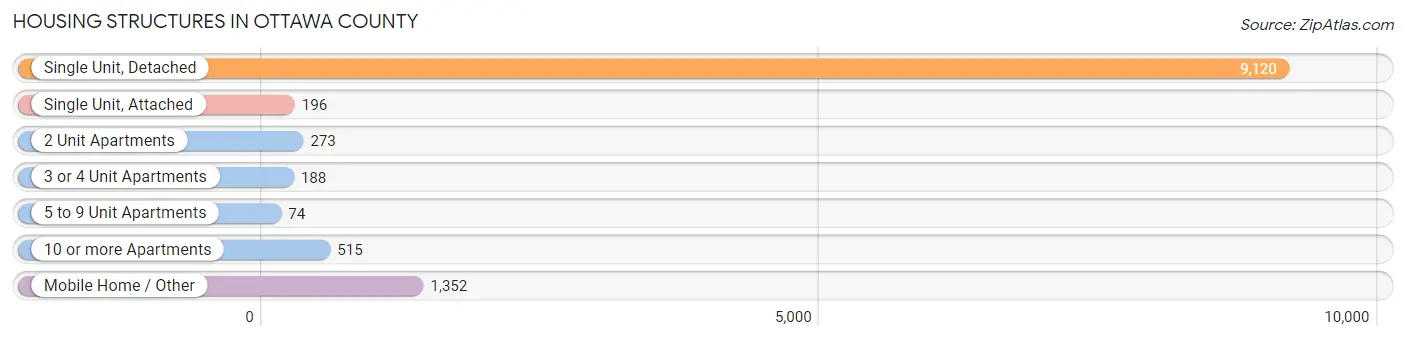
| Structure Type | # Housing Units | % Housing Units |
| Single Unit, Detached | 9,120 | 77.8% |
| Single Unit, Attached | 196 | 1.7% |
| 2 Unit Apartments | 273 | 2.3% |
| 3 or 4 Unit Apartments | 188 | 1.6% |
| 5 to 9 Unit Apartments | 74 | 0.6% |
| 10 or more Apartments | 515 | 4.4% |
| Mobile Home / Other | 1,352 | 11.5% |
| Total | 11,718 | 100.0% |
Housing Structures by Occupancy in Ottawa County
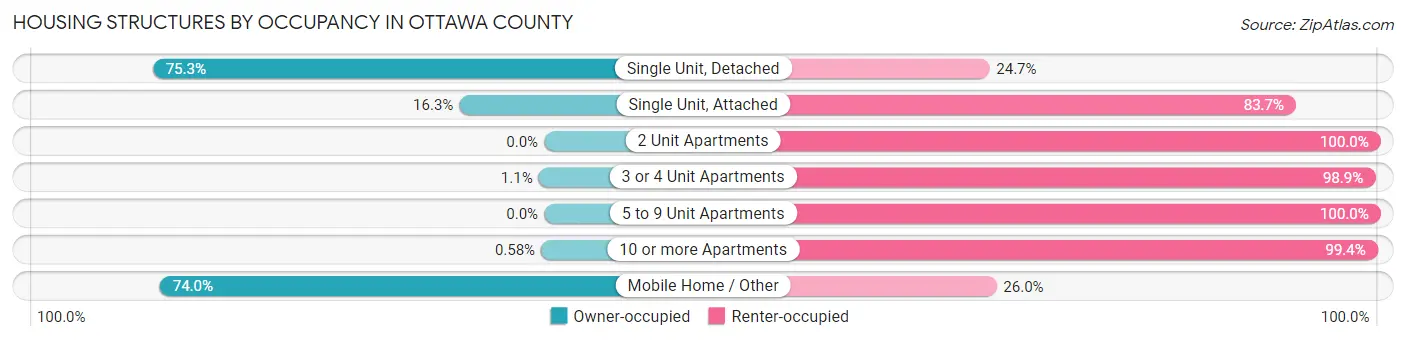
| Structure Type | Owner-occupied | Renter-occupied |
| Single Unit, Detached | 6,869 (75.3%) | 2,251 (24.7%) |
| Single Unit, Attached | 32 (16.3%) | 164 (83.7%) |
| 2 Unit Apartments | 0 (0.0%) | 273 (100.0%) |
| 3 or 4 Unit Apartments | 2 (1.1%) | 186 (98.9%) |
| 5 to 9 Unit Apartments | 0 (0.0%) | 74 (100.0%) |
| 10 or more Apartments | 3 (0.6%) | 512 (99.4%) |
| Mobile Home / Other | 1,000 (74.0%) | 352 (26.0%) |
| Total | 7,906 (67.5%) | 3,812 (32.5%) |
Housing Structures by Number of Rooms in Ottawa County
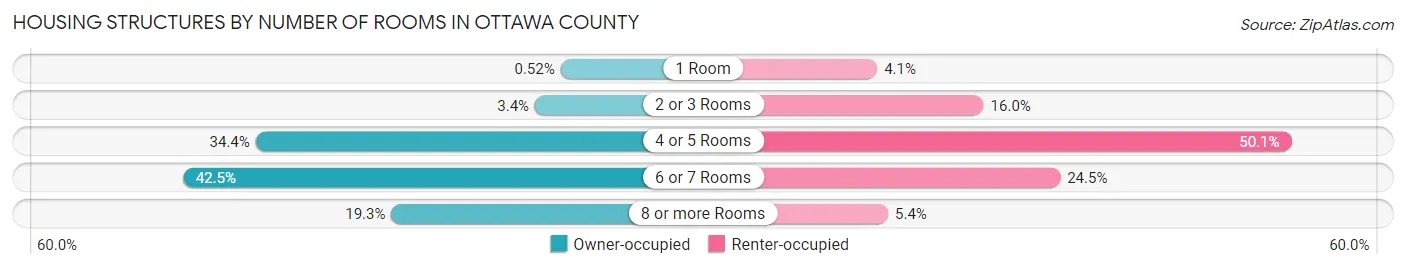
| Number of Rooms | Owner-occupied | Renter-occupied |
| 1 Room | 41 (0.5%) | 158 (4.1%) |
| 2 or 3 Rooms | 266 (3.4%) | 608 (16.0%) |
| 4 or 5 Rooms | 2,717 (34.4%) | 1,910 (50.1%) |
| 6 or 7 Rooms | 3,356 (42.4%) | 932 (24.4%) |
| 8 or more Rooms | 1,526 (19.3%) | 204 (5.3%) |
| Total | 7,906 (100.0%) | 3,812 (100.0%) |
Housing Structure by Heating Type in Ottawa County
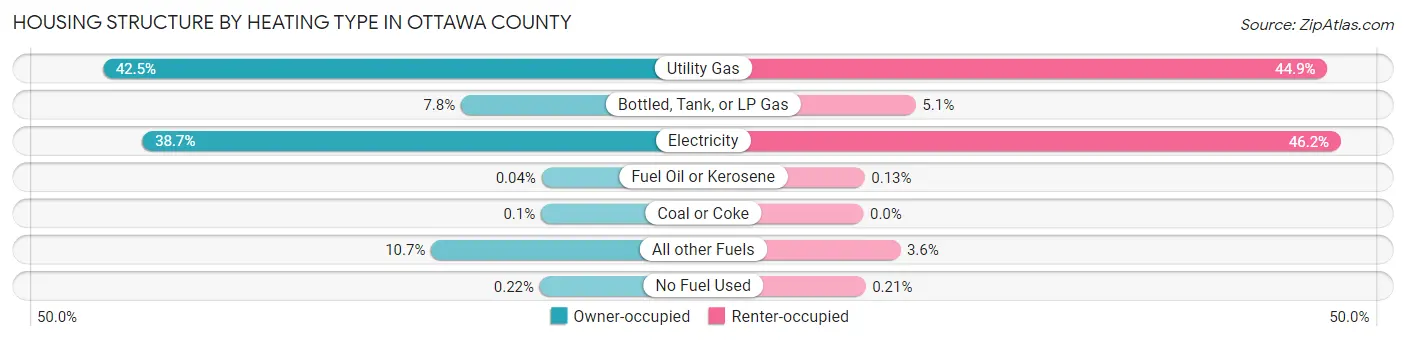
| Heating Type | Owner-occupied | Renter-occupied |
| Utility Gas | 3,356 (42.4%) | 1,710 (44.9%) |
| Bottled, Tank, or LP Gas | 619 (7.8%) | 193 (5.1%) |
| Electricity | 3,056 (38.7%) | 1,760 (46.2%) |
| Fuel Oil or Kerosene | 3 (0.0%) | 5 (0.1%) |
| Coal or Coke | 8 (0.1%) | 0 (0.0%) |
| All other Fuels | 847 (10.7%) | 136 (3.6%) |
| No Fuel Used | 17 (0.2%) | 8 (0.2%) |
| Total | 7,906 (100.0%) | 3,812 (100.0%) |
Household Vehicle Usage in Ottawa County
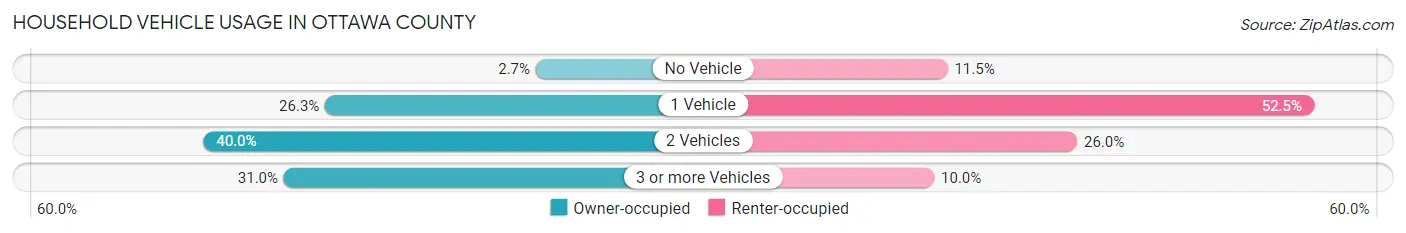
| Vehicles per Household | Owner-occupied | Renter-occupied |
| No Vehicle | 216 (2.7%) | 438 (11.5%) |
| 1 Vehicle | 2,082 (26.3%) | 2,002 (52.5%) |
| 2 Vehicles | 3,160 (40.0%) | 991 (26.0%) |
| 3 or more Vehicles | 2,448 (31.0%) | 381 (10.0%) |
| Total | 7,906 (100.0%) | 3,812 (100.0%) |
Real Estate & Mortgages in Ottawa County
Real Estate and Mortgage Overview in Ottawa County
| Characteristic | Without Mortgage | With Mortgage |
| Housing Units | 4,195 | 3,711 |
| Median Property Value | $96,900 | $119,300 |
| Median Household Income | $44,778 | $336 |
| Monthly Housing Costs | $405 | $76 |
| Real Estate Taxes | $533 | $174 |
Property Value by Mortgage Status in Ottawa County
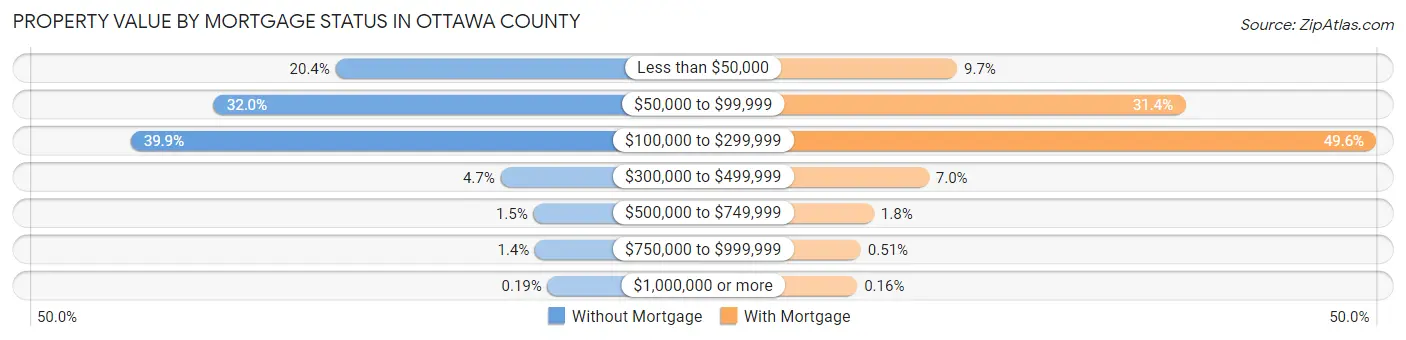
| Property Value | Without Mortgage | With Mortgage |
| Less than $50,000 | 855 (20.4%) | 359 (9.7%) |
| $50,000 to $99,999 | 1,341 (32.0%) | 1,164 (31.4%) |
| $100,000 to $299,999 | 1,673 (39.9%) | 1,839 (49.6%) |
| $300,000 to $499,999 | 196 (4.7%) | 259 (7.0%) |
| $500,000 to $749,999 | 64 (1.5%) | 65 (1.8%) |
| $750,000 to $999,999 | 58 (1.4%) | 19 (0.5%) |
| $1,000,000 or more | 8 (0.2%) | 6 (0.2%) |
| Total | 4,195 (100.0%) | 3,711 (100.0%) |
Household Income by Mortgage Status in Ottawa County
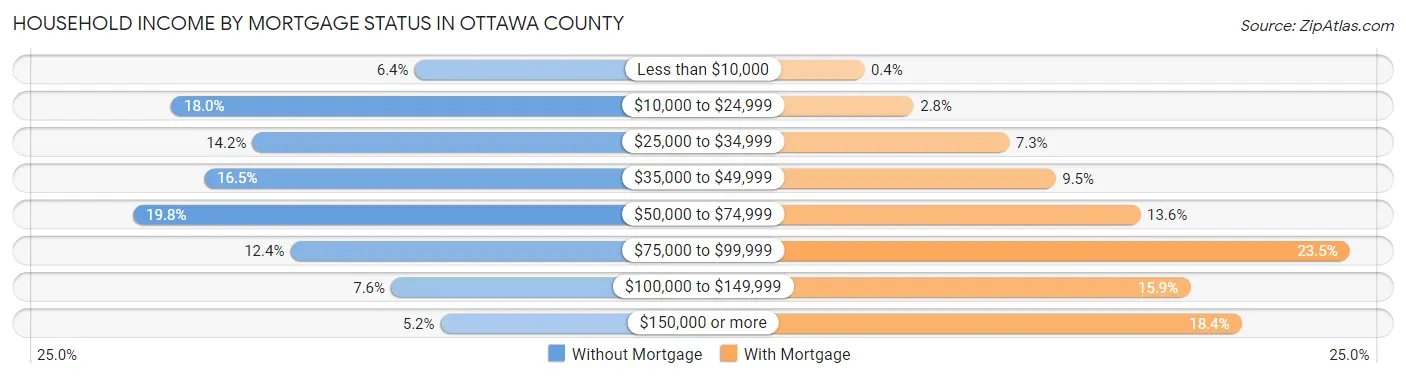
| Household Income | Without Mortgage | With Mortgage |
| Less than $10,000 | 270 (6.4%) | 15 (0.4%) |
| $10,000 to $24,999 | 756 (18.0%) | 102 (2.8%) |
| $25,000 to $34,999 | 594 (14.2%) | 271 (7.3%) |
| $35,000 to $49,999 | 690 (16.5%) | 353 (9.5%) |
| $50,000 to $74,999 | 832 (19.8%) | 503 (13.6%) |
| $75,000 to $99,999 | 518 (12.3%) | 873 (23.5%) |
| $100,000 to $149,999 | 317 (7.6%) | 591 (15.9%) |
| $150,000 or more | 218 (5.2%) | 682 (18.4%) |
| Total | 4,195 (100.0%) | 3,711 (100.0%) |
Property Value to Household Income Ratio in Ottawa County
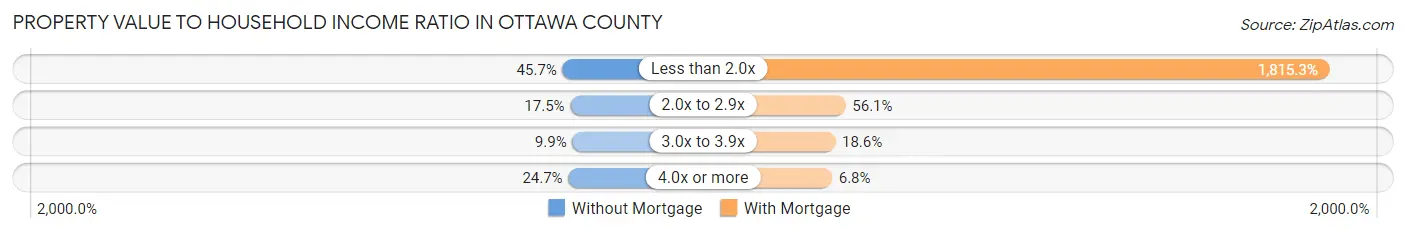
| Value-to-Income Ratio | Without Mortgage | With Mortgage |
| Less than 2.0x | 1,915 (45.7%) | 67,366 (1,815.3%) |
| 2.0x to 2.9x | 733 (17.5%) | 2,082 (56.1%) |
| 3.0x to 3.9x | 416 (9.9%) | 690 (18.6%) |
| 4.0x or more | 1,034 (24.6%) | 252 (6.8%) |
| Total | 4,195 (100.0%) | 3,711 (100.0%) |
Real Estate Taxes by Mortgage Status in Ottawa County
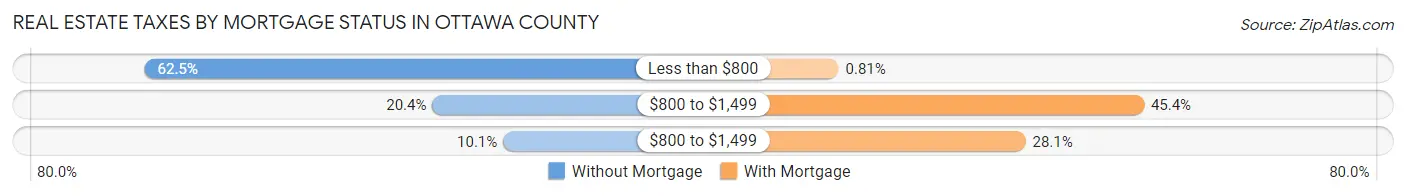
| Property Taxes | Without Mortgage | With Mortgage |
| Less than $800 | 2,620 (62.5%) | 30 (0.8%) |
| $800 to $1,499 | 857 (20.4%) | 1,686 (45.4%) |
| $800 to $1,499 | 423 (10.1%) | 1,044 (28.1%) |
| Total | 4,195 (100.0%) | 3,711 (100.0%) |
Health & Disability in Ottawa County
Health Insurance Coverage by Age in Ottawa County
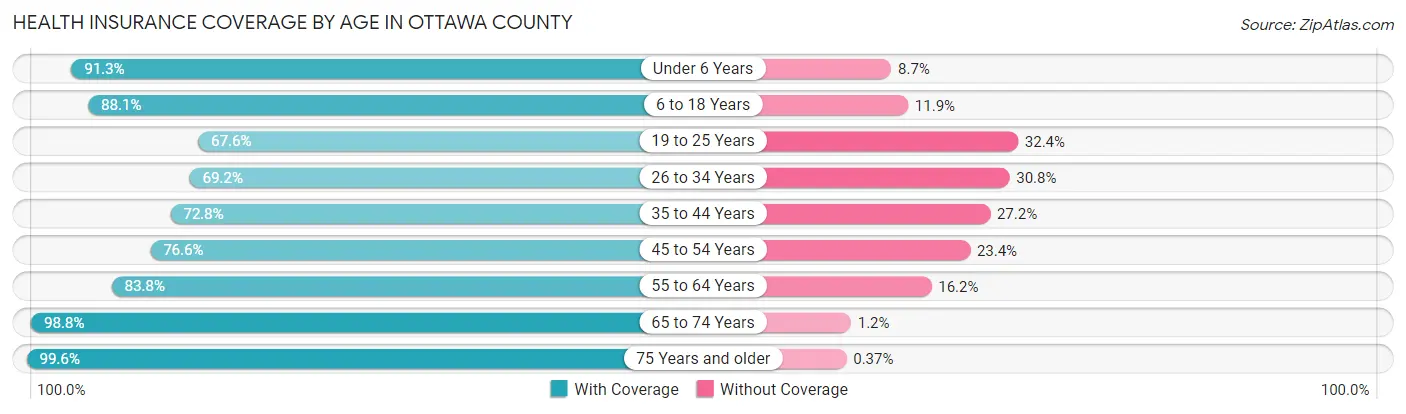
| Age Bracket | With Coverage | Without Coverage |
| Under 6 Years | 2,260 (91.3%) | 216 (8.7%) |
| 6 to 18 Years | 4,964 (88.1%) | 668 (11.9%) |
| 19 to 25 Years | 1,962 (67.6%) | 939 (32.4%) |
| 26 to 34 Years | 2,243 (69.2%) | 997 (30.8%) |
| 35 to 44 Years | 2,412 (72.8%) | 900 (27.2%) |
| 45 to 54 Years | 2,624 (76.6%) | 803 (23.4%) |
| 55 to 64 Years | 3,146 (83.8%) | 609 (16.2%) |
| 65 to 74 Years | 3,112 (98.8%) | 38 (1.2%) |
| 75 Years and older | 2,132 (99.6%) | 8 (0.4%) |
| Total | 24,855 (82.8%) | 5,178 (17.2%) |
Health Insurance Coverage by Citizenship Status in Ottawa County
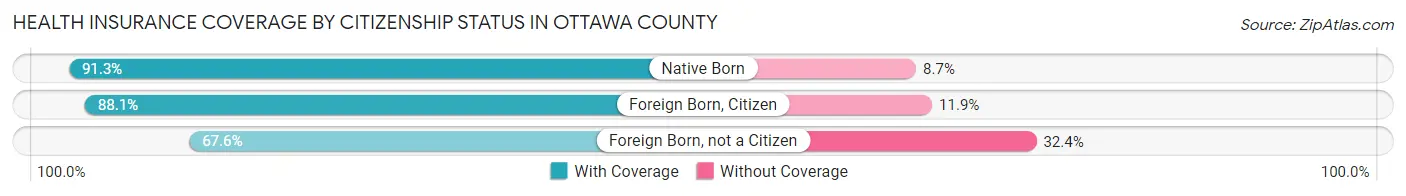
| Citizenship Status | With Coverage | Without Coverage |
| Native Born | 2,260 (91.3%) | 216 (8.7%) |
| Foreign Born, Citizen | 4,964 (88.1%) | 668 (11.9%) |
| Foreign Born, not a Citizen | 1,962 (67.6%) | 939 (32.4%) |
Health Insurance Coverage by Household Income in Ottawa County
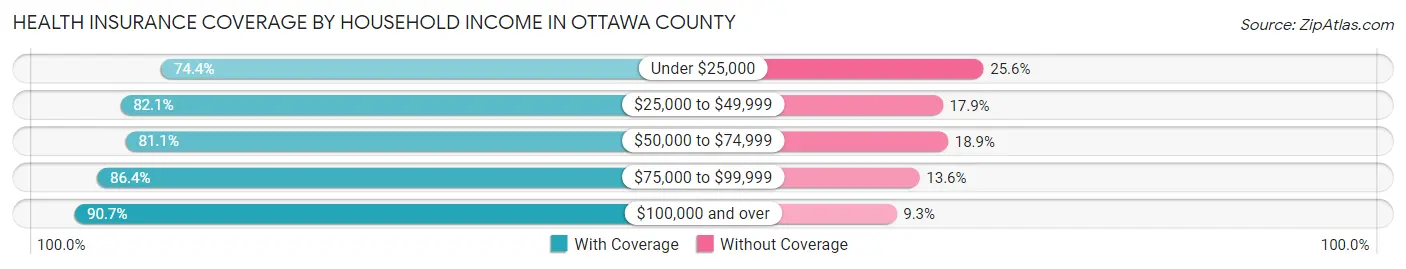
| Household Income | With Coverage | Without Coverage |
| Under $25,000 | 3,992 (74.4%) | 1,372 (25.6%) |
| $25,000 to $49,999 | 6,400 (82.1%) | 1,397 (17.9%) |
| $50,000 to $74,999 | 5,036 (81.1%) | 1,175 (18.9%) |
| $75,000 to $99,999 | 3,519 (86.4%) | 554 (13.6%) |
| $100,000 and over | 5,278 (90.7%) | 539 (9.3%) |
Public vs Private Health Insurance Coverage by Age in Ottawa County
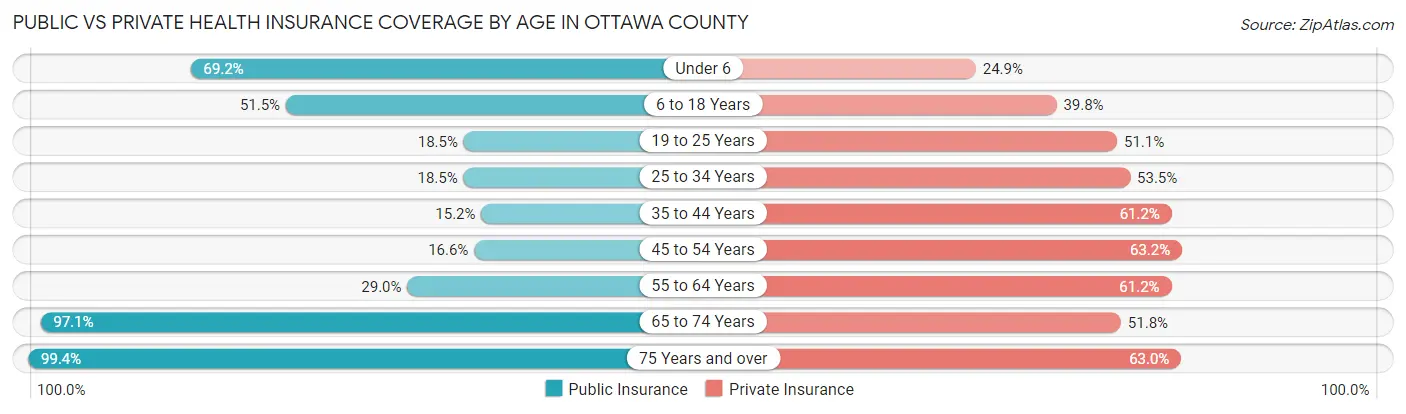
| Age Bracket | Public Insurance | Private Insurance |
| Under 6 | 1,714 (69.2%) | 616 (24.9%) |
| 6 to 18 Years | 2,900 (51.5%) | 2,244 (39.8%) |
| 19 to 25 Years | 536 (18.5%) | 1,482 (51.1%) |
| 25 to 34 Years | 600 (18.5%) | 1,734 (53.5%) |
| 35 to 44 Years | 504 (15.2%) | 2,028 (61.2%) |
| 45 to 54 Years | 567 (16.6%) | 2,164 (63.1%) |
| 55 to 64 Years | 1,087 (28.9%) | 2,297 (61.2%) |
| 65 to 74 Years | 3,058 (97.1%) | 1,632 (51.8%) |
| 75 Years and over | 2,127 (99.4%) | 1,348 (63.0%) |
| Total | 13,093 (43.6%) | 15,545 (51.8%) |
Disability Status by Sex by Age in Ottawa County
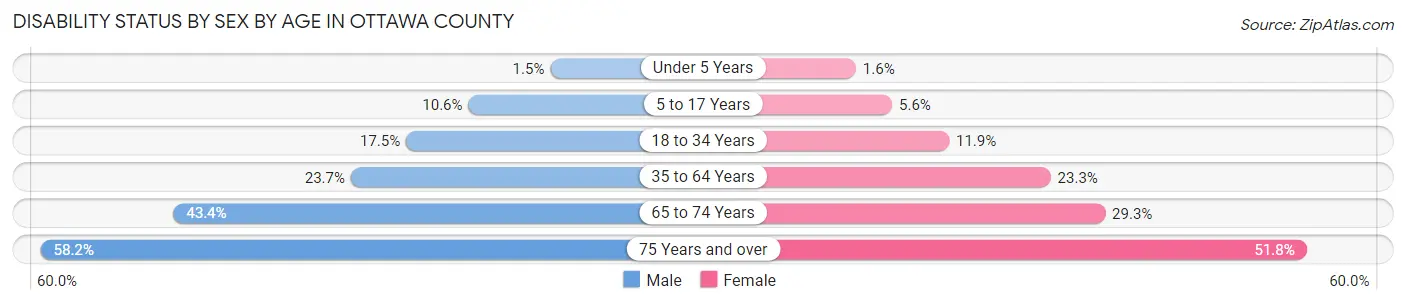
| Age Bracket | Male | Female |
| Under 5 Years | 15 (1.5%) | 15 (1.6%) |
| 5 to 17 Years | 305 (10.6%) | 151 (5.6%) |
| 18 to 34 Years | 588 (17.5%) | 398 (11.9%) |
| 35 to 64 Years | 1,225 (23.7%) | 1,237 (23.3%) |
| 65 to 74 Years | 638 (43.4%) | 493 (29.3%) |
| 75 Years and over | 546 (58.2%) | 622 (51.7%) |
Disability Class by Sex by Age in Ottawa County
Disability Class: Hearing Difficulty
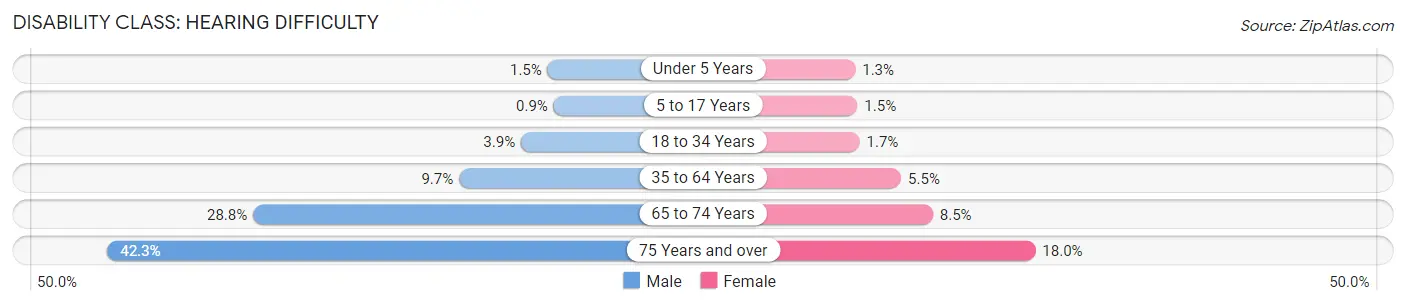
| Age Bracket | Male | Female |
| Under 5 Years | 15 (1.5%) | 12 (1.3%) |
| 5 to 17 Years | 26 (0.9%) | 39 (1.5%) |
| 18 to 34 Years | 132 (3.9%) | 55 (1.7%) |
| 35 to 64 Years | 501 (9.7%) | 293 (5.5%) |
| 65 to 74 Years | 423 (28.8%) | 142 (8.5%) |
| 75 Years and over | 397 (42.3%) | 216 (18.0%) |
Disability Class: Vision Difficulty
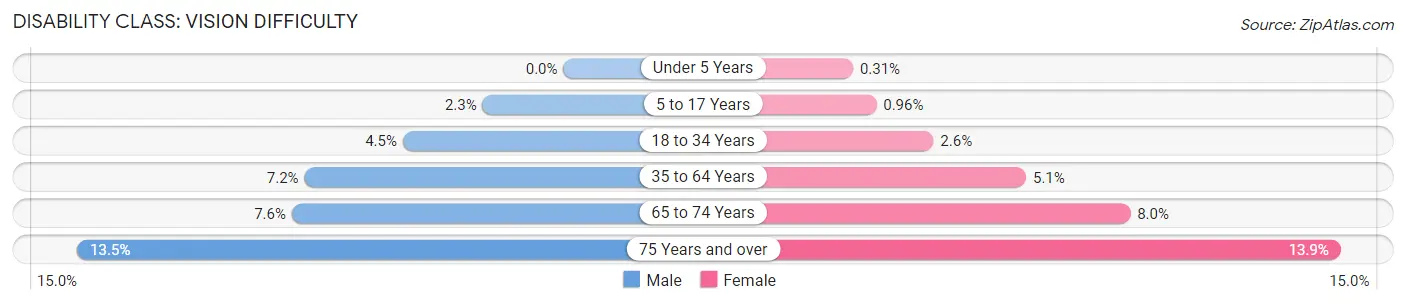
| Age Bracket | Male | Female |
| Under 5 Years | 0 (0.0%) | 3 (0.3%) |
| 5 to 17 Years | 65 (2.2%) | 26 (1.0%) |
| 18 to 34 Years | 150 (4.5%) | 85 (2.5%) |
| 35 to 64 Years | 373 (7.2%) | 273 (5.1%) |
| 65 to 74 Years | 111 (7.6%) | 135 (8.0%) |
| 75 Years and over | 127 (13.5%) | 167 (13.9%) |
Disability Class: Cognitive Difficulty
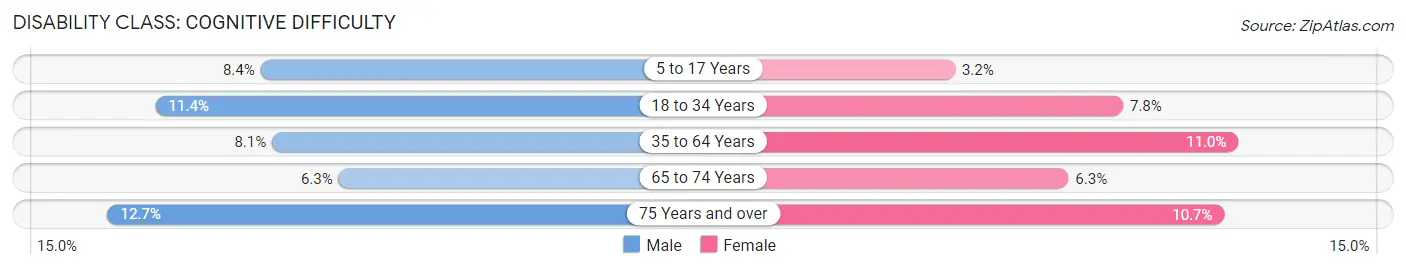
| Age Bracket | Male | Female |
| 5 to 17 Years | 243 (8.4%) | 85 (3.2%) |
| 18 to 34 Years | 381 (11.4%) | 261 (7.8%) |
| 35 to 64 Years | 420 (8.1%) | 587 (11.0%) |
| 65 to 74 Years | 92 (6.3%) | 106 (6.3%) |
| 75 Years and over | 119 (12.7%) | 128 (10.6%) |
Disability Class: Ambulatory Difficulty
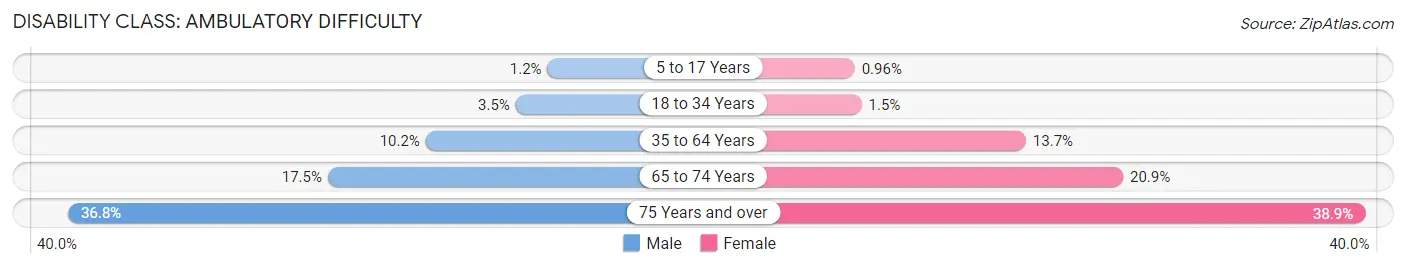
| Age Bracket | Male | Female |
| 5 to 17 Years | 34 (1.2%) | 26 (1.0%) |
| 18 to 34 Years | 119 (3.5%) | 49 (1.5%) |
| 35 to 64 Years | 529 (10.2%) | 727 (13.7%) |
| 65 to 74 Years | 257 (17.5%) | 351 (20.9%) |
| 75 Years and over | 345 (36.8%) | 467 (38.9%) |
Disability Class: Self-Care Difficulty
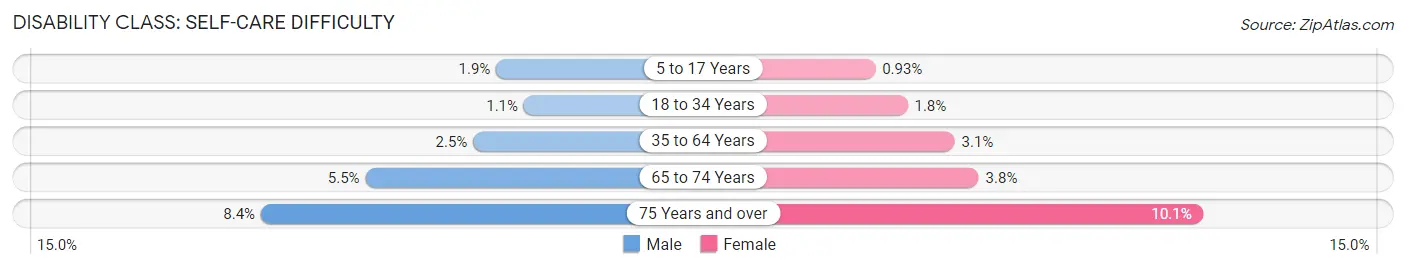
| Age Bracket | Male | Female |
| 5 to 17 Years | 54 (1.9%) | 25 (0.9%) |
| 18 to 34 Years | 37 (1.1%) | 61 (1.8%) |
| 35 to 64 Years | 130 (2.5%) | 167 (3.1%) |
| 65 to 74 Years | 81 (5.5%) | 64 (3.8%) |
| 75 Years and over | 79 (8.4%) | 121 (10.1%) |
Technology Access in Ottawa County
Computing Device Access in Ottawa County
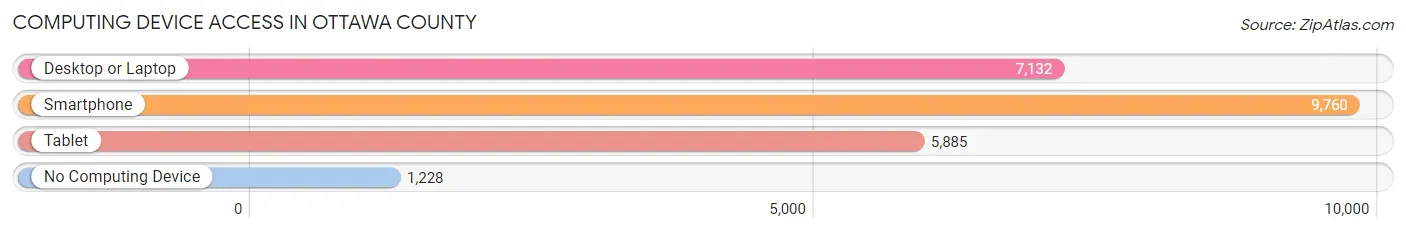
| Device Type | # Households | % Households |
| Desktop or Laptop | 7,132 | 60.9% |
| Smartphone | 9,760 | 83.3% |
| Tablet | 5,885 | 50.2% |
| No Computing Device | 1,228 | 10.5% |
| Total | 11,718 | 100.0% |
Internet Access in Ottawa County
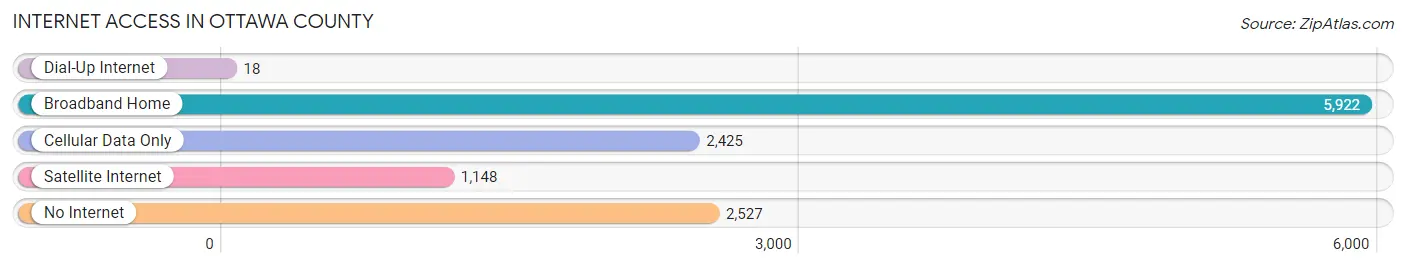
| Internet Type | # Households | % Households |
| Dial-Up Internet | 18 | 0.2% |
| Broadband Home | 5,922 | 50.5% |
| Cellular Data Only | 2,425 | 20.7% |
| Satellite Internet | 1,148 | 9.8% |
| No Internet | 2,527 | 21.6% |
| Total | 11,718 | 100.0% |
Ottawa County Summary
Ottawa County is located in the northeastern corner of Oklahoma, and is bordered by Kansas to the north, Missouri to the east, Delaware County to the south, and Craig County to the west. The county seat is Miami, and the county was named after the Ottawa tribe of Native Americans who originally inhabited the area.
Geography
Ottawa County covers an area of 1,093 square miles, and is located in the Ozark Plateau region of Oklahoma. The county is mostly rural, with the majority of the land being used for agricultural purposes. The Grand River runs through the county, and there are several small lakes and reservoirs in the area. The highest point in the county is located in the northeast corner, at an elevation of 1,093 feet.
The climate of Ottawa County is generally mild, with hot summers and cold winters. The average annual temperature is around 60 degrees Fahrenheit, and the average annual precipitation is around 40 inches.
Economy
The economy of Ottawa County is largely based on agriculture, with the majority of the land being used for farming and ranching. The county is also home to several manufacturing and industrial businesses, including a large paper mill in Miami. Tourism is also an important part of the local economy, with several state parks and recreational areas located in the county.
Demographics
As of the 2010 census, the population of Ottawa County was 31,848. The population is mostly white (90.2%), with small percentages of Native American (3.2%), African American (2.2%), and Asian (1.2%) residents. The median household income is $37,945, and the median home value is $87,400.
The largest city in the county is Miami, with a population of 13,570. Other cities in the county include Fairland, Quapaw, and Wyandotte.
Education
Ottawa County is served by the Miami Public Schools, which includes four elementary schools, one middle school, and one high school. There are also several private schools in the county, as well as a branch of Northeastern Oklahoma A&M College.
Conclusion
Ottawa County is a rural county located in the northeastern corner of Oklahoma. The economy is largely based on agriculture, and the county is also home to several manufacturing and industrial businesses. The population is mostly white, and the median household income is $37,945. The county is served by the Miami Public Schools, as well as several private schools and a branch of Northeastern Oklahoma A&M College.
Common Questions
What is Per Capita Income in Ottawa County?
Per Capita income in Ottawa County is $24,354.
What is the Median Family Income in Ottawa County?
Median Family Income in Ottawa County is $56,443.
What is the Median Household income in Ottawa County?
Median Household Income in Ottawa County is $46,186.
What is Income or Wage Gap in Ottawa County?
Income or Wage Gap in Ottawa County is 25.1%.
Women in Ottawa County earn 74.9 cents for every dollar earned by a man.
What is Family Income Deficit in Ottawa County?
Family Income Deficit in Ottawa County is $11,068.
Families that are below poverty line in Ottawa County earn $11,068 less on average than the poverty threshold level.
What is Inequality or Gini Index in Ottawa County?
Inequality or Gini Index in Ottawa County is 0.45.
What is the Total Population of Ottawa County?
Total Population of Ottawa County is 30,472.
What is the Total Male Population of Ottawa County?
Total Male Population of Ottawa County is 15,060.
What is the Total Female Population of Ottawa County?
Total Female Population of Ottawa County is 15,412.
What is the Ratio of Males per 100 Females in Ottawa County?
There are 97.72 Males per 100 Females in Ottawa County.
What is the Ratio of Females per 100 Males in Ottawa County?
There are 102.34 Females per 100 Males in Ottawa County.
What is the Median Population Age in Ottawa County?
Median Population Age in Ottawa County is 37.6 Years.
What is the Average Family Size in Ottawa County
Average Family Size in Ottawa County is 3.1 People.
What is the Average Household Size in Ottawa County
Average Household Size in Ottawa County is 2.5 People.
How Large is the Labor Force in Ottawa County?
There are 12,865 People in the Labor Forcein in Ottawa County.
What is the Percentage of People in the Labor Force in Ottawa County?
54.2% of People are in the Labor Force in Ottawa County.
What is the Unemployment Rate in Ottawa County?
Unemployment Rate in Ottawa County is 3.8%.