Okfuskee County, OK Map & Demographics
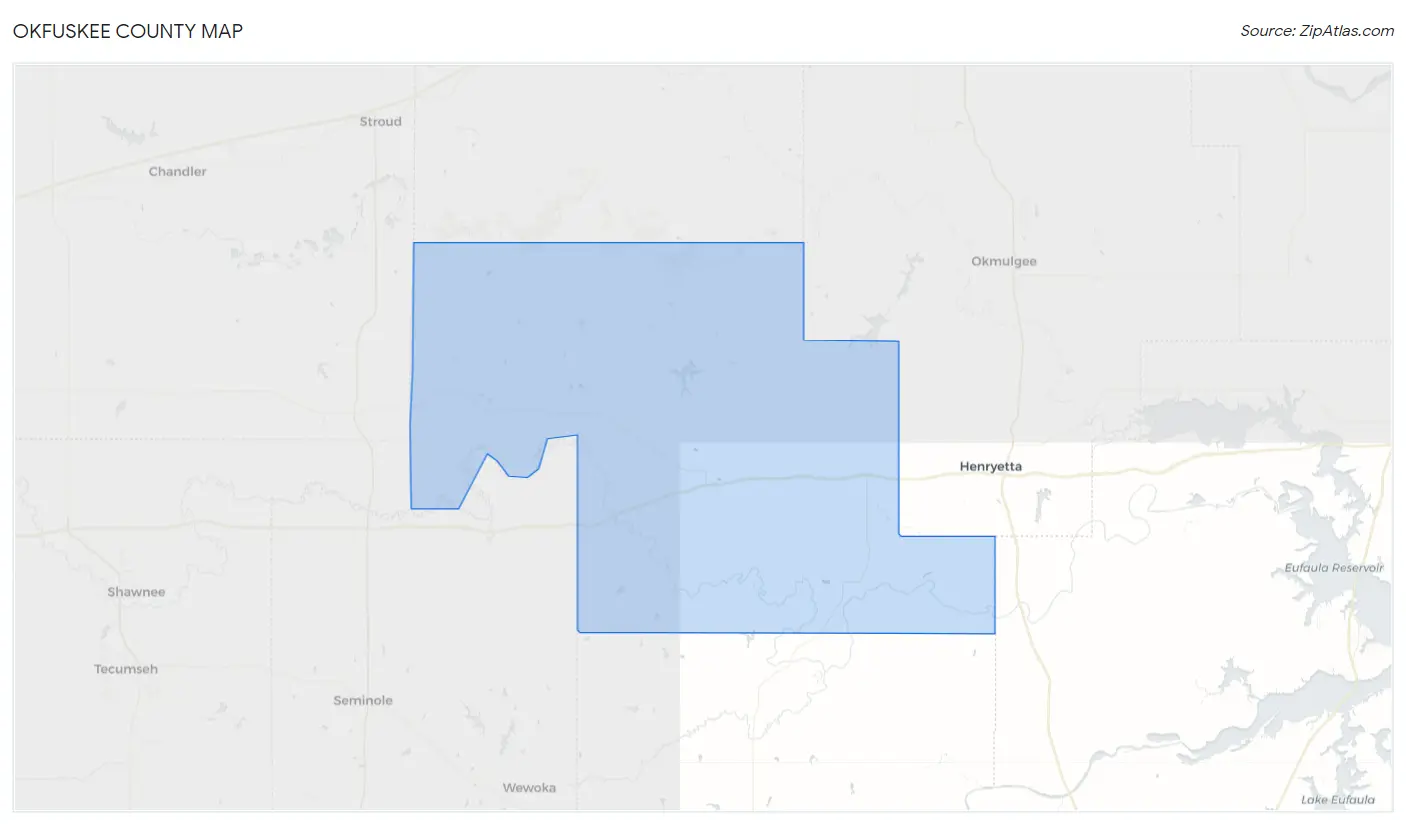
Okfuskee County Map
Okfuskee County Overview
$23,052
PER CAPITA INCOME
$57,857
AVG FAMILY INCOME
$45,429
AVG HOUSEHOLD INCOME
23.3%
WAGE / INCOME GAP [ % ]
76.7¢/ $1
WAGE / INCOME GAP [ $ ]
$11,642
FAMILY INCOME DEFICIT
0.46
INEQUALITY / GINI INDEX
11,349
TOTAL POPULATION
6,190
MALE POPULATION
5,159
FEMALE POPULATION
119.98
MALES / 100 FEMALES
83.34
FEMALES / 100 MALES
40.1
MEDIAN AGE
3.1
AVG FAMILY SIZE
2.6
AVG HOUSEHOLD SIZE
4,025
LABOR FORCE [ PEOPLE ]
44.3%
PERCENT IN LABOR FORCE
3.5%
UNEMPLOYMENT RATE
Income in Okfuskee County
Income Overview in Okfuskee County
Per Capita Income in Okfuskee County is $23,052, while median incomes of families and households are $57,857 and $45,429 respectively.
| Characteristic | Number | Measure |
| Per Capita Income | 11,349 | $23,052 |
| Median Family Income | 2,728 | $57,857 |
| Mean Family Income | 2,728 | $72,962 |
| Median Household Income | 3,871 | $45,429 |
| Mean Household Income | 3,871 | $62,180 |
| Income Deficit | 2,728 | $11,642 |
| Wage / Income Gap (%) | 11,349 | 23.26% |
| Wage / Income Gap ($) | 11,349 | 76.74¢ per $1 |
| Gini / Inequality Index | 11,349 | 0.46 |
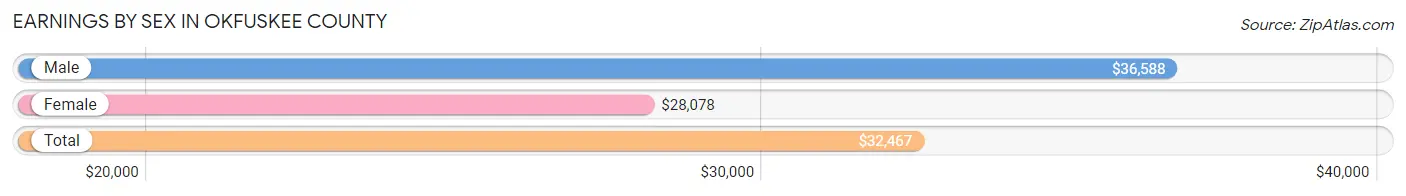
Earnings by Sex in Okfuskee County
Average Earnings in Okfuskee County are $32,467, $36,588 for men and $28,078 for women, a difference of 23.3%.
| Sex | Number | Average Earnings |
| Male | 2,422 (54.2%) | $36,588 |
| Female | 2,043 (45.8%) | $28,078 |
| Total | 4,465 (100.0%) | $32,467 |
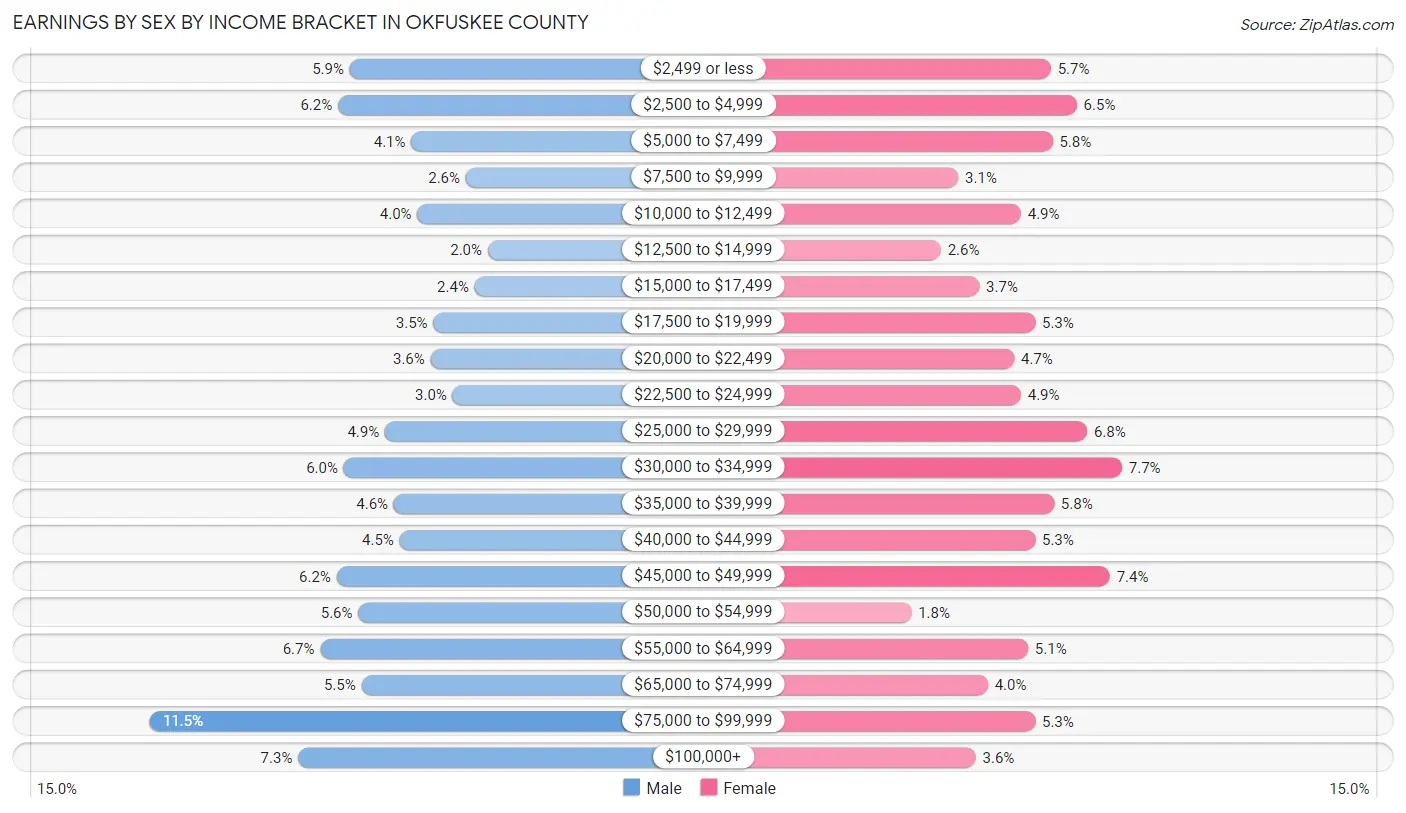
Earnings by Sex by Income Bracket in Okfuskee County
The most common earnings brackets in Okfuskee County are $75,000 to $99,999 for men (278 | 11.5%) and $30,000 to $34,999 for women (158 | 7.7%).
| Income | Male | Female |
| $2,499 or less | 142 (5.9%) | 117 (5.7%) |
| $2,500 to $4,999 | 150 (6.2%) | 132 (6.5%) |
| $5,000 to $7,499 | 100 (4.1%) | 118 (5.8%) |
| $7,500 to $9,999 | 63 (2.6%) | 64 (3.1%) |
| $10,000 to $12,499 | 96 (4.0%) | 100 (4.9%) |
| $12,500 to $14,999 | 48 (2.0%) | 54 (2.6%) |
| $15,000 to $17,499 | 57 (2.4%) | 76 (3.7%) |
| $17,500 to $19,999 | 85 (3.5%) | 108 (5.3%) |
| $20,000 to $22,499 | 87 (3.6%) | 96 (4.7%) |
| $22,500 to $24,999 | 72 (3.0%) | 100 (4.9%) |
| $25,000 to $29,999 | 118 (4.9%) | 138 (6.8%) |
| $30,000 to $34,999 | 146 (6.0%) | 158 (7.7%) |
| $35,000 to $39,999 | 112 (4.6%) | 119 (5.8%) |
| $40,000 to $44,999 | 108 (4.5%) | 108 (5.3%) |
| $45,000 to $49,999 | 151 (6.2%) | 151 (7.4%) |
| $50,000 to $54,999 | 136 (5.6%) | 37 (1.8%) |
| $55,000 to $64,999 | 162 (6.7%) | 104 (5.1%) |
| $65,000 to $74,999 | 134 (5.5%) | 81 (4.0%) |
| $75,000 to $99,999 | 278 (11.5%) | 108 (5.3%) |
| $100,000+ | 177 (7.3%) | 74 (3.6%) |
| Total | 2,422 (100.0%) | 2,043 (100.0%) |
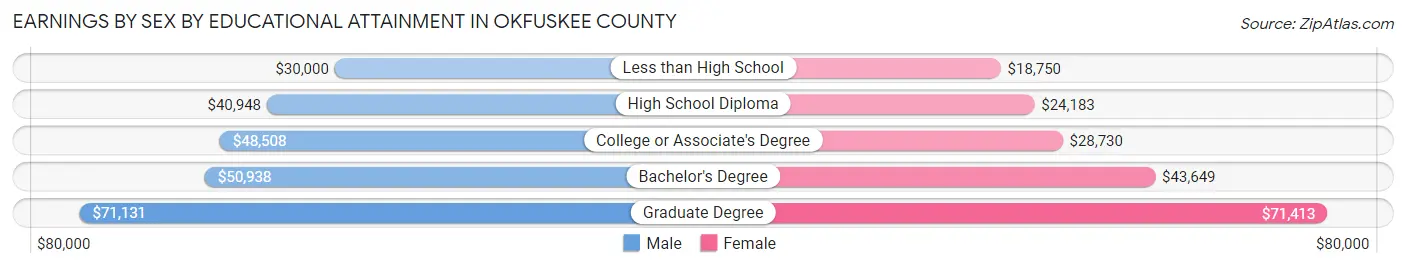
Earnings by Sex by Educational Attainment in Okfuskee County
Average earnings in Okfuskee County are $44,013 for men and $31,983 for women, a difference of 27.3%. Men with an educational attainment of graduate degree enjoy the highest average annual earnings of $71,131, while those with less than high school education earn the least with $30,000. Women with an educational attainment of graduate degree earn the most with the average annual earnings of $71,413, while those with less than high school education have the smallest earnings of $18,750.
| Educational Attainment | Male Income | Female Income |
| Less than High School | $30,000 | $18,750 |
| High School Diploma | $40,948 | $24,183 |
| College or Associate's Degree | $48,508 | $28,730 |
| Bachelor's Degree | $50,938 | $43,649 |
| Graduate Degree | $71,131 | $71,413 |
| Total | $44,013 | $31,983 |
Family Income in Okfuskee County
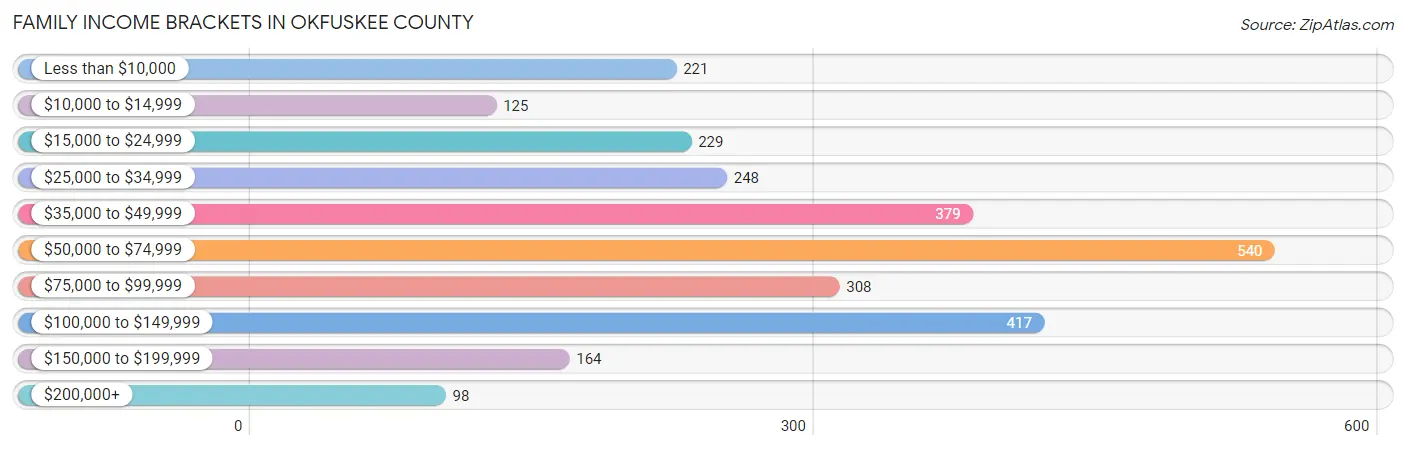
Family Income Brackets in Okfuskee County
According to the Okfuskee County family income data, there are 540 families falling into the $50,000 to $74,999 income range, which is the most common income bracket and makes up 19.8% of all families. Conversely, the $200,000+ income bracket is the least frequent group with only 98 families (3.6%) belonging to this category.
| Income Bracket | # Families | % Families |
| Less than $10,000 | 221 | 8.1% |
| $10,000 to $14,999 | 125 | 4.6% |
| $15,000 to $24,999 | 229 | 8.4% |
| $25,000 to $34,999 | 248 | 9.1% |
| $35,000 to $49,999 | 379 | 13.9% |
| $50,000 to $74,999 | 540 | 19.8% |
| $75,000 to $99,999 | 308 | 11.3% |
| $100,000 to $149,999 | 417 | 15.3% |
| $150,000 to $199,999 | 164 | 6.0% |
| $200,000+ | 98 | 3.6% |
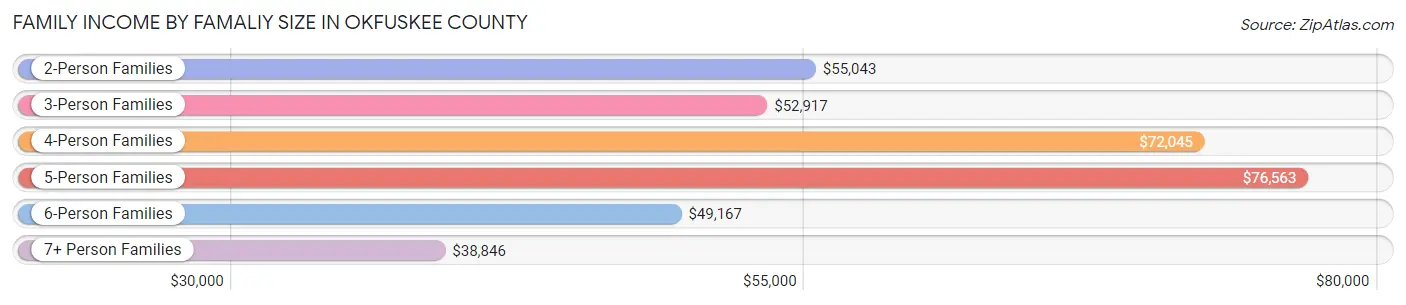
Family Income by Famaliy Size in Okfuskee County
5-person families (326 | 11.9%) account for the highest median family income in Okfuskee County with $76,563 per family, while 2-person families (1,319 | 48.3%) have the highest median income of $27,522 per family member.
| Income Bracket | # Families | Median Income |
| 2-Person Families | 1,319 (48.3%) | $55,043 |
| 3-Person Families | 529 (19.4%) | $52,917 |
| 4-Person Families | 400 (14.7%) | $72,045 |
| 5-Person Families | 326 (11.9%) | $76,563 |
| 6-Person Families | 88 (3.2%) | $49,167 |
| 7+ Person Families | 66 (2.4%) | $38,846 |
| Total | 2,728 (100.0%) | $57,857 |
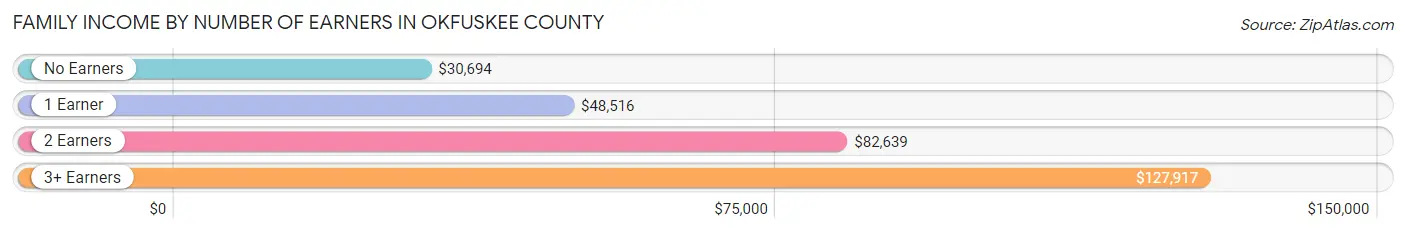
Family Income by Number of Earners in Okfuskee County
The median family income in Okfuskee County is $57,857, with families comprising 3+ earners (221) having the highest median family income of $127,917, while families with no earners (779) have the lowest median family income of $30,694, accounting for 8.1% and 28.6% of families, respectively.
| Number of Earners | # Families | Median Income |
| No Earners | 779 (28.6%) | $30,694 |
| 1 Earner | 907 (33.3%) | $48,516 |
| 2 Earners | 821 (30.1%) | $82,639 |
| 3+ Earners | 221 (8.1%) | $127,917 |
| Total | 2,728 (100.0%) | $57,857 |
Household Income in Okfuskee County
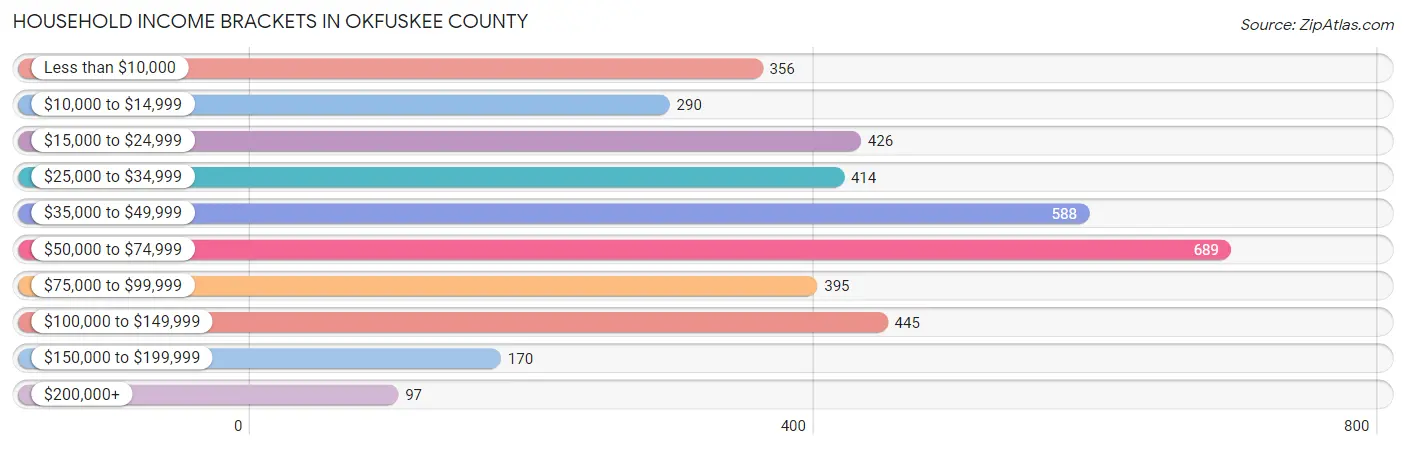
Household Income Brackets in Okfuskee County
With 689 households falling in the category, the $50,000 to $74,999 income range is the most frequent in Okfuskee County, accounting for 17.8% of all households. In contrast, only 97 households (2.5%) fall into the $200,000+ income bracket, making it the least populous group.
| Income Bracket | # Households | % Households |
| Less than $10,000 | 356 | 9.2% |
| $10,000 to $14,999 | 290 | 7.5% |
| $15,000 to $24,999 | 426 | 11.0% |
| $25,000 to $34,999 | 414 | 10.7% |
| $35,000 to $49,999 | 588 | 15.2% |
| $50,000 to $74,999 | 689 | 17.8% |
| $75,000 to $99,999 | 395 | 10.2% |
| $100,000 to $149,999 | 445 | 11.5% |
| $150,000 to $199,999 | 170 | 4.4% |
| $200,000+ | 97 | 2.5% |
Household Income by Householder Age in Okfuskee County
The median household income in Okfuskee County is $45,429, with the highest median household income of $50,917 found in the 25 to 44 years age bracket for the primary householder. A total of 1,169 households (30.2%) fall into this category. Meanwhile, the 15 to 24 years age bracket for the primary householder has the lowest median household income of $0, with 142 households (3.7%) in this group.
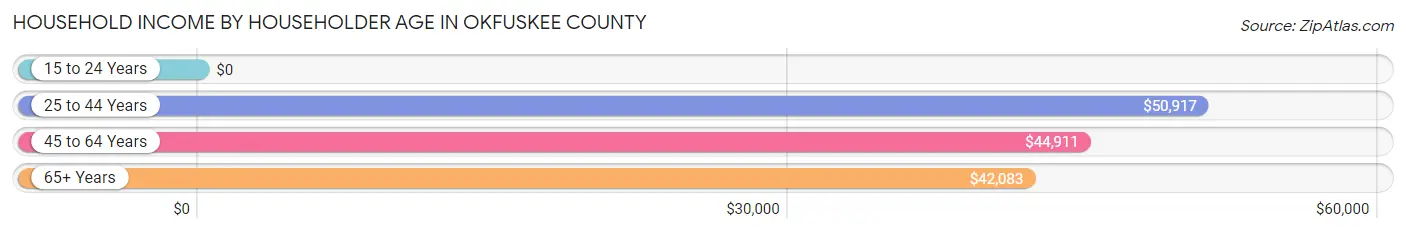
| Income Bracket | # Households | Median Income |
| 15 to 24 Years | 142 (3.7%) | $0 |
| 25 to 44 Years | 1,169 (30.2%) | $50,917 |
| 45 to 64 Years | 1,405 (36.3%) | $44,911 |
| 65+ Years | 1,155 (29.8%) | $42,083 |
| Total | 3,871 (100.0%) | $45,429 |
Poverty in Okfuskee County
Income Below Poverty by Sex and Age in Okfuskee County
With 26.0% poverty level for males and 27.4% for females among the residents of Okfuskee County, 5 year old males and 5 year old females are the most vulnerable to poverty, with 34 males (50.0%) and 45 females (54.2%) in their respective age groups living below the poverty level.
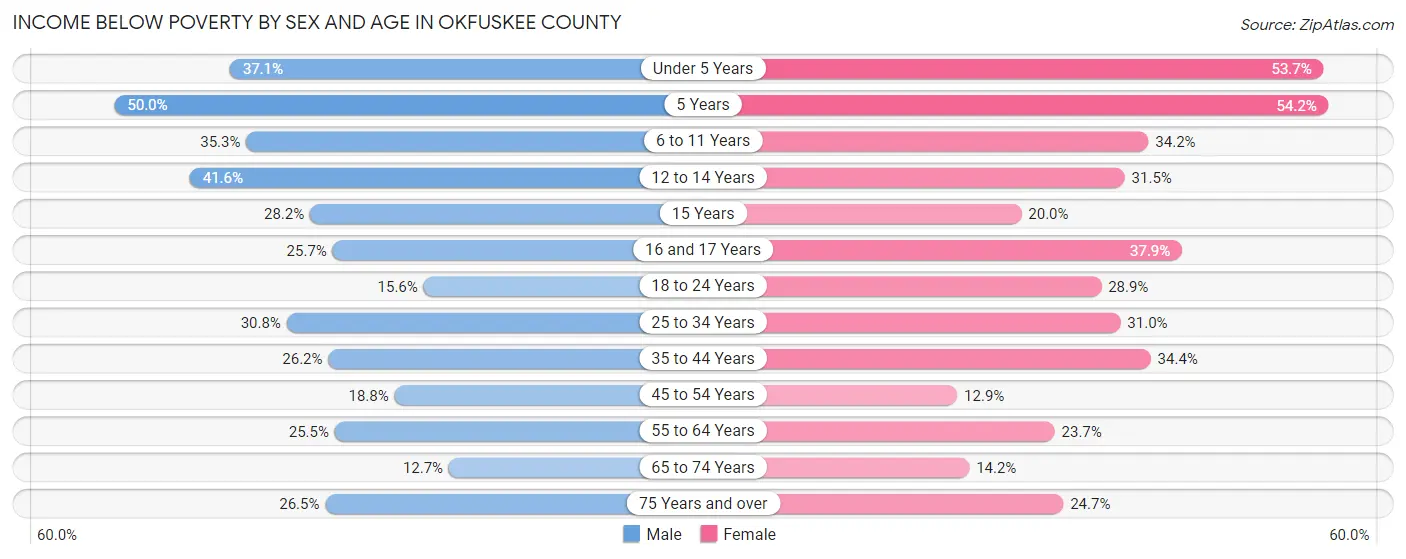
| Age Bracket | Male | Female |
| Under 5 Years | 117 (37.1%) | 147 (53.6%) |
| 5 Years | 34 (50.0%) | 45 (54.2%) |
| 6 to 11 Years | 161 (35.3%) | 140 (34.2%) |
| 12 to 14 Years | 104 (41.6%) | 63 (31.5%) |
| 15 Years | 22 (28.2%) | 15 (20.0%) |
| 16 and 17 Years | 37 (25.7%) | 47 (37.9%) |
| 18 to 24 Years | 75 (15.6%) | 117 (28.9%) |
| 25 to 34 Years | 216 (30.8%) | 180 (31.0%) |
| 35 to 44 Years | 129 (26.2%) | 193 (34.4%) |
| 45 to 54 Years | 141 (18.8%) | 79 (12.9%) |
| 55 to 64 Years | 183 (25.5%) | 155 (23.7%) |
| 65 to 74 Years | 60 (12.7%) | 84 (14.2%) |
| 75 Years and over | 92 (26.5%) | 110 (24.7%) |
| Total | 1,371 (26.0%) | 1,375 (27.4%) |
Income Above Poverty by Sex and Age in Okfuskee County
According to the poverty statistics in Okfuskee County, males aged 65 to 74 years and females aged 45 to 54 years are the age groups that are most secure financially, with 87.3% of males and 87.2% of females in these age groups living above the poverty line.
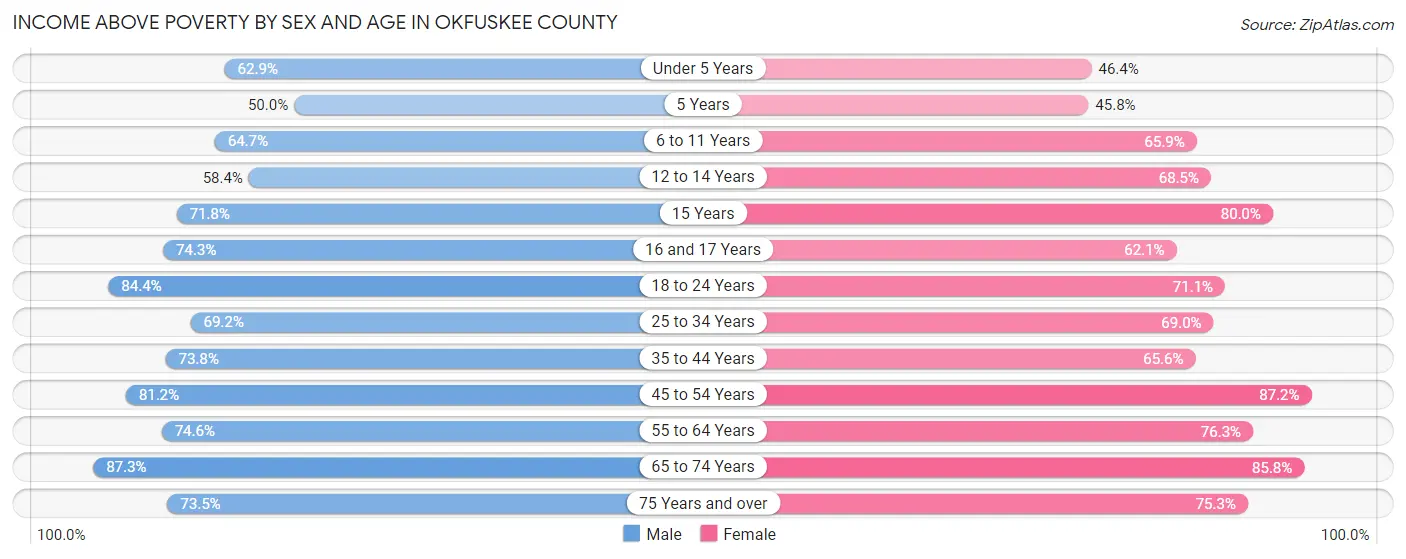
| Age Bracket | Male | Female |
| Under 5 Years | 198 (62.9%) | 127 (46.4%) |
| 5 Years | 34 (50.0%) | 38 (45.8%) |
| 6 to 11 Years | 295 (64.7%) | 270 (65.8%) |
| 12 to 14 Years | 146 (58.4%) | 137 (68.5%) |
| 15 Years | 56 (71.8%) | 60 (80.0%) |
| 16 and 17 Years | 107 (74.3%) | 77 (62.1%) |
| 18 to 24 Years | 407 (84.4%) | 288 (71.1%) |
| 25 to 34 Years | 485 (69.2%) | 400 (69.0%) |
| 35 to 44 Years | 364 (73.8%) | 368 (65.6%) |
| 45 to 54 Years | 609 (81.2%) | 536 (87.2%) |
| 55 to 64 Years | 536 (74.6%) | 499 (76.3%) |
| 65 to 74 Years | 411 (87.3%) | 508 (85.8%) |
| 75 Years and over | 255 (73.5%) | 336 (75.3%) |
| Total | 3,903 (74.0%) | 3,644 (72.6%) |
Income Below Poverty Among Married-Couple Families in Okfuskee County
The poverty statistics for married-couple families in Okfuskee County show that 11.1% or 207 of the total 1,859 families live below the poverty line. Families with 5 or more children have the highest poverty rate of 80.8%, comprising of 42 families. On the other hand, families with no children have the lowest poverty rate of 8.8%, which includes 95 families.
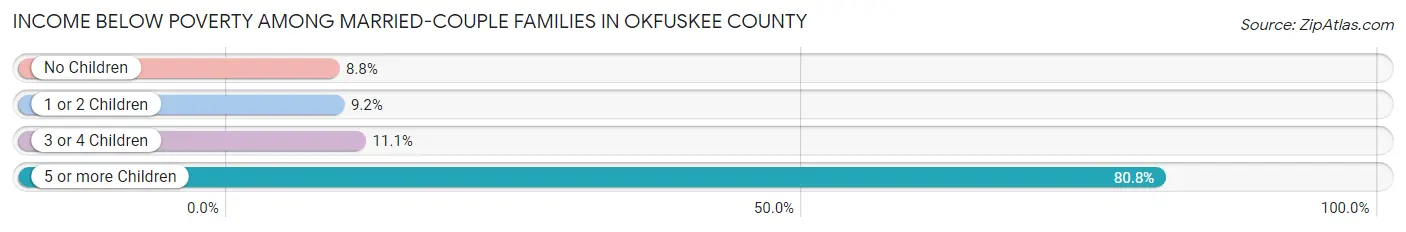
| Children | Above Poverty | Below Poverty |
| No Children | 986 (91.2%) | 95 (8.8%) |
| 1 or 2 Children | 512 (90.8%) | 52 (9.2%) |
| 3 or 4 Children | 144 (88.9%) | 18 (11.1%) |
| 5 or more Children | 10 (19.2%) | 42 (80.8%) |
| Total | 1,652 (88.9%) | 207 (11.1%) |
Income Below Poverty Among Single-Parent Households in Okfuskee County
According to the poverty data in Okfuskee County, 40.1% or 89 single-father households and 43.6% or 282 single-mother households are living below the poverty line. Among single-father households, those with 1 or 2 children have the highest poverty rate, with 61 households (51.7%) experiencing poverty. Likewise, among single-mother households, those with 3 or 4 children have the highest poverty rate, with 80 households (61.5%) falling below the poverty line.
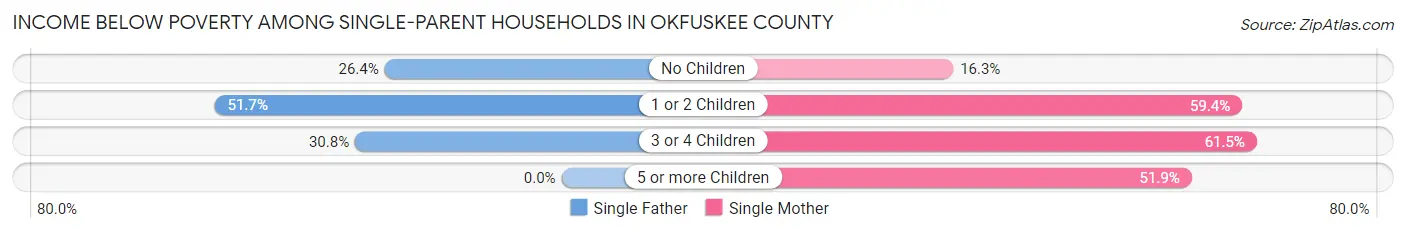
| Children | Single Father | Single Mother |
| No Children | 24 (26.4%) | 39 (16.3%) |
| 1 or 2 Children | 61 (51.7%) | 149 (59.4%) |
| 3 or 4 Children | 4 (30.8%) | 80 (61.5%) |
| 5 or more Children | 0 (0.0%) | 14 (51.8%) |
| Total | 89 (40.1%) | 282 (43.6%) |
Income Below Poverty Among Married-Couple vs Single-Parent Households in Okfuskee County
The poverty data for Okfuskee County shows that 207 of the married-couple family households (11.1%) and 371 of the single-parent households (42.7%) are living below the poverty level. Within the married-couple family households, those with 5 or more children have the highest poverty rate, with 42 households (80.8%) falling below the poverty line. Among the single-parent households, those with 3 or 4 children have the highest poverty rate, with 84 household (58.7%) living below poverty.
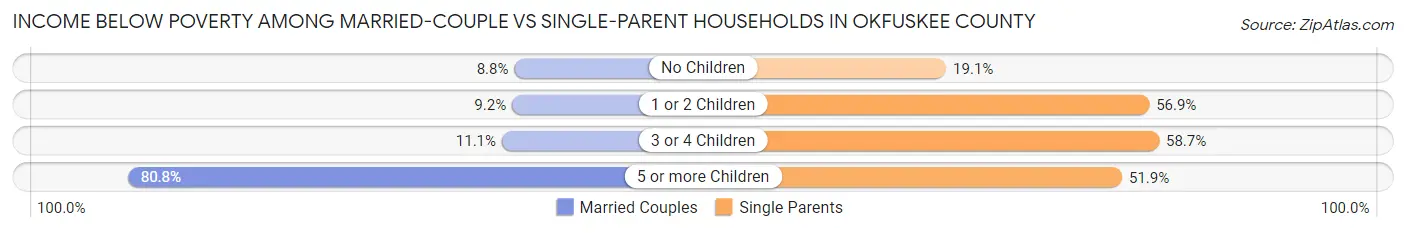
| Children | Married-Couple Families | Single-Parent Households |
| No Children | 95 (8.8%) | 63 (19.1%) |
| 1 or 2 Children | 52 (9.2%) | 210 (56.9%) |
| 3 or 4 Children | 18 (11.1%) | 84 (58.7%) |
| 5 or more Children | 42 (80.8%) | 14 (51.8%) |
| Total | 207 (11.1%) | 371 (42.7%) |
Race in Okfuskee County
The most populous races in Okfuskee County are White / Caucasian (7,035 | 62.0%), Native / Alaskan (1,820 | 16.0%), and Two or more Races (1,622 | 14.3%).
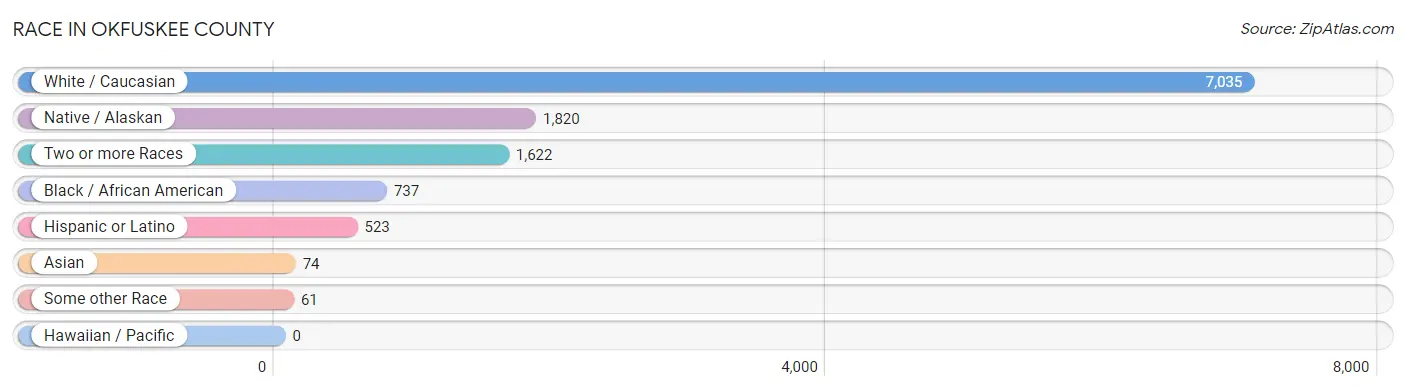
| Race | # Population | % Population |
| Asian | 74 | 0.6% |
| Black / African American | 737 | 6.5% |
| Hawaiian / Pacific | 0 | 0.0% |
| Hispanic or Latino | 523 | 4.6% |
| Native / Alaskan | 1,820 | 16.0% |
| White / Caucasian | 7,035 | 62.0% |
| Two or more Races | 1,622 | 14.3% |
| Some other Race | 61 | 0.5% |
| Total | 11,349 | 100.0% |
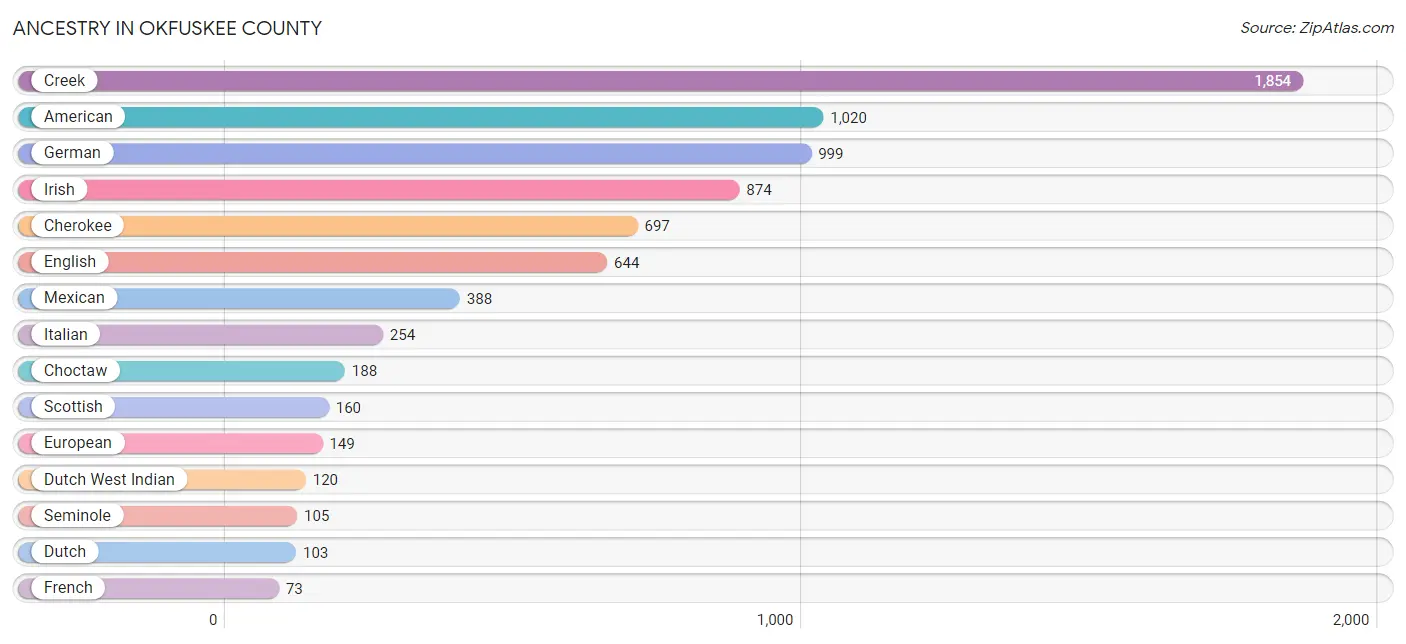
Ancestry in Okfuskee County
The most populous ancestries reported in Okfuskee County are Creek (1,854 | 16.3%), American (1,020 | 9.0%), German (999 | 8.8%), Irish (874 | 7.7%), and Cherokee (697 | 6.1%), together accounting for 48.0% of all Okfuskee County residents.
| Ancestry | # Population | % Population |
| African | 28 | 0.3% |
| Aleut | 19 | 0.2% |
| American | 1,020 | 9.0% |
| Apache | 27 | 0.2% |
| Arapaho | 14 | 0.1% |
| Armenian | 6 | 0.1% |
| Belgian | 16 | 0.1% |
| Belizean | 1 | 0.0% |
| Bhutanese | 25 | 0.2% |
| Blackfeet | 15 | 0.1% |
| British | 17 | 0.2% |
| Cajun | 3 | 0.0% |
| Cambodian | 20 | 0.2% |
| Canadian | 19 | 0.2% |
| Cherokee | 697 | 6.1% |
| Cheyenne | 6 | 0.1% |
| Chickasaw | 71 | 0.6% |
| Choctaw | 188 | 1.7% |
| Creek | 1,854 | 16.3% |
| Crow | 11 | 0.1% |
| Cuban | 6 | 0.1% |
| Czech | 48 | 0.4% |
| Czechoslovakian | 1 | 0.0% |
| Danish | 5 | 0.0% |
| Delaware | 7 | 0.1% |
| Dutch | 103 | 0.9% |
| Dutch West Indian | 120 | 1.1% |
| Eastern European | 9 | 0.1% |
| English | 644 | 5.7% |
| European | 149 | 1.3% |
| French | 73 | 0.6% |
| German | 999 | 8.8% |
| Greek | 3 | 0.0% |
| Hungarian | 8 | 0.1% |
| Indian (Asian) | 33 | 0.3% |
| Iranian | 3 | 0.0% |
| Irish | 874 | 7.7% |
| Iroquois | 5 | 0.0% |
| Italian | 254 | 2.2% |
| Jamaican | 5 | 0.0% |
| Kiowa | 4 | 0.0% |
| Luxembourger | 4 | 0.0% |
| Malaysian | 30 | 0.3% |
| Mexican | 388 | 3.4% |
| Mexican American Indian | 21 | 0.2% |
| Native Hawaiian | 13 | 0.1% |
| Nigerian | 3 | 0.0% |
| Northern European | 14 | 0.1% |
| Norwegian | 9 | 0.1% |
| Osage | 2 | 0.0% |
| Paiute | 1 | 0.0% |
| Pennsylvania German | 13 | 0.1% |
| Peruvian | 7 | 0.1% |
| Polish | 29 | 0.3% |
| Portuguese | 4 | 0.0% |
| Potawatomi | 5 | 0.0% |
| Puerto Rican | 43 | 0.4% |
| Russian | 42 | 0.4% |
| Scandinavian | 11 | 0.1% |
| Scotch-Irish | 42 | 0.4% |
| Scottish | 160 | 1.4% |
| Seminole | 105 | 0.9% |
| Slovak | 1 | 0.0% |
| South African | 4 | 0.0% |
| South American | 7 | 0.1% |
| Spaniard | 37 | 0.3% |
| Spanish | 16 | 0.1% |
| Sri Lankan | 8 | 0.1% |
| Subsaharan African | 35 | 0.3% |
| Swedish | 20 | 0.2% |
| Swiss | 40 | 0.4% |
| Welsh | 47 | 0.4% |
| Yugoslavian | 1 | 0.0% | View All 73 Rows |
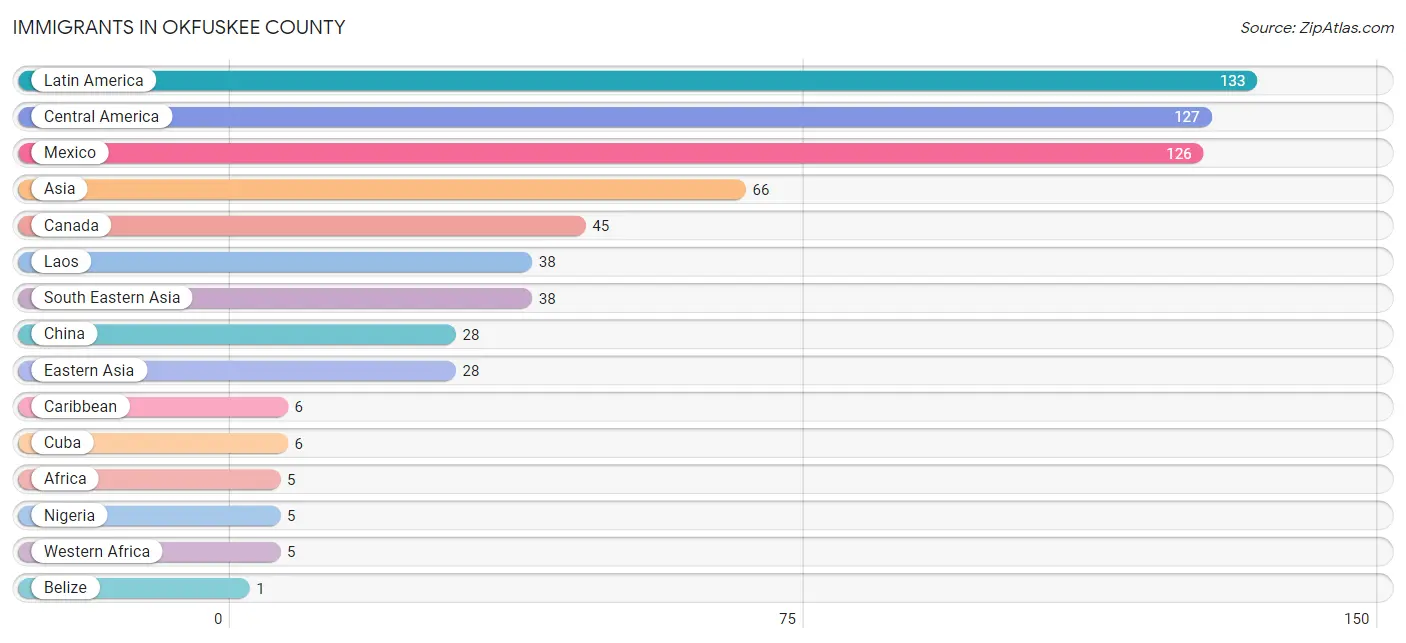
Immigrants in Okfuskee County
The most numerous immigrant groups reported in Okfuskee County came from Latin America (133 | 1.2%), Central America (127 | 1.1%), Mexico (126 | 1.1%), Asia (66 | 0.6%), and Canada (45 | 0.4%), together accounting for 4.4% of all Okfuskee County residents.
| Immigration Origin | # Population | % Population |
| Africa | 5 | 0.0% |
| Asia | 66 | 0.6% |
| Belize | 1 | 0.0% |
| Canada | 45 | 0.4% |
| Caribbean | 6 | 0.1% |
| Central America | 127 | 1.1% |
| China | 28 | 0.3% |
| Cuba | 6 | 0.1% |
| Eastern Asia | 28 | 0.3% |
| Eastern Europe | 1 | 0.0% |
| Europe | 1 | 0.0% |
| Laos | 38 | 0.3% |
| Latin America | 133 | 1.2% |
| Mexico | 126 | 1.1% |
| Nigeria | 5 | 0.0% |
| Russia | 1 | 0.0% |
| South Eastern Asia | 38 | 0.3% |
| Western Africa | 5 | 0.0% | View All 18 Rows |
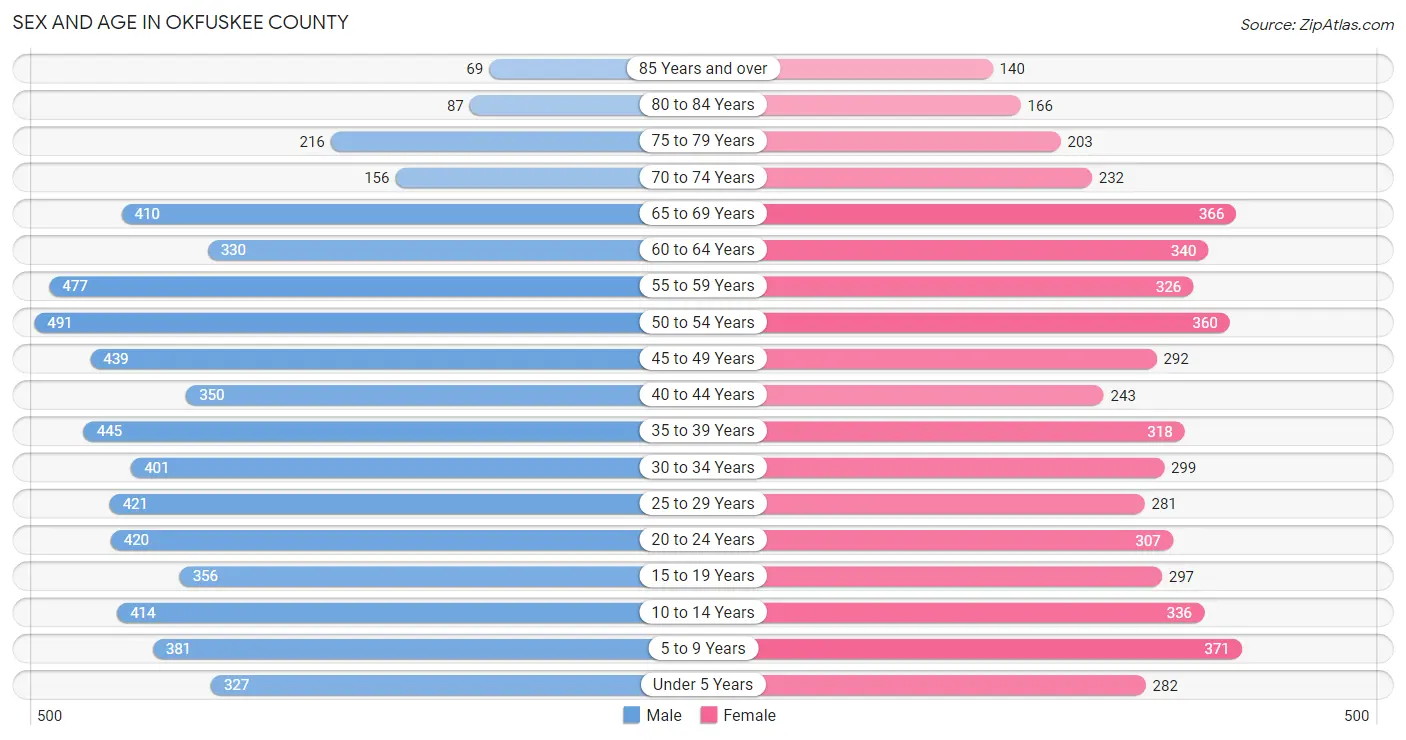
Sex and Age in Okfuskee County
Sex and Age in Okfuskee County
The most populous age groups in Okfuskee County are 50 to 54 Years (491 | 7.9%) for men and 5 to 9 Years (371 | 7.2%) for women.
| Age Bracket | Male | Female |
| Under 5 Years | 327 (5.3%) | 282 (5.5%) |
| 5 to 9 Years | 381 (6.2%) | 371 (7.2%) |
| 10 to 14 Years | 414 (6.7%) | 336 (6.5%) |
| 15 to 19 Years | 356 (5.8%) | 297 (5.8%) |
| 20 to 24 Years | 420 (6.8%) | 307 (5.9%) |
| 25 to 29 Years | 421 (6.8%) | 281 (5.4%) |
| 30 to 34 Years | 401 (6.5%) | 299 (5.8%) |
| 35 to 39 Years | 445 (7.2%) | 318 (6.2%) |
| 40 to 44 Years | 350 (5.7%) | 243 (4.7%) |
| 45 to 49 Years | 439 (7.1%) | 292 (5.7%) |
| 50 to 54 Years | 491 (7.9%) | 360 (7.0%) |
| 55 to 59 Years | 477 (7.7%) | 326 (6.3%) |
| 60 to 64 Years | 330 (5.3%) | 340 (6.6%) |
| 65 to 69 Years | 410 (6.6%) | 366 (7.1%) |
| 70 to 74 Years | 156 (2.5%) | 232 (4.5%) |
| 75 to 79 Years | 216 (3.5%) | 203 (3.9%) |
| 80 to 84 Years | 87 (1.4%) | 166 (3.2%) |
| 85 Years and over | 69 (1.1%) | 140 (2.7%) |
| Total | 6,190 (100.0%) | 5,159 (100.0%) |
Families and Households in Okfuskee County
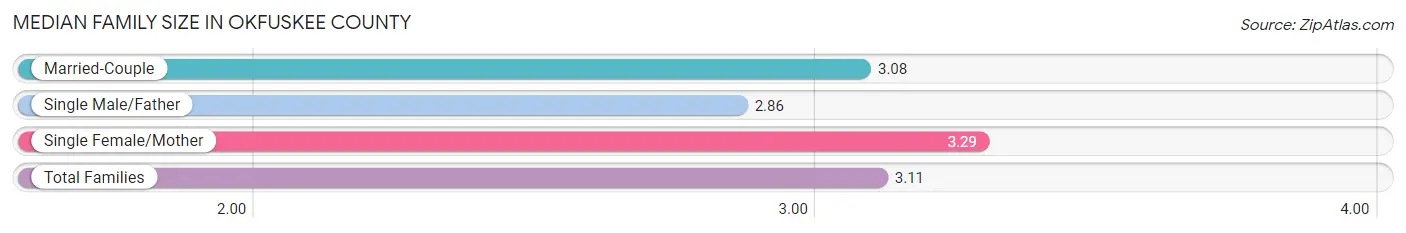
Median Family Size in Okfuskee County
The median family size in Okfuskee County is 3.11 persons per family, with single female/mother families (647 | 23.7%) accounting for the largest median family size of 3.29 persons per family. On the other hand, single male/father families (222 | 8.1%) represent the smallest median family size with 2.86 persons per family.
| Family Type | # Families | Family Size |
| Married-Couple | 1,859 (68.1%) | 3.08 |
| Single Male/Father | 222 (8.1%) | 2.86 |
| Single Female/Mother | 647 (23.7%) | 3.29 |
| Total Families | 2,728 (100.0%) | 3.11 |
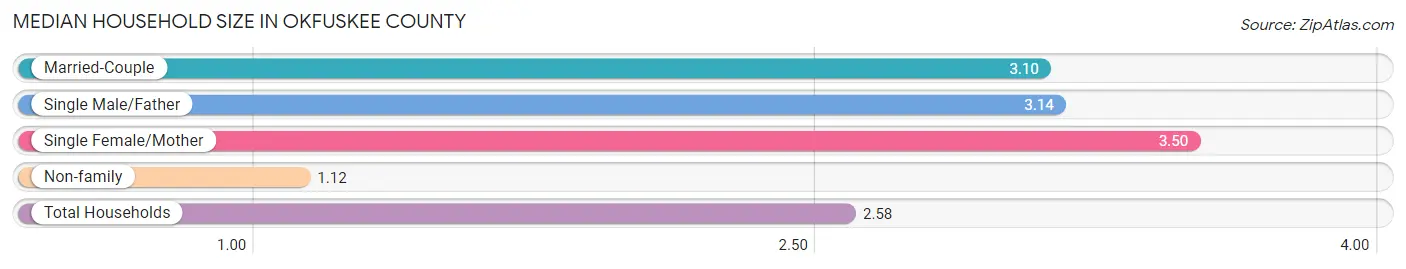
Median Household Size in Okfuskee County
The median household size in Okfuskee County is 2.58 persons per household, with single female/mother households (647 | 16.7%) accounting for the largest median household size of 3.5 persons per household. non-family households (1,143 | 29.5%) represent the smallest median household size with 1.12 persons per household.
| Household Type | # Households | Household Size |
| Married-Couple | 1,859 (48.0%) | 3.10 |
| Single Male/Father | 222 (5.7%) | 3.14 |
| Single Female/Mother | 647 (16.7%) | 3.50 |
| Non-family | 1,143 (29.5%) | 1.12 |
| Total Households | 3,871 (100.0%) | 2.58 |
Household Size by Marriage Status in Okfuskee County
Out of a total of 3,871 households in Okfuskee County, 2,728 (70.5%) are family households, while 1,143 (29.5%) are nonfamily households. The most numerous type of family households are 2-person households, comprising 1,239, and the most common type of nonfamily households are 1-person households, comprising 1,034.
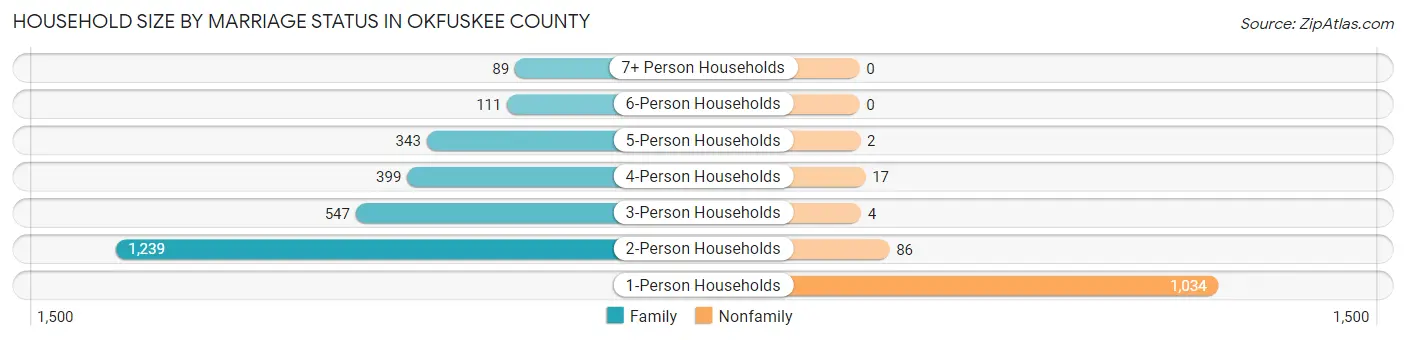
| Household Size | Family Households | Nonfamily Households |
| 1-Person Households | - | 1,034 (26.7%) |
| 2-Person Households | 1,239 (32.0%) | 86 (2.2%) |
| 3-Person Households | 547 (14.1%) | 4 (0.1%) |
| 4-Person Households | 399 (10.3%) | 17 (0.4%) |
| 5-Person Households | 343 (8.9%) | 2 (0.1%) |
| 6-Person Households | 111 (2.9%) | 0 (0.0%) |
| 7+ Person Households | 89 (2.3%) | 0 (0.0%) |
| Total | 2,728 (70.5%) | 1,143 (29.5%) |
Female Fertility in Okfuskee County
Fertility by Age in Okfuskee County
Average fertility rate in Okfuskee County is 52.0 births per 1,000 women. Women in the age bracket of 20 to 34 years have the highest fertility rate with 114.0 births per 1,000 women. Women in the age bracket of 20 to 34 years acount for 94.4% of all women with births.
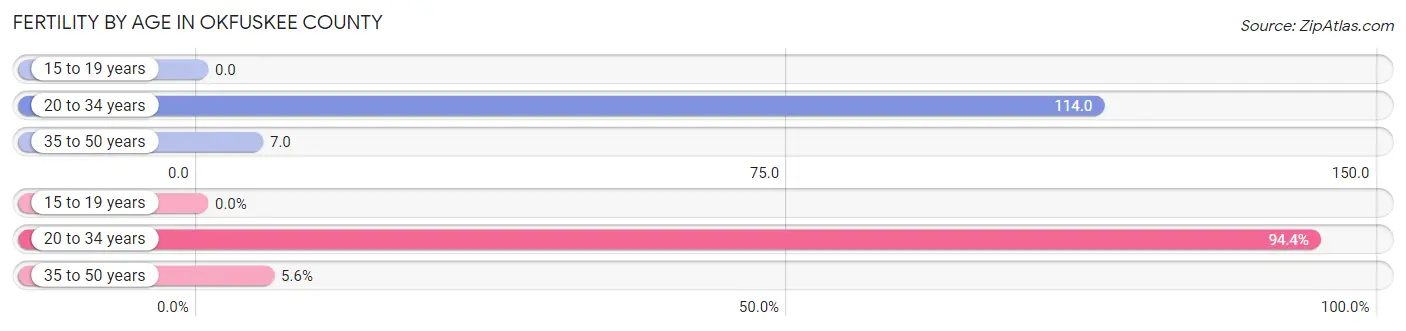
| Age Bracket | Women with Births | Births / 1,000 Women |
| 15 to 19 years | 0 (0.0%) | 0.0 |
| 20 to 34 years | 101 (94.4%) | 114.0 |
| 35 to 50 years | 6 (5.6%) | 7.0 |
| Total | 107 (100.0%) | 52.0 |
Fertility by Age by Marriage Status in Okfuskee County
48.6% of women with births (107) in Okfuskee County are married. The highest percentage of unmarried women with births falls into 35 to 50 years age bracket with 66.7% of them unmarried at the time of birth, while the lowest percentage of unmarried women with births belong to 20 to 34 years age bracket with 50.5% of them unmarried.
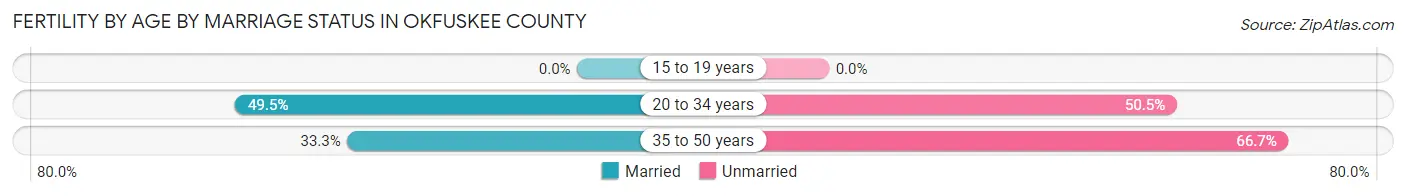
| Age Bracket | Married | Unmarried |
| 15 to 19 years | 0 (0.0%) | 0 (0.0%) |
| 20 to 34 years | 50 (49.5%) | 51 (50.5%) |
| 35 to 50 years | 2 (33.3%) | 4 (66.7%) |
| Total | 52 (48.6%) | 55 (51.4%) |
Fertility by Education in Okfuskee County
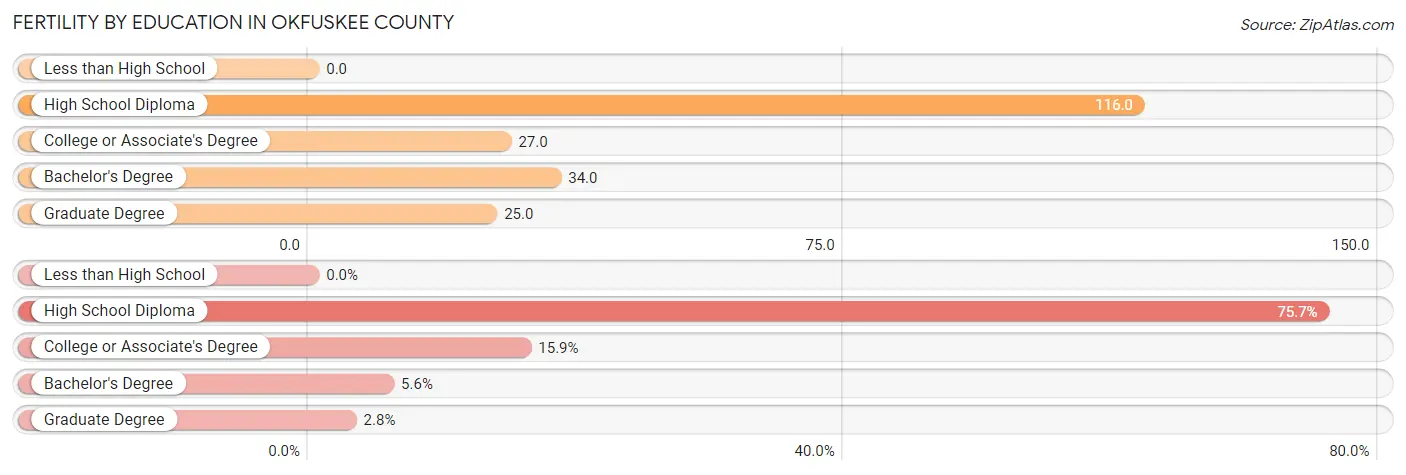
| Educational Attainment | Women with Births | Births / 1,000 Women |
| Less than High School | 0 (0.0%) | 0.0 |
| High School Diploma | 81 (75.7%) | 116.0 |
| College or Associate's Degree | 17 (15.9%) | 27.0 |
| Bachelor's Degree | 6 (5.6%) | 34.0 |
| Graduate Degree | 3 (2.8%) | 25.0 |
| Total | 107 (100.0%) | 52.0 |
Fertility by Education by Marriage Status in Okfuskee County
51.4% of women with births in Okfuskee County are unmarried. Women with the educational attainment of bachelor's degree are most likely to be married with 100.0% of them married at childbirth, while women with the educational attainment of high school diploma are least likely to be married with 60.5% of them unmarried at childbirth.
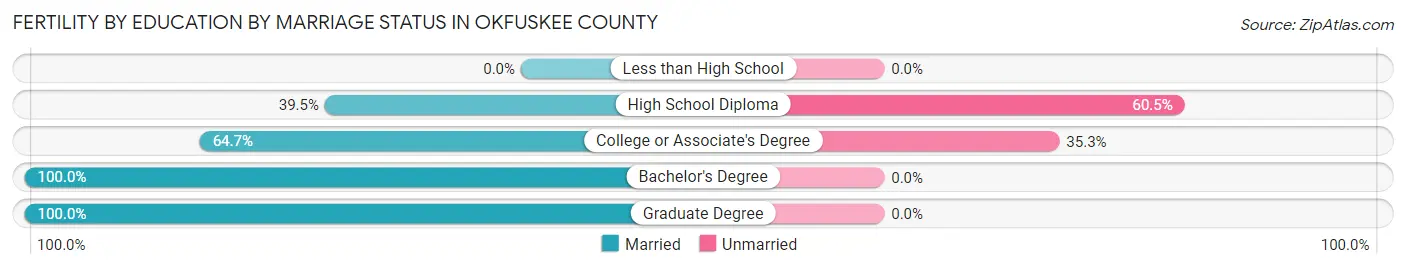
| Educational Attainment | Married | Unmarried |
| Less than High School | 0 (0.0%) | 0 (0.0%) |
| High School Diploma | 32 (39.5%) | 49 (60.5%) |
| College or Associate's Degree | 11 (64.7%) | 6 (35.3%) |
| Bachelor's Degree | 6 (100.0%) | 0 (0.0%) |
| Graduate Degree | 3 (100.0%) | 0 (0.0%) |
| Total | 52 (48.6%) | 55 (51.4%) |
Employment Characteristics in Okfuskee County
Employment by Class of Employer in Okfuskee County
Among the 3,780 employed individuals in Okfuskee County, private company employees (2,323 | 61.5%), state government employees (351 | 9.3%), and local government employees (280 | 7.4%) make up the most common classes of employment.
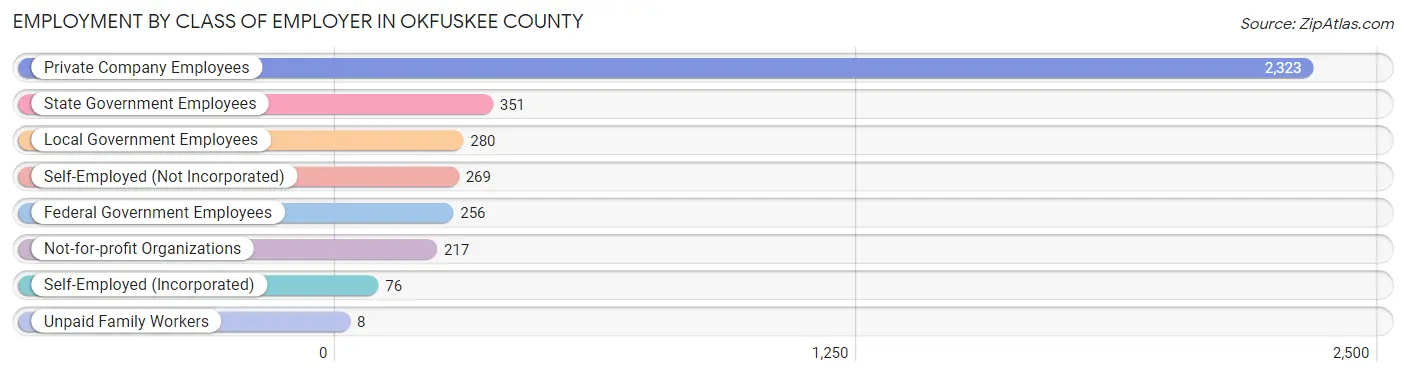
| Employer Class | # Employees | % Employees |
| Private Company Employees | 2,323 | 61.5% |
| Self-Employed (Incorporated) | 76 | 2.0% |
| Self-Employed (Not Incorporated) | 269 | 7.1% |
| Not-for-profit Organizations | 217 | 5.7% |
| Local Government Employees | 280 | 7.4% |
| State Government Employees | 351 | 9.3% |
| Federal Government Employees | 256 | 6.8% |
| Unpaid Family Workers | 8 | 0.2% |
| Total | 3,780 | 100.0% |
Employment Status by Age in Okfuskee County
According to the labor force statistics for Okfuskee County, out of the total population over 16 years of age (9,085), 44.3% or 4,025 individuals are in the labor force, with 3.5% or 141 of them unemployed. The age group with the highest labor force participation rate is 30 to 34 years, with 65.3% or 457 individuals in the labor force. Within the labor force, the 16 to 19 years age range has the highest percentage of unemployed individuals, with 12.8% or 22 of them being unemployed.

| Age Bracket | In Labor Force | Unemployed |
| 16 to 19 Years | 172 (34.4%) | 22 (12.8%) |
| 20 to 24 Years | 418 (57.5%) | 0 (0.0%) |
| 25 to 29 Years | 447 (63.7%) | 33 (7.4%) |
| 30 to 34 Years | 457 (65.3%) | 6 (1.3%) |
| 35 to 44 Years | 694 (51.2%) | 25 (3.6%) |
| 45 to 54 Years | 956 (60.4%) | 33 (3.5%) |
| 55 to 59 Years | 384 (47.8%) | 9 (2.3%) |
| 60 to 64 Years | 282 (42.1%) | 6 (2.1%) |
| 65 to 74 Years | 187 (16.1%) | 5 (2.7%) |
| 75 Years and over | 27 (3.1%) | 0 (0.0%) |
| Total | 4,025 (44.3%) | 141 (3.5%) |
Employment Status by Educational Attainment in Okfuskee County
According to labor force statistics for Okfuskee County, 55.4% of individuals (3,220) out of the total population between 25 and 64 years of age (5,813) are in the labor force, with 3.5% or 113 of them being unemployed. The group with the highest labor force participation rate are those with the educational attainment of bachelor's degree or higher, with 88.3% or 621 individuals in the labor force. Within the labor force, individuals with less than high school education have the highest percentage of unemployment, with 10.8% or 31 of them being unemployed.
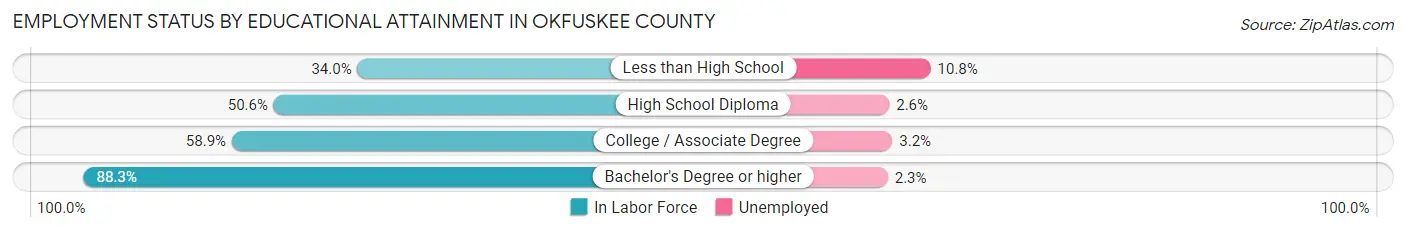
| Educational Attainment | In Labor Force | Unemployed |
| Less than High School | 288 (34.0%) | 91 (10.8%) |
| High School Diploma | 1,227 (50.6%) | 63 (2.6%) |
| College / Associate Degree | 1,083 (58.9%) | 59 (3.2%) |
| Bachelor's Degree or higher | 621 (88.3%) | 16 (2.3%) |
| Total | 3,220 (55.4%) | 203 (3.5%) |
Employment Occupations by Sex in Okfuskee County
Management, Business, Science and Arts Occupations
The most common Management, Business, Science and Arts occupations in Okfuskee County are Community & Social Service (438 | 11.3%), Management (320 | 8.3%), Education Instruction & Library (293 | 7.5%), Health Diagnosing & Treating (212 | 5.5%), and Health Technologists (114 | 2.9%).
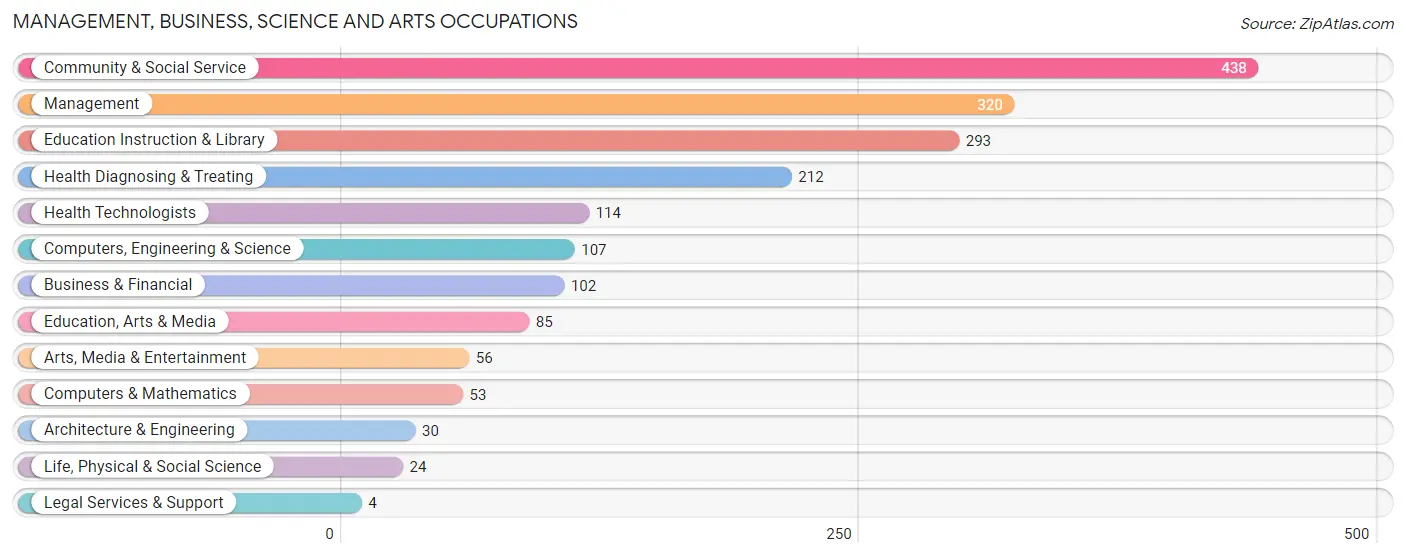
Management, Business, Science and Arts Occupations by Sex
Within the Management, Business, Science and Arts occupations in Okfuskee County, the most male-oriented occupations are Architecture & Engineering (100.0%), Computers & Mathematics (88.7%), and Computers, Engineering & Science (81.3%), while the most female-oriented occupations are Legal Services & Support (100.0%), Arts, Media & Entertainment (91.1%), and Health Diagnosing & Treating (83.5%).
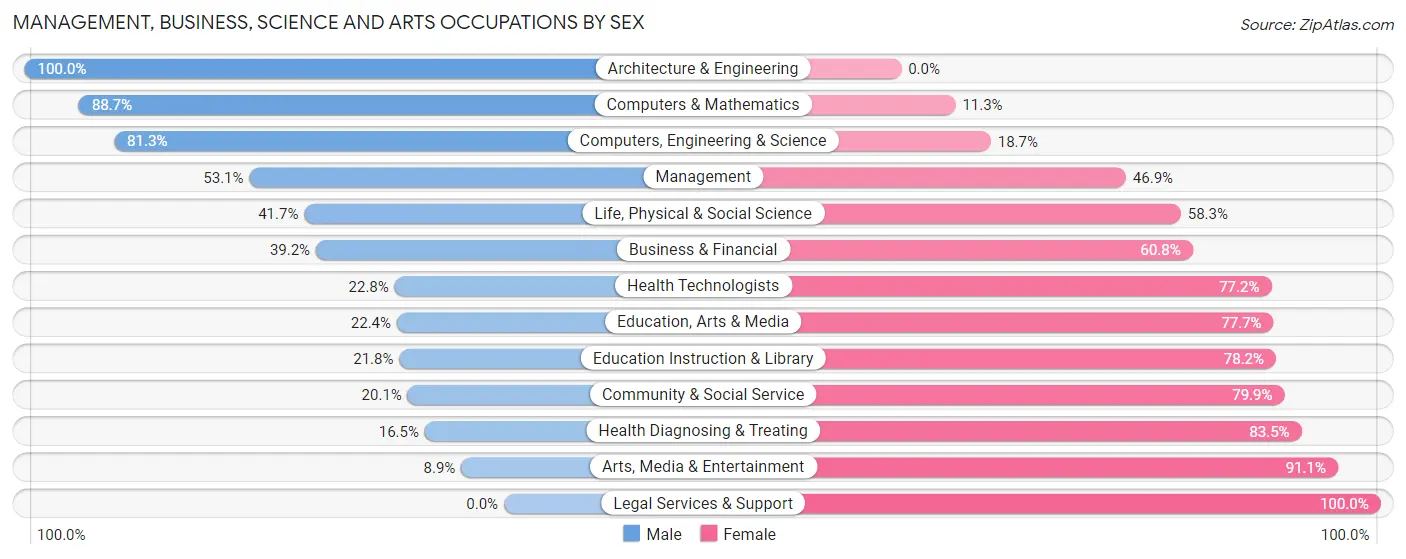
| Occupation | Male | Female |
| Management | 170 (53.1%) | 150 (46.9%) |
| Business & Financial | 40 (39.2%) | 62 (60.8%) |
| Computers, Engineering & Science | 87 (81.3%) | 20 (18.7%) |
| Computers & Mathematics | 47 (88.7%) | 6 (11.3%) |
| Architecture & Engineering | 30 (100.0%) | 0 (0.0%) |
| Life, Physical & Social Science | 10 (41.7%) | 14 (58.3%) |
| Community & Social Service | 88 (20.1%) | 350 (79.9%) |
| Education, Arts & Media | 19 (22.4%) | 66 (77.6%) |
| Legal Services & Support | 0 (0.0%) | 4 (100.0%) |
| Education Instruction & Library | 64 (21.8%) | 229 (78.2%) |
| Arts, Media & Entertainment | 5 (8.9%) | 51 (91.1%) |
| Health Diagnosing & Treating | 35 (16.5%) | 177 (83.5%) |
| Health Technologists | 26 (22.8%) | 88 (77.2%) |
| Total (Category) | 420 (35.6%) | 759 (64.4%) |
| Total (Overall) | 2,039 (52.6%) | 1,840 (47.4%) |
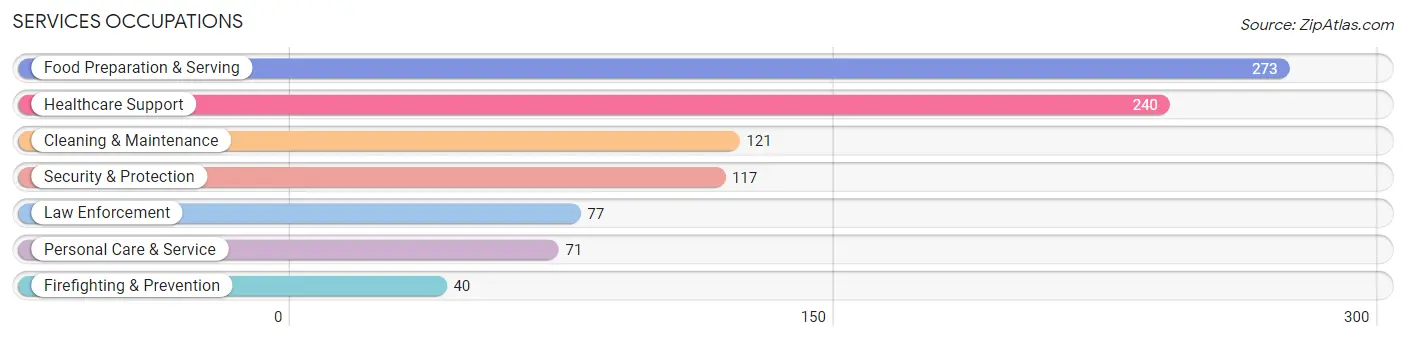
Services Occupations
The most common Services occupations in Okfuskee County are Food Preparation & Serving (273 | 7.0%), Healthcare Support (240 | 6.2%), Cleaning & Maintenance (121 | 3.1%), Security & Protection (117 | 3.0%), and Law Enforcement (77 | 2.0%).
Services Occupations by Sex
Within the Services occupations in Okfuskee County, the most male-oriented occupations are Firefighting & Prevention (100.0%), Security & Protection (94.9%), and Law Enforcement (92.2%), while the most female-oriented occupations are Healthcare Support (79.6%), Personal Care & Service (73.2%), and Food Preparation & Serving (44.3%).
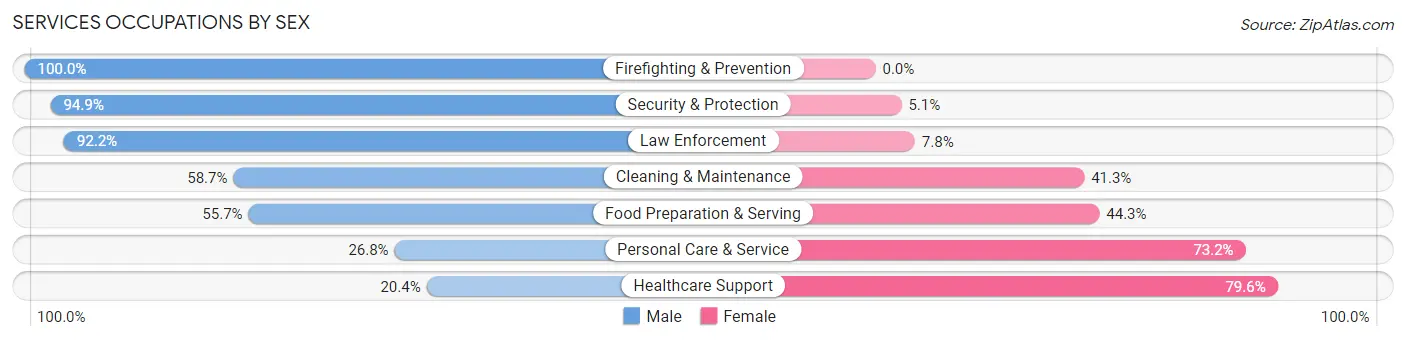
| Occupation | Male | Female |
| Healthcare Support | 49 (20.4%) | 191 (79.6%) |
| Security & Protection | 111 (94.9%) | 6 (5.1%) |
| Firefighting & Prevention | 40 (100.0%) | 0 (0.0%) |
| Law Enforcement | 71 (92.2%) | 6 (7.8%) |
| Food Preparation & Serving | 152 (55.7%) | 121 (44.3%) |
| Cleaning & Maintenance | 71 (58.7%) | 50 (41.3%) |
| Personal Care & Service | 19 (26.8%) | 52 (73.2%) |
| Total (Category) | 402 (48.9%) | 420 (51.1%) |
| Total (Overall) | 2,039 (52.6%) | 1,840 (47.4%) |
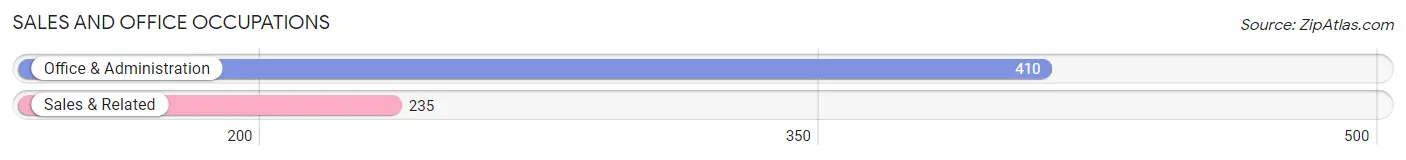
Sales and Office Occupations
The most common Sales and Office occupations in Okfuskee County are Office & Administration (410 | 10.6%), and Sales & Related (235 | 6.1%).
Sales and Office Occupations by Sex

| Occupation | Male | Female |
| Sales & Related | 65 (27.7%) | 170 (72.3%) |
| Office & Administration | 62 (15.1%) | 348 (84.9%) |
| Total (Category) | 127 (19.7%) | 518 (80.3%) |
| Total (Overall) | 2,039 (52.6%) | 1,840 (47.4%) |
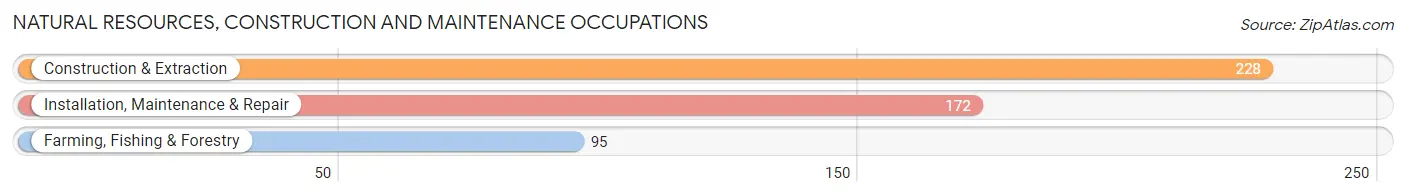
Natural Resources, Construction and Maintenance Occupations
The most common Natural Resources, Construction and Maintenance occupations in Okfuskee County are Construction & Extraction (228 | 5.9%), Installation, Maintenance & Repair (172 | 4.4%), and Farming, Fishing & Forestry (95 | 2.5%).
Natural Resources, Construction and Maintenance Occupations by Sex
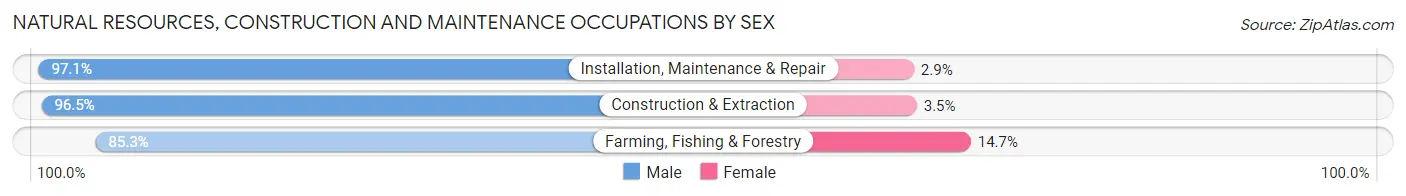
| Occupation | Male | Female |
| Farming, Fishing & Forestry | 81 (85.3%) | 14 (14.7%) |
| Construction & Extraction | 220 (96.5%) | 8 (3.5%) |
| Installation, Maintenance & Repair | 167 (97.1%) | 5 (2.9%) |
| Total (Category) | 468 (94.6%) | 27 (5.4%) |
| Total (Overall) | 2,039 (52.6%) | 1,840 (47.4%) |
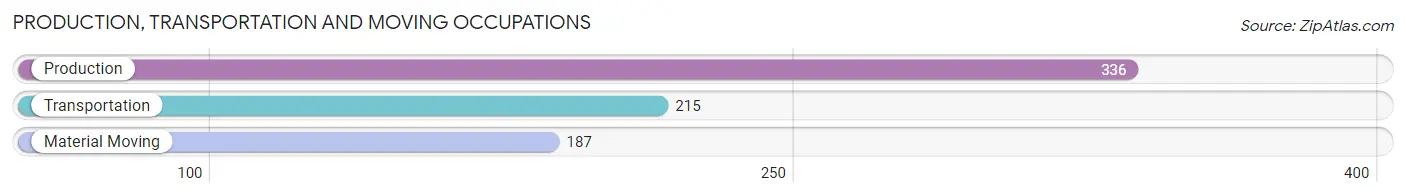
Production, Transportation and Moving Occupations
The most common Production, Transportation and Moving occupations in Okfuskee County are Production (336 | 8.7%), Transportation (215 | 5.5%), and Material Moving (187 | 4.8%).
Production, Transportation and Moving Occupations by Sex
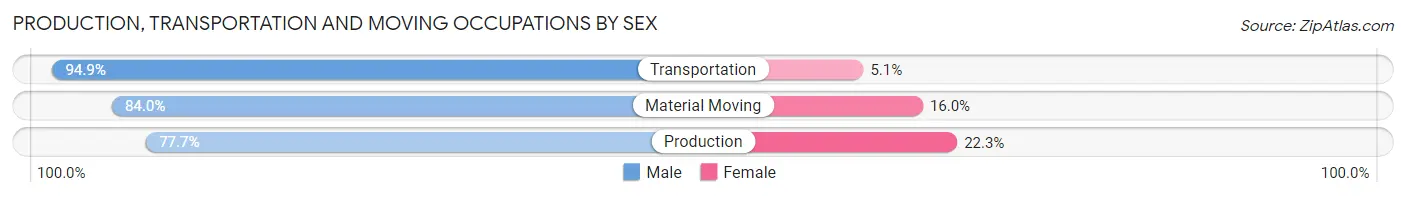
| Occupation | Male | Female |
| Production | 261 (77.7%) | 75 (22.3%) |
| Transportation | 204 (94.9%) | 11 (5.1%) |
| Material Moving | 157 (84.0%) | 30 (16.0%) |
| Total (Category) | 622 (84.3%) | 116 (15.7%) |
| Total (Overall) | 2,039 (52.6%) | 1,840 (47.4%) |
Employment Industries by Sex in Okfuskee County
Employment Industries in Okfuskee County
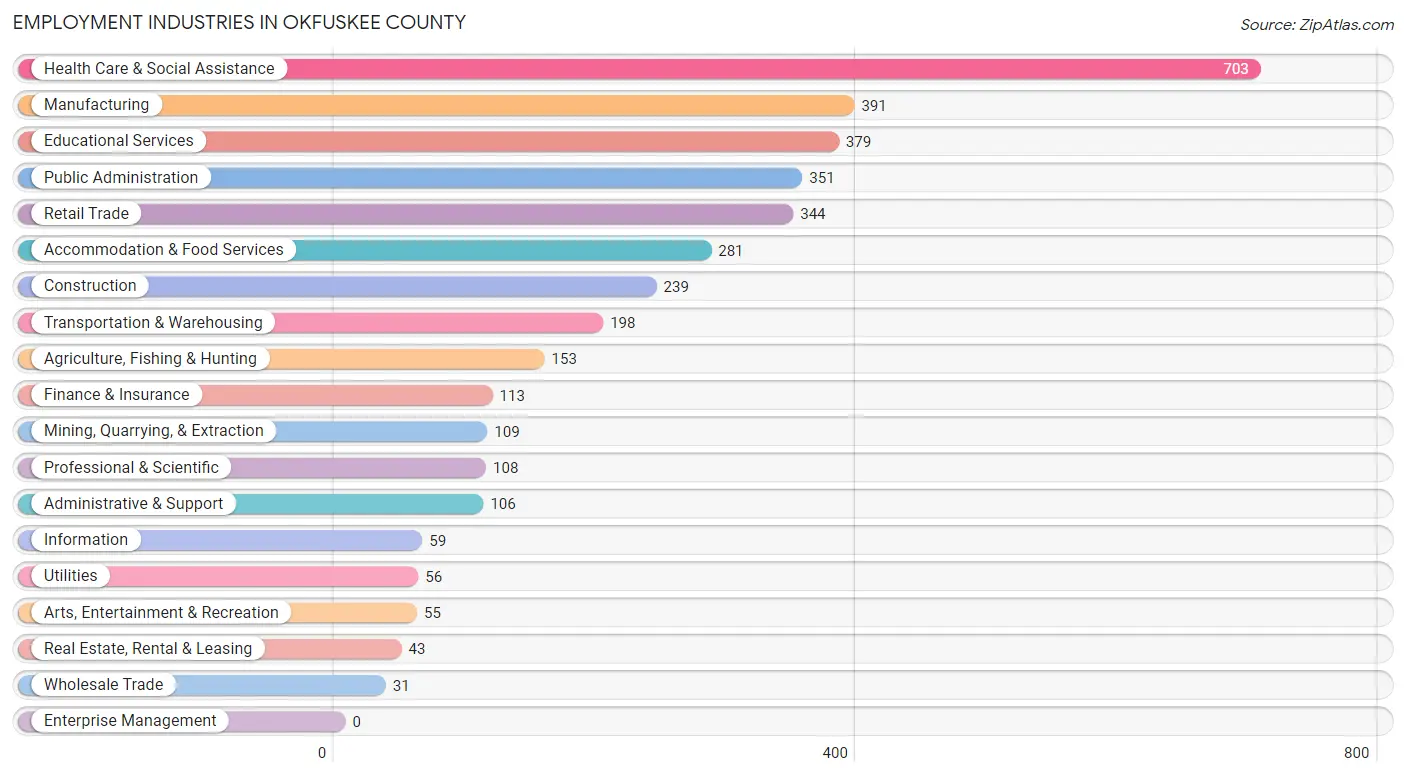
The major employment industries in Okfuskee County include Health Care & Social Assistance (703 | 18.1%), Manufacturing (391 | 10.1%), Educational Services (379 | 9.8%), Public Administration (351 | 9.0%), and Retail Trade (344 | 8.9%).
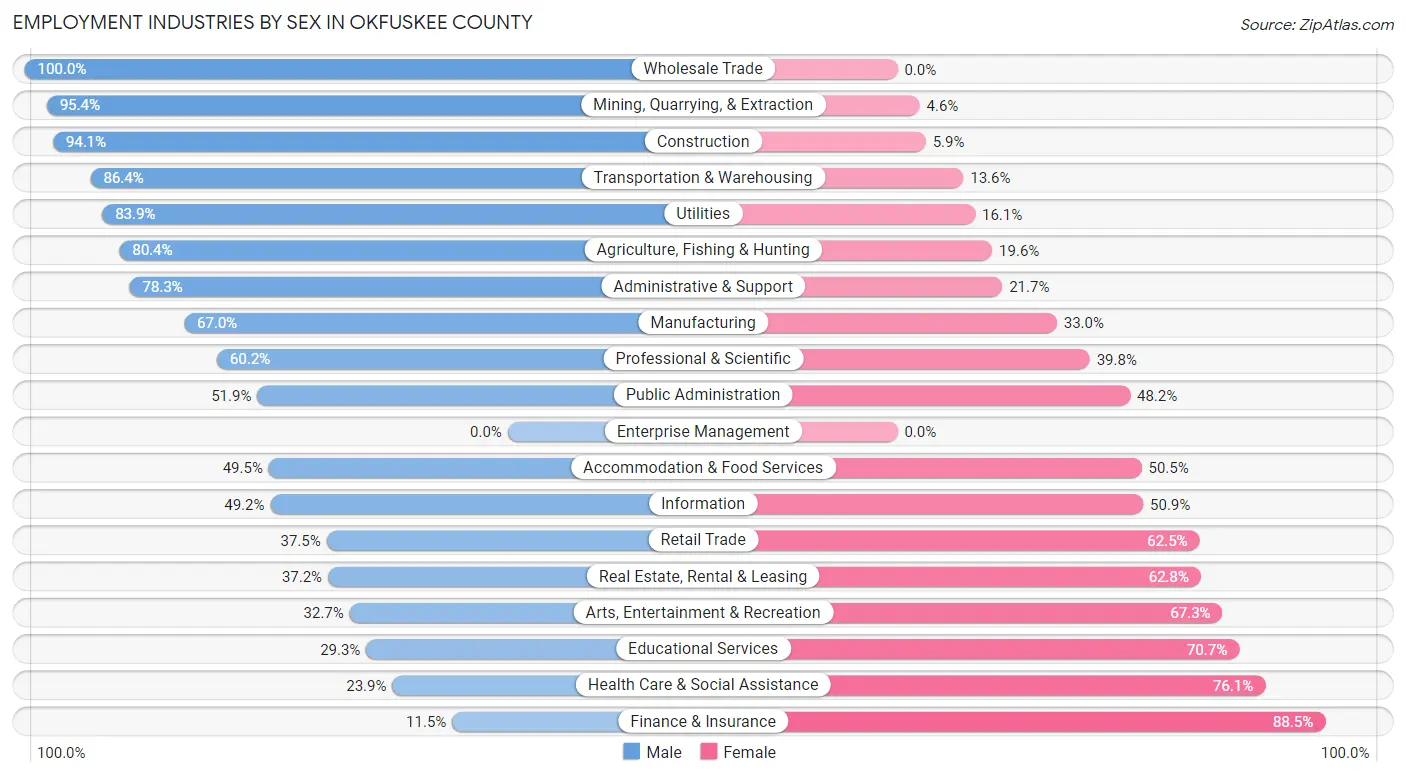
Employment Industries by Sex in Okfuskee County
The Okfuskee County industries that see more men than women are Wholesale Trade (100.0%), Mining, Quarrying, & Extraction (95.4%), and Construction (94.1%), whereas the industries that tend to have a higher number of women are Finance & Insurance (88.5%), Health Care & Social Assistance (76.1%), and Educational Services (70.7%).
| Industry | Male | Female |
| Agriculture, Fishing & Hunting | 123 (80.4%) | 30 (19.6%) |
| Mining, Quarrying, & Extraction | 104 (95.4%) | 5 (4.6%) |
| Construction | 225 (94.1%) | 14 (5.9%) |
| Manufacturing | 262 (67.0%) | 129 (33.0%) |
| Wholesale Trade | 31 (100.0%) | 0 (0.0%) |
| Retail Trade | 129 (37.5%) | 215 (62.5%) |
| Transportation & Warehousing | 171 (86.4%) | 27 (13.6%) |
| Utilities | 47 (83.9%) | 9 (16.1%) |
| Information | 29 (49.1%) | 30 (50.8%) |
| Finance & Insurance | 13 (11.5%) | 100 (88.5%) |
| Real Estate, Rental & Leasing | 16 (37.2%) | 27 (62.8%) |
| Professional & Scientific | 65 (60.2%) | 43 (39.8%) |
| Enterprise Management | 0 (0.0%) | 0 (0.0%) |
| Administrative & Support | 83 (78.3%) | 23 (21.7%) |
| Educational Services | 111 (29.3%) | 268 (70.7%) |
| Health Care & Social Assistance | 168 (23.9%) | 535 (76.1%) |
| Arts, Entertainment & Recreation | 18 (32.7%) | 37 (67.3%) |
| Accommodation & Food Services | 139 (49.5%) | 142 (50.5%) |
| Public Administration | 182 (51.8%) | 169 (48.1%) |
| Total | 2,039 (52.6%) | 1,840 (47.4%) |
Education in Okfuskee County
School Enrollment in Okfuskee County
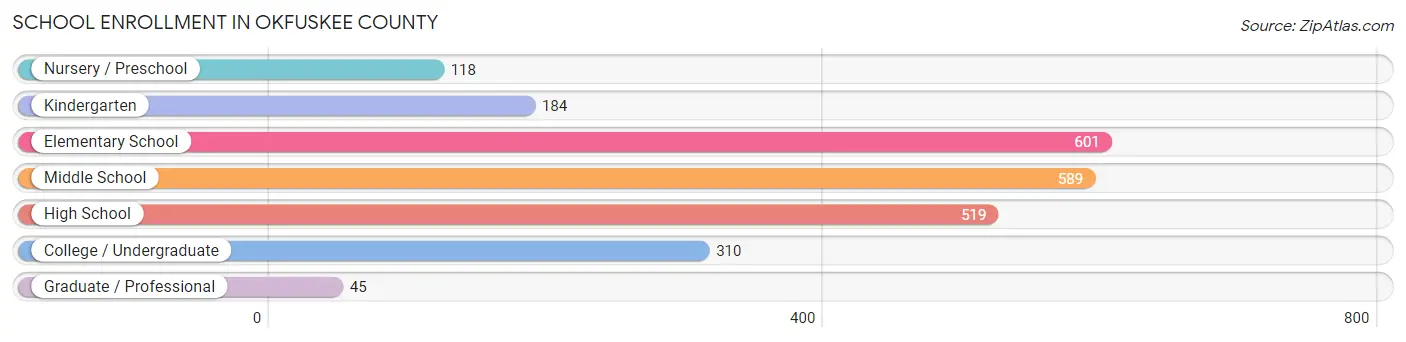
The most common levels of schooling among the 2,366 students in Okfuskee County are elementary school (601 | 25.4%), middle school (589 | 24.9%), and high school (519 | 21.9%).
| School Level | # Students | % Students |
| Nursery / Preschool | 118 | 5.0% |
| Kindergarten | 184 | 7.8% |
| Elementary School | 601 | 25.4% |
| Middle School | 589 | 24.9% |
| High School | 519 | 21.9% |
| College / Undergraduate | 310 | 13.1% |
| Graduate / Professional | 45 | 1.9% |
| Total | 2,366 | 100.0% |
School Enrollment by Age by Funding Source in Okfuskee County
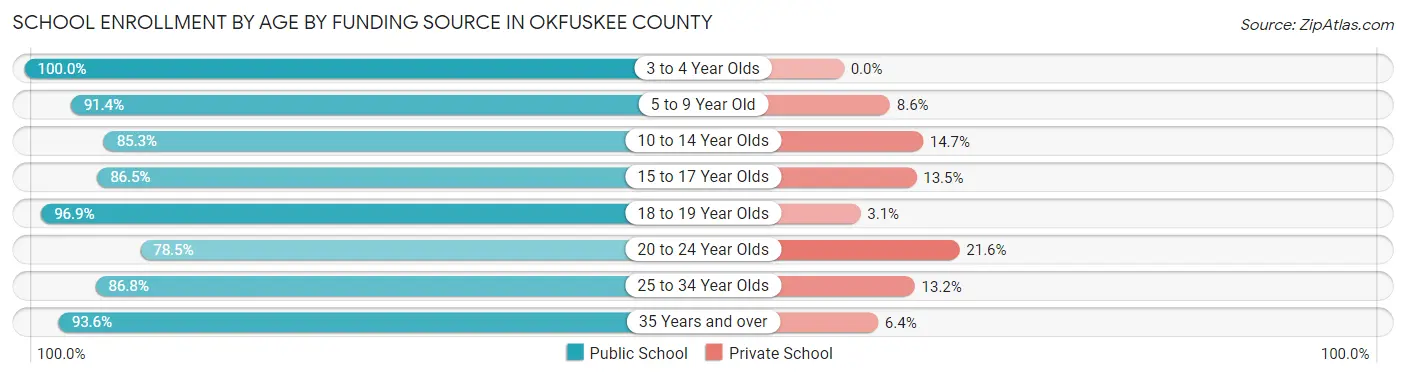
Out of a total of 2,366 students who are enrolled in schools in Okfuskee County, 270 (11.4%) attend a private institution, while the remaining 2,096 (88.6%) are enrolled in public schools. The age group of 20 to 24 year olds has the highest likelihood of being enrolled in private schools, with 25 (21.5% in the age bracket) enrolled. Conversely, the age group of 3 to 4 year olds has the lowest likelihood of being enrolled in a private school, with 72 (100.0% in the age bracket) attending a public institution.
| Age Bracket | Public School | Private School |
| 3 to 4 Year Olds | 72 (100.0%) | 0 (0.0%) |
| 5 to 9 Year Old | 659 (91.4%) | 62 (8.6%) |
| 10 to 14 Year Olds | 613 (85.3%) | 106 (14.7%) |
| 15 to 17 Year Olds | 326 (86.5%) | 51 (13.5%) |
| 18 to 19 Year Olds | 156 (96.9%) | 5 (3.1%) |
| 20 to 24 Year Olds | 91 (78.4%) | 25 (21.5%) |
| 25 to 34 Year Olds | 92 (86.8%) | 14 (13.2%) |
| 35 Years and over | 88 (93.6%) | 6 (6.4%) |
| Total | 2,096 (88.6%) | 270 (11.4%) |
Educational Attainment by Field of Study in Okfuskee County
Education (225 | 22.1%), business (153 | 15.0%), bio, nature & agricultural (89 | 8.7%), science & technology (89 | 8.7%), and engineering (85 | 8.3%) are the most common fields of study among 1,019 individuals in Okfuskee County who have obtained a bachelor's degree or higher.
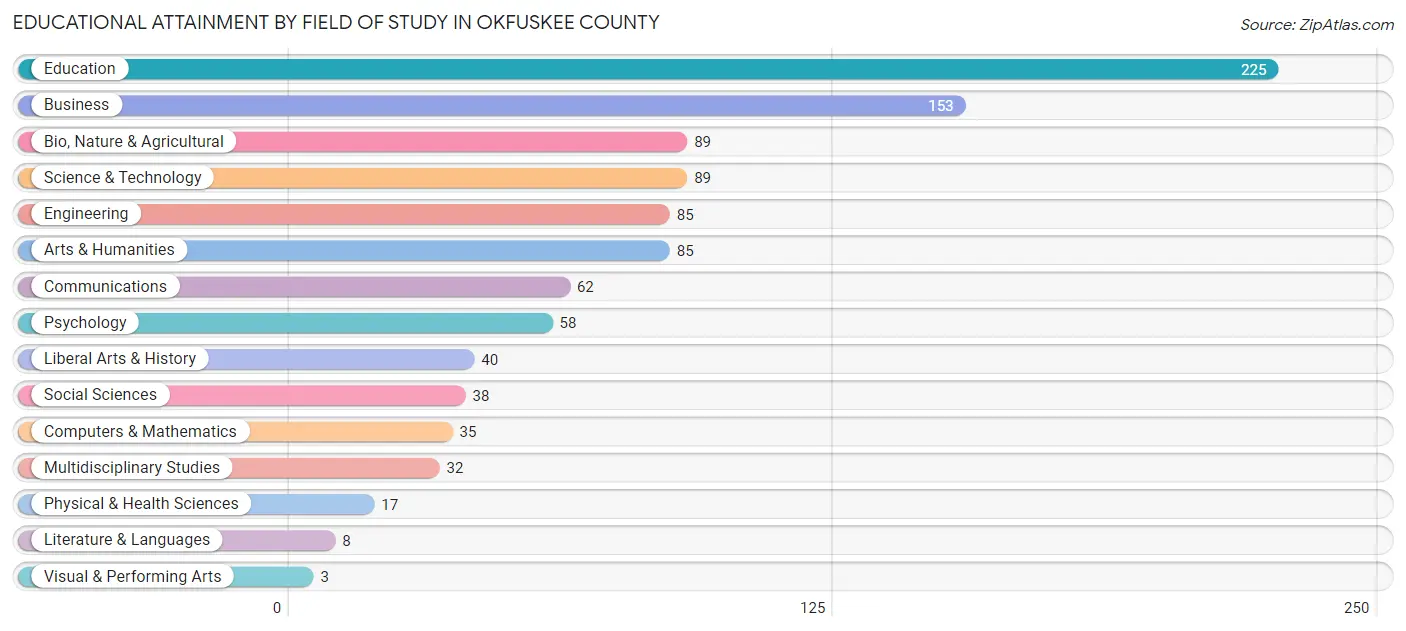
| Field of Study | # Graduates | % Graduates |
| Computers & Mathematics | 35 | 3.4% |
| Bio, Nature & Agricultural | 89 | 8.7% |
| Physical & Health Sciences | 17 | 1.7% |
| Psychology | 58 | 5.7% |
| Social Sciences | 38 | 3.7% |
| Engineering | 85 | 8.3% |
| Multidisciplinary Studies | 32 | 3.1% |
| Science & Technology | 89 | 8.7% |
| Business | 153 | 15.0% |
| Education | 225 | 22.1% |
| Literature & Languages | 8 | 0.8% |
| Liberal Arts & History | 40 | 3.9% |
| Visual & Performing Arts | 3 | 0.3% |
| Communications | 62 | 6.1% |
| Arts & Humanities | 85 | 8.3% |
| Total | 1,019 | 100.0% |
Transportation & Commute in Okfuskee County
Vehicle Availability by Sex in Okfuskee County
The most prevalent vehicle ownership categories in Okfuskee County are males with 2 vehicles (679, accounting for 34.8%) and females with 2 vehicles (621, making up 38.2%).
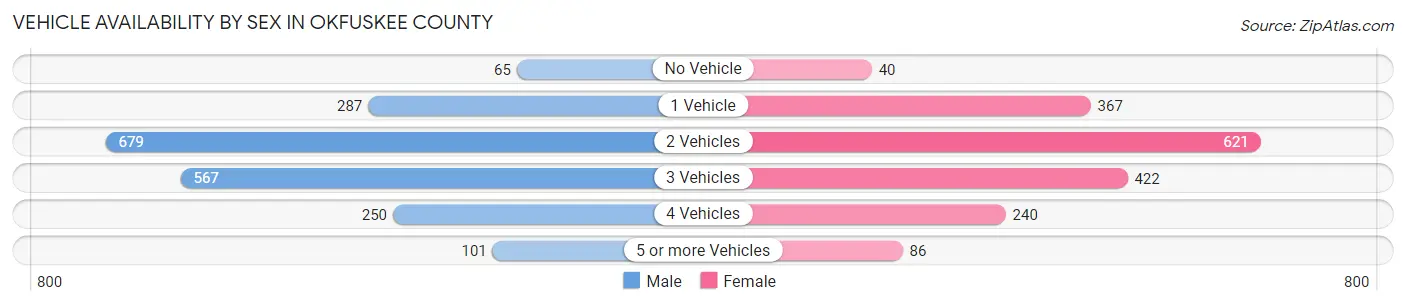
| Vehicles Available | Male | Female |
| No Vehicle | 65 (3.3%) | 40 (2.2%) |
| 1 Vehicle | 287 (14.7%) | 367 (20.7%) |
| 2 Vehicles | 679 (34.8%) | 621 (35.0%) |
| 3 Vehicles | 567 (29.1%) | 422 (23.8%) |
| 4 Vehicles | 250 (12.8%) | 240 (13.5%) |
| 5 or more Vehicles | 101 (5.2%) | 86 (4.8%) |
| Total | 1,949 (100.0%) | 1,776 (100.0%) |
Commute Time in Okfuskee County
The most frequently occuring commute durations in Okfuskee County are 5 to 9 minutes (587 commuters, 16.6%), 15 to 19 minutes (466 commuters, 13.2%), and 20 to 24 minutes (417 commuters, 11.8%).
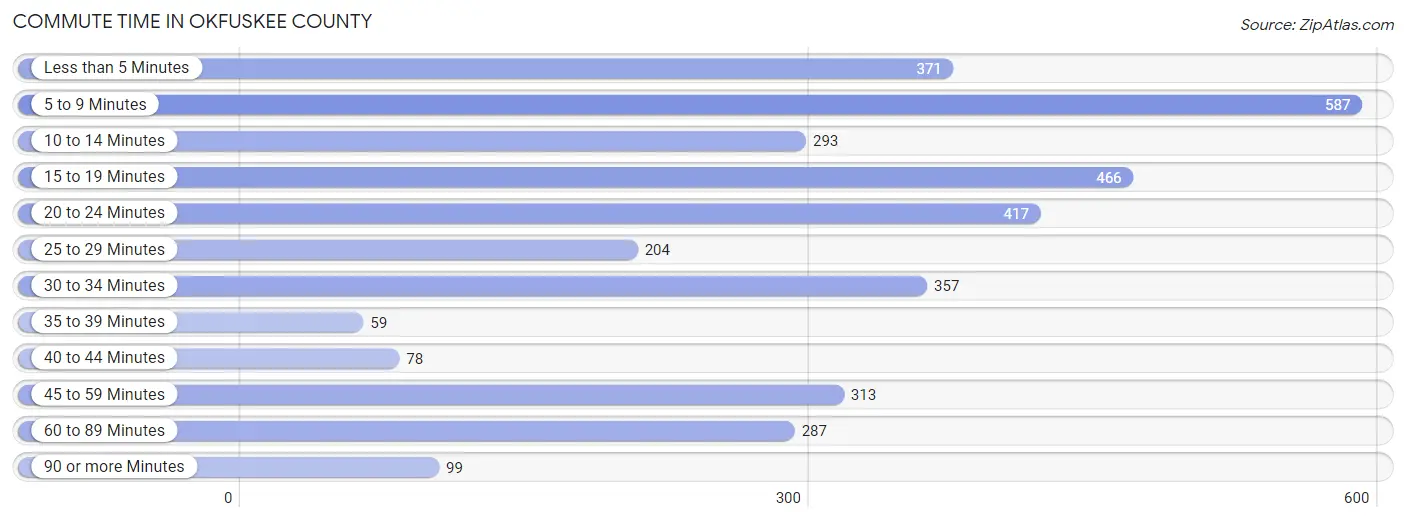
| Commute Time | # Commuters | % Commuters |
| Less than 5 Minutes | 371 | 10.5% |
| 5 to 9 Minutes | 587 | 16.6% |
| 10 to 14 Minutes | 293 | 8.3% |
| 15 to 19 Minutes | 466 | 13.2% |
| 20 to 24 Minutes | 417 | 11.8% |
| 25 to 29 Minutes | 204 | 5.8% |
| 30 to 34 Minutes | 357 | 10.1% |
| 35 to 39 Minutes | 59 | 1.7% |
| 40 to 44 Minutes | 78 | 2.2% |
| 45 to 59 Minutes | 313 | 8.9% |
| 60 to 89 Minutes | 287 | 8.1% |
| 90 or more Minutes | 99 | 2.8% |
Commute Time by Sex in Okfuskee County
The most common commute times in Okfuskee County are 5 to 9 minutes (322 commuters, 17.1%) for males and 5 to 9 minutes (265 commuters, 16.0%) for females.
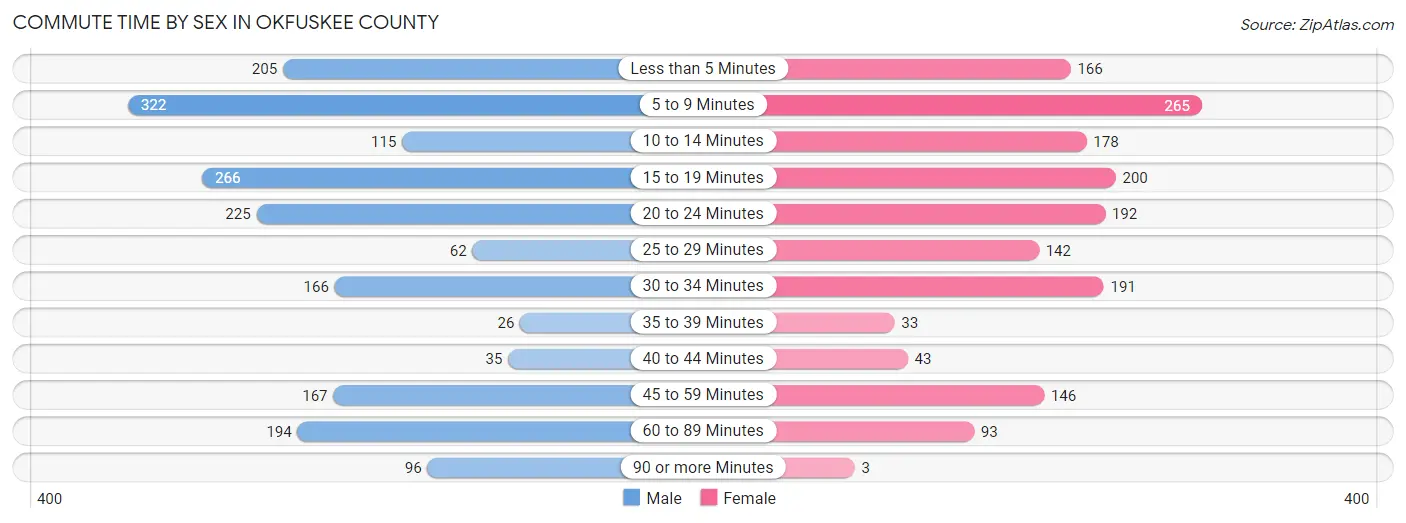
| Commute Time | Male | Female |
| Less than 5 Minutes | 205 (10.9%) | 166 (10.1%) |
| 5 to 9 Minutes | 322 (17.1%) | 265 (16.0%) |
| 10 to 14 Minutes | 115 (6.1%) | 178 (10.8%) |
| 15 to 19 Minutes | 266 (14.2%) | 200 (12.1%) |
| 20 to 24 Minutes | 225 (12.0%) | 192 (11.6%) |
| 25 to 29 Minutes | 62 (3.3%) | 142 (8.6%) |
| 30 to 34 Minutes | 166 (8.8%) | 191 (11.6%) |
| 35 to 39 Minutes | 26 (1.4%) | 33 (2.0%) |
| 40 to 44 Minutes | 35 (1.9%) | 43 (2.6%) |
| 45 to 59 Minutes | 167 (8.9%) | 146 (8.8%) |
| 60 to 89 Minutes | 194 (10.3%) | 93 (5.6%) |
| 90 or more Minutes | 96 (5.1%) | 3 (0.2%) |
Time of Departure to Work by Sex in Okfuskee County
The most frequent times of departure to work in Okfuskee County are 7:30 AM to 7:59 AM (337, 17.9%) for males and 7:30 AM to 7:59 AM (392, 23.7%) for females.
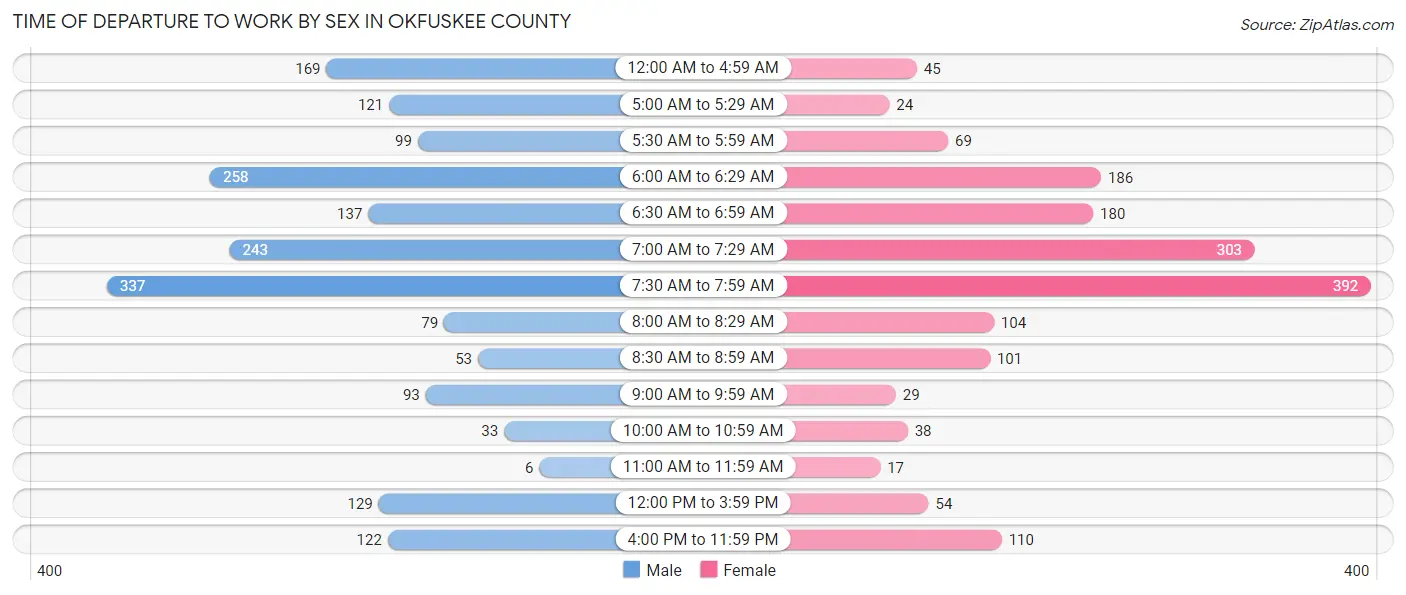
| Time of Departure | Male | Female |
| 12:00 AM to 4:59 AM | 169 (9.0%) | 45 (2.7%) |
| 5:00 AM to 5:29 AM | 121 (6.4%) | 24 (1.5%) |
| 5:30 AM to 5:59 AM | 99 (5.3%) | 69 (4.2%) |
| 6:00 AM to 6:29 AM | 258 (13.7%) | 186 (11.3%) |
| 6:30 AM to 6:59 AM | 137 (7.3%) | 180 (10.9%) |
| 7:00 AM to 7:29 AM | 243 (12.9%) | 303 (18.3%) |
| 7:30 AM to 7:59 AM | 337 (17.9%) | 392 (23.7%) |
| 8:00 AM to 8:29 AM | 79 (4.2%) | 104 (6.3%) |
| 8:30 AM to 8:59 AM | 53 (2.8%) | 101 (6.1%) |
| 9:00 AM to 9:59 AM | 93 (5.0%) | 29 (1.8%) |
| 10:00 AM to 10:59 AM | 33 (1.8%) | 38 (2.3%) |
| 11:00 AM to 11:59 AM | 6 (0.3%) | 17 (1.0%) |
| 12:00 PM to 3:59 PM | 129 (6.9%) | 54 (3.3%) |
| 4:00 PM to 11:59 PM | 122 (6.5%) | 110 (6.7%) |
| Total | 1,879 (100.0%) | 1,652 (100.0%) |
Housing Occupancy in Okfuskee County
Occupancy by Ownership in Okfuskee County
Of the total 3,871 dwellings in Okfuskee County, owner-occupied units account for 2,765 (71.4%), while renter-occupied units make up 1,106 (28.6%).
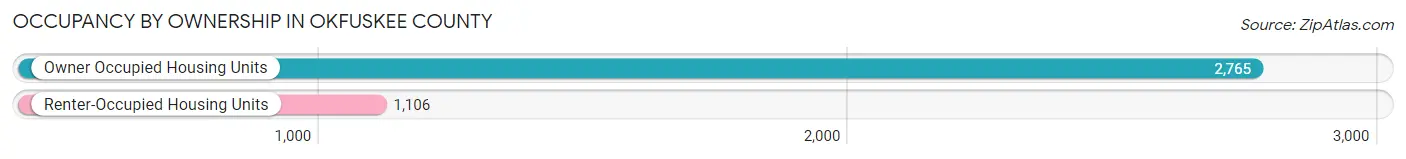
| Occupancy | # Housing Units | % Housing Units |
| Owner Occupied Housing Units | 2,765 | 71.4% |
| Renter-Occupied Housing Units | 1,106 | 28.6% |
| Total Occupied Housing Units | 3,871 | 100.0% |
Occupancy by Household Size in Okfuskee County
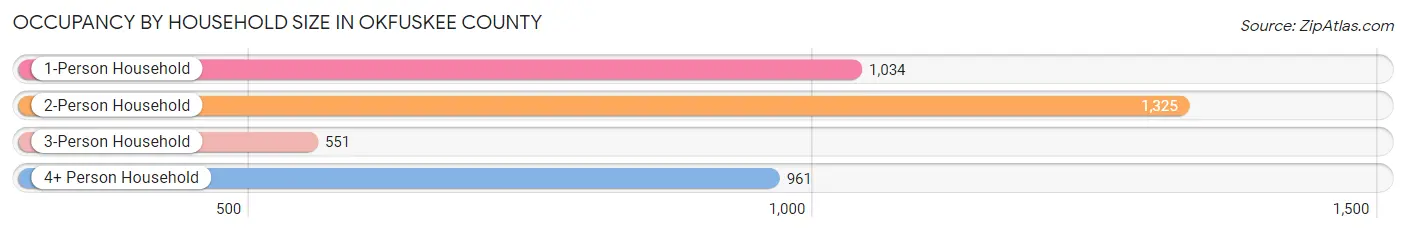
| Household Size | # Housing Units | % Housing Units |
| 1-Person Household | 1,034 | 26.7% |
| 2-Person Household | 1,325 | 34.2% |
| 3-Person Household | 551 | 14.2% |
| 4+ Person Household | 961 | 24.8% |
| Total Housing Units | 3,871 | 100.0% |
Occupancy by Ownership by Household Size in Okfuskee County
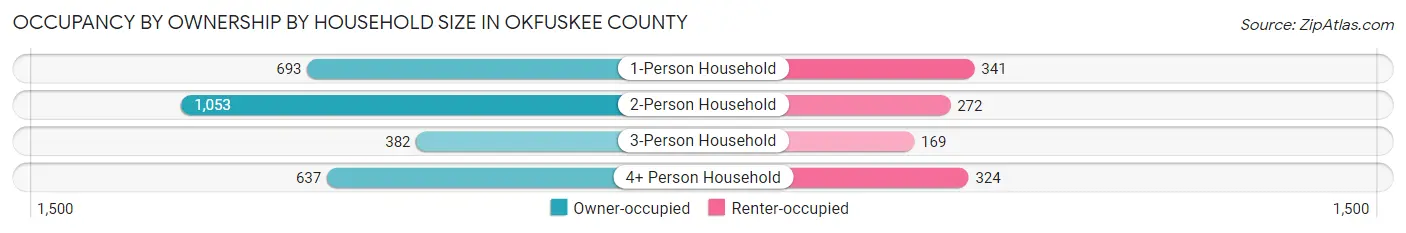
| Household Size | Owner-occupied | Renter-occupied |
| 1-Person Household | 693 (67.0%) | 341 (33.0%) |
| 2-Person Household | 1,053 (79.5%) | 272 (20.5%) |
| 3-Person Household | 382 (69.3%) | 169 (30.7%) |
| 4+ Person Household | 637 (66.3%) | 324 (33.7%) |
| Total Housing Units | 2,765 (71.4%) | 1,106 (28.6%) |
Occupancy by Educational Attainment in Okfuskee County
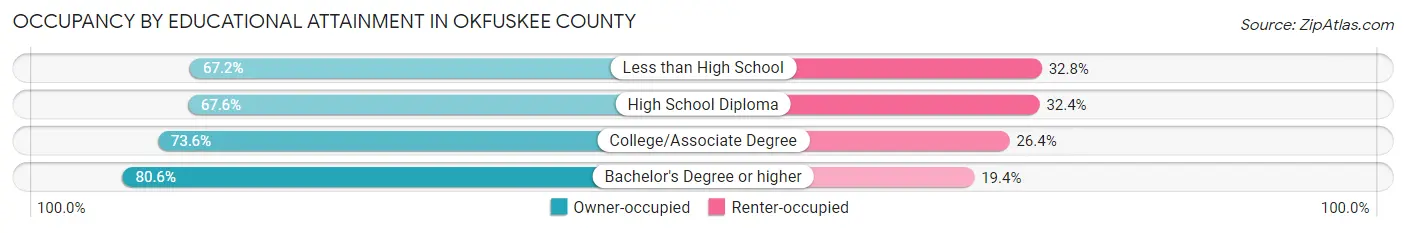
| Household Size | Owner-occupied | Renter-occupied |
| Less than High School | 348 (67.2%) | 170 (32.8%) |
| High School Diploma | 1,026 (67.6%) | 491 (32.4%) |
| College/Associate Degree | 927 (73.6%) | 333 (26.4%) |
| Bachelor's Degree or higher | 464 (80.6%) | 112 (19.4%) |
Occupancy by Age of Householder in Okfuskee County
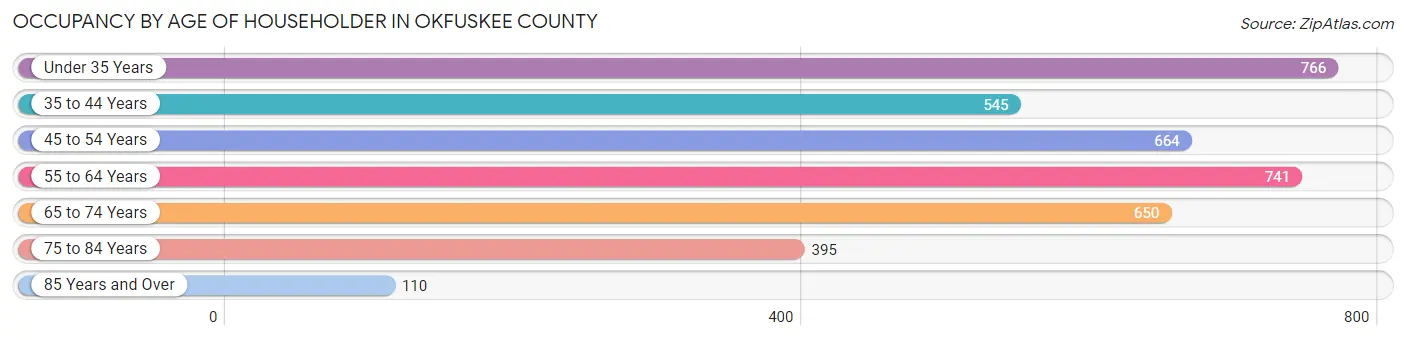
| Age Bracket | # Households | % Households |
| Under 35 Years | 766 | 19.8% |
| 35 to 44 Years | 545 | 14.1% |
| 45 to 54 Years | 664 | 17.2% |
| 55 to 64 Years | 741 | 19.1% |
| 65 to 74 Years | 650 | 16.8% |
| 75 to 84 Years | 395 | 10.2% |
| 85 Years and Over | 110 | 2.8% |
| Total | 3,871 | 100.0% |
Housing Finances in Okfuskee County
Median Income by Occupancy in Okfuskee County
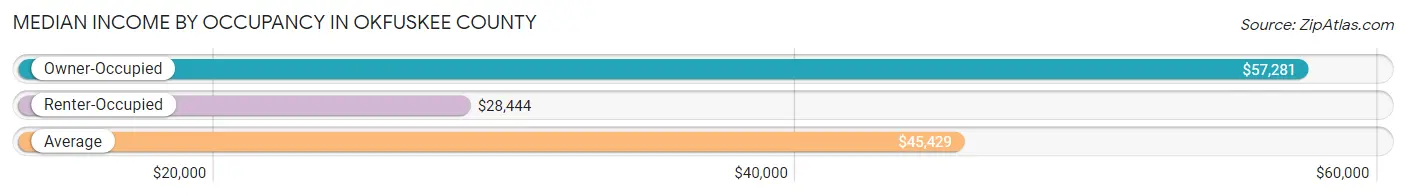
| Occupancy Type | # Households | Median Income |
| Owner-Occupied | 2,765 (71.4%) | $57,281 |
| Renter-Occupied | 1,106 (28.6%) | $28,444 |
| Average | 3,871 (100.0%) | $45,429 |
Occupancy by Householder Income Bracket in Okfuskee County
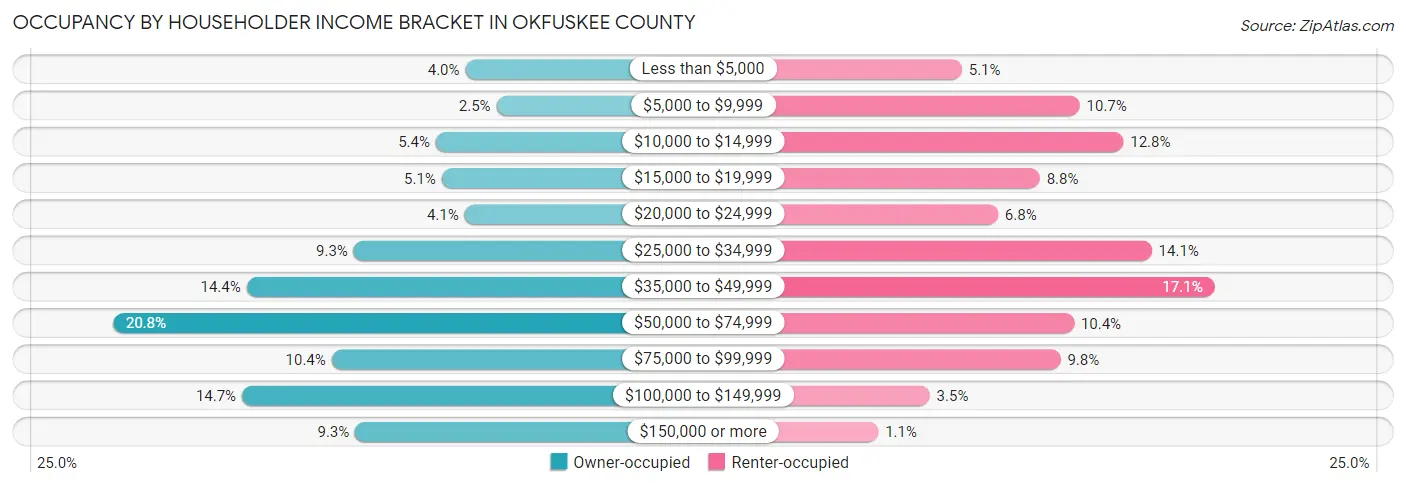
| Income Bracket | Owner-occupied | Renter-occupied |
| Less than $5,000 | 111 (4.0%) | 56 (5.1%) |
| $5,000 to $9,999 | 70 (2.5%) | 118 (10.7%) |
| $10,000 to $14,999 | 150 (5.4%) | 141 (12.8%) |
| $15,000 to $19,999 | 142 (5.1%) | 97 (8.8%) |
| $20,000 to $24,999 | 112 (4.1%) | 75 (6.8%) |
| $25,000 to $34,999 | 258 (9.3%) | 156 (14.1%) |
| $35,000 to $49,999 | 399 (14.4%) | 189 (17.1%) |
| $50,000 to $74,999 | 575 (20.8%) | 115 (10.4%) |
| $75,000 to $99,999 | 287 (10.4%) | 108 (9.8%) |
| $100,000 to $149,999 | 405 (14.6%) | 39 (3.5%) |
| $150,000 or more | 256 (9.3%) | 12 (1.1%) |
| Total | 2,765 (100.0%) | 1,106 (100.0%) |
Monthly Housing Cost Tiers in Okfuskee County
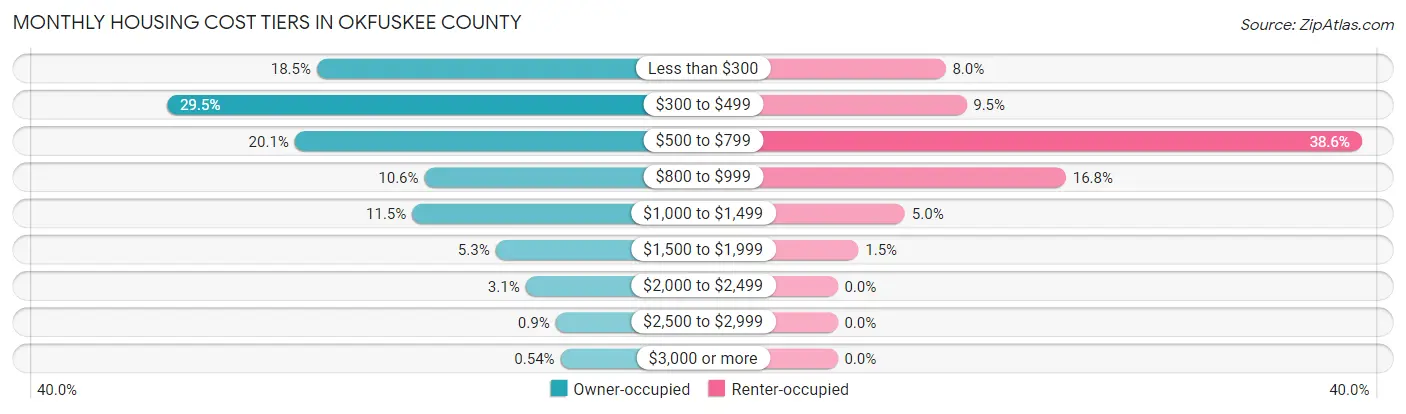
| Monthly Cost | Owner-occupied | Renter-occupied |
| Less than $300 | 511 (18.5%) | 88 (8.0%) |
| $300 to $499 | 816 (29.5%) | 105 (9.5%) |
| $500 to $799 | 556 (20.1%) | 427 (38.6%) |
| $800 to $999 | 292 (10.6%) | 186 (16.8%) |
| $1,000 to $1,499 | 317 (11.5%) | 55 (5.0%) |
| $1,500 to $1,999 | 147 (5.3%) | 17 (1.5%) |
| $2,000 to $2,499 | 86 (3.1%) | 0 (0.0%) |
| $2,500 to $2,999 | 25 (0.9%) | 0 (0.0%) |
| $3,000 or more | 15 (0.5%) | 0 (0.0%) |
| Total | 2,765 (100.0%) | 1,106 (100.0%) |
Physical Housing Characteristics in Okfuskee County
Housing Structures in Okfuskee County
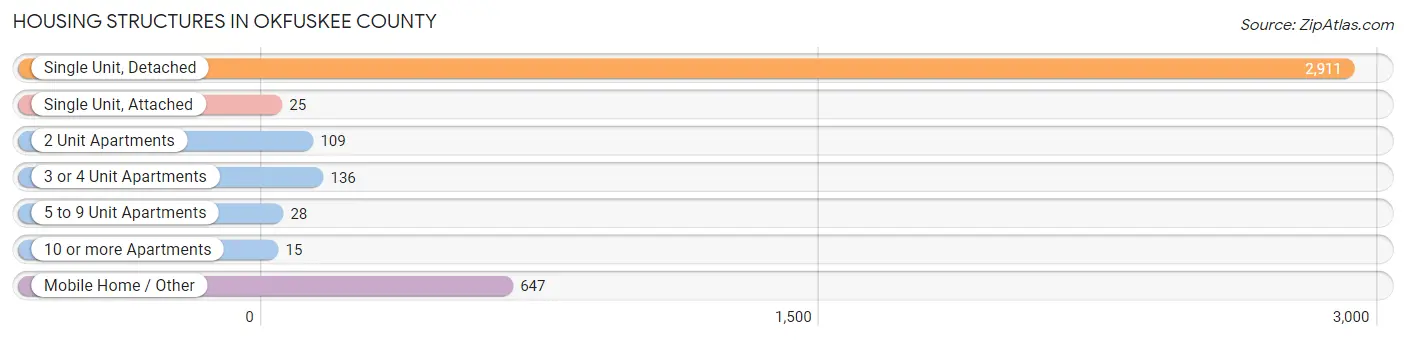
| Structure Type | # Housing Units | % Housing Units |
| Single Unit, Detached | 2,911 | 75.2% |
| Single Unit, Attached | 25 | 0.6% |
| 2 Unit Apartments | 109 | 2.8% |
| 3 or 4 Unit Apartments | 136 | 3.5% |
| 5 to 9 Unit Apartments | 28 | 0.7% |
| 10 or more Apartments | 15 | 0.4% |
| Mobile Home / Other | 647 | 16.7% |
| Total | 3,871 | 100.0% |
Housing Structures by Occupancy in Okfuskee County
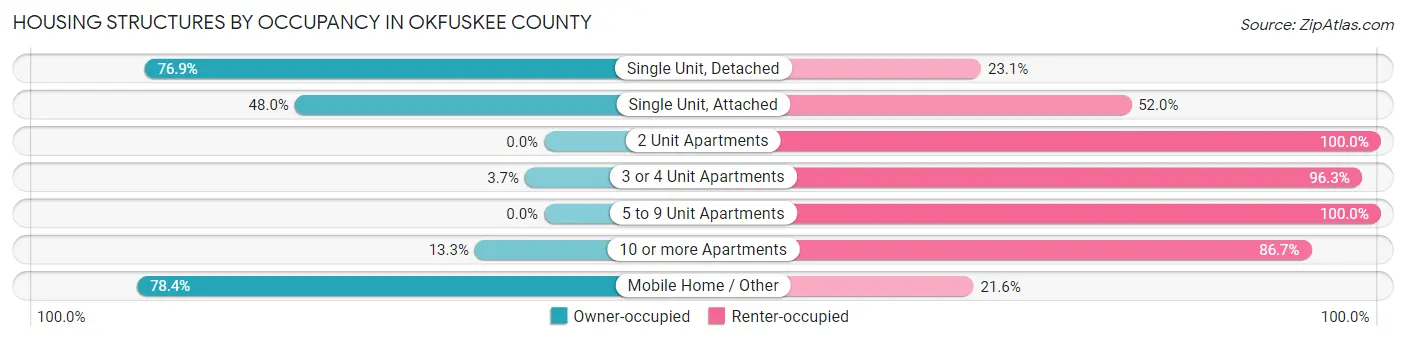
| Structure Type | Owner-occupied | Renter-occupied |
| Single Unit, Detached | 2,239 (76.9%) | 672 (23.1%) |
| Single Unit, Attached | 12 (48.0%) | 13 (52.0%) |
| 2 Unit Apartments | 0 (0.0%) | 109 (100.0%) |
| 3 or 4 Unit Apartments | 5 (3.7%) | 131 (96.3%) |
| 5 to 9 Unit Apartments | 0 (0.0%) | 28 (100.0%) |
| 10 or more Apartments | 2 (13.3%) | 13 (86.7%) |
| Mobile Home / Other | 507 (78.4%) | 140 (21.6%) |
| Total | 2,765 (71.4%) | 1,106 (28.6%) |
Housing Structures by Number of Rooms in Okfuskee County
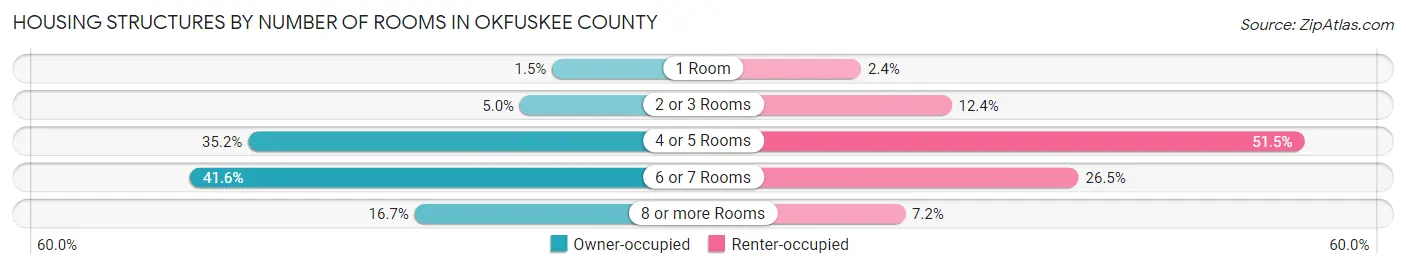
| Number of Rooms | Owner-occupied | Renter-occupied |
| 1 Room | 40 (1.5%) | 26 (2.4%) |
| 2 or 3 Rooms | 139 (5.0%) | 137 (12.4%) |
| 4 or 5 Rooms | 973 (35.2%) | 570 (51.5%) |
| 6 or 7 Rooms | 1,151 (41.6%) | 293 (26.5%) |
| 8 or more Rooms | 462 (16.7%) | 80 (7.2%) |
| Total | 2,765 (100.0%) | 1,106 (100.0%) |
Housing Structure by Heating Type in Okfuskee County
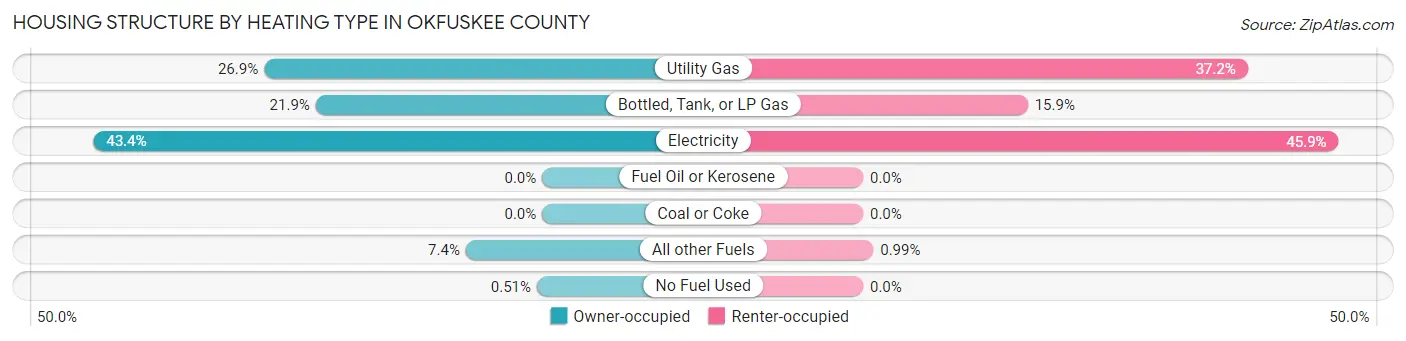
| Heating Type | Owner-occupied | Renter-occupied |
| Utility Gas | 743 (26.9%) | 411 (37.2%) |
| Bottled, Tank, or LP Gas | 605 (21.9%) | 176 (15.9%) |
| Electricity | 1,199 (43.4%) | 508 (45.9%) |
| Fuel Oil or Kerosene | 0 (0.0%) | 0 (0.0%) |
| Coal or Coke | 0 (0.0%) | 0 (0.0%) |
| All other Fuels | 204 (7.4%) | 11 (1.0%) |
| No Fuel Used | 14 (0.5%) | 0 (0.0%) |
| Total | 2,765 (100.0%) | 1,106 (100.0%) |
Household Vehicle Usage in Okfuskee County
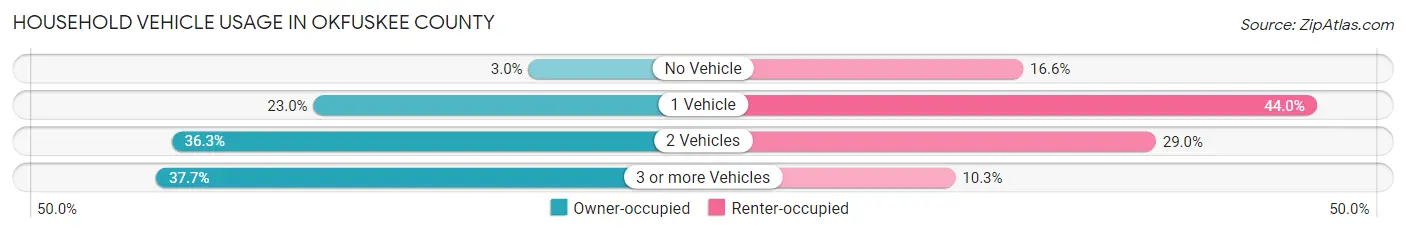
| Vehicles per Household | Owner-occupied | Renter-occupied |
| No Vehicle | 82 (3.0%) | 184 (16.6%) |
| 1 Vehicle | 637 (23.0%) | 487 (44.0%) |
| 2 Vehicles | 1,003 (36.3%) | 321 (29.0%) |
| 3 or more Vehicles | 1,043 (37.7%) | 114 (10.3%) |
| Total | 2,765 (100.0%) | 1,106 (100.0%) |
Real Estate & Mortgages in Okfuskee County
Real Estate and Mortgage Overview in Okfuskee County
| Characteristic | Without Mortgage | With Mortgage |
| Housing Units | 1,746 | 1,019 |
| Median Property Value | $96,700 | $119,700 |
| Median Household Income | $49,583 | $91 |
| Monthly Housing Costs | $378 | $15 |
| Real Estate Taxes | $520 | $64 |
Property Value by Mortgage Status in Okfuskee County
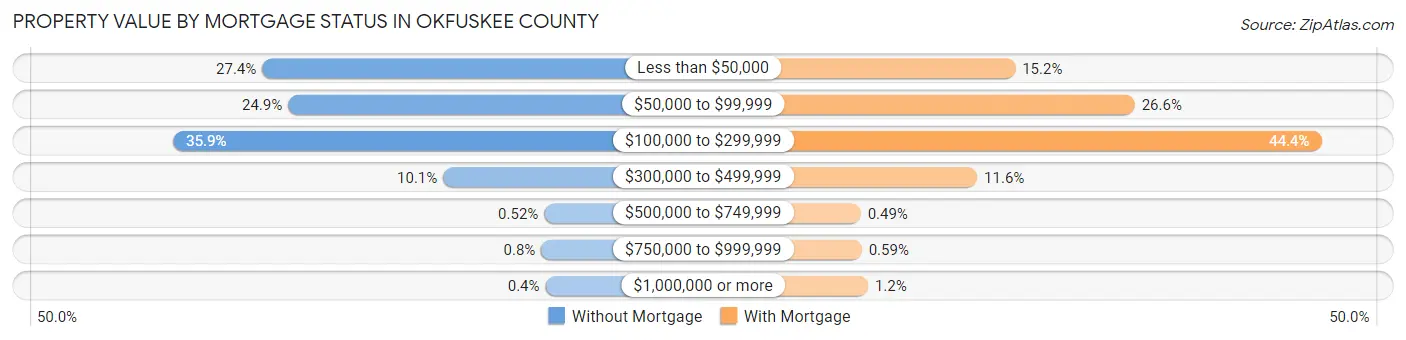
| Property Value | Without Mortgage | With Mortgage |
| Less than $50,000 | 478 (27.4%) | 155 (15.2%) |
| $50,000 to $99,999 | 435 (24.9%) | 271 (26.6%) |
| $100,000 to $299,999 | 626 (35.8%) | 452 (44.4%) |
| $300,000 to $499,999 | 177 (10.1%) | 118 (11.6%) |
| $500,000 to $749,999 | 9 (0.5%) | 5 (0.5%) |
| $750,000 to $999,999 | 14 (0.8%) | 6 (0.6%) |
| $1,000,000 or more | 7 (0.4%) | 12 (1.2%) |
| Total | 1,746 (100.0%) | 1,019 (100.0%) |
Household Income by Mortgage Status in Okfuskee County
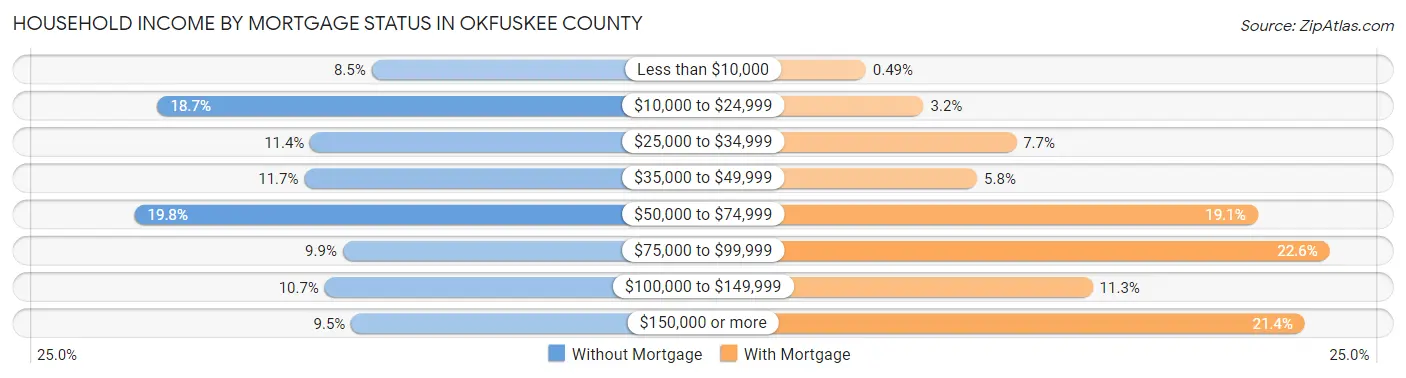
| Household Income | Without Mortgage | With Mortgage |
| Less than $10,000 | 148 (8.5%) | 5 (0.5%) |
| $10,000 to $24,999 | 326 (18.7%) | 33 (3.2%) |
| $25,000 to $34,999 | 199 (11.4%) | 78 (7.6%) |
| $35,000 to $49,999 | 204 (11.7%) | 59 (5.8%) |
| $50,000 to $74,999 | 345 (19.8%) | 195 (19.1%) |
| $75,000 to $99,999 | 172 (9.9%) | 230 (22.6%) |
| $100,000 to $149,999 | 187 (10.7%) | 115 (11.3%) |
| $150,000 or more | 165 (9.5%) | 218 (21.4%) |
| Total | 1,746 (100.0%) | 1,019 (100.0%) |
Property Value to Household Income Ratio in Okfuskee County
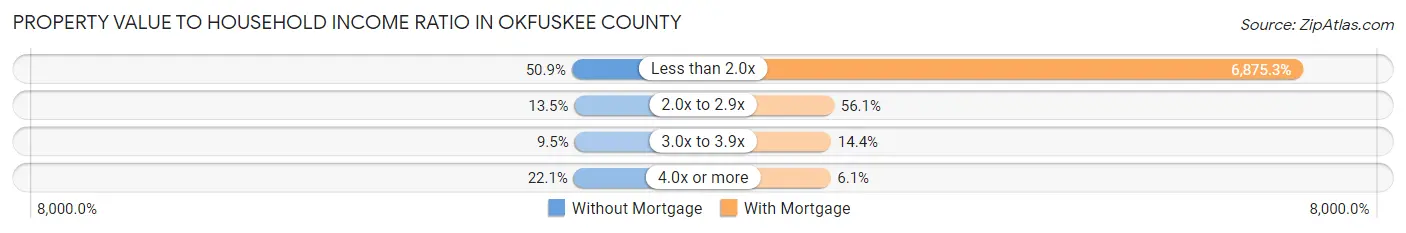
| Value-to-Income Ratio | Without Mortgage | With Mortgage |
| Less than 2.0x | 889 (50.9%) | 70,059 (6,875.3%) |
| 2.0x to 2.9x | 236 (13.5%) | 572 (56.1%) |
| 3.0x to 3.9x | 166 (9.5%) | 147 (14.4%) |
| 4.0x or more | 385 (22.1%) | 62 (6.1%) |
| Total | 1,746 (100.0%) | 1,019 (100.0%) |
Real Estate Taxes by Mortgage Status in Okfuskee County
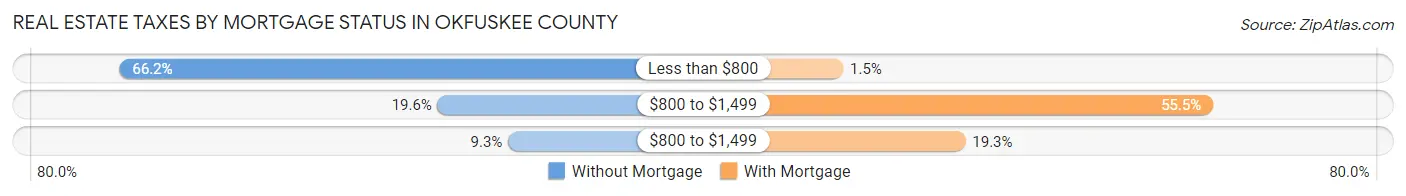
| Property Taxes | Without Mortgage | With Mortgage |
| Less than $800 | 1,155 (66.1%) | 15 (1.5%) |
| $800 to $1,499 | 343 (19.6%) | 566 (55.5%) |
| $800 to $1,499 | 163 (9.3%) | 197 (19.3%) |
| Total | 1,746 (100.0%) | 1,019 (100.0%) |
Health & Disability in Okfuskee County
Health Insurance Coverage by Age in Okfuskee County
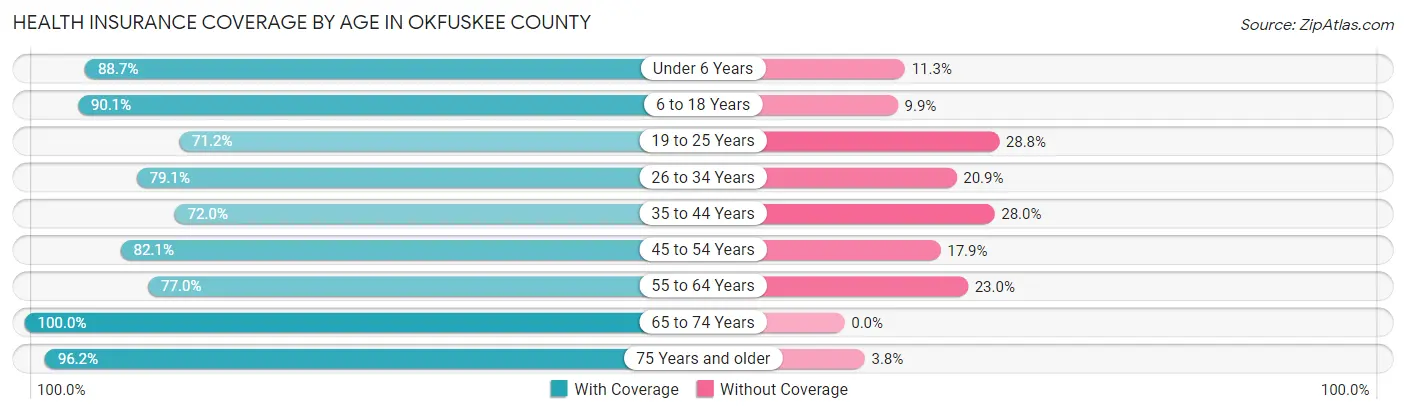
| Age Bracket | With Coverage | Without Coverage |
| Under 6 Years | 677 (88.7%) | 86 (11.3%) |
| 6 to 18 Years | 1,713 (90.1%) | 189 (9.9%) |
| 19 to 25 Years | 620 (71.2%) | 251 (28.8%) |
| 26 to 34 Years | 921 (79.1%) | 243 (20.9%) |
| 35 to 44 Years | 757 (72.0%) | 294 (28.0%) |
| 45 to 54 Years | 1,119 (82.1%) | 244 (17.9%) |
| 55 to 64 Years | 1,057 (77.0%) | 316 (23.0%) |
| 65 to 74 Years | 1,063 (100.0%) | 0 (0.0%) |
| 75 Years and older | 763 (96.2%) | 30 (3.8%) |
| Total | 8,690 (84.0%) | 1,653 (16.0%) |
Health Insurance Coverage by Citizenship Status in Okfuskee County
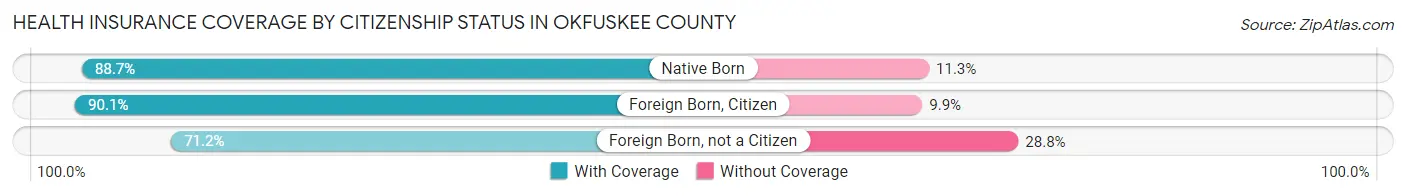
| Citizenship Status | With Coverage | Without Coverage |
| Native Born | 677 (88.7%) | 86 (11.3%) |
| Foreign Born, Citizen | 1,713 (90.1%) | 189 (9.9%) |
| Foreign Born, not a Citizen | 620 (71.2%) | 251 (28.8%) |
Health Insurance Coverage by Household Income in Okfuskee County
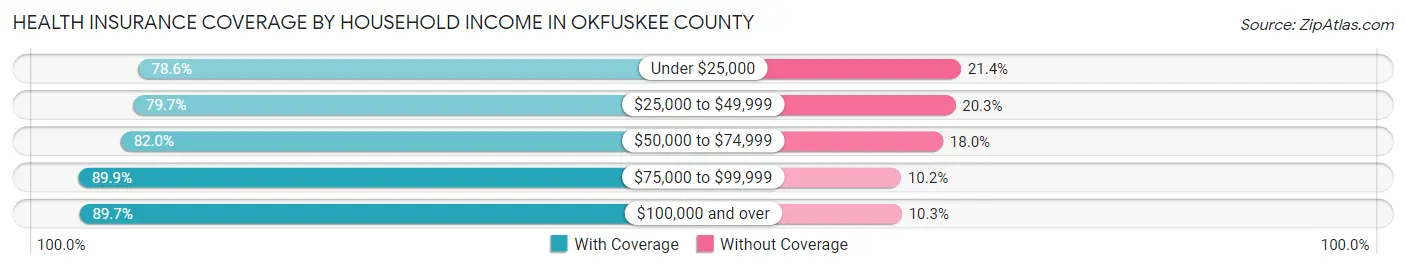
| Household Income | With Coverage | Without Coverage |
| Under $25,000 | 1,677 (78.6%) | 456 (21.4%) |
| $25,000 to $49,999 | 1,937 (79.7%) | 494 (20.3%) |
| $50,000 to $74,999 | 1,548 (82.0%) | 340 (18.0%) |
| $75,000 to $99,999 | 1,045 (89.8%) | 118 (10.2%) |
| $100,000 and over | 2,135 (89.7%) | 245 (10.3%) |
Public vs Private Health Insurance Coverage by Age in Okfuskee County
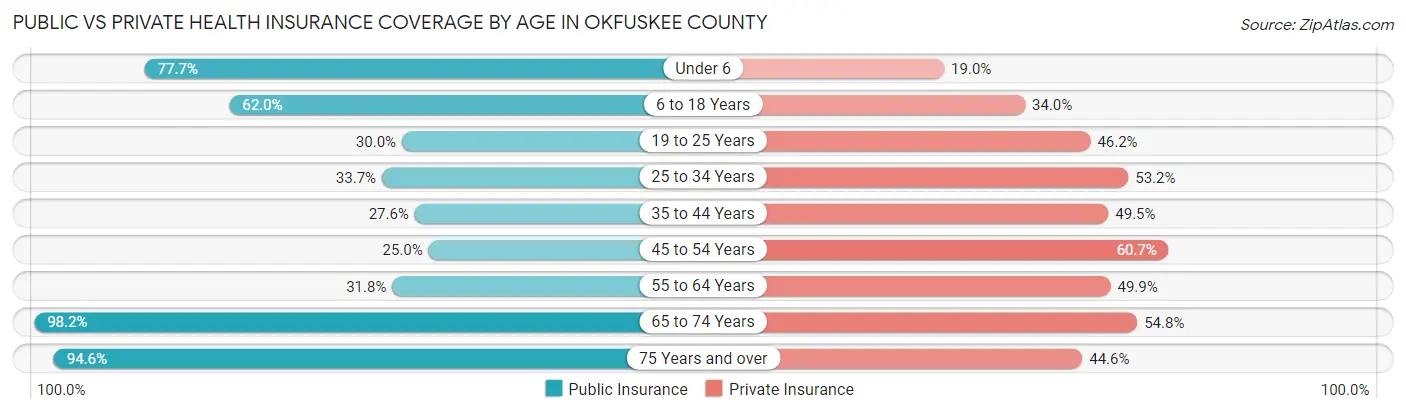
| Age Bracket | Public Insurance | Private Insurance |
| Under 6 | 593 (77.7%) | 145 (19.0%) |
| 6 to 18 Years | 1,179 (62.0%) | 647 (34.0%) |
| 19 to 25 Years | 261 (30.0%) | 402 (46.2%) |
| 25 to 34 Years | 392 (33.7%) | 619 (53.2%) |
| 35 to 44 Years | 290 (27.6%) | 520 (49.5%) |
| 45 to 54 Years | 341 (25.0%) | 827 (60.7%) |
| 55 to 64 Years | 436 (31.8%) | 685 (49.9%) |
| 65 to 74 Years | 1,044 (98.2%) | 583 (54.8%) |
| 75 Years and over | 750 (94.6%) | 354 (44.6%) |
| Total | 5,286 (51.1%) | 4,782 (46.2%) |
Disability Status by Sex by Age in Okfuskee County
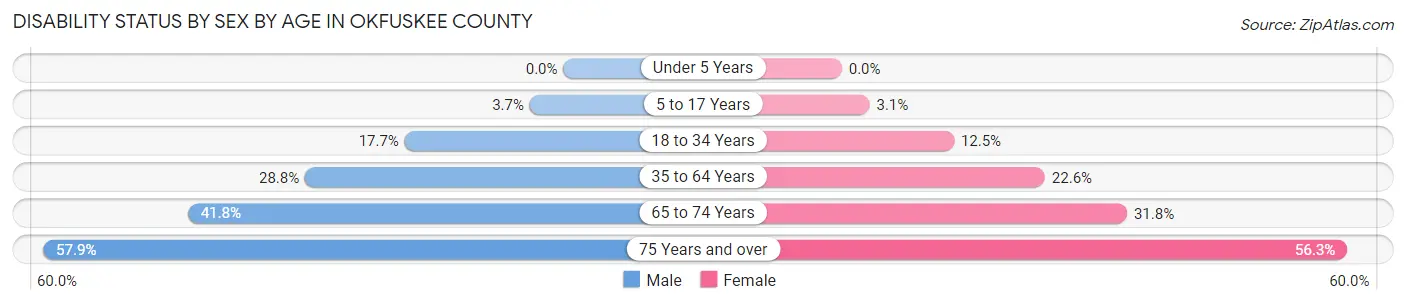
| Age Bracket | Male | Female |
| Under 5 Years | 0 (0.0%) | 0 (0.0%) |
| 5 to 17 Years | 38 (3.7%) | 28 (3.1%) |
| 18 to 34 Years | 209 (17.7%) | 123 (12.5%) |
| 35 to 64 Years | 563 (28.8%) | 414 (22.6%) |
| 65 to 74 Years | 197 (41.8%) | 188 (31.8%) |
| 75 Years and over | 201 (57.9%) | 251 (56.3%) |
Disability Class by Sex by Age in Okfuskee County
Disability Class: Hearing Difficulty
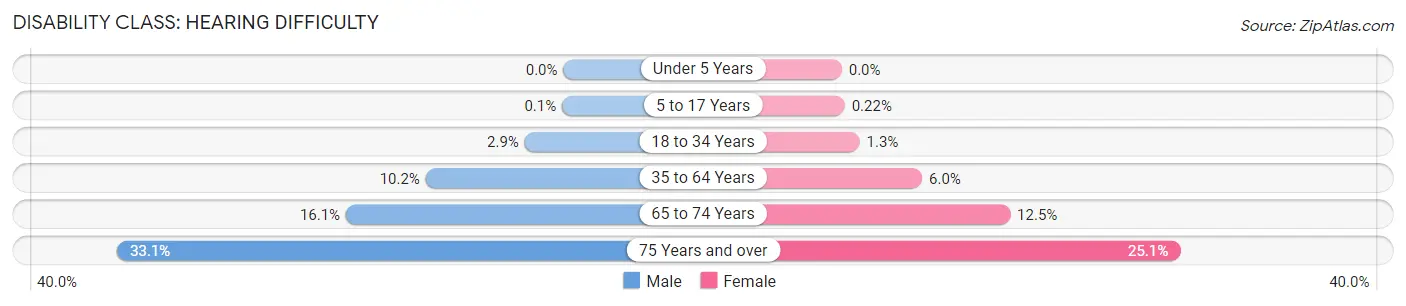
| Age Bracket | Male | Female |
| Under 5 Years | 0 (0.0%) | 0 (0.0%) |
| 5 to 17 Years | 1 (0.1%) | 2 (0.2%) |
| 18 to 34 Years | 34 (2.9%) | 13 (1.3%) |
| 35 to 64 Years | 200 (10.2%) | 109 (6.0%) |
| 65 to 74 Years | 76 (16.1%) | 74 (12.5%) |
| 75 Years and over | 115 (33.1%) | 112 (25.1%) |
Disability Class: Vision Difficulty
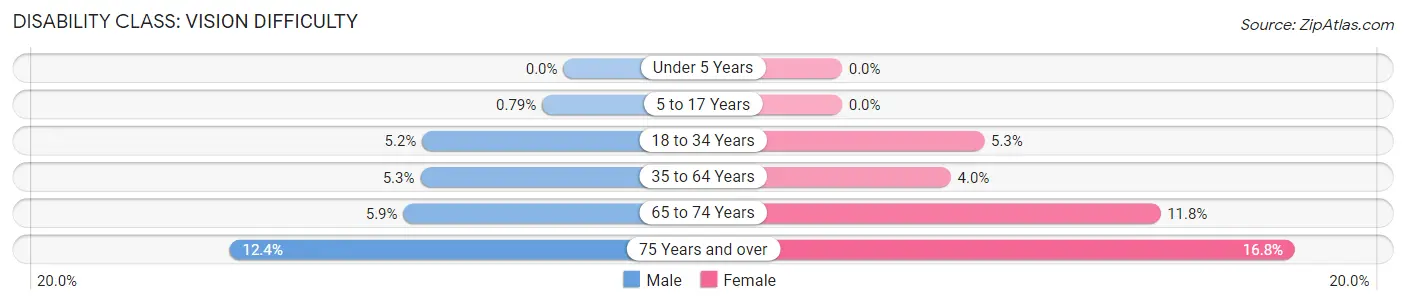
| Age Bracket | Male | Female |
| Under 5 Years | 0 (0.0%) | 0 (0.0%) |
| 5 to 17 Years | 8 (0.8%) | 0 (0.0%) |
| 18 to 34 Years | 62 (5.2%) | 52 (5.3%) |
| 35 to 64 Years | 104 (5.3%) | 74 (4.0%) |
| 65 to 74 Years | 28 (5.9%) | 70 (11.8%) |
| 75 Years and over | 43 (12.4%) | 75 (16.8%) |
Disability Class: Cognitive Difficulty
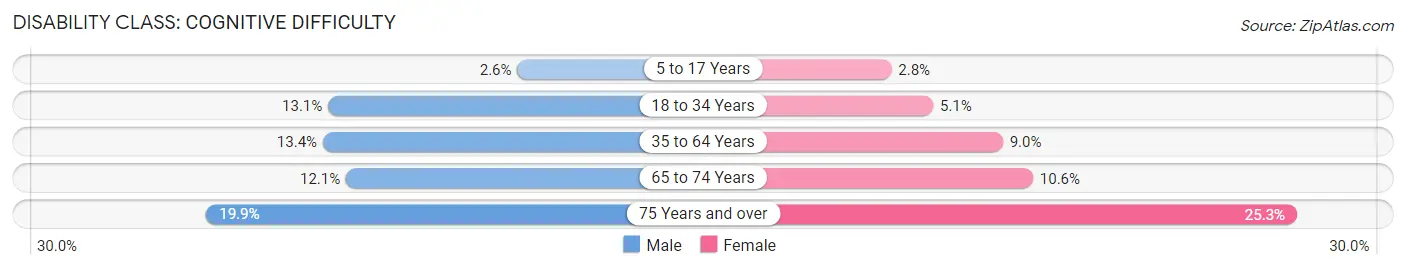
| Age Bracket | Male | Female |
| 5 to 17 Years | 26 (2.6%) | 25 (2.8%) |
| 18 to 34 Years | 155 (13.1%) | 50 (5.1%) |
| 35 to 64 Years | 262 (13.4%) | 164 (9.0%) |
| 65 to 74 Years | 57 (12.1%) | 63 (10.6%) |
| 75 Years and over | 69 (19.9%) | 113 (25.3%) |
Disability Class: Ambulatory Difficulty
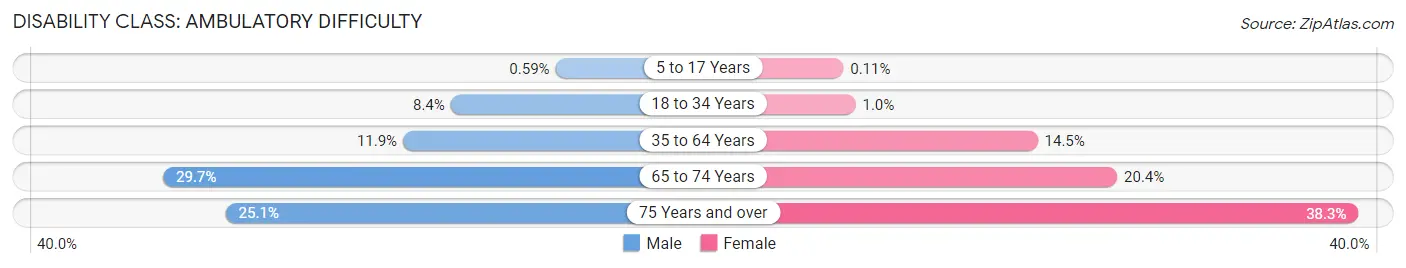
| Age Bracket | Male | Female |
| 5 to 17 Years | 6 (0.6%) | 1 (0.1%) |
| 18 to 34 Years | 99 (8.4%) | 10 (1.0%) |
| 35 to 64 Years | 233 (11.9%) | 266 (14.5%) |
| 65 to 74 Years | 140 (29.7%) | 121 (20.4%) |
| 75 Years and over | 87 (25.1%) | 171 (38.3%) |
Disability Class: Self-Care Difficulty
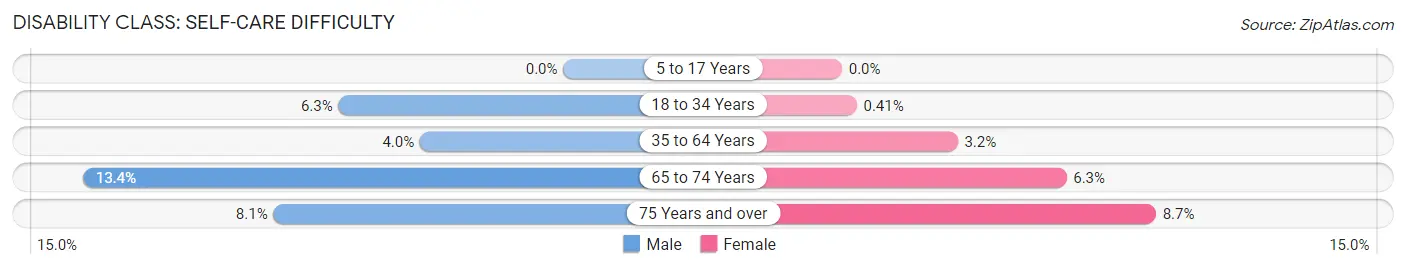
| Age Bracket | Male | Female |
| 5 to 17 Years | 0 (0.0%) | 0 (0.0%) |
| 18 to 34 Years | 74 (6.3%) | 4 (0.4%) |
| 35 to 64 Years | 78 (4.0%) | 59 (3.2%) |
| 65 to 74 Years | 63 (13.4%) | 37 (6.2%) |
| 75 Years and over | 28 (8.1%) | 39 (8.7%) |
Technology Access in Okfuskee County
Computing Device Access in Okfuskee County
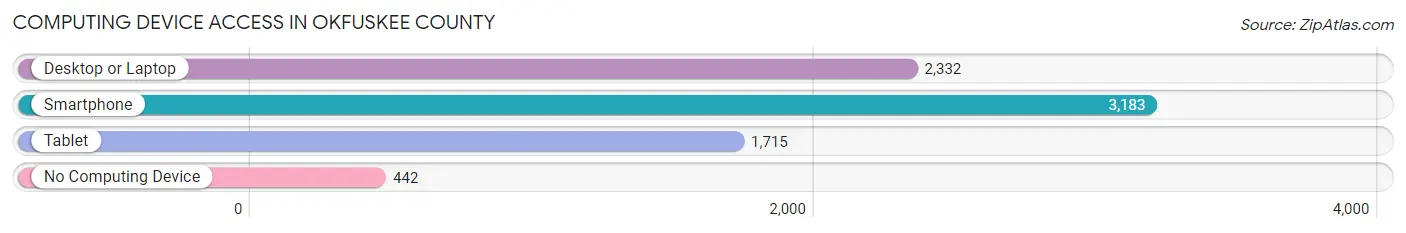
| Device Type | # Households | % Households |
| Desktop or Laptop | 2,332 | 60.2% |
| Smartphone | 3,183 | 82.2% |
| Tablet | 1,715 | 44.3% |
| No Computing Device | 442 | 11.4% |
| Total | 3,871 | 100.0% |
Internet Access in Okfuskee County
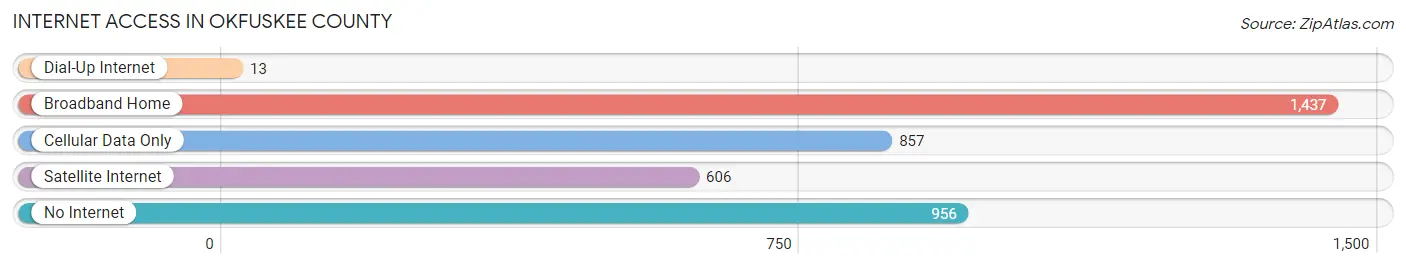
| Internet Type | # Households | % Households |
| Dial-Up Internet | 13 | 0.3% |
| Broadband Home | 1,437 | 37.1% |
| Cellular Data Only | 857 | 22.1% |
| Satellite Internet | 606 | 15.7% |
| No Internet | 956 | 24.7% |
| Total | 3,871 | 100.0% |
Okfuskee County Summary
Okfuskee County is located in the central part of Oklahoma, and is part of the Muskogee-McIntosh-Okfuskee tri-county area. It is bordered by McIntosh County to the north, Hughes County to the east, Seminole County to the south, and Okmulgee County to the west. The county seat is Okemah, and the county is named for the Okfuskee tribe of Muscogee (Creek) Indians.
Geography
Okfuskee County covers an area of 845 square miles, and is located in the rolling hills of the Ozark Plateau. The terrain is mostly flat, with some areas of rolling hills. The county is drained by the Deep Fork River, which flows through the center of the county. The county is also home to several small lakes, including Lake Okemah, Lake Okfuskee, and Lake Eufaula.
The climate of Okfuskee County is characterized by hot, humid summers and mild winters. Average temperatures range from a low of 33°F in January to a high of 92°F in July. Average annual precipitation is around 40 inches.
Demographics
As of the 2010 census, there were 12,191 people, 4,717 households, and 3,323 families living in the county. The population density was 14 people per square mile. The racial makeup of the county was 75.3% White, 15.2% Native American, 0.4% Asian, 0.2% Black or African American, 0.1% Pacific Islander, and 8.8% from other races. Hispanic or Latino of any race were 3.2% of the population.
The median income for a household in the county was $30,945, and the median income for a family was $36,945. The per capita income for the county was $15,845. About 17.2% of families and 21.2% of the population were below the poverty line, including 28.2% of those under age 18 and 16.2% of those age 65 or over.
Economy
The economy of Okfuskee County is largely based on agriculture. The county is home to several large farms, which produce a variety of crops, including corn, soybeans, wheat, and hay. The county is also home to several large cattle ranches.
The county is also home to several small businesses, including restaurants, retail stores, and service providers. The county is also home to several manufacturing companies, including a furniture factory and a plastics factory.
The county is served by two airports, Okemah Municipal Airport and Okfuskee County Airport. The county is also served by several highways, including US Highway 62, US Highway 75, and State Highway 48.
Conclusion
Okfuskee County is a rural county located in the central part of Oklahoma. The county is home to a diverse population, and the economy is largely based on agriculture. The county is served by two airports and several highways, and is home to several small businesses and manufacturing companies.
Common Questions
What is Per Capita Income in Okfuskee County?
Per Capita income in Okfuskee County is $23,052.
What is the Median Family Income in Okfuskee County?
Median Family Income in Okfuskee County is $57,857.
What is the Median Household income in Okfuskee County?
Median Household Income in Okfuskee County is $45,429.
What is Income or Wage Gap in Okfuskee County?
Income or Wage Gap in Okfuskee County is 23.3%.
Women in Okfuskee County earn 76.7 cents for every dollar earned by a man.
What is Family Income Deficit in Okfuskee County?
Family Income Deficit in Okfuskee County is $11,642.
Families that are below poverty line in Okfuskee County earn $11,642 less on average than the poverty threshold level.
What is Inequality or Gini Index in Okfuskee County?
Inequality or Gini Index in Okfuskee County is 0.46.
What is the Total Population of Okfuskee County?
Total Population of Okfuskee County is 11,349.
What is the Total Male Population of Okfuskee County?
Total Male Population of Okfuskee County is 6,190.
What is the Total Female Population of Okfuskee County?
Total Female Population of Okfuskee County is 5,159.
What is the Ratio of Males per 100 Females in Okfuskee County?
There are 119.98 Males per 100 Females in Okfuskee County.
What is the Ratio of Females per 100 Males in Okfuskee County?
There are 83.34 Females per 100 Males in Okfuskee County.
What is the Median Population Age in Okfuskee County?
Median Population Age in Okfuskee County is 40.1 Years.
What is the Average Family Size in Okfuskee County
Average Family Size in Okfuskee County is 3.1 People.
What is the Average Household Size in Okfuskee County
Average Household Size in Okfuskee County is 2.6 People.
How Large is the Labor Force in Okfuskee County?
There are 4,025 People in the Labor Forcein in Okfuskee County.
What is the Percentage of People in the Labor Force in Okfuskee County?
44.3% of People are in the Labor Force in Okfuskee County.
What is the Unemployment Rate in Okfuskee County?
Unemployment Rate in Okfuskee County is 3.5%.