McCurtain County, OK Map & Demographics
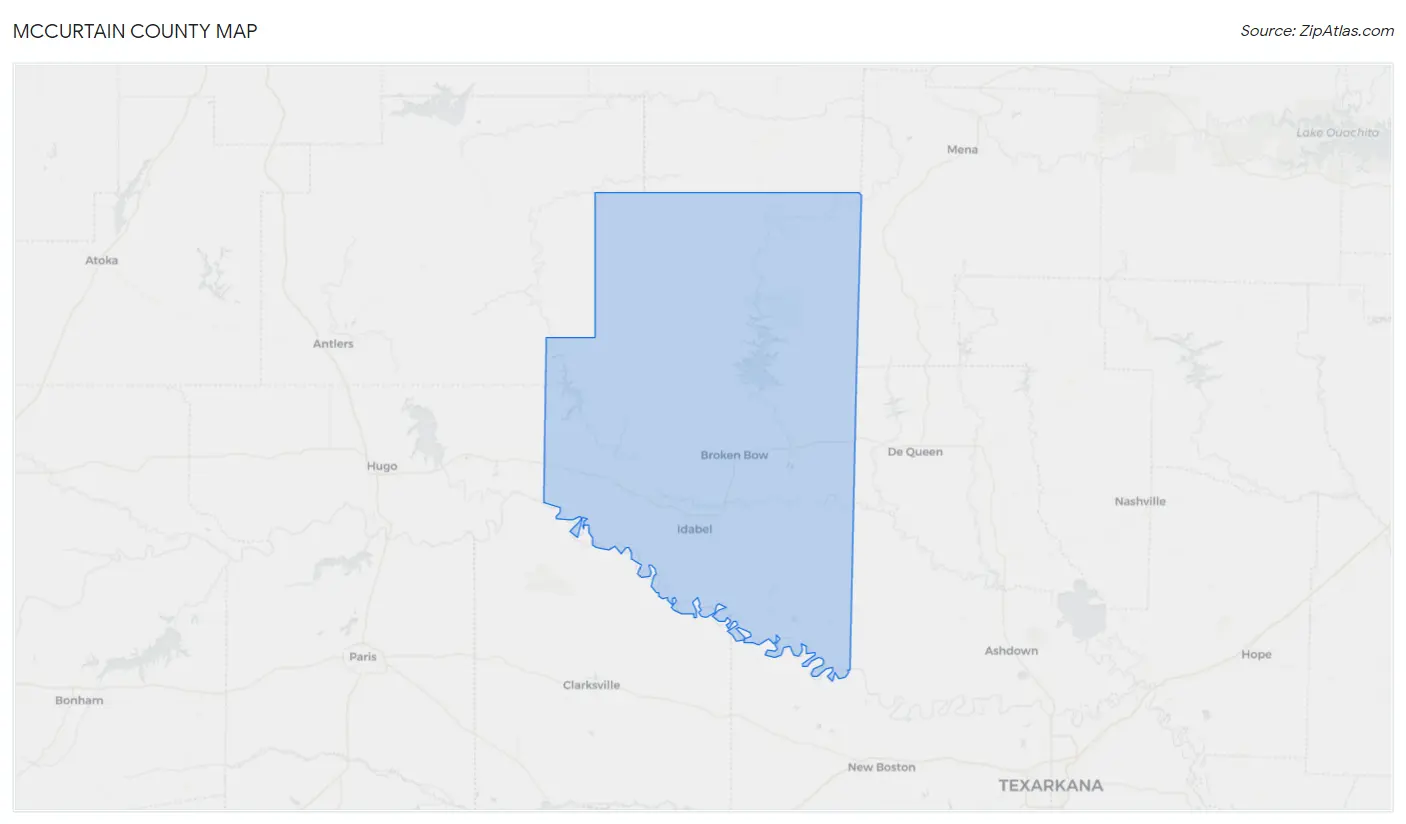
McCurtain County Map
McCurtain County Overview
$24,635
PER CAPITA INCOME
$60,760
AVG FAMILY INCOME
$47,046
AVG HOUSEHOLD INCOME
29.4%
WAGE / INCOME GAP [ % ]
70.6¢/ $1
WAGE / INCOME GAP [ $ ]
$11,454
FAMILY INCOME DEFICIT
0.46
INEQUALITY / GINI INDEX
31,003
TOTAL POPULATION
15,366
MALE POPULATION
15,637
FEMALE POPULATION
98.27
MALES / 100 FEMALES
101.76
FEMALES / 100 MALES
38.2
MEDIAN AGE
3.4
AVG FAMILY SIZE
2.7
AVG HOUSEHOLD SIZE
12,977
LABOR FORCE [ PEOPLE ]
54.6%
PERCENT IN LABOR FORCE
4.9%
UNEMPLOYMENT RATE
Income in McCurtain County
Income Overview in McCurtain County
Per Capita Income in McCurtain County is $24,635, while median incomes of families and households are $60,760 and $47,046 respectively.
| Characteristic | Number | Measure |
| Per Capita Income | 31,003 | $24,635 |
| Median Family Income | 7,661 | $60,760 |
| Mean Family Income | 7,661 | $74,171 |
| Median Household Income | 11,267 | $47,046 |
| Mean Household Income | 11,267 | $63,481 |
| Income Deficit | 7,661 | $11,454 |
| Wage / Income Gap (%) | 31,003 | 29.36% |
| Wage / Income Gap ($) | 31,003 | 70.64¢ per $1 |
| Gini / Inequality Index | 31,003 | 0.46 |
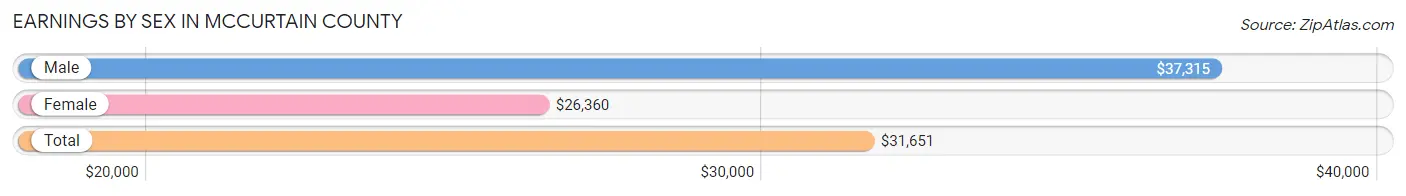
Earnings by Sex in McCurtain County
Average Earnings in McCurtain County are $31,651, $37,315 for men and $26,360 for women, a difference of 29.4%.
| Sex | Number | Average Earnings |
| Male | 7,321 (54.1%) | $37,315 |
| Female | 6,206 (45.9%) | $26,360 |
| Total | 13,527 (100.0%) | $31,651 |
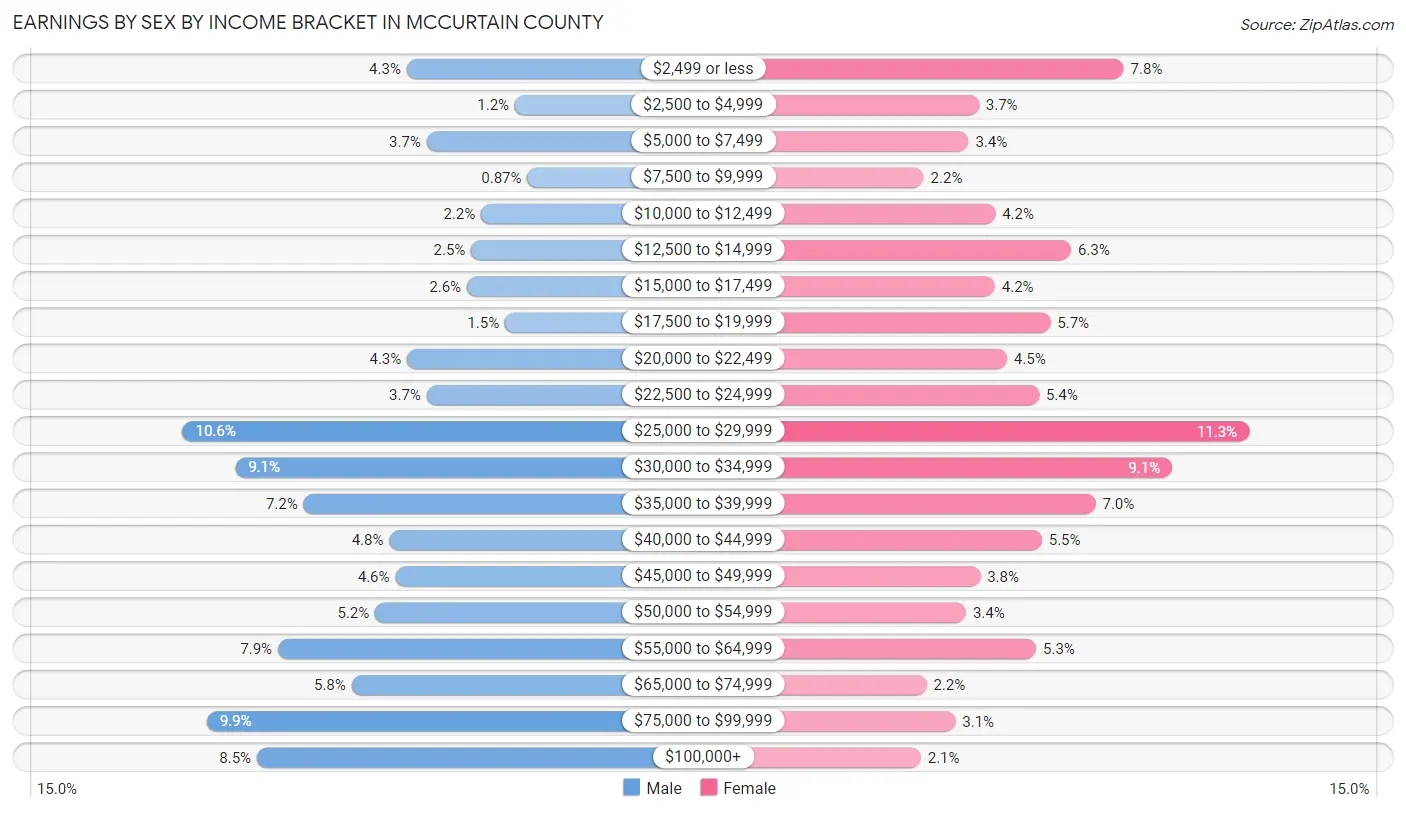
Earnings by Sex by Income Bracket in McCurtain County
The most common earnings brackets in McCurtain County are $25,000 to $29,999 for men (773 | 10.6%) and $25,000 to $29,999 for women (701 | 11.3%).
| Income | Male | Female |
| $2,499 or less | 312 (4.3%) | 483 (7.8%) |
| $2,500 to $4,999 | 89 (1.2%) | 230 (3.7%) |
| $5,000 to $7,499 | 271 (3.7%) | 212 (3.4%) |
| $7,500 to $9,999 | 64 (0.9%) | 134 (2.2%) |
| $10,000 to $12,499 | 159 (2.2%) | 259 (4.2%) |
| $12,500 to $14,999 | 179 (2.5%) | 391 (6.3%) |
| $15,000 to $17,499 | 188 (2.6%) | 258 (4.2%) |
| $17,500 to $19,999 | 110 (1.5%) | 355 (5.7%) |
| $20,000 to $22,499 | 311 (4.3%) | 279 (4.5%) |
| $22,500 to $24,999 | 271 (3.7%) | 335 (5.4%) |
| $25,000 to $29,999 | 773 (10.6%) | 701 (11.3%) |
| $30,000 to $34,999 | 665 (9.1%) | 567 (9.1%) |
| $35,000 to $39,999 | 524 (7.2%) | 434 (7.0%) |
| $40,000 to $44,999 | 348 (4.8%) | 340 (5.5%) |
| $45,000 to $49,999 | 335 (4.6%) | 233 (3.7%) |
| $50,000 to $54,999 | 377 (5.1%) | 208 (3.4%) |
| $55,000 to $64,999 | 577 (7.9%) | 330 (5.3%) |
| $65,000 to $74,999 | 425 (5.8%) | 139 (2.2%) |
| $75,000 to $99,999 | 723 (9.9%) | 189 (3.0%) |
| $100,000+ | 620 (8.5%) | 129 (2.1%) |
| Total | 7,321 (100.0%) | 6,206 (100.0%) |
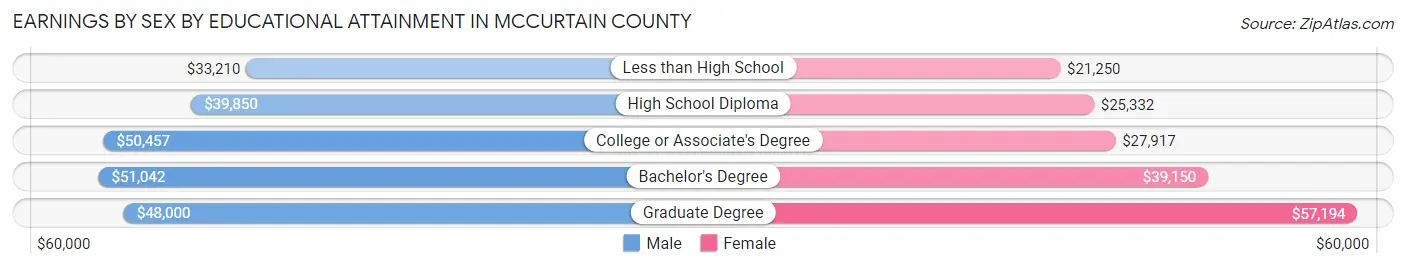
Earnings by Sex by Educational Attainment in McCurtain County
Average earnings in McCurtain County are $42,013 for men and $28,937 for women, a difference of 31.1%. Men with an educational attainment of bachelor's degree enjoy the highest average annual earnings of $51,042, while those with less than high school education earn the least with $33,210. Women with an educational attainment of graduate degree earn the most with the average annual earnings of $57,194, while those with less than high school education have the smallest earnings of $21,250.
| Educational Attainment | Male Income | Female Income |
| Less than High School | $33,210 | $21,250 |
| High School Diploma | $39,850 | $25,332 |
| College or Associate's Degree | $50,457 | $27,917 |
| Bachelor's Degree | $51,042 | $39,150 |
| Graduate Degree | $48,000 | $57,194 |
| Total | $42,013 | $28,937 |
Family Income in McCurtain County
Family Income Brackets in McCurtain County
According to the McCurtain County family income data, there are 1,517 families falling into the $50,000 to $74,999 income range, which is the most common income bracket and makes up 19.8% of all families. Conversely, the $200,000+ income bracket is the least frequent group with only 199 families (2.6%) belonging to this category.
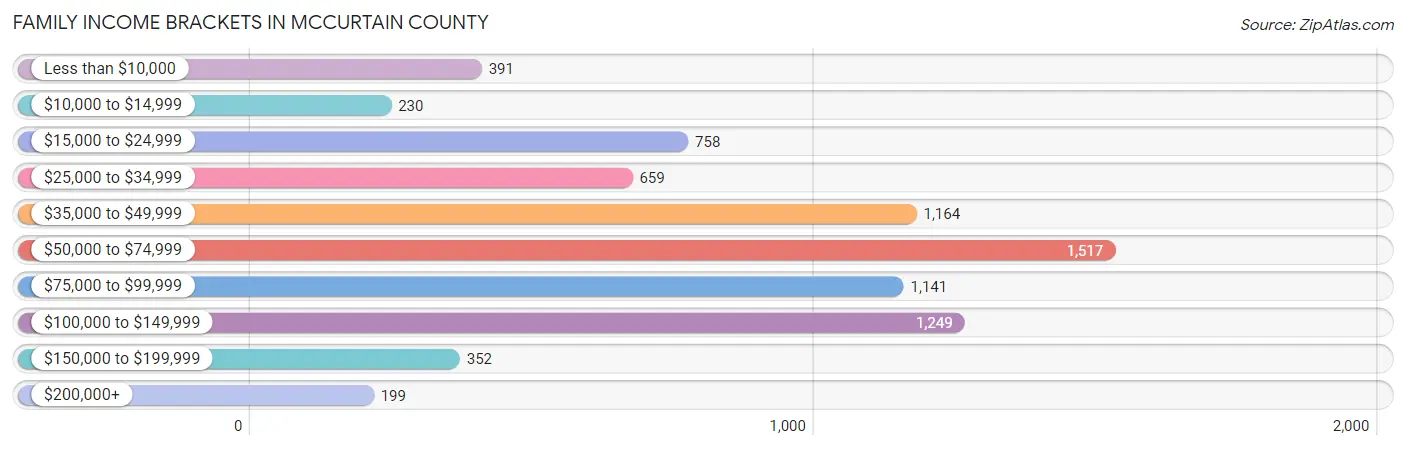
| Income Bracket | # Families | % Families |
| Less than $10,000 | 391 | 5.1% |
| $10,000 to $14,999 | 230 | 3.0% |
| $15,000 to $24,999 | 758 | 9.9% |
| $25,000 to $34,999 | 659 | 8.6% |
| $35,000 to $49,999 | 1,164 | 15.2% |
| $50,000 to $74,999 | 1,517 | 19.8% |
| $75,000 to $99,999 | 1,141 | 14.9% |
| $100,000 to $149,999 | 1,249 | 16.3% |
| $150,000 to $199,999 | 352 | 4.6% |
| $200,000+ | 199 | 2.6% |
Family Income by Famaliy Size in McCurtain County
3-person families (1,791 | 23.4%) account for the highest median family income in McCurtain County with $65,792 per family, while 2-person families (3,540 | 46.2%) have the highest median income of $28,135 per family member.
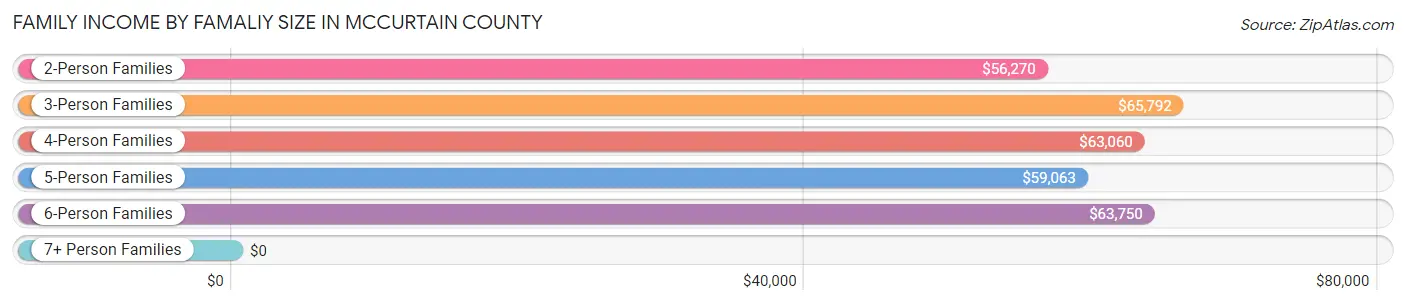
| Income Bracket | # Families | Median Income |
| 2-Person Families | 3,540 (46.2%) | $56,270 |
| 3-Person Families | 1,791 (23.4%) | $65,792 |
| 4-Person Families | 1,107 (14.4%) | $63,060 |
| 5-Person Families | 561 (7.3%) | $59,063 |
| 6-Person Families | 447 (5.8%) | $63,750 |
| 7+ Person Families | 215 (2.8%) | $0 |
| Total | 7,661 (100.0%) | $60,760 |
Family Income by Number of Earners in McCurtain County
The median family income in McCurtain County is $60,760, with families comprising 3+ earners (483) having the highest median family income of $110,243, while families with no earners (1,563) have the lowest median family income of $31,250, accounting for 6.3% and 20.4% of families, respectively.
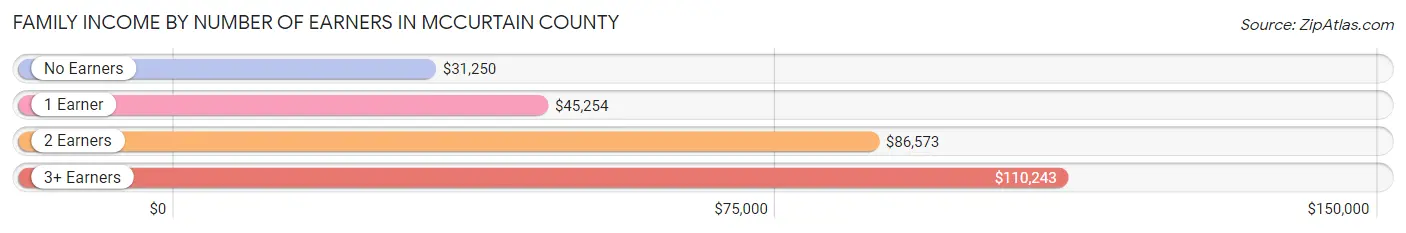
| Number of Earners | # Families | Median Income |
| No Earners | 1,563 (20.4%) | $31,250 |
| 1 Earner | 2,844 (37.1%) | $45,254 |
| 2 Earners | 2,771 (36.2%) | $86,573 |
| 3+ Earners | 483 (6.3%) | $110,243 |
| Total | 7,661 (100.0%) | $60,760 |
Household Income in McCurtain County
Household Income Brackets in McCurtain County
With 2,107 households falling in the category, the $50,000 to $74,999 income range is the most frequent in McCurtain County, accounting for 18.7% of all households. In contrast, only 259 households (2.3%) fall into the $200,000+ income bracket, making it the least populous group.
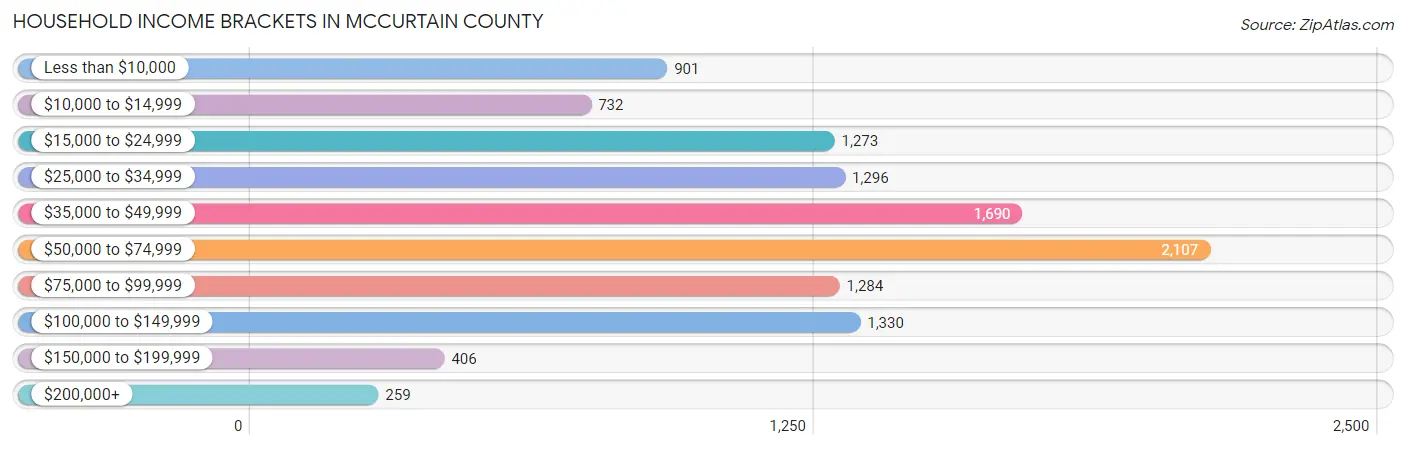
| Income Bracket | # Households | % Households |
| Less than $10,000 | 901 | 8.0% |
| $10,000 to $14,999 | 732 | 6.5% |
| $15,000 to $24,999 | 1,273 | 11.3% |
| $25,000 to $34,999 | 1,296 | 11.5% |
| $35,000 to $49,999 | 1,690 | 15.0% |
| $50,000 to $74,999 | 2,107 | 18.7% |
| $75,000 to $99,999 | 1,284 | 11.4% |
| $100,000 to $149,999 | 1,330 | 11.8% |
| $150,000 to $199,999 | 406 | 3.6% |
| $200,000+ | 259 | 2.3% |
Household Income by Householder Age in McCurtain County
The median household income in McCurtain County is $47,046, with the highest median household income of $56,222 found in the 45 to 64 years age bracket for the primary householder. A total of 4,225 households (37.5%) fall into this category. Meanwhile, the 65+ years age bracket for the primary householder has the lowest median household income of $34,972, with 3,647 households (32.4%) in this group.
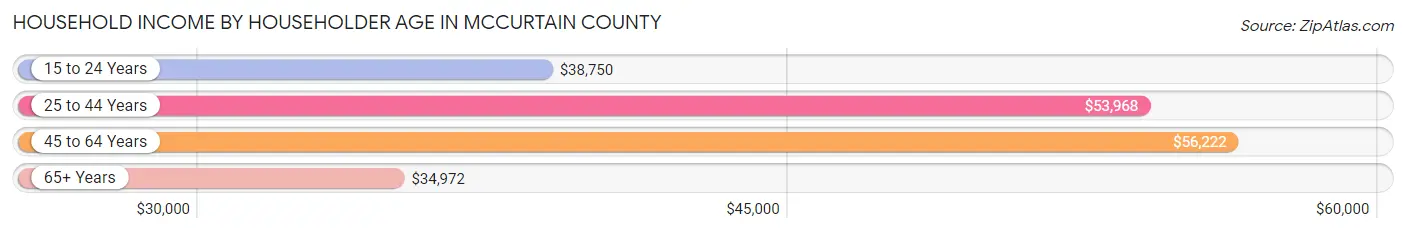
| Income Bracket | # Households | Median Income |
| 15 to 24 Years | 443 (3.9%) | $38,750 |
| 25 to 44 Years | 2,952 (26.2%) | $53,968 |
| 45 to 64 Years | 4,225 (37.5%) | $56,222 |
| 65+ Years | 3,647 (32.4%) | $34,972 |
| Total | 11,267 (100.0%) | $47,046 |
Poverty in McCurtain County
Income Below Poverty by Sex and Age in McCurtain County
With 19.8% poverty level for males and 22.4% for females among the residents of McCurtain County, 15 year old males and 5 year old females are the most vulnerable to poverty, with 110 males (40.0%) and 108 females (39.1%) in their respective age groups living below the poverty level.
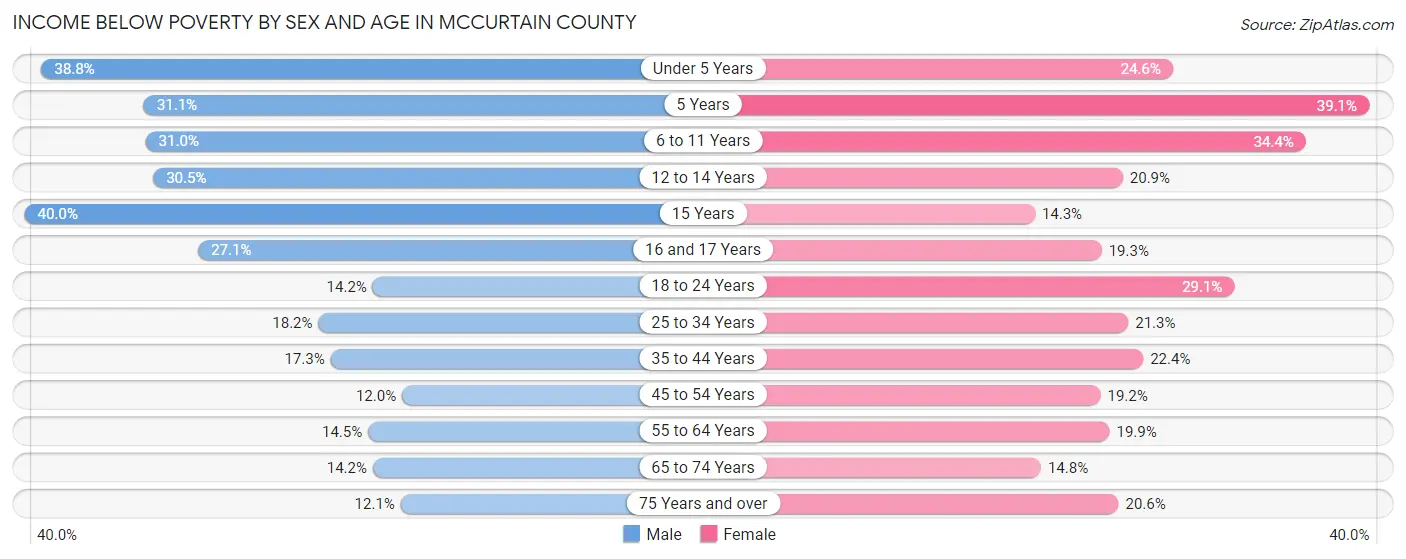
| Age Bracket | Male | Female |
| Under 5 Years | 415 (38.8%) | 259 (24.6%) |
| 5 Years | 71 (31.1%) | 108 (39.1%) |
| 6 to 11 Years | 441 (31.0%) | 468 (34.4%) |
| 12 to 14 Years | 208 (30.4%) | 115 (20.9%) |
| 15 Years | 110 (40.0%) | 36 (14.3%) |
| 16 and 17 Years | 106 (27.1%) | 72 (19.3%) |
| 18 to 24 Years | 187 (14.2%) | 372 (29.1%) |
| 25 to 34 Years | 331 (18.2%) | 398 (21.3%) |
| 35 to 44 Years | 291 (17.3%) | 401 (22.4%) |
| 45 to 54 Years | 215 (12.0%) | 352 (19.2%) |
| 55 to 64 Years | 276 (14.5%) | 397 (19.9%) |
| 65 to 74 Years | 211 (14.1%) | 242 (14.8%) |
| 75 Years and over | 123 (12.1%) | 255 (20.5%) |
| Total | 2,985 (19.8%) | 3,475 (22.4%) |
Income Above Poverty by Sex and Age in McCurtain County
According to the poverty statistics in McCurtain County, males aged 45 to 54 years and females aged 15 years are the age groups that are most secure financially, with 88.0% of males and 85.7% of females in these age groups living above the poverty line.
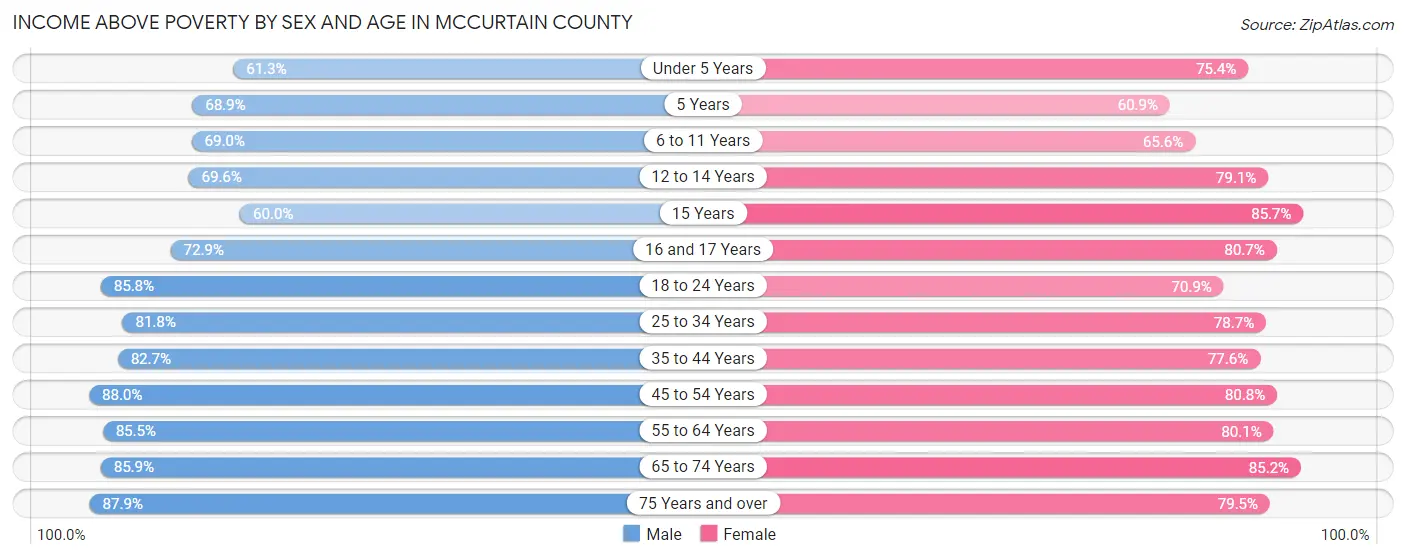
| Age Bracket | Male | Female |
| Under 5 Years | 656 (61.3%) | 795 (75.4%) |
| 5 Years | 157 (68.9%) | 168 (60.9%) |
| 6 to 11 Years | 981 (69.0%) | 891 (65.6%) |
| 12 to 14 Years | 475 (69.6%) | 436 (79.1%) |
| 15 Years | 165 (60.0%) | 215 (85.7%) |
| 16 and 17 Years | 285 (72.9%) | 301 (80.7%) |
| 18 to 24 Years | 1,134 (85.8%) | 905 (70.9%) |
| 25 to 34 Years | 1,489 (81.8%) | 1,473 (78.7%) |
| 35 to 44 Years | 1,392 (82.7%) | 1,391 (77.6%) |
| 45 to 54 Years | 1,580 (88.0%) | 1,480 (80.8%) |
| 55 to 64 Years | 1,627 (85.5%) | 1,600 (80.1%) |
| 65 to 74 Years | 1,280 (85.9%) | 1,394 (85.2%) |
| 75 Years and over | 895 (87.9%) | 986 (79.4%) |
| Total | 12,116 (80.2%) | 12,035 (77.6%) |
Income Below Poverty Among Married-Couple Families in McCurtain County
The poverty statistics for married-couple families in McCurtain County show that 8.1% or 435 of the total 5,350 families live below the poverty line. Families with 5 or more children have the highest poverty rate of 37.5%, comprising of 39 families. On the other hand, families with no children have the lowest poverty rate of 4.5%, which includes 137 families.
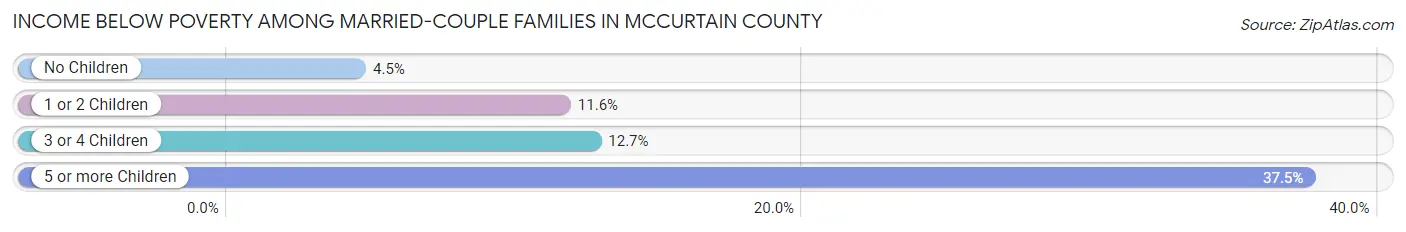
| Children | Above Poverty | Below Poverty |
| No Children | 2,935 (95.5%) | 137 (4.5%) |
| 1 or 2 Children | 1,342 (88.4%) | 176 (11.6%) |
| 3 or 4 Children | 573 (87.4%) | 83 (12.7%) |
| 5 or more Children | 65 (62.5%) | 39 (37.5%) |
| Total | 4,915 (91.9%) | 435 (8.1%) |
Income Below Poverty Among Single-Parent Households in McCurtain County
According to the poverty data in McCurtain County, 18.4% or 110 single-father households and 43.1% or 739 single-mother households are living below the poverty line. Among single-father households, those with 1 or 2 children have the highest poverty rate, with 78 households (31.8%) experiencing poverty. Likewise, among single-mother households, those with 5 or more children have the highest poverty rate, with 20 households (100.0%) falling below the poverty line.
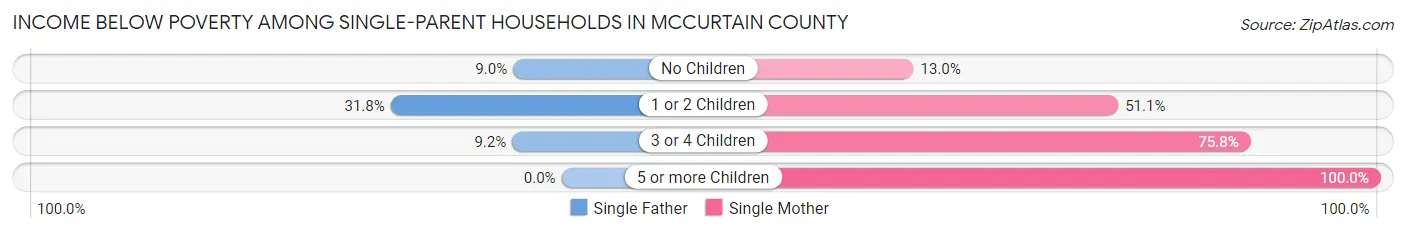
| Children | Single Father | Single Mother |
| No Children | 25 (9.0%) | 72 (13.0%) |
| 1 or 2 Children | 78 (31.8%) | 450 (51.1%) |
| 3 or 4 Children | 7 (9.2%) | 197 (75.8%) |
| 5 or more Children | 0 (0.0%) | 20 (100.0%) |
| Total | 110 (18.4%) | 739 (43.1%) |
Income Below Poverty Among Married-Couple vs Single-Parent Households in McCurtain County
The poverty data for McCurtain County shows that 435 of the married-couple family households (8.1%) and 849 of the single-parent households (36.7%) are living below the poverty level. Within the married-couple family households, those with 5 or more children have the highest poverty rate, with 39 households (37.5%) falling below the poverty line. Among the single-parent households, those with 5 or more children have the highest poverty rate, with 20 household (100.0%) living below poverty.
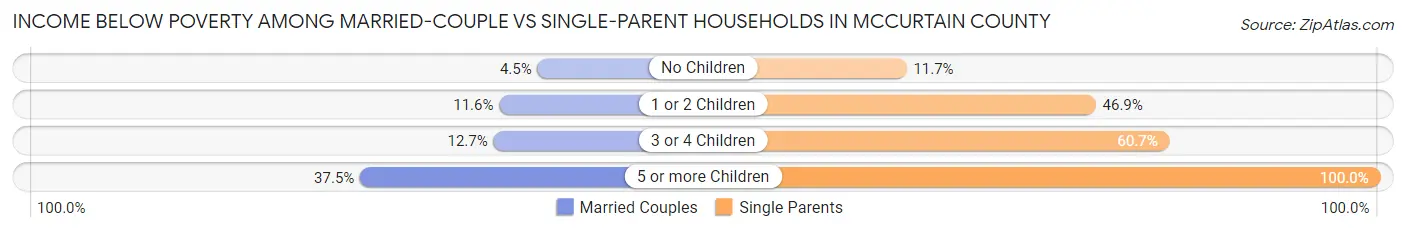
| Children | Married-Couple Families | Single-Parent Households |
| No Children | 137 (4.5%) | 97 (11.7%) |
| 1 or 2 Children | 176 (11.6%) | 528 (46.9%) |
| 3 or 4 Children | 83 (12.7%) | 204 (60.7%) |
| 5 or more Children | 39 (37.5%) | 20 (100.0%) |
| Total | 435 (8.1%) | 849 (36.7%) |
Race in McCurtain County
The most populous races in McCurtain County are White / Caucasian (18,987 | 61.2%), Native / Alaskan (4,383 | 14.1%), and Two or more Races (3,686 | 11.9%).
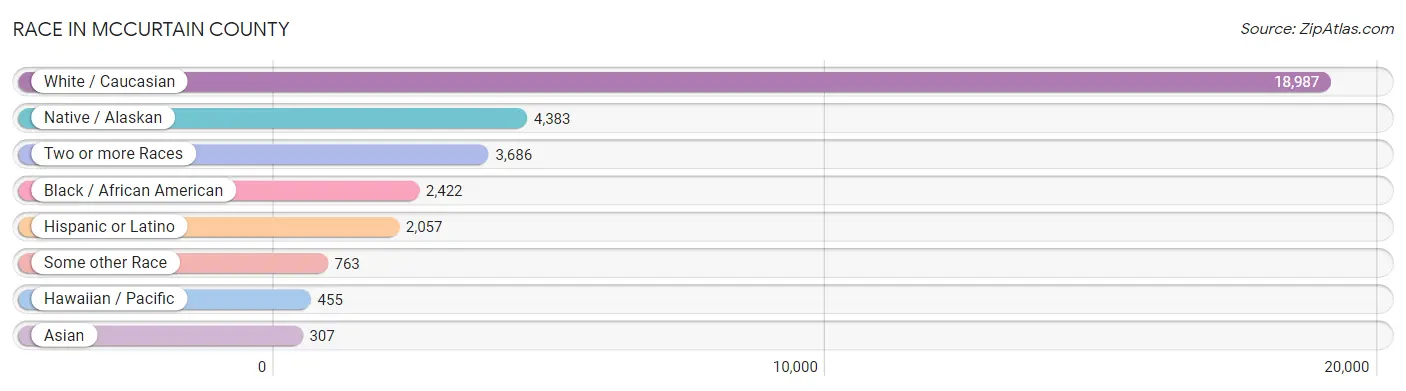
| Race | # Population | % Population |
| Asian | 307 | 1.0% |
| Black / African American | 2,422 | 7.8% |
| Hawaiian / Pacific | 455 | 1.5% |
| Hispanic or Latino | 2,057 | 6.6% |
| Native / Alaskan | 4,383 | 14.1% |
| White / Caucasian | 18,987 | 61.2% |
| Two or more Races | 3,686 | 11.9% |
| Some other Race | 763 | 2.5% |
| Total | 31,003 | 100.0% |
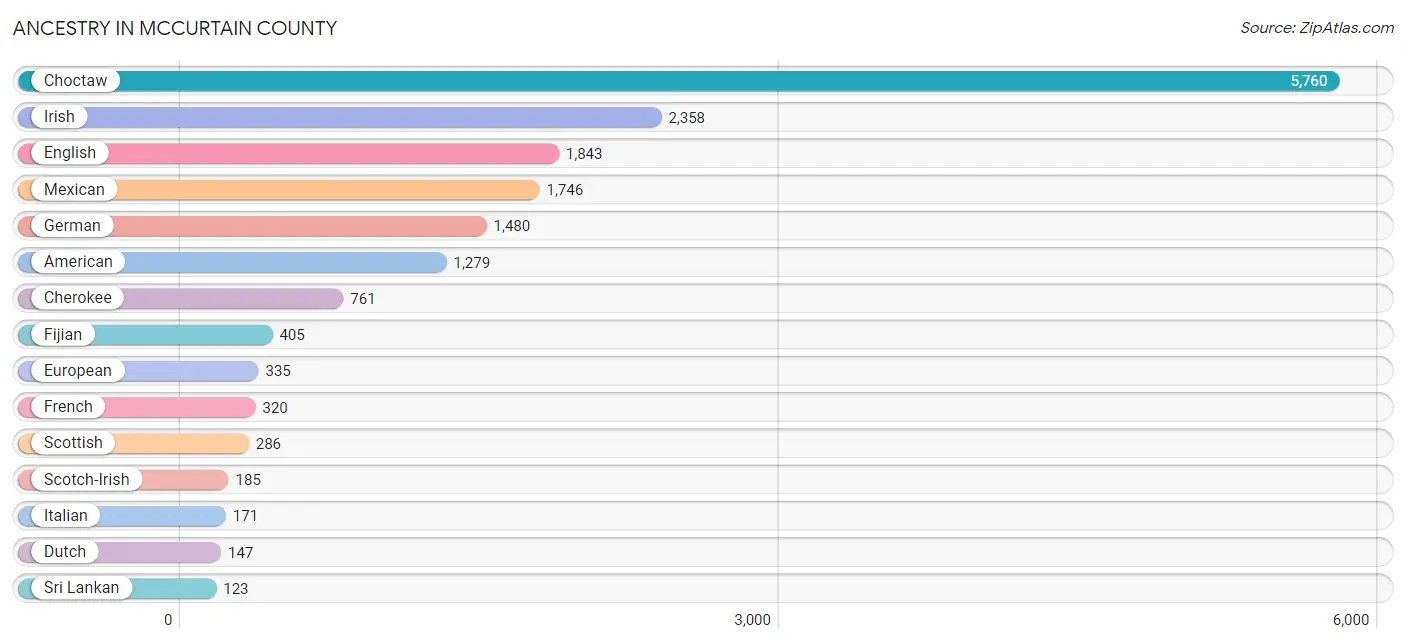
Ancestry in McCurtain County
The most populous ancestries reported in McCurtain County are Choctaw (5,760 | 18.6%), Irish (2,358 | 7.6%), English (1,843 | 5.9%), Mexican (1,746 | 5.6%), and German (1,480 | 4.8%), together accounting for 42.5% of all McCurtain County residents.
| Ancestry | # Population | % Population |
| African | 65 | 0.2% |
| American | 1,279 | 4.1% |
| Apache | 6 | 0.0% |
| Arapaho | 36 | 0.1% |
| Austrian | 4 | 0.0% |
| Belizean | 21 | 0.1% |
| Bhutanese | 17 | 0.1% |
| Blackfeet | 4 | 0.0% |
| Brazilian | 5 | 0.0% |
| British | 67 | 0.2% |
| Canadian | 41 | 0.1% |
| Central American | 31 | 0.1% |
| Cherokee | 761 | 2.5% |
| Chickasaw | 110 | 0.4% |
| Choctaw | 5,760 | 18.6% |
| Colombian | 4 | 0.0% |
| Comanche | 20 | 0.1% |
| Creek | 57 | 0.2% |
| Croatian | 44 | 0.1% |
| Cuban | 25 | 0.1% |
| Czech | 3 | 0.0% |
| Danish | 11 | 0.0% |
| Dutch | 147 | 0.5% |
| Dutch West Indian | 109 | 0.4% |
| Eastern European | 1 | 0.0% |
| English | 1,843 | 5.9% |
| European | 335 | 1.1% |
| Fijian | 405 | 1.3% |
| Filipino | 5 | 0.0% |
| French | 320 | 1.0% |
| French Canadian | 53 | 0.2% |
| German | 1,480 | 4.8% |
| Greek | 7 | 0.0% |
| Guamanian / Chamorro | 19 | 0.1% |
| Guatemalan | 24 | 0.1% |
| Indian (Asian) | 6 | 0.0% |
| Iranian | 4 | 0.0% |
| Irish | 2,358 | 7.6% |
| Iroquois | 10 | 0.0% |
| Italian | 171 | 0.5% |
| Japanese | 28 | 0.1% |
| Kiowa | 19 | 0.1% |
| Korean | 104 | 0.3% |
| Malaysian | 89 | 0.3% |
| Mexican | 1,746 | 5.6% |
| Navajo | 34 | 0.1% |
| Nigerian | 11 | 0.0% |
| Northern European | 3 | 0.0% |
| Norwegian | 61 | 0.2% |
| Peruvian | 12 | 0.0% |
| Polish | 46 | 0.2% |
| Portuguese | 68 | 0.2% |
| Potawatomi | 5 | 0.0% |
| Pueblo | 2 | 0.0% |
| Puerto Rican | 85 | 0.3% |
| Romanian | 5 | 0.0% |
| Russian | 62 | 0.2% |
| Salvadoran | 7 | 0.0% |
| Samoan | 4 | 0.0% |
| Scandinavian | 23 | 0.1% |
| Scotch-Irish | 185 | 0.6% |
| Scottish | 286 | 0.9% |
| Seminole | 38 | 0.1% |
| Shoshone | 24 | 0.1% |
| Sioux | 32 | 0.1% |
| South African | 3 | 0.0% |
| South American | 71 | 0.2% |
| Spaniard | 29 | 0.1% |
| Sri Lankan | 123 | 0.4% |
| Subsaharan African | 79 | 0.3% |
| Swedish | 82 | 0.3% |
| Swiss | 9 | 0.0% |
| Thai | 9 | 0.0% |
| U.S. Virgin Islander | 14 | 0.1% |
| Ukrainian | 18 | 0.1% |
| Venezuelan | 55 | 0.2% |
| Welsh | 103 | 0.3% |
| West Indian | 13 | 0.0% | View All 78 Rows |
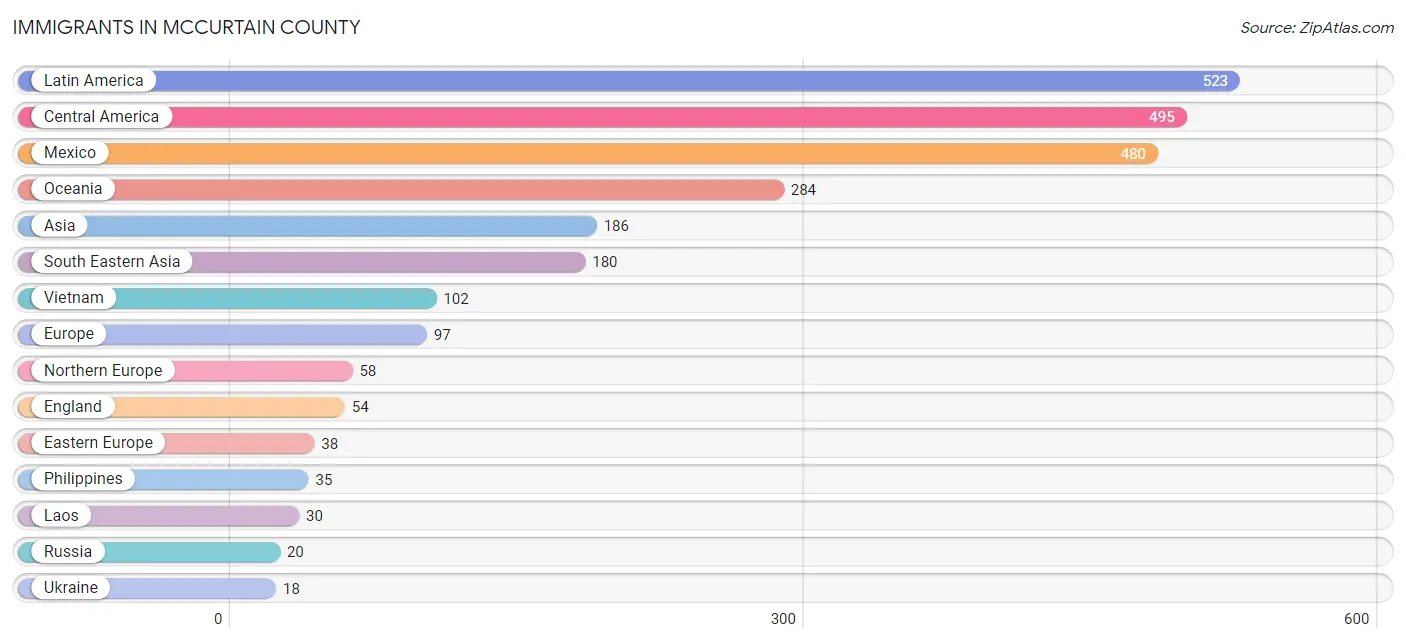
Immigrants in McCurtain County
The most numerous immigrant groups reported in McCurtain County came from Latin America (523 | 1.7%), Central America (495 | 1.6%), Mexico (480 | 1.5%), Oceania (284 | 0.9%), and Asia (186 | 0.6%), together accounting for 6.4% of all McCurtain County residents.
| Immigration Origin | # Population | % Population |
| Asia | 186 | 0.6% |
| Belize | 13 | 0.0% |
| Brazil | 3 | 0.0% |
| Cambodia | 13 | 0.0% |
| Canada | 6 | 0.0% |
| Caribbean | 13 | 0.0% |
| Central America | 495 | 1.6% |
| China | 6 | 0.0% |
| Cuba | 13 | 0.0% |
| Eastern Asia | 6 | 0.0% |
| Eastern Europe | 38 | 0.1% |
| El Salvador | 2 | 0.0% |
| England | 54 | 0.2% |
| Europe | 97 | 0.3% |
| Ireland | 4 | 0.0% |
| Laos | 30 | 0.1% |
| Latin America | 523 | 1.7% |
| Mexico | 480 | 1.5% |
| Netherlands | 1 | 0.0% |
| Northern Europe | 58 | 0.2% |
| Oceania | 284 | 0.9% |
| Peru | 12 | 0.0% |
| Philippines | 35 | 0.1% |
| Russia | 20 | 0.1% |
| South America | 15 | 0.1% |
| South Eastern Asia | 180 | 0.6% |
| Ukraine | 18 | 0.1% |
| Vietnam | 102 | 0.3% |
| Western Europe | 1 | 0.0% | View All 29 Rows |
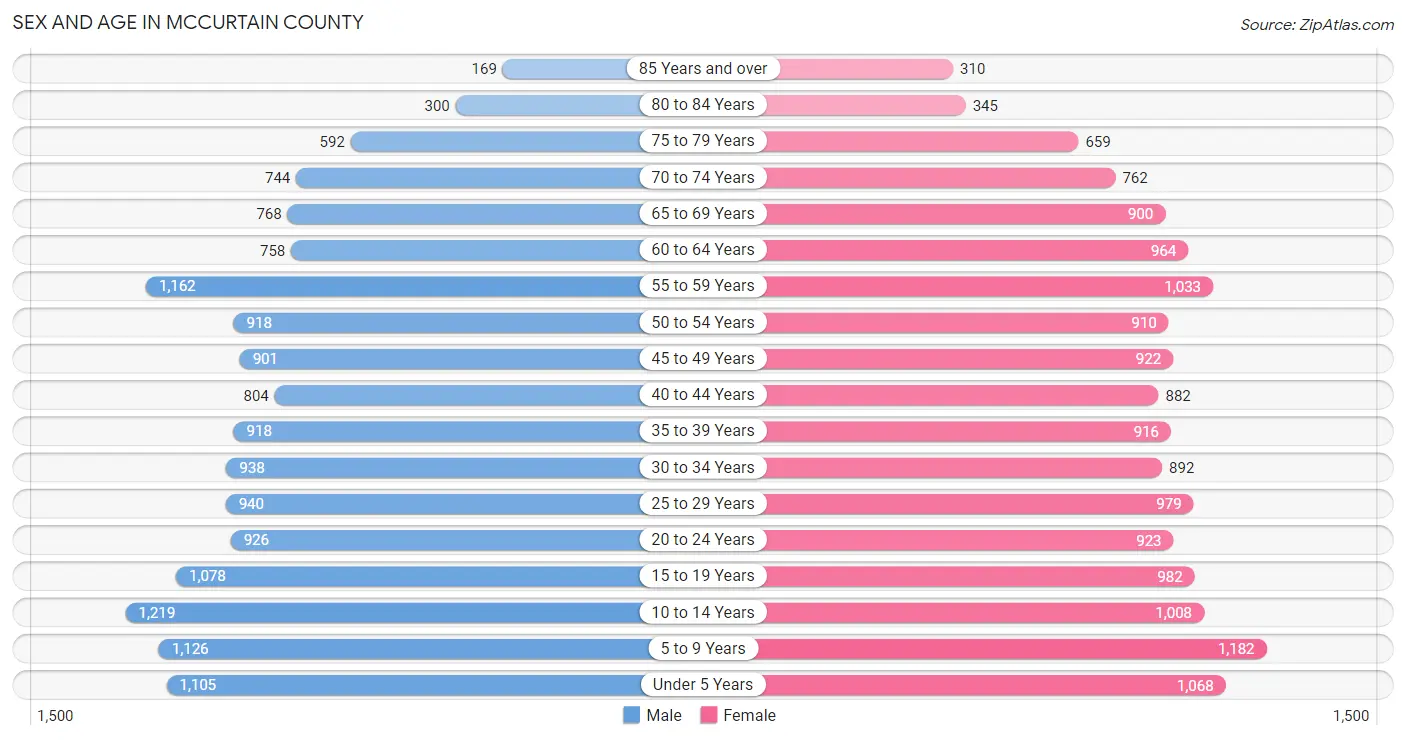
Sex and Age in McCurtain County
Sex and Age in McCurtain County
The most populous age groups in McCurtain County are 10 to 14 Years (1,219 | 7.9%) for men and 5 to 9 Years (1,182 | 7.6%) for women.
| Age Bracket | Male | Female |
| Under 5 Years | 1,105 (7.2%) | 1,068 (6.8%) |
| 5 to 9 Years | 1,126 (7.3%) | 1,182 (7.6%) |
| 10 to 14 Years | 1,219 (7.9%) | 1,008 (6.5%) |
| 15 to 19 Years | 1,078 (7.0%) | 982 (6.3%) |
| 20 to 24 Years | 926 (6.0%) | 923 (5.9%) |
| 25 to 29 Years | 940 (6.1%) | 979 (6.3%) |
| 30 to 34 Years | 938 (6.1%) | 892 (5.7%) |
| 35 to 39 Years | 918 (6.0%) | 916 (5.9%) |
| 40 to 44 Years | 804 (5.2%) | 882 (5.6%) |
| 45 to 49 Years | 901 (5.9%) | 922 (5.9%) |
| 50 to 54 Years | 918 (6.0%) | 910 (5.8%) |
| 55 to 59 Years | 1,162 (7.6%) | 1,033 (6.6%) |
| 60 to 64 Years | 758 (4.9%) | 964 (6.2%) |
| 65 to 69 Years | 768 (5.0%) | 900 (5.8%) |
| 70 to 74 Years | 744 (4.8%) | 762 (4.9%) |
| 75 to 79 Years | 592 (3.8%) | 659 (4.2%) |
| 80 to 84 Years | 300 (1.9%) | 345 (2.2%) |
| 85 Years and over | 169 (1.1%) | 310 (2.0%) |
| Total | 15,366 (100.0%) | 15,637 (100.0%) |
Families and Households in McCurtain County
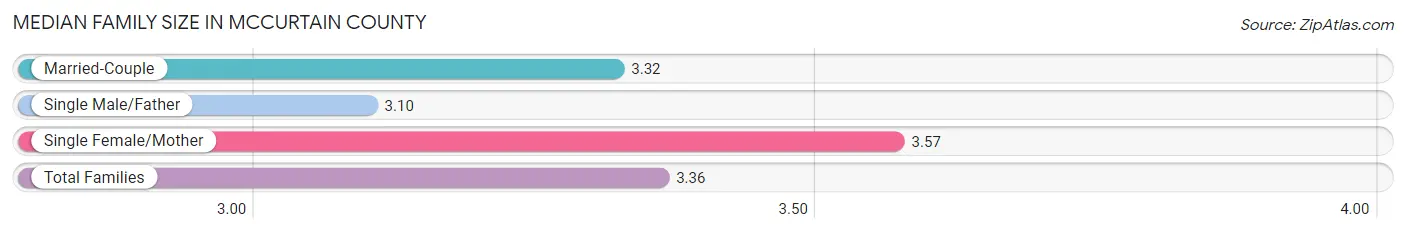
Median Family Size in McCurtain County
The median family size in McCurtain County is 3.36 persons per family, with single female/mother families (1,713 | 22.4%) accounting for the largest median family size of 3.57 persons per family. On the other hand, single male/father families (598 | 7.8%) represent the smallest median family size with 3.10 persons per family.
| Family Type | # Families | Family Size |
| Married-Couple | 5,350 (69.8%) | 3.32 |
| Single Male/Father | 598 (7.8%) | 3.10 |
| Single Female/Mother | 1,713 (22.4%) | 3.57 |
| Total Families | 7,661 (100.0%) | 3.36 |
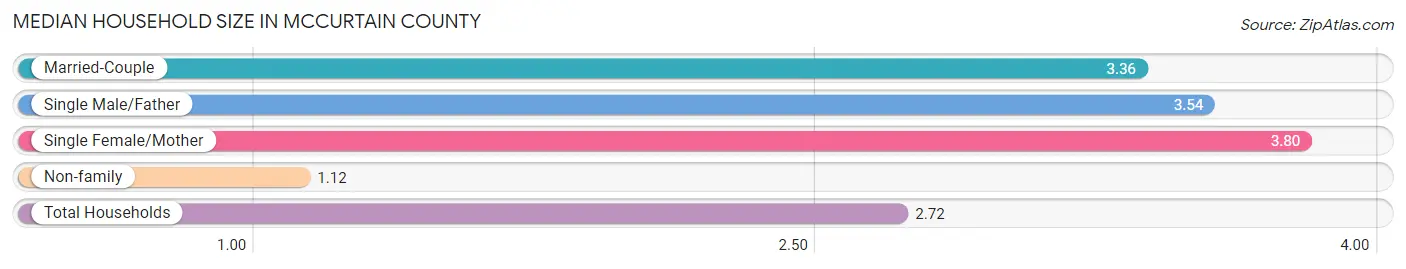
Median Household Size in McCurtain County
The median household size in McCurtain County is 2.72 persons per household, with single female/mother households (1,713 | 15.2%) accounting for the largest median household size of 3.8 persons per household. non-family households (3,606 | 32.0%) represent the smallest median household size with 1.12 persons per household.
| Household Type | # Households | Household Size |
| Married-Couple | 5,350 (47.5%) | 3.36 |
| Single Male/Father | 598 (5.3%) | 3.54 |
| Single Female/Mother | 1,713 (15.2%) | 3.80 |
| Non-family | 3,606 (32.0%) | 1.12 |
| Total Households | 11,267 (100.0%) | 2.72 |
Household Size by Marriage Status in McCurtain County
Out of a total of 11,267 households in McCurtain County, 7,661 (68.0%) are family households, while 3,606 (32.0%) are nonfamily households. The most numerous type of family households are 2-person households, comprising 3,269, and the most common type of nonfamily households are 1-person households, comprising 3,314.
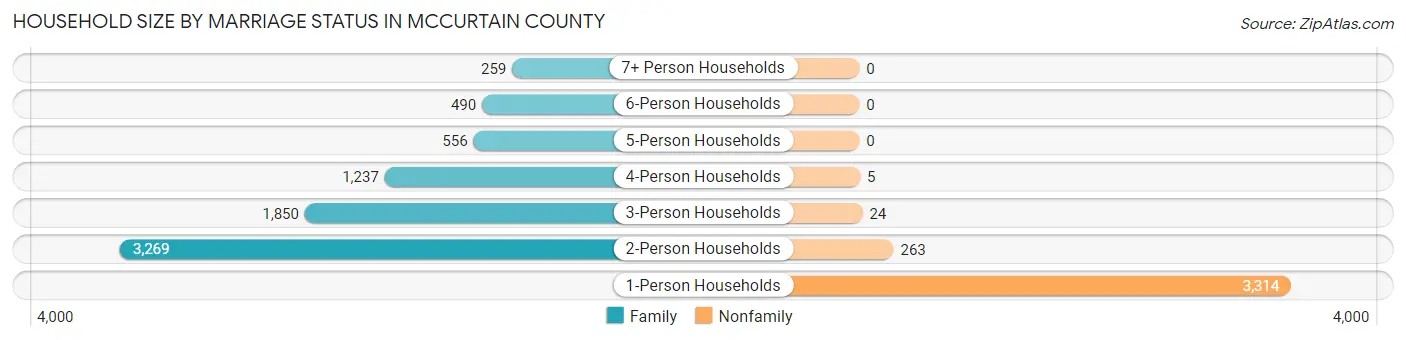
| Household Size | Family Households | Nonfamily Households |
| 1-Person Households | - | 3,314 (29.4%) |
| 2-Person Households | 3,269 (29.0%) | 263 (2.3%) |
| 3-Person Households | 1,850 (16.4%) | 24 (0.2%) |
| 4-Person Households | 1,237 (11.0%) | 5 (0.0%) |
| 5-Person Households | 556 (4.9%) | 0 (0.0%) |
| 6-Person Households | 490 (4.3%) | 0 (0.0%) |
| 7+ Person Households | 259 (2.3%) | 0 (0.0%) |
| Total | 7,661 (68.0%) | 3,606 (32.0%) |
Female Fertility in McCurtain County
Fertility by Age in McCurtain County
Average fertility rate in McCurtain County is 76.0 births per 1,000 women. Women in the age bracket of 20 to 34 years have the highest fertility rate with 139.0 births per 1,000 women. Women in the age bracket of 20 to 34 years acount for 76.6% of all women with births.
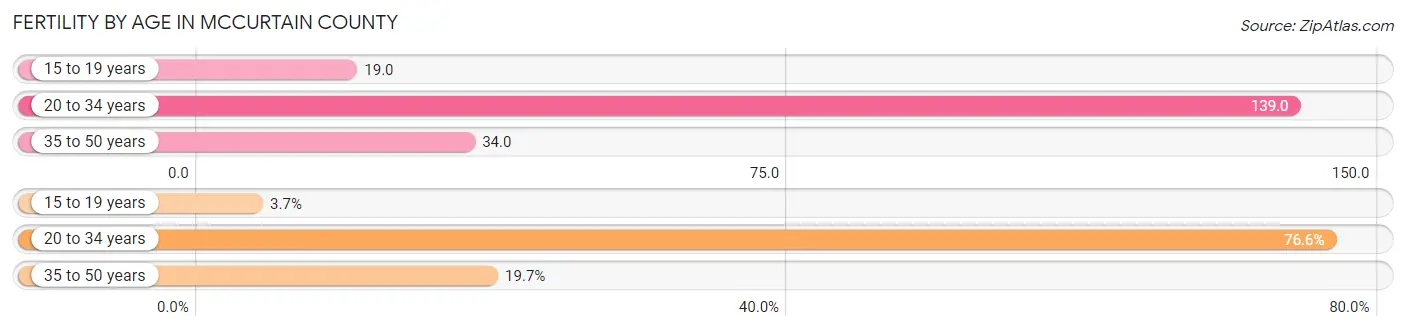
| Age Bracket | Women with Births | Births / 1,000 Women |
| 15 to 19 years | 19 (3.7%) | 19.0 |
| 20 to 34 years | 389 (76.6%) | 139.0 |
| 35 to 50 years | 100 (19.7%) | 34.0 |
| Total | 508 (100.0%) | 76.0 |
Fertility by Age by Marriage Status in McCurtain County
55.7% of women with births (508) in McCurtain County are married. The highest percentage of unmarried women with births falls into 15 to 19 years age bracket with 100.0% of them unmarried at the time of birth, while the lowest percentage of unmarried women with births belong to 35 to 50 years age bracket with 26.0% of them unmarried.
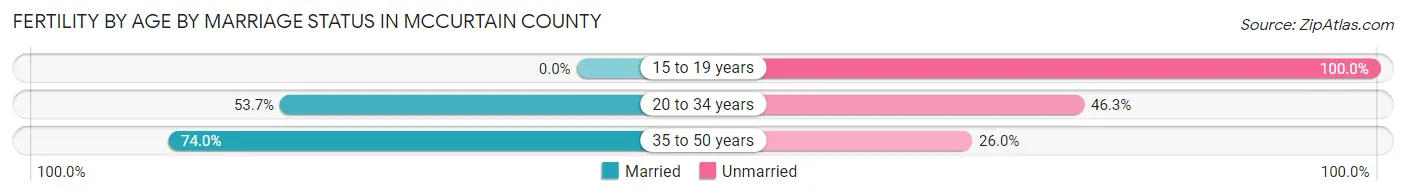
| Age Bracket | Married | Unmarried |
| 15 to 19 years | 0 (0.0%) | 19 (100.0%) |
| 20 to 34 years | 209 (53.7%) | 180 (46.3%) |
| 35 to 50 years | 74 (74.0%) | 26 (26.0%) |
| Total | 283 (55.7%) | 225 (44.3%) |
Fertility by Education in McCurtain County
Average fertility rate in McCurtain County is 76.0 births per 1,000 women. Women with the education attainment of graduate degree have the highest fertility rate of 164.0 births per 1,000 women, while women with the education attainment of bachelor's degree have the lowest fertility at 29.0 births per 1,000 women. Women with the education attainment of college or associate's degree represent 40.9% of all women with births.
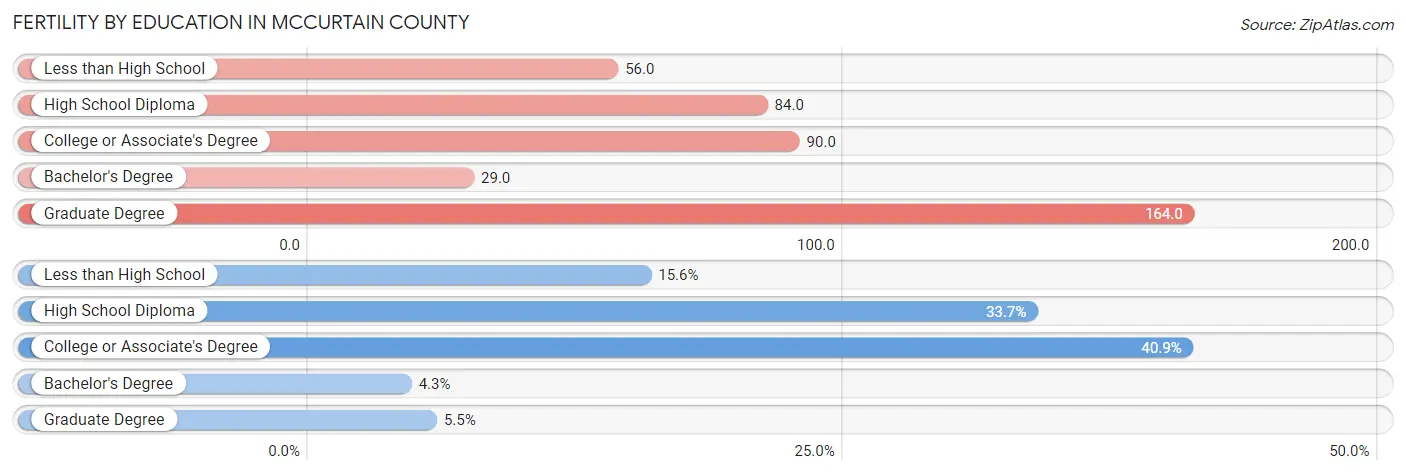
| Educational Attainment | Women with Births | Births / 1,000 Women |
| Less than High School | 79 (15.5%) | 56.0 |
| High School Diploma | 171 (33.7%) | 84.0 |
| College or Associate's Degree | 208 (40.9%) | 90.0 |
| Bachelor's Degree | 22 (4.3%) | 29.0 |
| Graduate Degree | 28 (5.5%) | 164.0 |
| Total | 508 (100.0%) | 76.0 |
Fertility by Education by Marriage Status in McCurtain County
44.3% of women with births in McCurtain County are unmarried. Women with the educational attainment of graduate degree are most likely to be married with 100.0% of them married at childbirth, while women with the educational attainment of bachelor's degree are least likely to be married with 77.3% of them unmarried at childbirth.
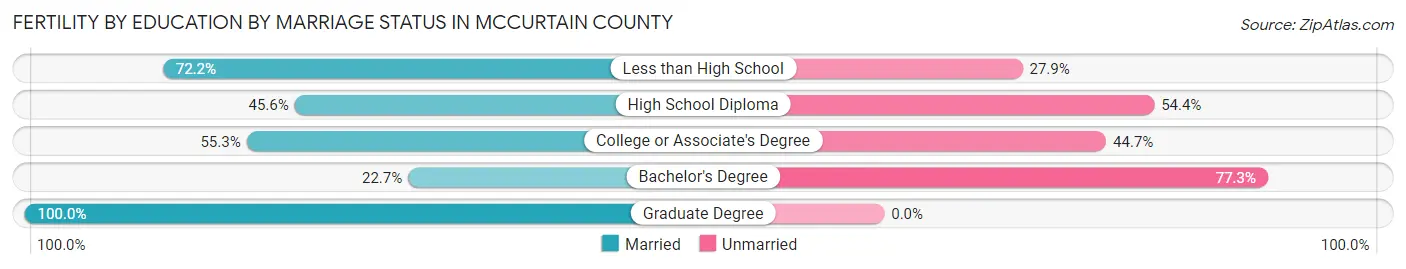
| Educational Attainment | Married | Unmarried |
| Less than High School | 57 (72.2%) | 22 (27.9%) |
| High School Diploma | 78 (45.6%) | 93 (54.4%) |
| College or Associate's Degree | 115 (55.3%) | 93 (44.7%) |
| Bachelor's Degree | 5 (22.7%) | 17 (77.3%) |
| Graduate Degree | 28 (100.0%) | 0 (0.0%) |
| Total | 283 (55.7%) | 225 (44.3%) |
Employment Characteristics in McCurtain County
Employment by Class of Employer in McCurtain County
Among the 12,201 employed individuals in McCurtain County, private company employees (8,246 | 67.6%), self-employed (not incorporated) (995 | 8.2%), and local government employees (905 | 7.4%) make up the most common classes of employment.
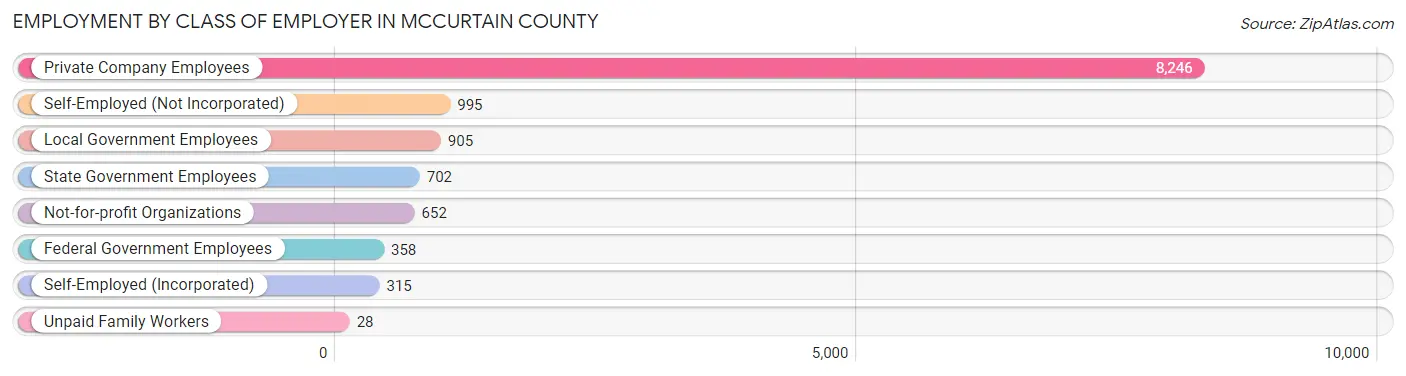
| Employer Class | # Employees | % Employees |
| Private Company Employees | 8,246 | 67.6% |
| Self-Employed (Incorporated) | 315 | 2.6% |
| Self-Employed (Not Incorporated) | 995 | 8.2% |
| Not-for-profit Organizations | 652 | 5.3% |
| Local Government Employees | 905 | 7.4% |
| State Government Employees | 702 | 5.8% |
| Federal Government Employees | 358 | 2.9% |
| Unpaid Family Workers | 28 | 0.2% |
| Total | 12,201 | 100.0% |
Employment Status by Age in McCurtain County
According to the labor force statistics for McCurtain County, out of the total population over 16 years of age (23,767), 54.6% or 12,977 individuals are in the labor force, with 4.9% or 636 of them unemployed. The age group with the highest labor force participation rate is 20 to 24 years, with 76.5% or 1,414 individuals in the labor force. Within the labor force, the 16 to 19 years age range has the highest percentage of unemployed individuals, with 8.5% or 45 of them being unemployed.
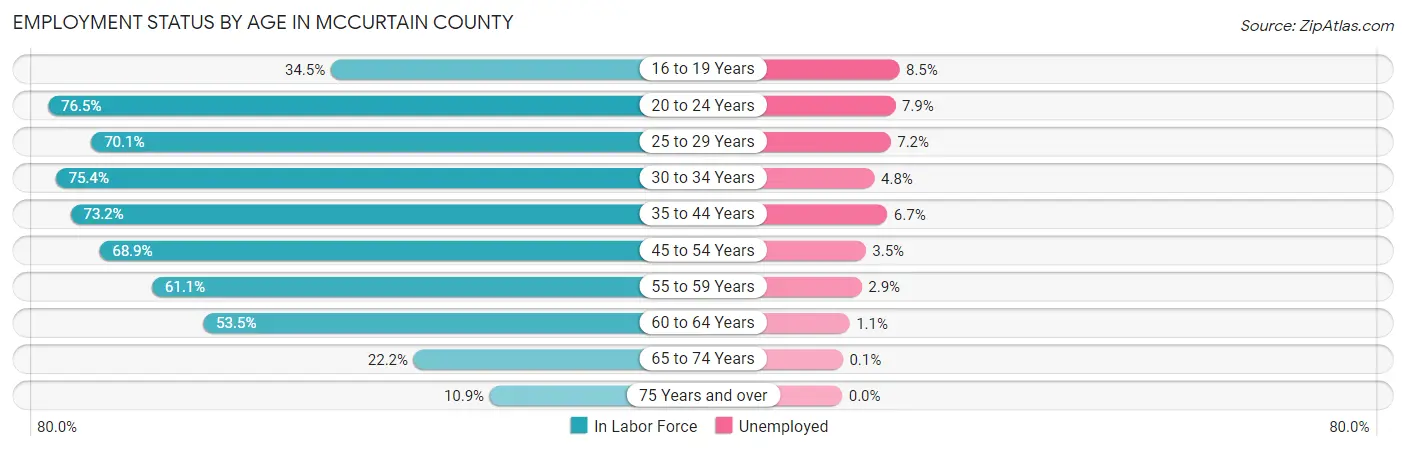
| Age Bracket | In Labor Force | Unemployed |
| 16 to 19 Years | 529 (34.5%) | 45 (8.5%) |
| 20 to 24 Years | 1,414 (76.5%) | 112 (7.9%) |
| 25 to 29 Years | 1,345 (70.1%) | 97 (7.2%) |
| 30 to 34 Years | 1,380 (75.4%) | 66 (4.8%) |
| 35 to 44 Years | 2,577 (73.2%) | 173 (6.7%) |
| 45 to 54 Years | 2,516 (68.9%) | 88 (3.5%) |
| 55 to 59 Years | 1,341 (61.1%) | 39 (2.9%) |
| 60 to 64 Years | 921 (53.5%) | 10 (1.1%) |
| 65 to 74 Years | 705 (22.2%) | 1 (0.1%) |
| 75 Years and over | 259 (10.9%) | 0 (0.0%) |
| Total | 12,977 (54.6%) | 636 (4.9%) |
Employment Status by Educational Attainment in McCurtain County
According to labor force statistics for McCurtain County, 67.9% of individuals (10,074) out of the total population between 25 and 64 years of age (14,837) are in the labor force, with 4.7% or 473 of them being unemployed. The group with the highest labor force participation rate are those with the educational attainment of bachelor's degree or higher, with 83.6% or 1,942 individuals in the labor force. Within the labor force, individuals with less than high school education have the highest percentage of unemployment, with 11.6% or 111 of them being unemployed.
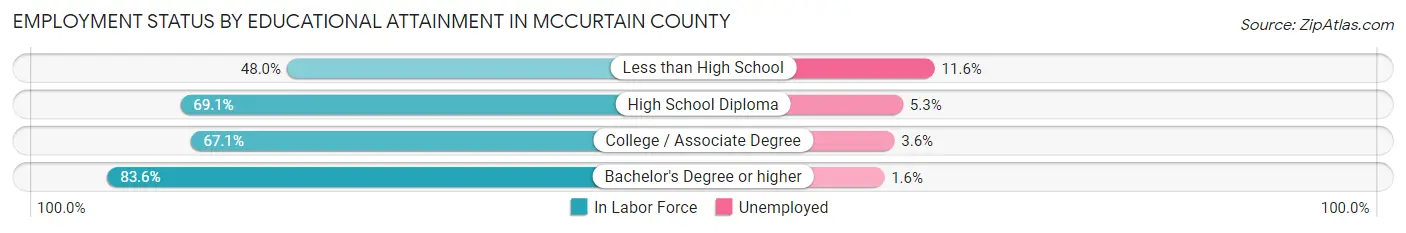
| Educational Attainment | In Labor Force | Unemployed |
| Less than High School | 955 (48.0%) | 231 (11.6%) |
| High School Diploma | 4,304 (69.1%) | 330 (5.3%) |
| College / Associate Degree | 2,883 (67.1%) | 155 (3.6%) |
| Bachelor's Degree or higher | 1,942 (83.6%) | 37 (1.6%) |
| Total | 10,074 (67.9%) | 697 (4.7%) |
Employment Occupations by Sex in McCurtain County
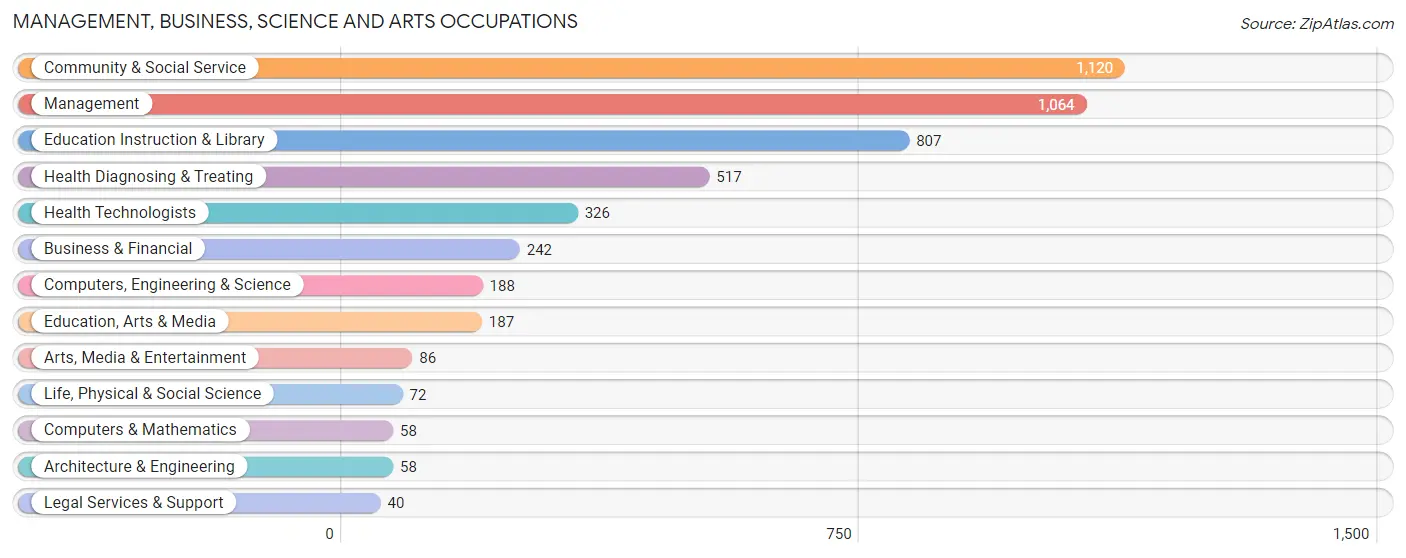
Management, Business, Science and Arts Occupations
The most common Management, Business, Science and Arts occupations in McCurtain County are Community & Social Service (1,120 | 9.1%), Management (1,064 | 8.6%), Education Instruction & Library (807 | 6.5%), Health Diagnosing & Treating (517 | 4.2%), and Health Technologists (326 | 2.6%).
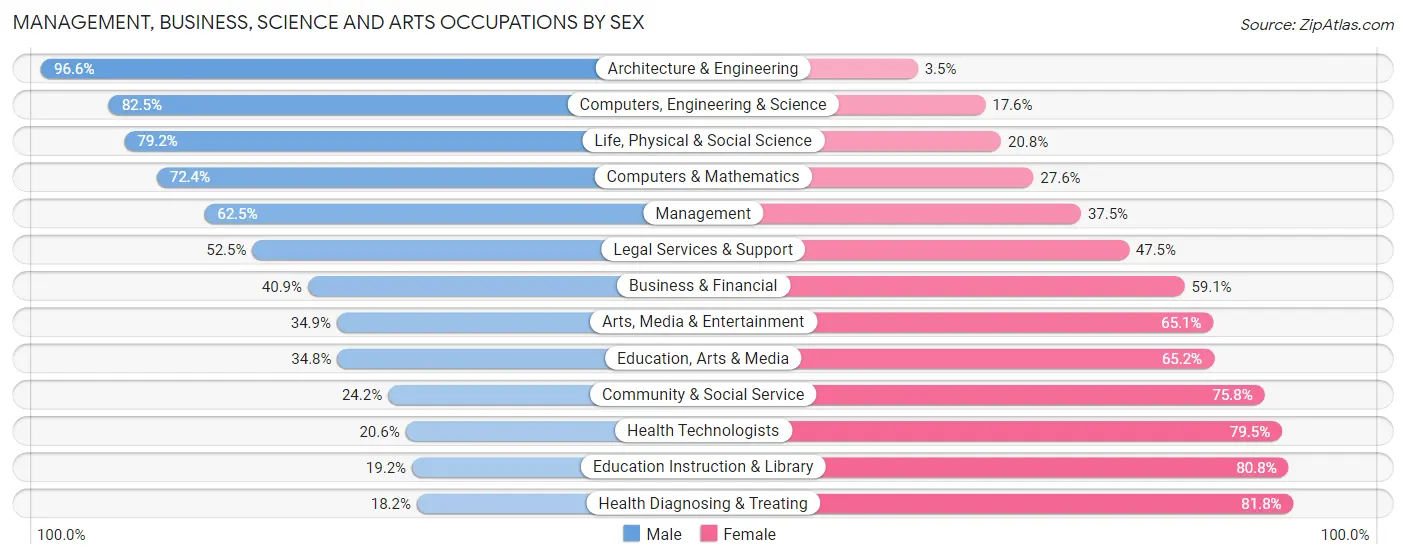
Management, Business, Science and Arts Occupations by Sex
Within the Management, Business, Science and Arts occupations in McCurtain County, the most male-oriented occupations are Architecture & Engineering (96.6%), Computers, Engineering & Science (82.5%), and Life, Physical & Social Science (79.2%), while the most female-oriented occupations are Health Diagnosing & Treating (81.8%), Education Instruction & Library (80.8%), and Health Technologists (79.4%).
| Occupation | Male | Female |
| Management | 665 (62.5%) | 399 (37.5%) |
| Business & Financial | 99 (40.9%) | 143 (59.1%) |
| Computers, Engineering & Science | 155 (82.5%) | 33 (17.5%) |
| Computers & Mathematics | 42 (72.4%) | 16 (27.6%) |
| Architecture & Engineering | 56 (96.6%) | 2 (3.5%) |
| Life, Physical & Social Science | 57 (79.2%) | 15 (20.8%) |
| Community & Social Service | 271 (24.2%) | 849 (75.8%) |
| Education, Arts & Media | 65 (34.8%) | 122 (65.2%) |
| Legal Services & Support | 21 (52.5%) | 19 (47.5%) |
| Education Instruction & Library | 155 (19.2%) | 652 (80.8%) |
| Arts, Media & Entertainment | 30 (34.9%) | 56 (65.1%) |
| Health Diagnosing & Treating | 94 (18.2%) | 423 (81.8%) |
| Health Technologists | 67 (20.5%) | 259 (79.4%) |
| Total (Category) | 1,284 (41.0%) | 1,847 (59.0%) |
| Total (Overall) | 6,794 (55.0%) | 5,558 (45.0%) |
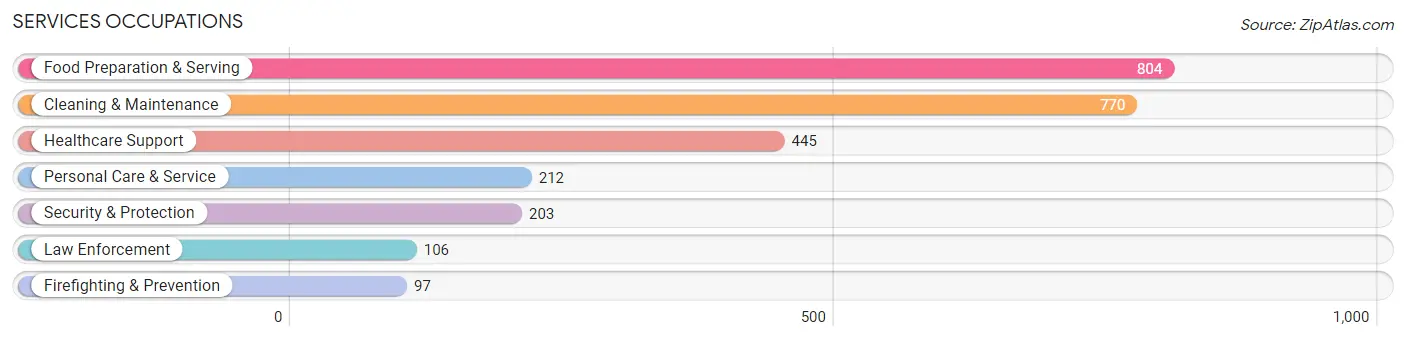
Services Occupations
The most common Services occupations in McCurtain County are Food Preparation & Serving (804 | 6.5%), Cleaning & Maintenance (770 | 6.2%), Healthcare Support (445 | 3.6%), Personal Care & Service (212 | 1.7%), and Security & Protection (203 | 1.6%).
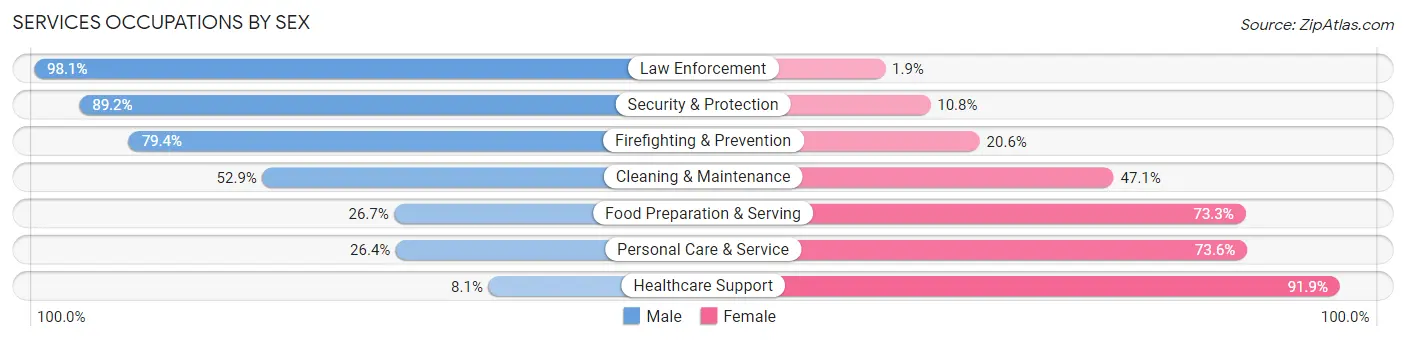
Services Occupations by Sex
Within the Services occupations in McCurtain County, the most male-oriented occupations are Law Enforcement (98.1%), Security & Protection (89.2%), and Firefighting & Prevention (79.4%), while the most female-oriented occupations are Healthcare Support (91.9%), Personal Care & Service (73.6%), and Food Preparation & Serving (73.3%).
| Occupation | Male | Female |
| Healthcare Support | 36 (8.1%) | 409 (91.9%) |
| Security & Protection | 181 (89.2%) | 22 (10.8%) |
| Firefighting & Prevention | 77 (79.4%) | 20 (20.6%) |
| Law Enforcement | 104 (98.1%) | 2 (1.9%) |
| Food Preparation & Serving | 215 (26.7%) | 589 (73.3%) |
| Cleaning & Maintenance | 407 (52.9%) | 363 (47.1%) |
| Personal Care & Service | 56 (26.4%) | 156 (73.6%) |
| Total (Category) | 895 (36.8%) | 1,539 (63.2%) |
| Total (Overall) | 6,794 (55.0%) | 5,558 (45.0%) |
Sales and Office Occupations
The most common Sales and Office occupations in McCurtain County are Office & Administration (1,136 | 9.2%), and Sales & Related (951 | 7.7%).
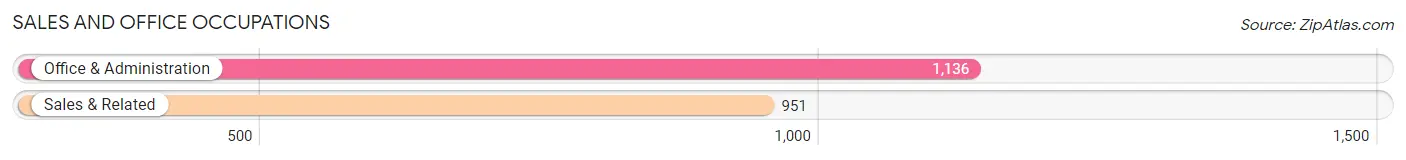
Sales and Office Occupations by Sex
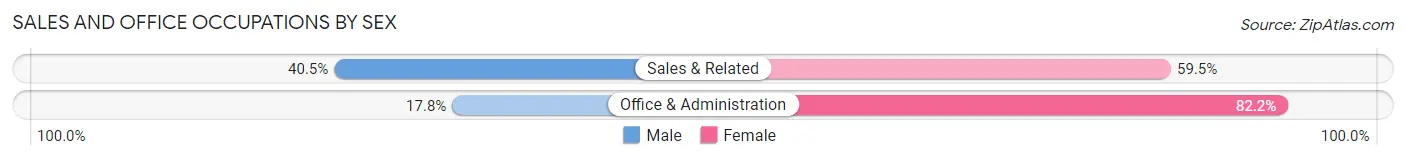
| Occupation | Male | Female |
| Sales & Related | 385 (40.5%) | 566 (59.5%) |
| Office & Administration | 202 (17.8%) | 934 (82.2%) |
| Total (Category) | 587 (28.1%) | 1,500 (71.9%) |
| Total (Overall) | 6,794 (55.0%) | 5,558 (45.0%) |
Natural Resources, Construction and Maintenance Occupations
The most common Natural Resources, Construction and Maintenance occupations in McCurtain County are Construction & Extraction (1,002 | 8.1%), Installation, Maintenance & Repair (668 | 5.4%), and Farming, Fishing & Forestry (141 | 1.1%).
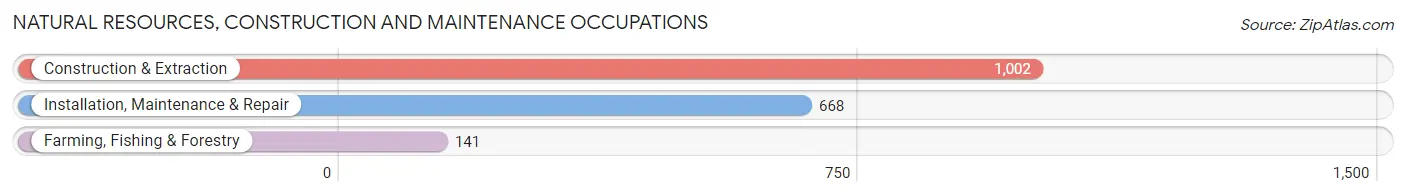
Natural Resources, Construction and Maintenance Occupations by Sex
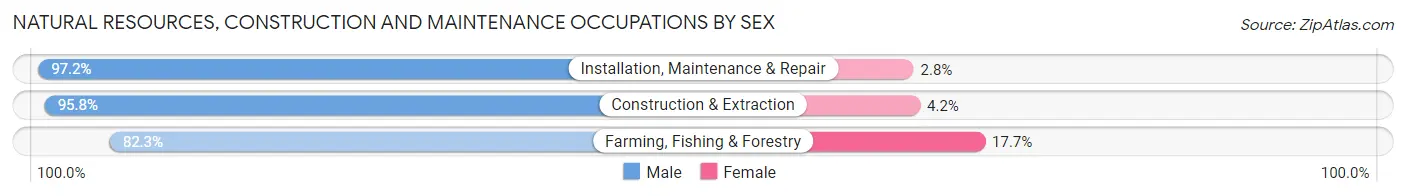
| Occupation | Male | Female |
| Farming, Fishing & Forestry | 116 (82.3%) | 25 (17.7%) |
| Construction & Extraction | 960 (95.8%) | 42 (4.2%) |
| Installation, Maintenance & Repair | 649 (97.2%) | 19 (2.8%) |
| Total (Category) | 1,725 (95.3%) | 86 (4.8%) |
| Total (Overall) | 6,794 (55.0%) | 5,558 (45.0%) |
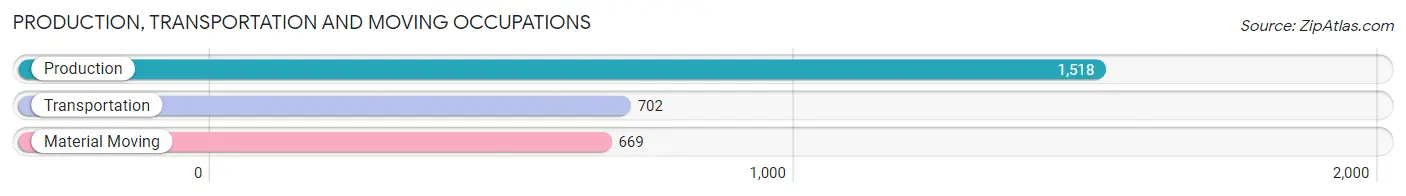
Production, Transportation and Moving Occupations
The most common Production, Transportation and Moving occupations in McCurtain County are Production (1,518 | 12.3%), Transportation (702 | 5.7%), and Material Moving (669 | 5.4%).
Production, Transportation and Moving Occupations by Sex
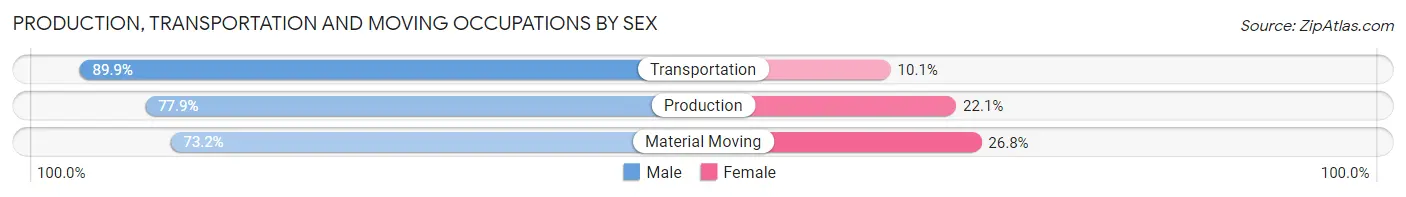
| Occupation | Male | Female |
| Production | 1,182 (77.9%) | 336 (22.1%) |
| Transportation | 631 (89.9%) | 71 (10.1%) |
| Material Moving | 490 (73.2%) | 179 (26.8%) |
| Total (Category) | 2,303 (79.7%) | 586 (20.3%) |
| Total (Overall) | 6,794 (55.0%) | 5,558 (45.0%) |
Employment Industries by Sex in McCurtain County
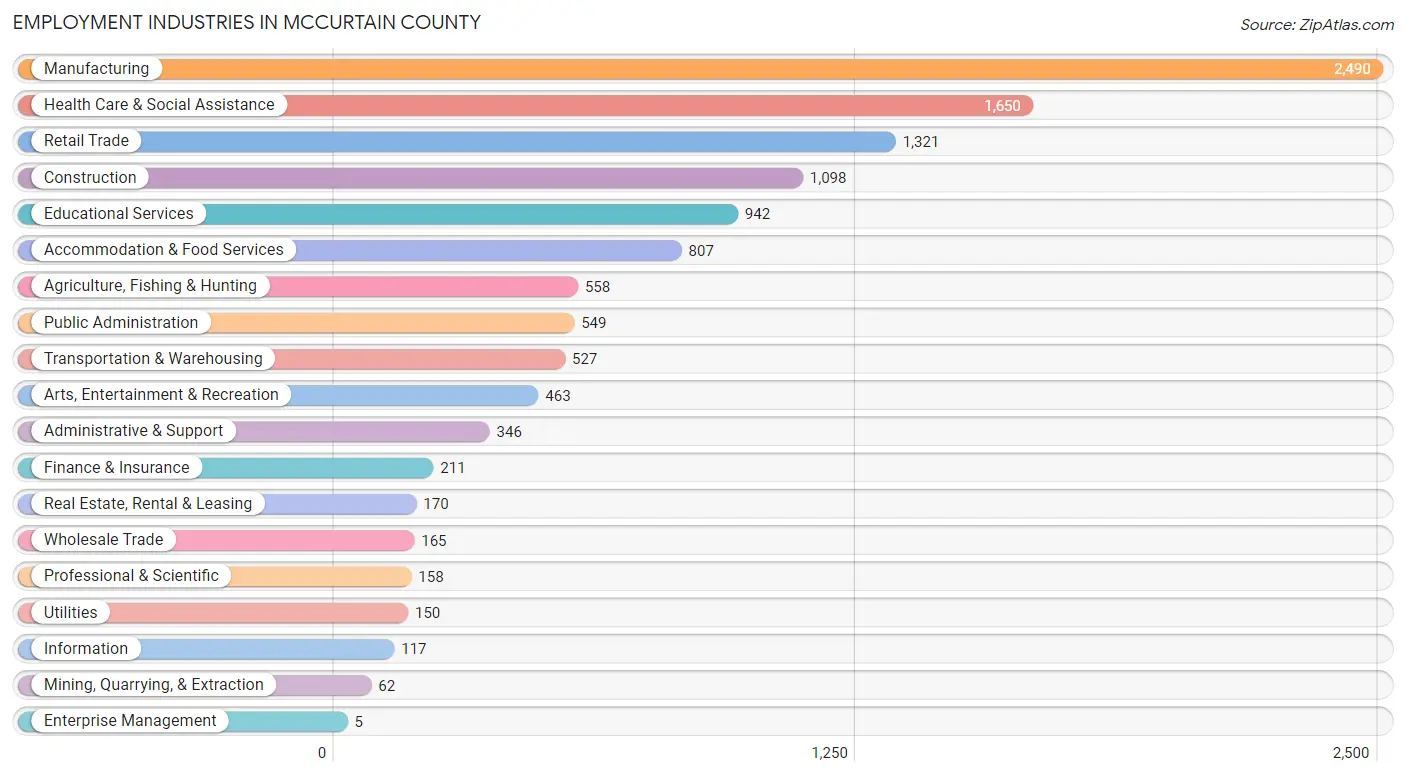
Employment Industries in McCurtain County
The major employment industries in McCurtain County include Manufacturing (2,490 | 20.2%), Health Care & Social Assistance (1,650 | 13.4%), Retail Trade (1,321 | 10.7%), Construction (1,098 | 8.9%), and Educational Services (942 | 7.6%).
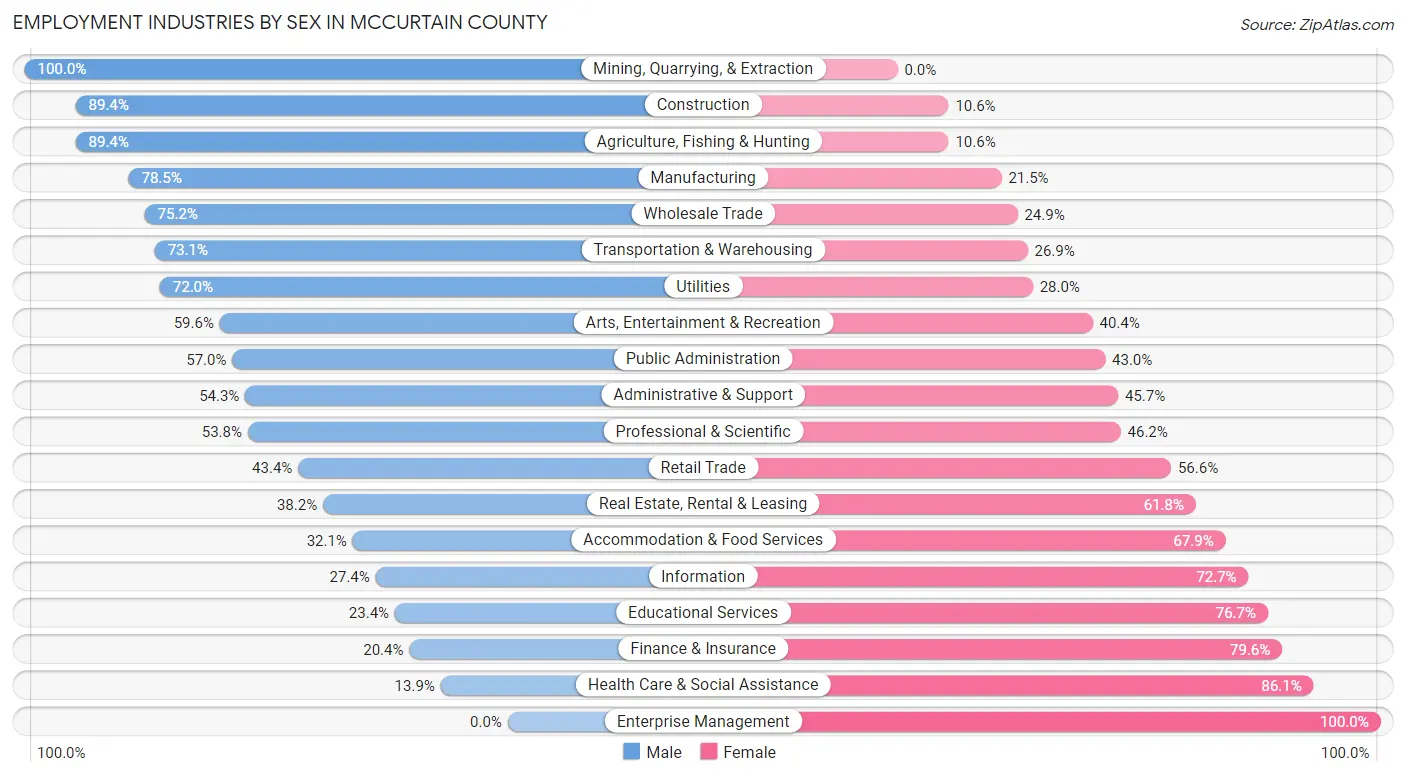
Employment Industries by Sex in McCurtain County
The McCurtain County industries that see more men than women are Mining, Quarrying, & Extraction (100.0%), Construction (89.4%), and Agriculture, Fishing & Hunting (89.4%), whereas the industries that tend to have a higher number of women are Enterprise Management (100.0%), Health Care & Social Assistance (86.1%), and Finance & Insurance (79.6%).
| Industry | Male | Female |
| Agriculture, Fishing & Hunting | 499 (89.4%) | 59 (10.6%) |
| Mining, Quarrying, & Extraction | 62 (100.0%) | 0 (0.0%) |
| Construction | 982 (89.4%) | 116 (10.6%) |
| Manufacturing | 1,954 (78.5%) | 536 (21.5%) |
| Wholesale Trade | 124 (75.1%) | 41 (24.8%) |
| Retail Trade | 573 (43.4%) | 748 (56.6%) |
| Transportation & Warehousing | 385 (73.1%) | 142 (26.9%) |
| Utilities | 108 (72.0%) | 42 (28.0%) |
| Information | 32 (27.4%) | 85 (72.7%) |
| Finance & Insurance | 43 (20.4%) | 168 (79.6%) |
| Real Estate, Rental & Leasing | 65 (38.2%) | 105 (61.8%) |
| Professional & Scientific | 85 (53.8%) | 73 (46.2%) |
| Enterprise Management | 0 (0.0%) | 5 (100.0%) |
| Administrative & Support | 188 (54.3%) | 158 (45.7%) |
| Educational Services | 220 (23.4%) | 722 (76.6%) |
| Health Care & Social Assistance | 229 (13.9%) | 1,421 (86.1%) |
| Arts, Entertainment & Recreation | 276 (59.6%) | 187 (40.4%) |
| Accommodation & Food Services | 259 (32.1%) | 548 (67.9%) |
| Public Administration | 313 (57.0%) | 236 (43.0%) |
| Total | 6,794 (55.0%) | 5,558 (45.0%) |
Education in McCurtain County
School Enrollment in McCurtain County
The most common levels of schooling among the 7,185 students in McCurtain County are elementary school (1,785 | 24.8%), high school (1,715 | 23.9%), and middle school (1,696 | 23.6%).
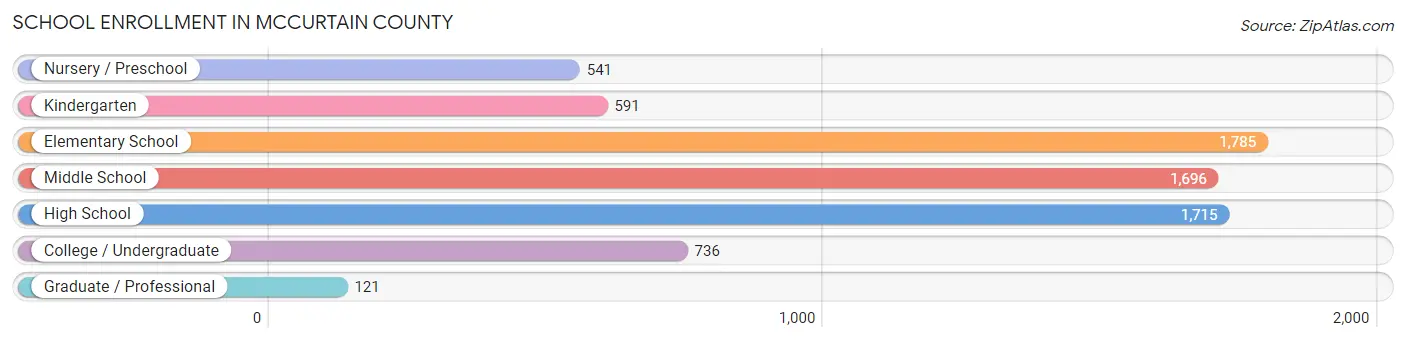
| School Level | # Students | % Students |
| Nursery / Preschool | 541 | 7.5% |
| Kindergarten | 591 | 8.2% |
| Elementary School | 1,785 | 24.8% |
| Middle School | 1,696 | 23.6% |
| High School | 1,715 | 23.9% |
| College / Undergraduate | 736 | 10.2% |
| Graduate / Professional | 121 | 1.7% |
| Total | 7,185 | 100.0% |
School Enrollment by Age by Funding Source in McCurtain County
Out of a total of 7,185 students who are enrolled in schools in McCurtain County, 388 (5.4%) attend a private institution, while the remaining 6,797 (94.6%) are enrolled in public schools. The age group of 20 to 24 year olds has the highest likelihood of being enrolled in private schools, with 54 (21.0% in the age bracket) enrolled. Conversely, the age group of 15 to 17 year olds has the lowest likelihood of being enrolled in a private school, with 1,172 (97.2% in the age bracket) attending a public institution.
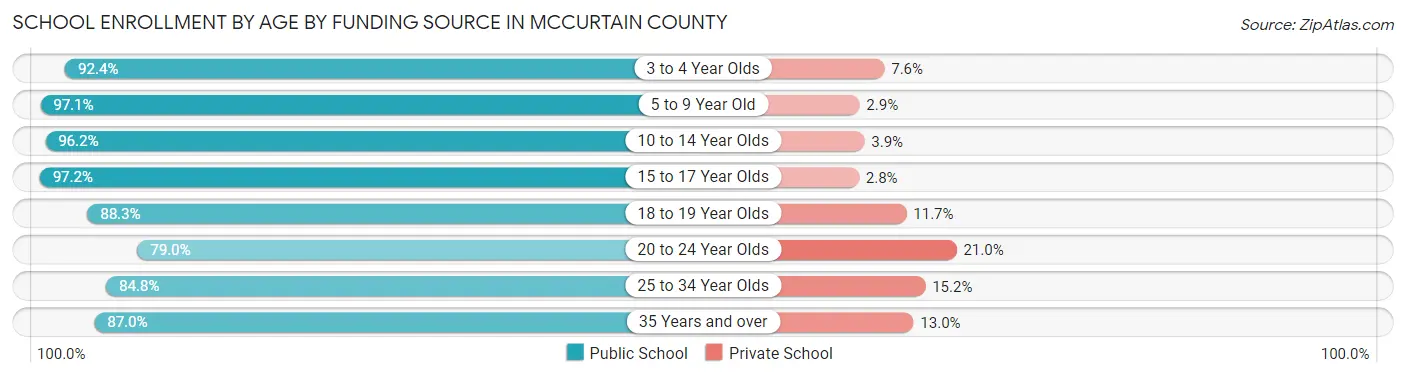
| Age Bracket | Public School | Private School |
| 3 to 4 Year Olds | 330 (92.4%) | 27 (7.6%) |
| 5 to 9 Year Old | 2,185 (97.1%) | 66 (2.9%) |
| 10 to 14 Year Olds | 2,073 (96.2%) | 83 (3.8%) |
| 15 to 17 Year Olds | 1,172 (97.2%) | 34 (2.8%) |
| 18 to 19 Year Olds | 363 (88.3%) | 48 (11.7%) |
| 20 to 24 Year Olds | 203 (79.0%) | 54 (21.0%) |
| 25 to 34 Year Olds | 268 (84.8%) | 48 (15.2%) |
| 35 Years and over | 201 (87.0%) | 30 (13.0%) |
| Total | 6,797 (94.6%) | 388 (5.4%) |
Educational Attainment by Field of Study in McCurtain County
Education (908 | 26.1%), business (595 | 17.1%), science & technology (479 | 13.8%), bio, nature & agricultural (361 | 10.4%), and arts & humanities (212 | 6.1%) are the most common fields of study among 3,476 individuals in McCurtain County who have obtained a bachelor's degree or higher.
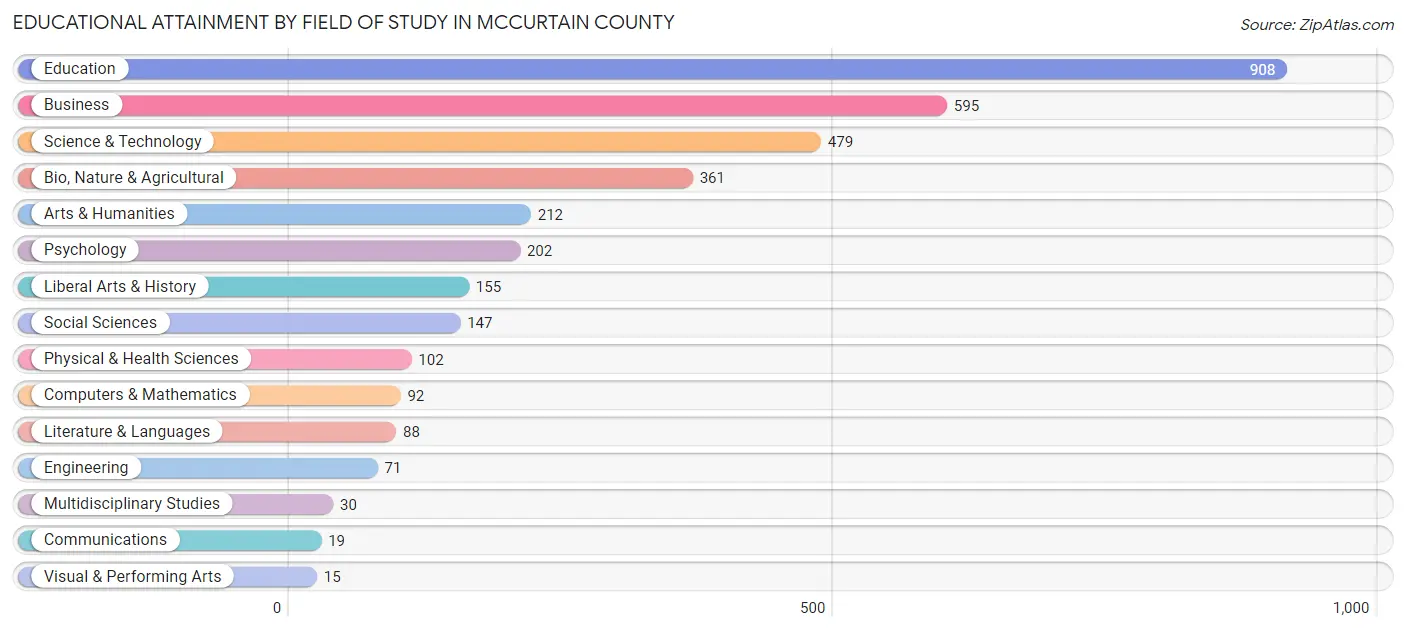
| Field of Study | # Graduates | % Graduates |
| Computers & Mathematics | 92 | 2.6% |
| Bio, Nature & Agricultural | 361 | 10.4% |
| Physical & Health Sciences | 102 | 2.9% |
| Psychology | 202 | 5.8% |
| Social Sciences | 147 | 4.2% |
| Engineering | 71 | 2.0% |
| Multidisciplinary Studies | 30 | 0.9% |
| Science & Technology | 479 | 13.8% |
| Business | 595 | 17.1% |
| Education | 908 | 26.1% |
| Literature & Languages | 88 | 2.5% |
| Liberal Arts & History | 155 | 4.5% |
| Visual & Performing Arts | 15 | 0.4% |
| Communications | 19 | 0.5% |
| Arts & Humanities | 212 | 6.1% |
| Total | 3,476 | 100.0% |
Transportation & Commute in McCurtain County
Vehicle Availability by Sex in McCurtain County
The most prevalent vehicle ownership categories in McCurtain County are males with 2 vehicles (2,408, accounting for 35.8%) and females with 2 vehicles (1,752, making up 44.0%).
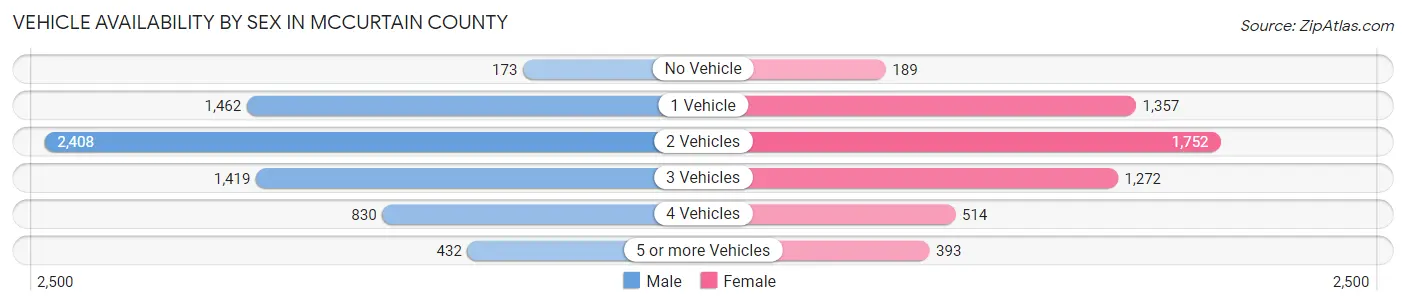
| Vehicles Available | Male | Female |
| No Vehicle | 173 (2.6%) | 189 (3.5%) |
| 1 Vehicle | 1,462 (21.7%) | 1,357 (24.8%) |
| 2 Vehicles | 2,408 (35.8%) | 1,752 (32.0%) |
| 3 Vehicles | 1,419 (21.1%) | 1,272 (23.2%) |
| 4 Vehicles | 830 (12.3%) | 514 (9.4%) |
| 5 or more Vehicles | 432 (6.4%) | 393 (7.2%) |
| Total | 6,724 (100.0%) | 5,477 (100.0%) |
Commute Time in McCurtain County
The most frequently occuring commute durations in McCurtain County are 10 to 14 minutes (2,085 commuters, 17.5%), 5 to 9 minutes (1,924 commuters, 16.2%), and 15 to 19 minutes (1,810 commuters, 15.2%).
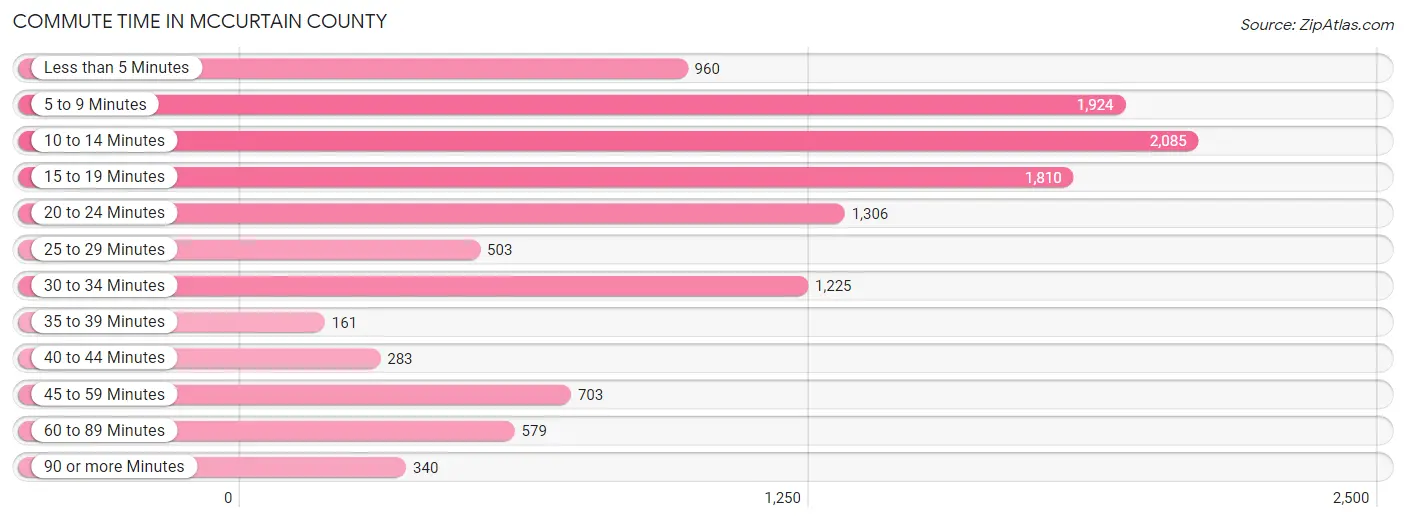
| Commute Time | # Commuters | % Commuters |
| Less than 5 Minutes | 960 | 8.1% |
| 5 to 9 Minutes | 1,924 | 16.2% |
| 10 to 14 Minutes | 2,085 | 17.5% |
| 15 to 19 Minutes | 1,810 | 15.2% |
| 20 to 24 Minutes | 1,306 | 11.0% |
| 25 to 29 Minutes | 503 | 4.2% |
| 30 to 34 Minutes | 1,225 | 10.3% |
| 35 to 39 Minutes | 161 | 1.4% |
| 40 to 44 Minutes | 283 | 2.4% |
| 45 to 59 Minutes | 703 | 5.9% |
| 60 to 89 Minutes | 579 | 4.9% |
| 90 or more Minutes | 340 | 2.9% |
Commute Time by Sex in McCurtain County
The most common commute times in McCurtain County are 10 to 14 minutes (1,069 commuters, 16.3%) for males and 5 to 9 minutes (1,113 commuters, 21.0%) for females.
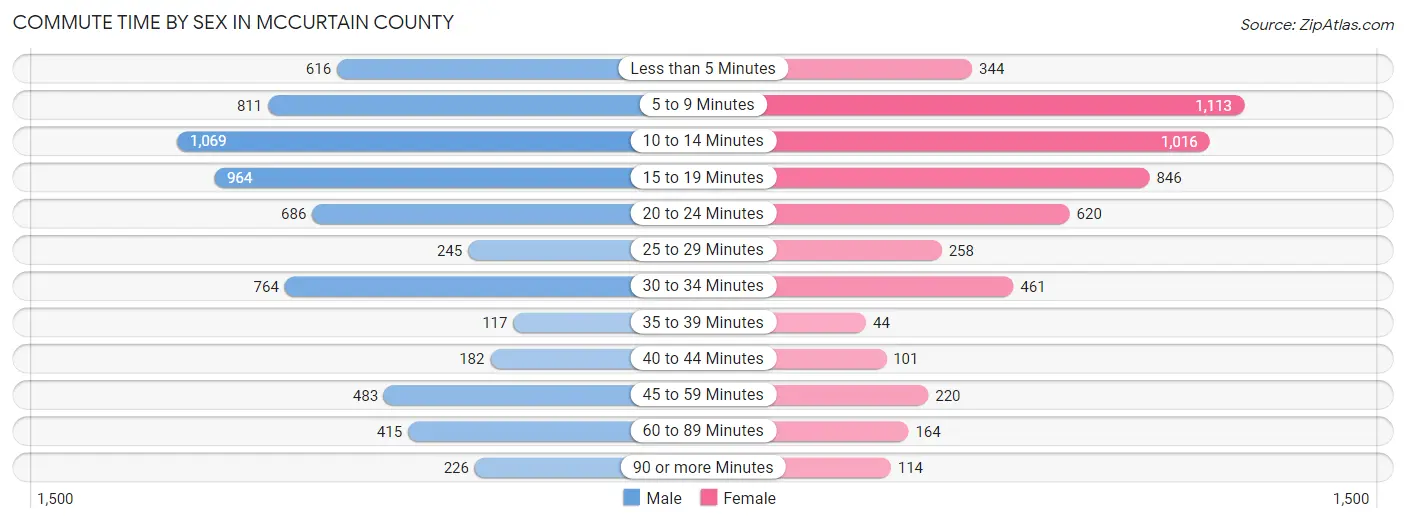
| Commute Time | Male | Female |
| Less than 5 Minutes | 616 (9.4%) | 344 (6.5%) |
| 5 to 9 Minutes | 811 (12.3%) | 1,113 (21.0%) |
| 10 to 14 Minutes | 1,069 (16.3%) | 1,016 (19.2%) |
| 15 to 19 Minutes | 964 (14.6%) | 846 (16.0%) |
| 20 to 24 Minutes | 686 (10.4%) | 620 (11.7%) |
| 25 to 29 Minutes | 245 (3.7%) | 258 (4.9%) |
| 30 to 34 Minutes | 764 (11.6%) | 461 (8.7%) |
| 35 to 39 Minutes | 117 (1.8%) | 44 (0.8%) |
| 40 to 44 Minutes | 182 (2.8%) | 101 (1.9%) |
| 45 to 59 Minutes | 483 (7.3%) | 220 (4.2%) |
| 60 to 89 Minutes | 415 (6.3%) | 164 (3.1%) |
| 90 or more Minutes | 226 (3.4%) | 114 (2.1%) |
Time of Departure to Work by Sex in McCurtain County
The most frequent times of departure to work in McCurtain County are 6:00 AM to 6:29 AM (922, 14.0%) for males and 7:30 AM to 7:59 AM (1,196, 22.6%) for females.
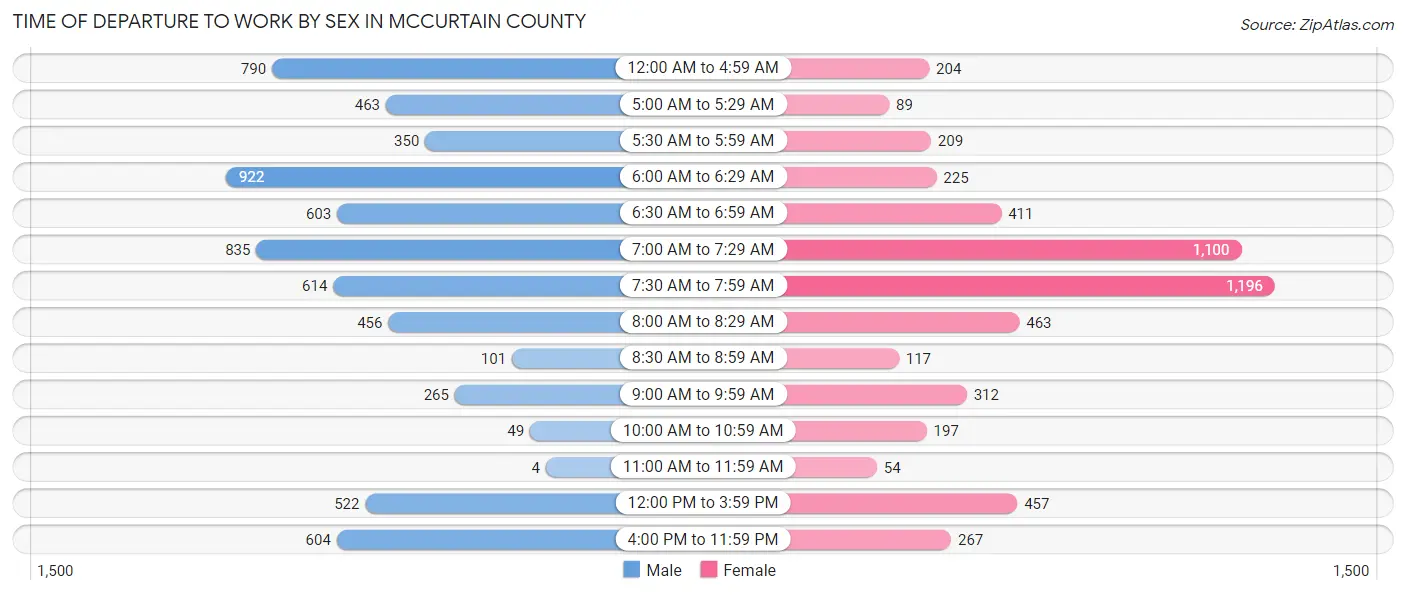
| Time of Departure | Male | Female |
| 12:00 AM to 4:59 AM | 790 (12.0%) | 204 (3.8%) |
| 5:00 AM to 5:29 AM | 463 (7.0%) | 89 (1.7%) |
| 5:30 AM to 5:59 AM | 350 (5.3%) | 209 (3.9%) |
| 6:00 AM to 6:29 AM | 922 (14.0%) | 225 (4.2%) |
| 6:30 AM to 6:59 AM | 603 (9.2%) | 411 (7.7%) |
| 7:00 AM to 7:29 AM | 835 (12.7%) | 1,100 (20.7%) |
| 7:30 AM to 7:59 AM | 614 (9.3%) | 1,196 (22.6%) |
| 8:00 AM to 8:29 AM | 456 (6.9%) | 463 (8.7%) |
| 8:30 AM to 8:59 AM | 101 (1.5%) | 117 (2.2%) |
| 9:00 AM to 9:59 AM | 265 (4.0%) | 312 (5.9%) |
| 10:00 AM to 10:59 AM | 49 (0.7%) | 197 (3.7%) |
| 11:00 AM to 11:59 AM | 4 (0.1%) | 54 (1.0%) |
| 12:00 PM to 3:59 PM | 522 (7.9%) | 457 (8.6%) |
| 4:00 PM to 11:59 PM | 604 (9.2%) | 267 (5.0%) |
| Total | 6,578 (100.0%) | 5,301 (100.0%) |
Housing Occupancy in McCurtain County
Occupancy by Ownership in McCurtain County
Of the total 11,267 dwellings in McCurtain County, owner-occupied units account for 8,086 (71.8%), while renter-occupied units make up 3,181 (28.2%).
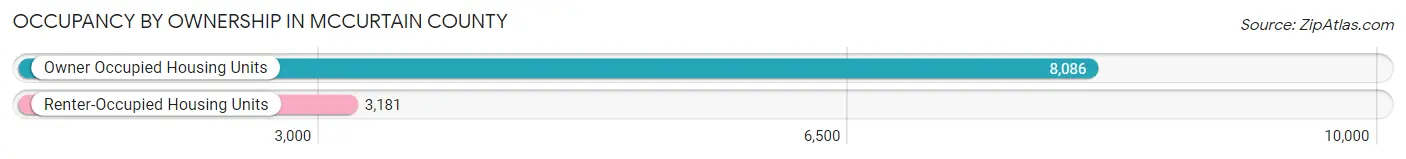
| Occupancy | # Housing Units | % Housing Units |
| Owner Occupied Housing Units | 8,086 | 71.8% |
| Renter-Occupied Housing Units | 3,181 | 28.2% |
| Total Occupied Housing Units | 11,267 | 100.0% |
Occupancy by Household Size in McCurtain County
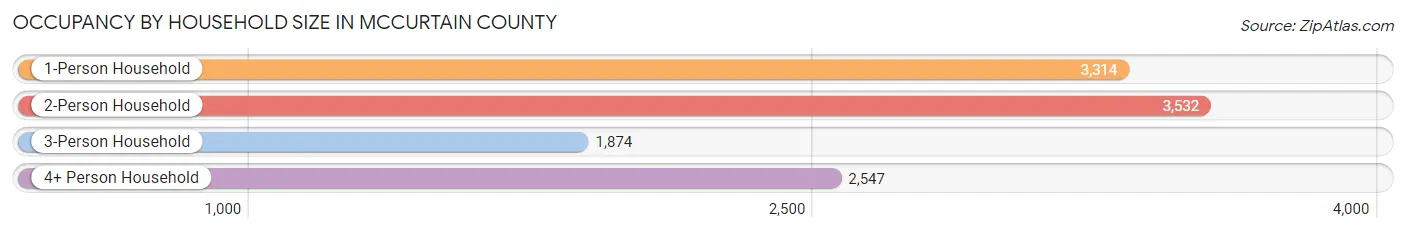
| Household Size | # Housing Units | % Housing Units |
| 1-Person Household | 3,314 | 29.4% |
| 2-Person Household | 3,532 | 31.4% |
| 3-Person Household | 1,874 | 16.6% |
| 4+ Person Household | 2,547 | 22.6% |
| Total Housing Units | 11,267 | 100.0% |
Occupancy by Ownership by Household Size in McCurtain County
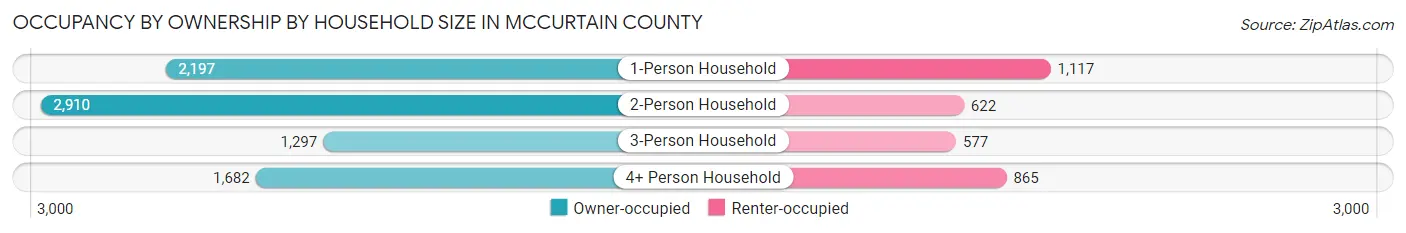
| Household Size | Owner-occupied | Renter-occupied |
| 1-Person Household | 2,197 (66.3%) | 1,117 (33.7%) |
| 2-Person Household | 2,910 (82.4%) | 622 (17.6%) |
| 3-Person Household | 1,297 (69.2%) | 577 (30.8%) |
| 4+ Person Household | 1,682 (66.0%) | 865 (34.0%) |
| Total Housing Units | 8,086 (71.8%) | 3,181 (28.2%) |
Occupancy by Educational Attainment in McCurtain County
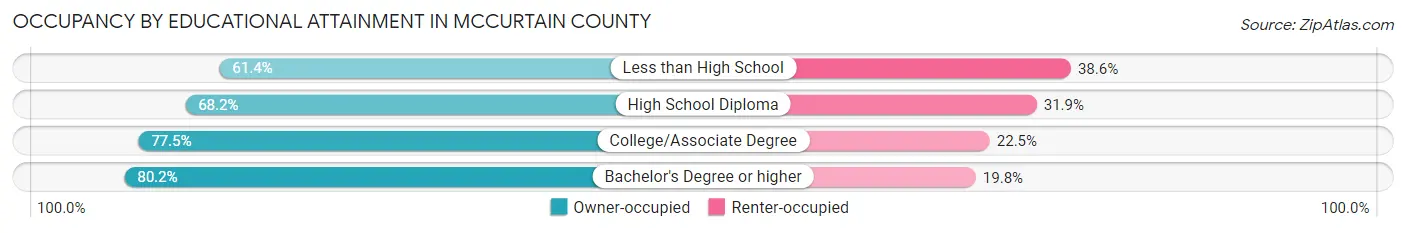
| Household Size | Owner-occupied | Renter-occupied |
| Less than High School | 1,007 (61.4%) | 634 (38.6%) |
| High School Diploma | 3,132 (68.1%) | 1,464 (31.9%) |
| College/Associate Degree | 2,471 (77.5%) | 719 (22.5%) |
| Bachelor's Degree or higher | 1,476 (80.2%) | 364 (19.8%) |
Occupancy by Age of Householder in McCurtain County
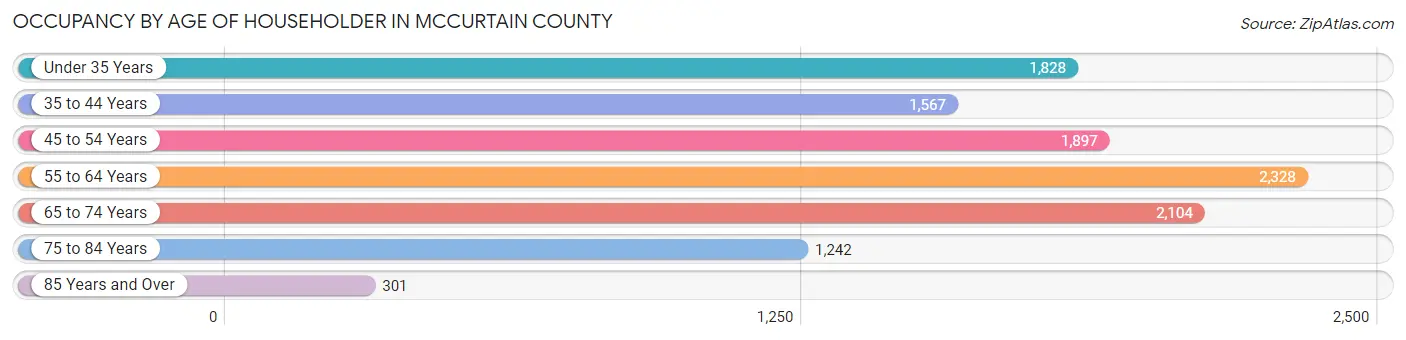
| Age Bracket | # Households | % Households |
| Under 35 Years | 1,828 | 16.2% |
| 35 to 44 Years | 1,567 | 13.9% |
| 45 to 54 Years | 1,897 | 16.8% |
| 55 to 64 Years | 2,328 | 20.7% |
| 65 to 74 Years | 2,104 | 18.7% |
| 75 to 84 Years | 1,242 | 11.0% |
| 85 Years and Over | 301 | 2.7% |
| Total | 11,267 | 100.0% |
Housing Finances in McCurtain County
Median Income by Occupancy in McCurtain County
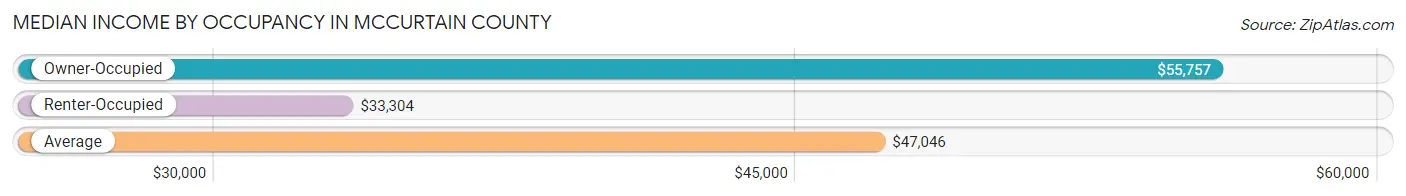
| Occupancy Type | # Households | Median Income |
| Owner-Occupied | 8,086 (71.8%) | $55,757 |
| Renter-Occupied | 3,181 (28.2%) | $33,304 |
| Average | 11,267 (100.0%) | $47,046 |
Occupancy by Householder Income Bracket in McCurtain County
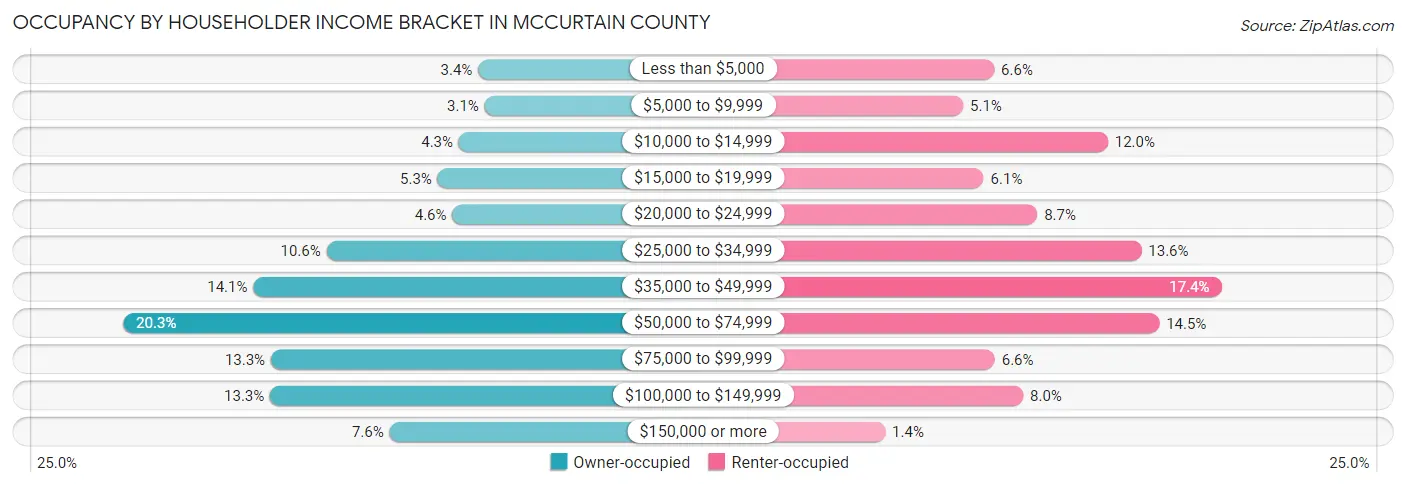
| Income Bracket | Owner-occupied | Renter-occupied |
| Less than $5,000 | 275 (3.4%) | 210 (6.6%) |
| $5,000 to $9,999 | 250 (3.1%) | 163 (5.1%) |
| $10,000 to $14,999 | 349 (4.3%) | 382 (12.0%) |
| $15,000 to $19,999 | 431 (5.3%) | 194 (6.1%) |
| $20,000 to $24,999 | 374 (4.6%) | 275 (8.6%) |
| $25,000 to $34,999 | 859 (10.6%) | 433 (13.6%) |
| $35,000 to $49,999 | 1,141 (14.1%) | 554 (17.4%) |
| $50,000 to $74,999 | 1,642 (20.3%) | 460 (14.5%) |
| $75,000 to $99,999 | 1,073 (13.3%) | 211 (6.6%) |
| $100,000 to $149,999 | 1,076 (13.3%) | 254 (8.0%) |
| $150,000 or more | 616 (7.6%) | 45 (1.4%) |
| Total | 8,086 (100.0%) | 3,181 (100.0%) |
Monthly Housing Cost Tiers in McCurtain County
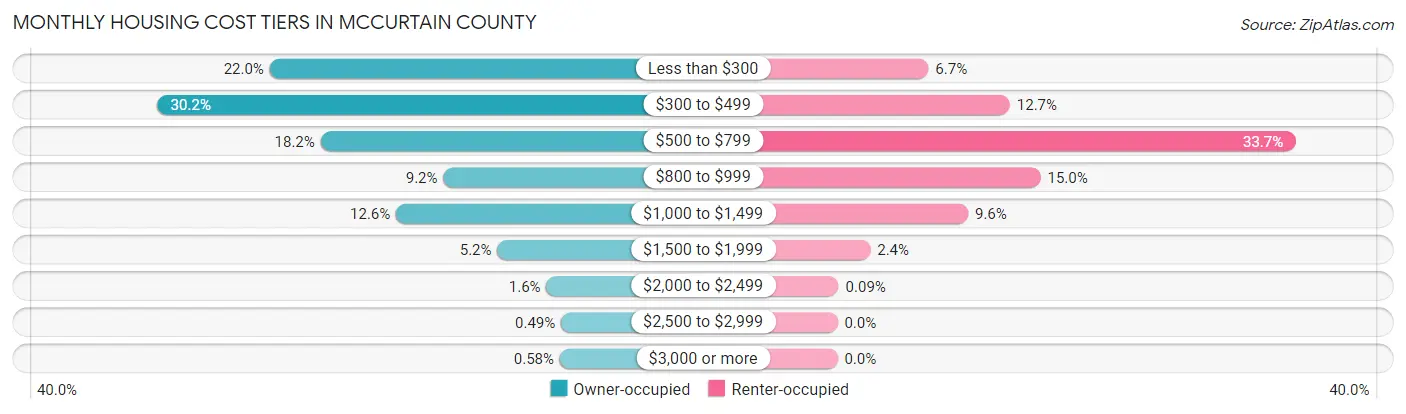
| Monthly Cost | Owner-occupied | Renter-occupied |
| Less than $300 | 1,775 (22.0%) | 213 (6.7%) |
| $300 to $499 | 2,443 (30.2%) | 404 (12.7%) |
| $500 to $799 | 1,472 (18.2%) | 1,072 (33.7%) |
| $800 to $999 | 741 (9.2%) | 476 (15.0%) |
| $1,000 to $1,499 | 1,022 (12.6%) | 306 (9.6%) |
| $1,500 to $1,999 | 419 (5.2%) | 77 (2.4%) |
| $2,000 to $2,499 | 127 (1.6%) | 3 (0.1%) |
| $2,500 to $2,999 | 40 (0.5%) | 0 (0.0%) |
| $3,000 or more | 47 (0.6%) | 0 (0.0%) |
| Total | 8,086 (100.0%) | 3,181 (100.0%) |
Physical Housing Characteristics in McCurtain County
Housing Structures in McCurtain County
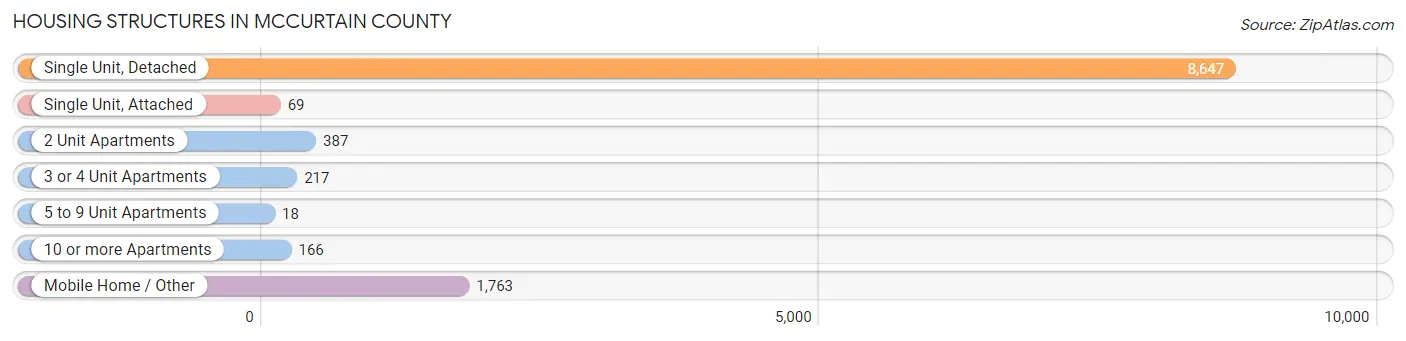
| Structure Type | # Housing Units | % Housing Units |
| Single Unit, Detached | 8,647 | 76.7% |
| Single Unit, Attached | 69 | 0.6% |
| 2 Unit Apartments | 387 | 3.4% |
| 3 or 4 Unit Apartments | 217 | 1.9% |
| 5 to 9 Unit Apartments | 18 | 0.2% |
| 10 or more Apartments | 166 | 1.5% |
| Mobile Home / Other | 1,763 | 15.7% |
| Total | 11,267 | 100.0% |
Housing Structures by Occupancy in McCurtain County
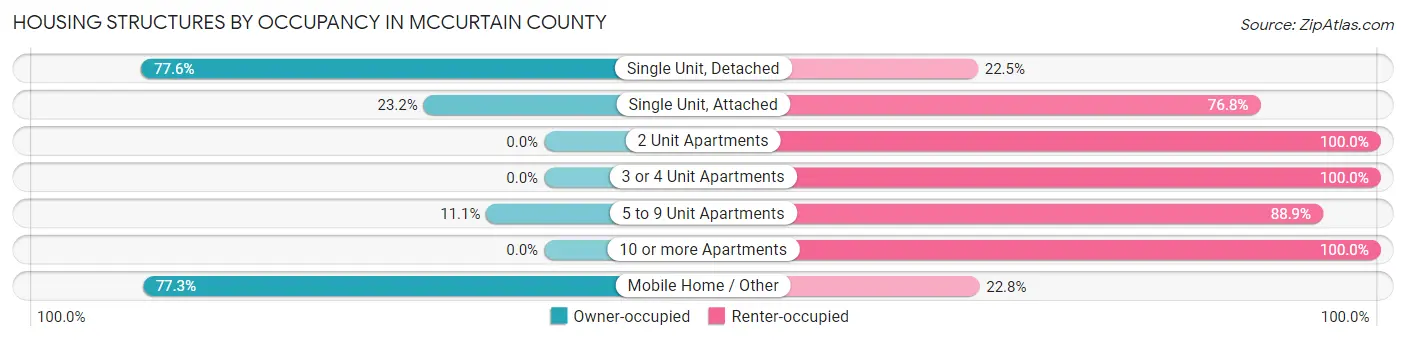
| Structure Type | Owner-occupied | Renter-occupied |
| Single Unit, Detached | 6,706 (77.5%) | 1,941 (22.5%) |
| Single Unit, Attached | 16 (23.2%) | 53 (76.8%) |
| 2 Unit Apartments | 0 (0.0%) | 387 (100.0%) |
| 3 or 4 Unit Apartments | 0 (0.0%) | 217 (100.0%) |
| 5 to 9 Unit Apartments | 2 (11.1%) | 16 (88.9%) |
| 10 or more Apartments | 0 (0.0%) | 166 (100.0%) |
| Mobile Home / Other | 1,362 (77.2%) | 401 (22.8%) |
| Total | 8,086 (71.8%) | 3,181 (28.2%) |
Housing Structures by Number of Rooms in McCurtain County
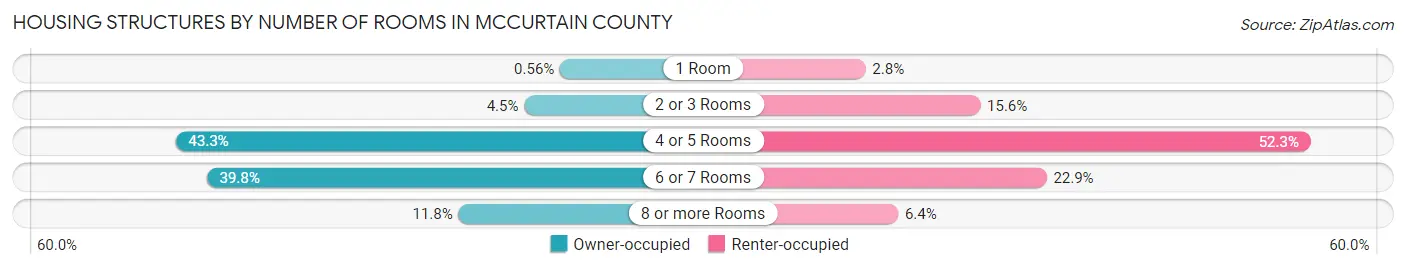
| Number of Rooms | Owner-occupied | Renter-occupied |
| 1 Room | 45 (0.6%) | 90 (2.8%) |
| 2 or 3 Rooms | 367 (4.5%) | 495 (15.6%) |
| 4 or 5 Rooms | 3,498 (43.3%) | 1,662 (52.2%) |
| 6 or 7 Rooms | 3,219 (39.8%) | 729 (22.9%) |
| 8 or more Rooms | 957 (11.8%) | 205 (6.4%) |
| Total | 8,086 (100.0%) | 3,181 (100.0%) |
Housing Structure by Heating Type in McCurtain County
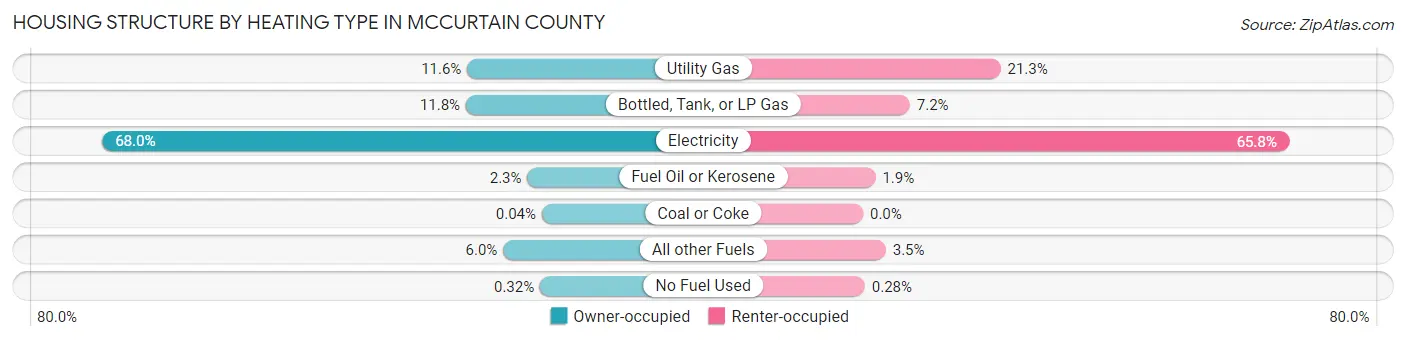
| Heating Type | Owner-occupied | Renter-occupied |
| Utility Gas | 936 (11.6%) | 676 (21.2%) |
| Bottled, Tank, or LP Gas | 952 (11.8%) | 230 (7.2%) |
| Electricity | 5,498 (68.0%) | 2,093 (65.8%) |
| Fuel Oil or Kerosene | 184 (2.3%) | 61 (1.9%) |
| Coal or Coke | 3 (0.0%) | 0 (0.0%) |
| All other Fuels | 487 (6.0%) | 112 (3.5%) |
| No Fuel Used | 26 (0.3%) | 9 (0.3%) |
| Total | 8,086 (100.0%) | 3,181 (100.0%) |
Household Vehicle Usage in McCurtain County
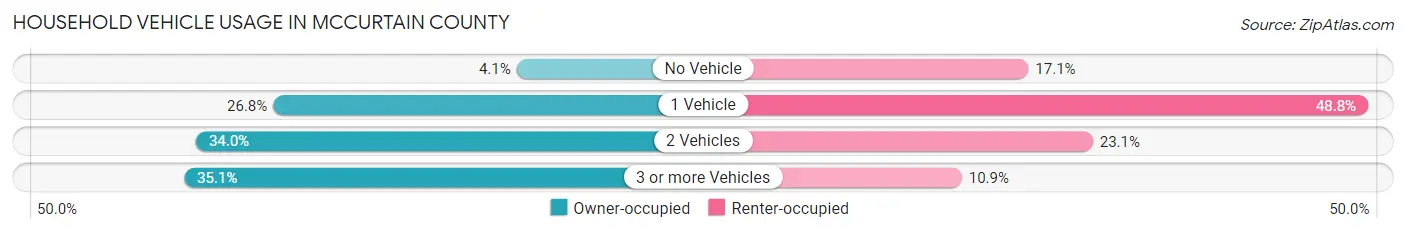
| Vehicles per Household | Owner-occupied | Renter-occupied |
| No Vehicle | 330 (4.1%) | 545 (17.1%) |
| 1 Vehicle | 2,167 (26.8%) | 1,553 (48.8%) |
| 2 Vehicles | 2,749 (34.0%) | 736 (23.1%) |
| 3 or more Vehicles | 2,840 (35.1%) | 347 (10.9%) |
| Total | 8,086 (100.0%) | 3,181 (100.0%) |
Real Estate & Mortgages in McCurtain County
Real Estate and Mortgage Overview in McCurtain County
| Characteristic | Without Mortgage | With Mortgage |
| Housing Units | 5,311 | 2,775 |
| Median Property Value | $96,300 | $142,900 |
| Median Household Income | $45,465 | $280 |
| Monthly Housing Costs | $352 | $43 |
| Real Estate Taxes | $371 | $264 |
Property Value by Mortgage Status in McCurtain County
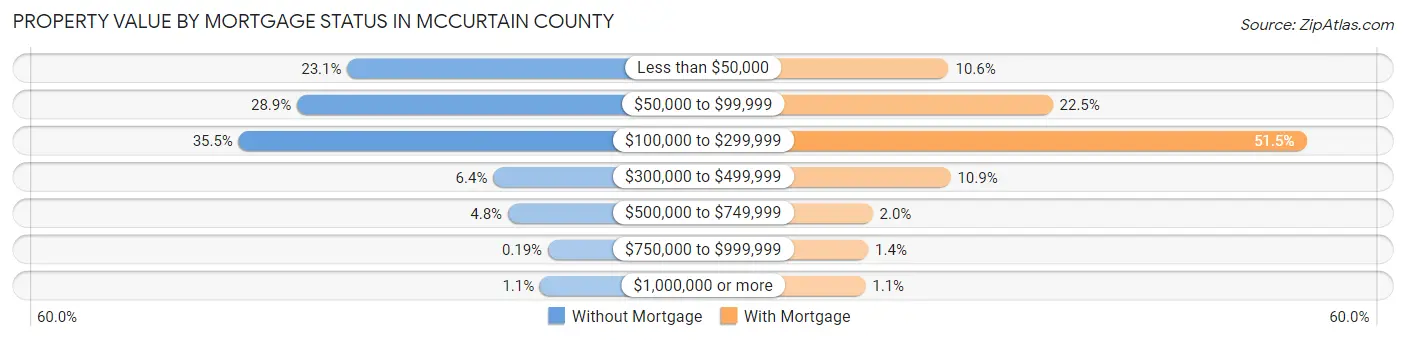
| Property Value | Without Mortgage | With Mortgage |
| Less than $50,000 | 1,228 (23.1%) | 295 (10.6%) |
| $50,000 to $99,999 | 1,533 (28.9%) | 625 (22.5%) |
| $100,000 to $299,999 | 1,887 (35.5%) | 1,429 (51.5%) |
| $300,000 to $499,999 | 342 (6.4%) | 301 (10.8%) |
| $500,000 to $749,999 | 253 (4.8%) | 54 (1.9%) |
| $750,000 to $999,999 | 10 (0.2%) | 40 (1.4%) |
| $1,000,000 or more | 58 (1.1%) | 31 (1.1%) |
| Total | 5,311 (100.0%) | 2,775 (100.0%) |
Household Income by Mortgage Status in McCurtain County
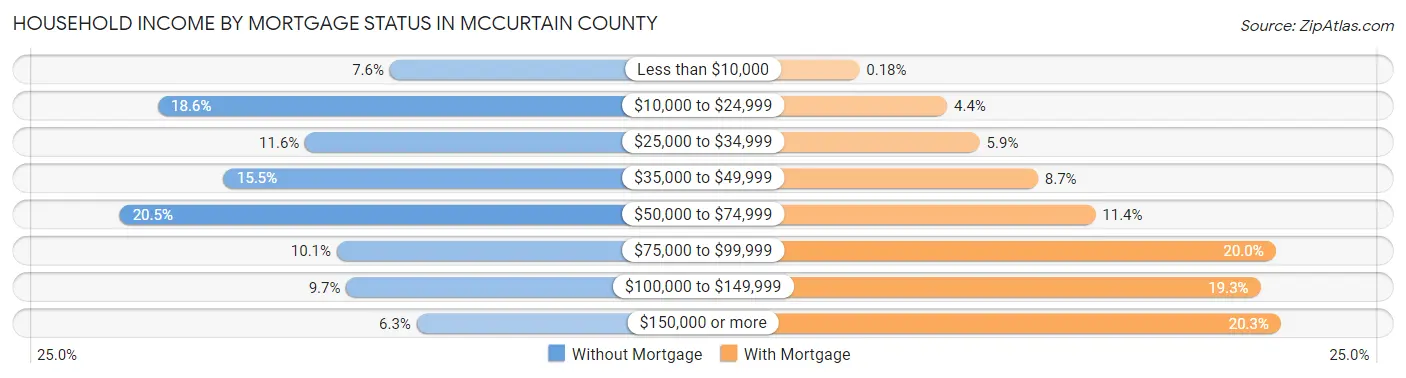
| Household Income | Without Mortgage | With Mortgage |
| Less than $10,000 | 404 (7.6%) | 5 (0.2%) |
| $10,000 to $24,999 | 990 (18.6%) | 121 (4.4%) |
| $25,000 to $34,999 | 618 (11.6%) | 164 (5.9%) |
| $35,000 to $49,999 | 824 (15.5%) | 241 (8.7%) |
| $50,000 to $74,999 | 1,087 (20.5%) | 317 (11.4%) |
| $75,000 to $99,999 | 538 (10.1%) | 555 (20.0%) |
| $100,000 to $149,999 | 514 (9.7%) | 535 (19.3%) |
| $150,000 or more | 336 (6.3%) | 562 (20.3%) |
| Total | 5,311 (100.0%) | 2,775 (100.0%) |
Property Value to Household Income Ratio in McCurtain County
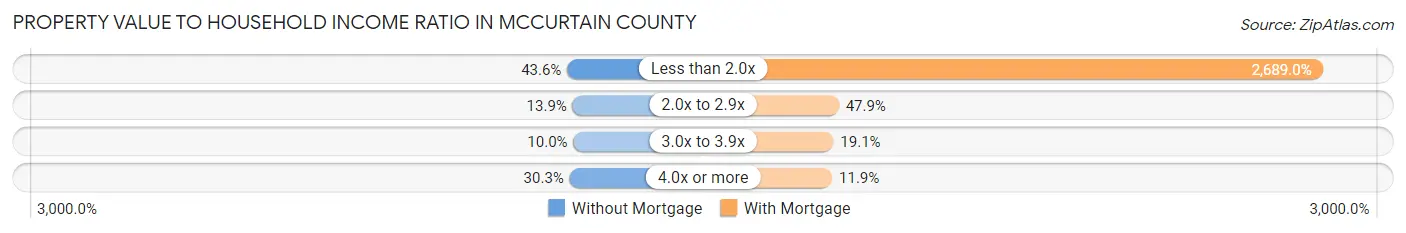
| Value-to-Income Ratio | Without Mortgage | With Mortgage |
| Less than 2.0x | 2,317 (43.6%) | 74,620 (2,689.0%) |
| 2.0x to 2.9x | 740 (13.9%) | 1,328 (47.9%) |
| 3.0x to 3.9x | 529 (10.0%) | 530 (19.1%) |
| 4.0x or more | 1,610 (30.3%) | 331 (11.9%) |
| Total | 5,311 (100.0%) | 2,775 (100.0%) |
Real Estate Taxes by Mortgage Status in McCurtain County
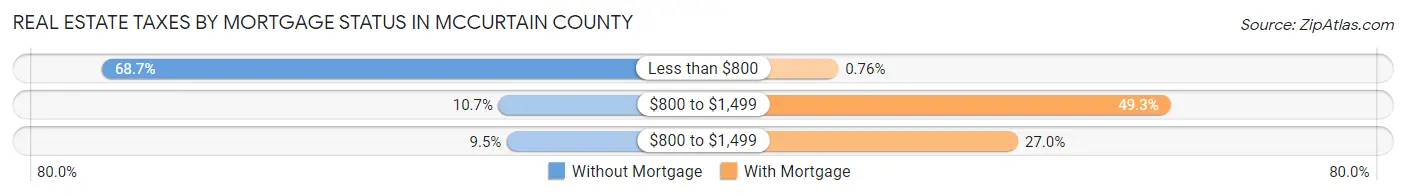
| Property Taxes | Without Mortgage | With Mortgage |
| Less than $800 | 3,648 (68.7%) | 21 (0.8%) |
| $800 to $1,499 | 569 (10.7%) | 1,368 (49.3%) |
| $800 to $1,499 | 504 (9.5%) | 750 (27.0%) |
| Total | 5,311 (100.0%) | 2,775 (100.0%) |
Health & Disability in McCurtain County
Health Insurance Coverage by Age in McCurtain County
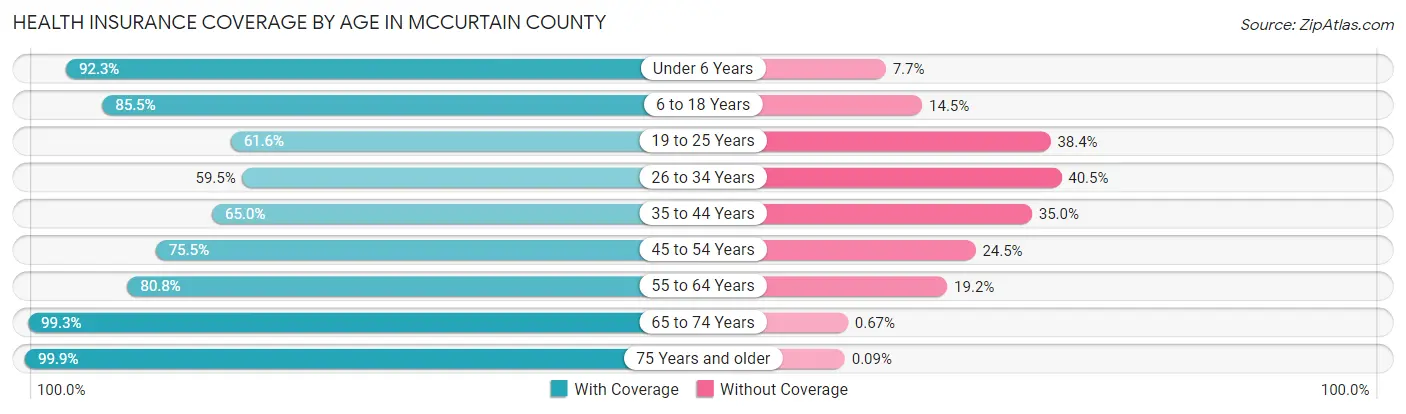
| Age Bracket | With Coverage | Without Coverage |
| Under 6 Years | 2,473 (92.3%) | 207 (7.7%) |
| 6 to 18 Years | 4,844 (85.5%) | 822 (14.5%) |
| 19 to 25 Years | 1,542 (61.6%) | 963 (38.4%) |
| 26 to 34 Years | 2,044 (59.5%) | 1,389 (40.5%) |
| 35 to 44 Years | 2,259 (65.0%) | 1,214 (35.0%) |
| 45 to 54 Years | 2,740 (75.5%) | 887 (24.5%) |
| 55 to 64 Years | 3,152 (80.8%) | 748 (19.2%) |
| 65 to 74 Years | 3,106 (99.3%) | 21 (0.7%) |
| 75 Years and older | 2,257 (99.9%) | 2 (0.1%) |
| Total | 24,417 (79.6%) | 6,253 (20.4%) |
Health Insurance Coverage by Citizenship Status in McCurtain County
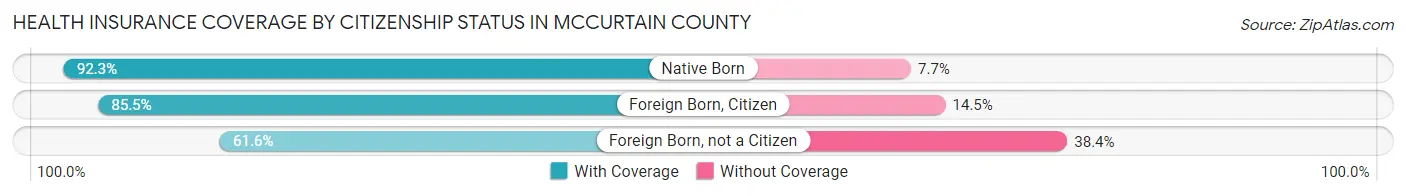
| Citizenship Status | With Coverage | Without Coverage |
| Native Born | 2,473 (92.3%) | 207 (7.7%) |
| Foreign Born, Citizen | 4,844 (85.5%) | 822 (14.5%) |
| Foreign Born, not a Citizen | 1,542 (61.6%) | 963 (38.4%) |
Health Insurance Coverage by Household Income in McCurtain County
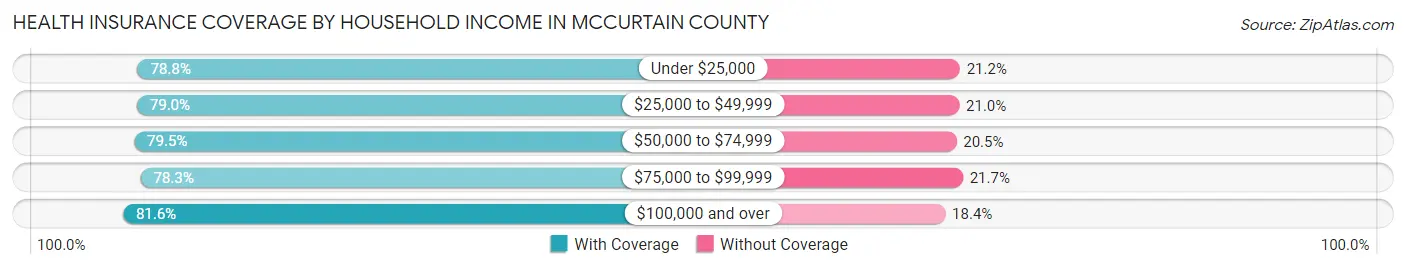
| Household Income | With Coverage | Without Coverage |
| Under $25,000 | 4,528 (78.8%) | 1,215 (21.2%) |
| $25,000 to $49,999 | 5,712 (79.0%) | 1,522 (21.0%) |
| $50,000 to $74,999 | 4,738 (79.5%) | 1,223 (20.5%) |
| $75,000 to $99,999 | 3,286 (78.3%) | 912 (21.7%) |
| $100,000 and over | 6,111 (81.6%) | 1,381 (18.4%) |
Public vs Private Health Insurance Coverage by Age in McCurtain County
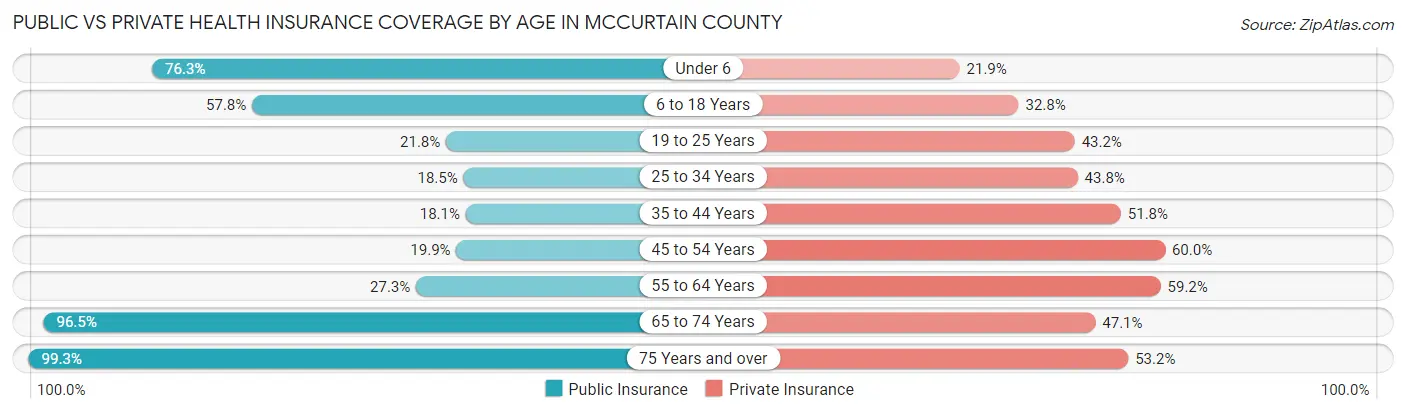
| Age Bracket | Public Insurance | Private Insurance |
| Under 6 | 2,046 (76.3%) | 586 (21.9%) |
| 6 to 18 Years | 3,273 (57.8%) | 1,859 (32.8%) |
| 19 to 25 Years | 545 (21.8%) | 1,083 (43.2%) |
| 25 to 34 Years | 636 (18.5%) | 1,503 (43.8%) |
| 35 to 44 Years | 629 (18.1%) | 1,799 (51.8%) |
| 45 to 54 Years | 720 (19.9%) | 2,176 (60.0%) |
| 55 to 64 Years | 1,066 (27.3%) | 2,308 (59.2%) |
| 65 to 74 Years | 3,017 (96.5%) | 1,472 (47.1%) |
| 75 Years and over | 2,242 (99.3%) | 1,201 (53.2%) |
| Total | 14,174 (46.2%) | 13,987 (45.6%) |
Disability Status by Sex by Age in McCurtain County
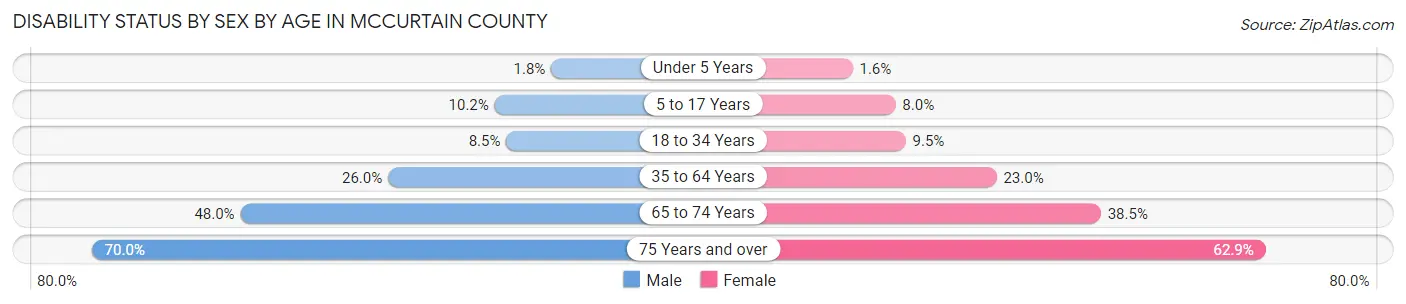
| Age Bracket | Male | Female |
| Under 5 Years | 20 (1.8%) | 17 (1.6%) |
| 5 to 17 Years | 307 (10.2%) | 224 (8.0%) |
| 18 to 34 Years | 266 (8.5%) | 298 (9.5%) |
| 35 to 64 Years | 1,400 (26.0%) | 1,291 (23.0%) |
| 65 to 74 Years | 715 (47.9%) | 629 (38.5%) |
| 75 Years and over | 713 (70.0%) | 781 (62.9%) |
Disability Class by Sex by Age in McCurtain County
Disability Class: Hearing Difficulty
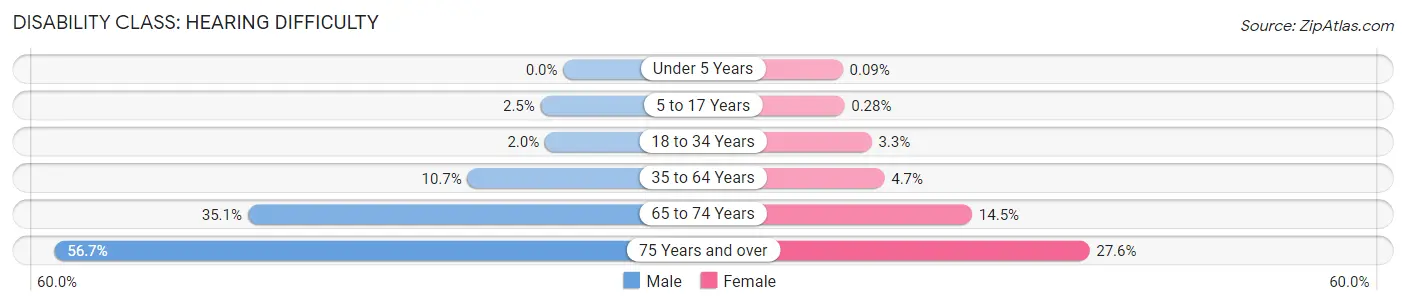
| Age Bracket | Male | Female |
| Under 5 Years | 0 (0.0%) | 1 (0.1%) |
| 5 to 17 Years | 76 (2.5%) | 8 (0.3%) |
| 18 to 34 Years | 64 (2.0%) | 104 (3.3%) |
| 35 to 64 Years | 574 (10.7%) | 266 (4.7%) |
| 65 to 74 Years | 524 (35.1%) | 237 (14.5%) |
| 75 Years and over | 577 (56.7%) | 342 (27.6%) |
Disability Class: Vision Difficulty
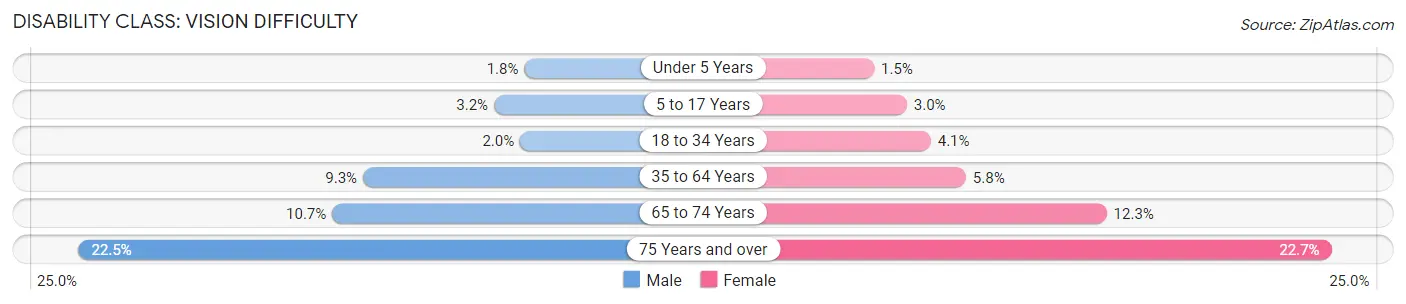
| Age Bracket | Male | Female |
| Under 5 Years | 20 (1.8%) | 16 (1.5%) |
| 5 to 17 Years | 97 (3.2%) | 85 (3.0%) |
| 18 to 34 Years | 63 (2.0%) | 130 (4.1%) |
| 35 to 64 Years | 500 (9.3%) | 324 (5.8%) |
| 65 to 74 Years | 160 (10.7%) | 201 (12.3%) |
| 75 Years and over | 229 (22.5%) | 282 (22.7%) |
Disability Class: Cognitive Difficulty
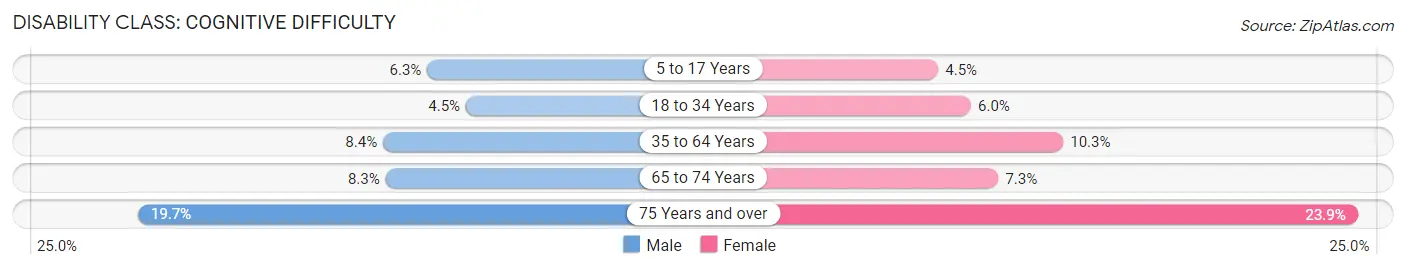
| Age Bracket | Male | Female |
| 5 to 17 Years | 190 (6.3%) | 126 (4.5%) |
| 18 to 34 Years | 142 (4.5%) | 189 (6.0%) |
| 35 to 64 Years | 450 (8.4%) | 578 (10.3%) |
| 65 to 74 Years | 123 (8.3%) | 119 (7.3%) |
| 75 Years and over | 201 (19.7%) | 297 (23.9%) |
Disability Class: Ambulatory Difficulty
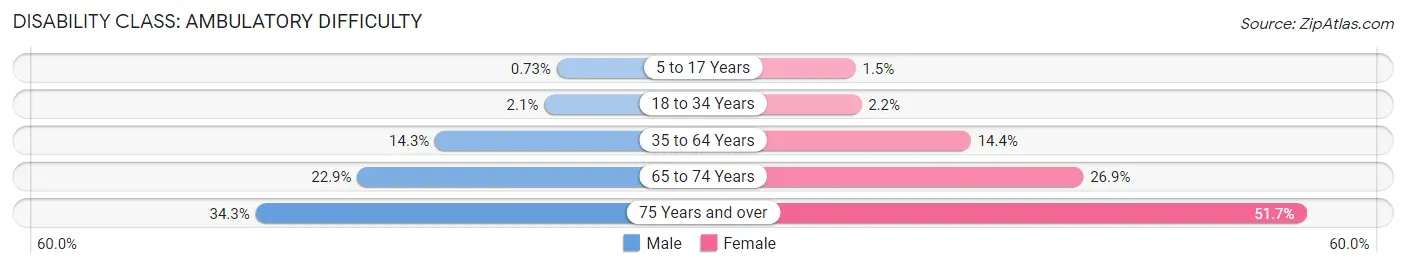
| Age Bracket | Male | Female |
| 5 to 17 Years | 22 (0.7%) | 43 (1.5%) |
| 18 to 34 Years | 67 (2.1%) | 68 (2.2%) |
| 35 to 64 Years | 768 (14.3%) | 807 (14.4%) |
| 65 to 74 Years | 342 (22.9%) | 440 (26.9%) |
| 75 Years and over | 349 (34.3%) | 642 (51.7%) |
Disability Class: Self-Care Difficulty
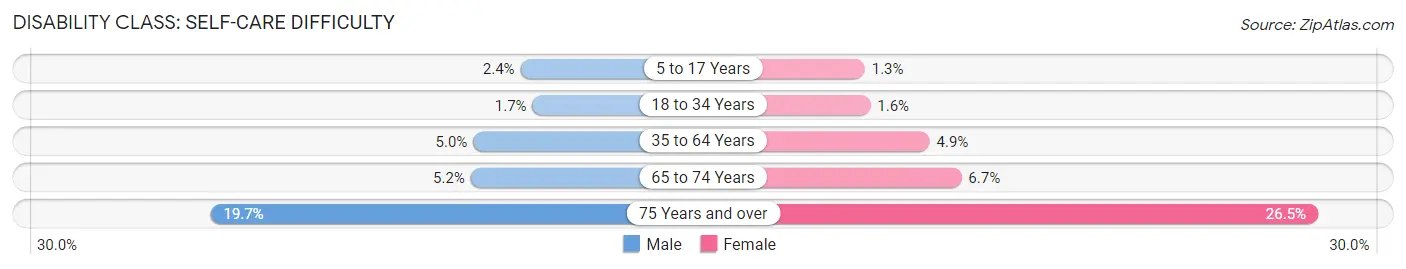
| Age Bracket | Male | Female |
| 5 to 17 Years | 72 (2.4%) | 36 (1.3%) |
| 18 to 34 Years | 54 (1.7%) | 50 (1.6%) |
| 35 to 64 Years | 270 (5.0%) | 275 (4.9%) |
| 65 to 74 Years | 77 (5.2%) | 109 (6.7%) |
| 75 Years and over | 200 (19.7%) | 329 (26.5%) |
Technology Access in McCurtain County
Computing Device Access in McCurtain County
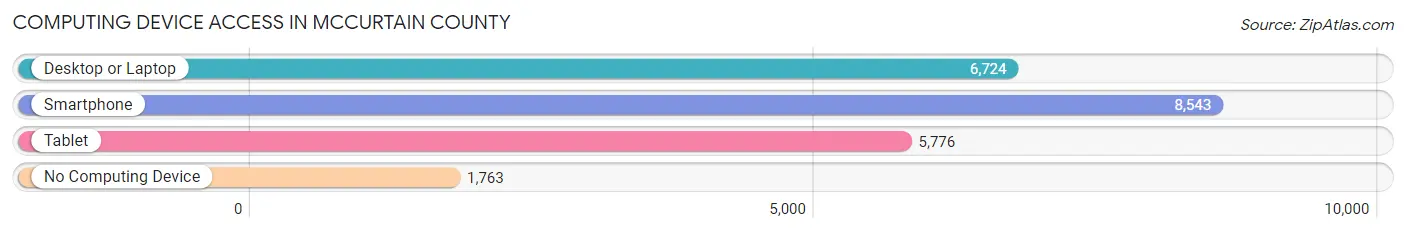
| Device Type | # Households | % Households |
| Desktop or Laptop | 6,724 | 59.7% |
| Smartphone | 8,543 | 75.8% |
| Tablet | 5,776 | 51.3% |
| No Computing Device | 1,763 | 15.7% |
| Total | 11,267 | 100.0% |
Internet Access in McCurtain County
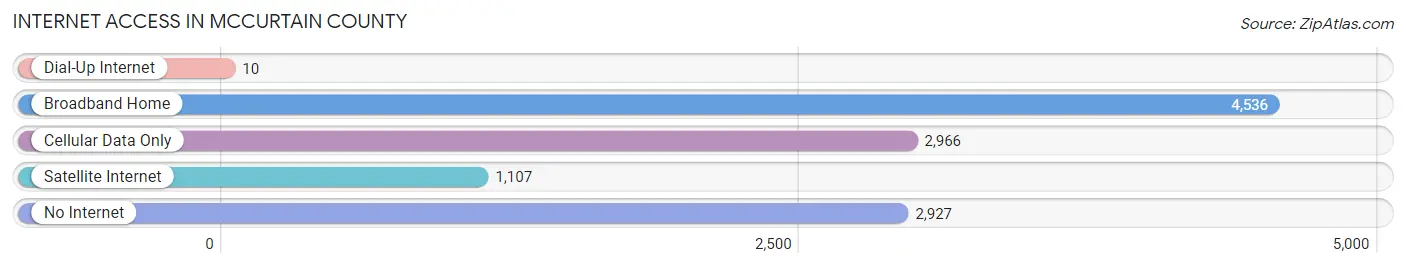
| Internet Type | # Households | % Households |
| Dial-Up Internet | 10 | 0.1% |
| Broadband Home | 4,536 | 40.3% |
| Cellular Data Only | 2,966 | 26.3% |
| Satellite Internet | 1,107 | 9.8% |
| No Internet | 2,927 | 26.0% |
| Total | 11,267 | 100.0% |
McCurtain County Summary
Mccurtain County is located in the southeastern corner of Oklahoma, and is bordered by Arkansas to the east, Texas to the south, and the Choctaw Nation to the west. It is part of the Ark-La-Tex region, and is the largest county in the state. The county seat is Idabel, and the largest city is Broken Bow.
History
Mccurtain County was created in 1907 from part of the Choctaw Nation. It was named after Green McCurtain, the last chief of the Choctaw Nation. The county was originally part of the Choctaw Nation, and the Choctaw people have a long history in the area. The Choctaw were the first Native American tribe to be removed from their ancestral lands in the southeastern United States, and were forcibly relocated to Oklahoma in the 1830s.
The county was largely rural until the early 20th century, when the timber industry began to develop. The timber industry was a major economic force in the county for many years, and the county was home to several large sawmills. The timber industry declined in the mid-20th century, and the county has since become more diversified.
Geography
Mccurtain County is located in the southeastern corner of Oklahoma, and is bordered by Arkansas to the east, Texas to the south, and the Choctaw Nation to the west. The county covers an area of 1,845 square miles, and is the largest county in the state. The terrain is mostly hilly and forested, with the Ouachita Mountains in the east and the Kiamichi Mountains in the west. The county is drained by the Red River and its tributaries, including the Mountain Fork, Little River, and Kiamichi River.
Economy
Mccurtain County has a diverse economy, with a mix of agriculture, manufacturing, and tourism. The county is home to several large poultry farms, and is a major producer of eggs and poultry products. The county is also home to several manufacturing plants, including a paper mill, a furniture factory, and a plastics plant. Tourism is also an important part of the economy, with Broken Bow Lake and Beavers Bend State Park being popular destinations.
Demographics
As of the 2010 census, Mccurtain County had a population of 33,151. The population is mostly white (83.3%), with a small African American population (7.2%) and a larger Native American population (9.5%). The median household income is $37,845, and the median home value is $90,400. The county has a poverty rate of 19.3%, and the unemployment rate is 5.2%.
Common Questions
What is Per Capita Income in McCurtain County?
Per Capita income in McCurtain County is $24,635.
What is the Median Family Income in McCurtain County?
Median Family Income in McCurtain County is $60,760.
What is the Median Household income in McCurtain County?
Median Household Income in McCurtain County is $47,046.
What is Income or Wage Gap in McCurtain County?
Income or Wage Gap in McCurtain County is 29.4%.
Women in McCurtain County earn 70.6 cents for every dollar earned by a man.
What is Family Income Deficit in McCurtain County?
Family Income Deficit in McCurtain County is $11,454.
Families that are below poverty line in McCurtain County earn $11,454 less on average than the poverty threshold level.
What is Inequality or Gini Index in McCurtain County?
Inequality or Gini Index in McCurtain County is 0.46.
What is the Total Population of McCurtain County?
Total Population of McCurtain County is 31,003.
What is the Total Male Population of McCurtain County?
Total Male Population of McCurtain County is 15,366.
What is the Total Female Population of McCurtain County?
Total Female Population of McCurtain County is 15,637.
What is the Ratio of Males per 100 Females in McCurtain County?
There are 98.27 Males per 100 Females in McCurtain County.
What is the Ratio of Females per 100 Males in McCurtain County?
There are 101.76 Females per 100 Males in McCurtain County.
What is the Median Population Age in McCurtain County?
Median Population Age in McCurtain County is 38.2 Years.
What is the Average Family Size in McCurtain County
Average Family Size in McCurtain County is 3.4 People.
What is the Average Household Size in McCurtain County
Average Household Size in McCurtain County is 2.7 People.
How Large is the Labor Force in McCurtain County?
There are 12,977 People in the Labor Forcein in McCurtain County.
What is the Percentage of People in the Labor Force in McCurtain County?
54.6% of People are in the Labor Force in McCurtain County.
What is the Unemployment Rate in McCurtain County?
Unemployment Rate in McCurtain County is 4.9%.