Major County, OK Map & Demographics
Major County Map
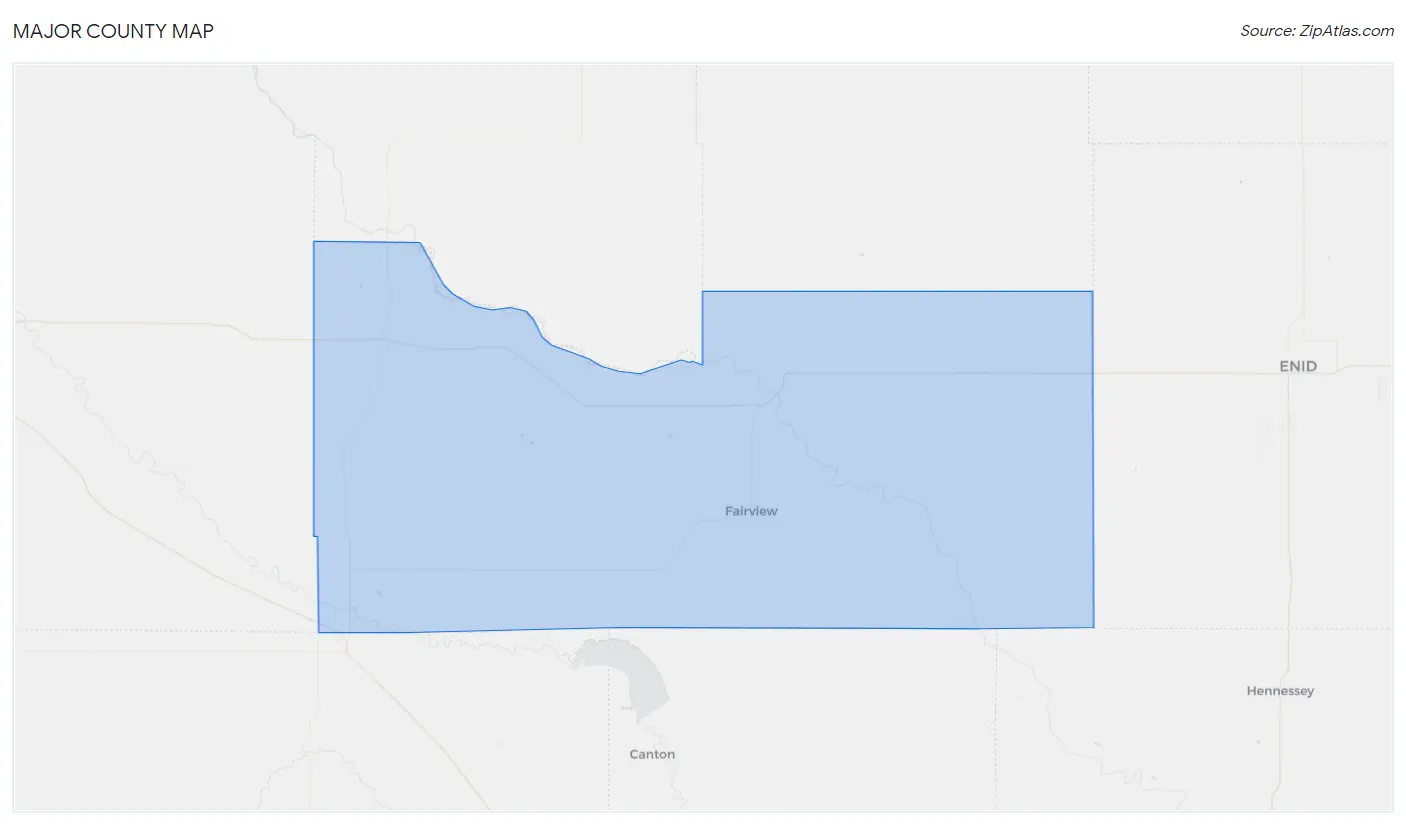
Major County Overview
$33,480
PER CAPITA INCOME
$78,455
AVG FAMILY INCOME
$67,621
AVG HOUSEHOLD INCOME
48.9%
WAGE / INCOME GAP [ % ]
51.1¢/ $1
WAGE / INCOME GAP [ $ ]
$9,024
FAMILY INCOME DEFICIT
0.41
INEQUALITY / GINI INDEX
7,678
TOTAL POPULATION
3,833
MALE POPULATION
3,845
FEMALE POPULATION
99.69
MALES / 100 FEMALES
100.31
FEMALES / 100 MALES
42.2
MEDIAN AGE
2.8
AVG FAMILY SIZE
2.4
AVG HOUSEHOLD SIZE
3,498
LABOR FORCE [ PEOPLE ]
59.1%
PERCENT IN LABOR FORCE
1.8%
UNEMPLOYMENT RATE
Major County Area Codes
Income in Major County
Income Overview in Major County
Per Capita Income in Major County is $33,480, while median incomes of families and households are $78,455 and $67,621 respectively.
| Characteristic | Number | Measure |
| Per Capita Income | 7,678 | $33,480 |
| Median Family Income | 2,256 | $78,455 |
| Mean Family Income | 2,256 | $92,925 |
| Median Household Income | 3,167 | $67,621 |
| Mean Household Income | 3,167 | $81,855 |
| Income Deficit | 2,256 | $9,024 |
| Wage / Income Gap (%) | 7,678 | 48.89% |
| Wage / Income Gap ($) | 7,678 | 51.11¢ per $1 |
| Gini / Inequality Index | 7,678 | 0.41 |
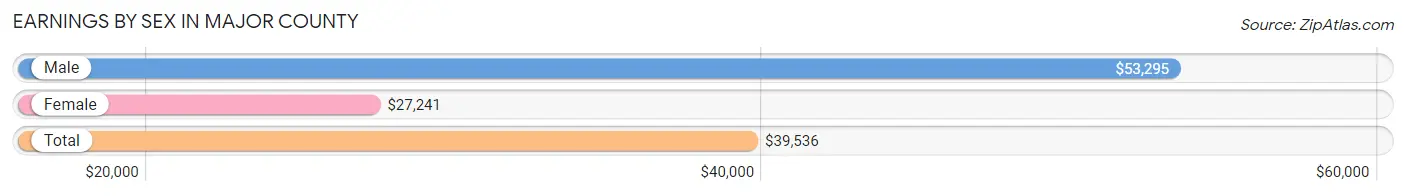
Earnings by Sex in Major County
Average Earnings in Major County are $39,536, $53,295 for men and $27,241 for women, a difference of 48.9%.
| Sex | Number | Average Earnings |
| Male | 2,038 (54.2%) | $53,295 |
| Female | 1,721 (45.8%) | $27,241 |
| Total | 3,759 (100.0%) | $39,536 |
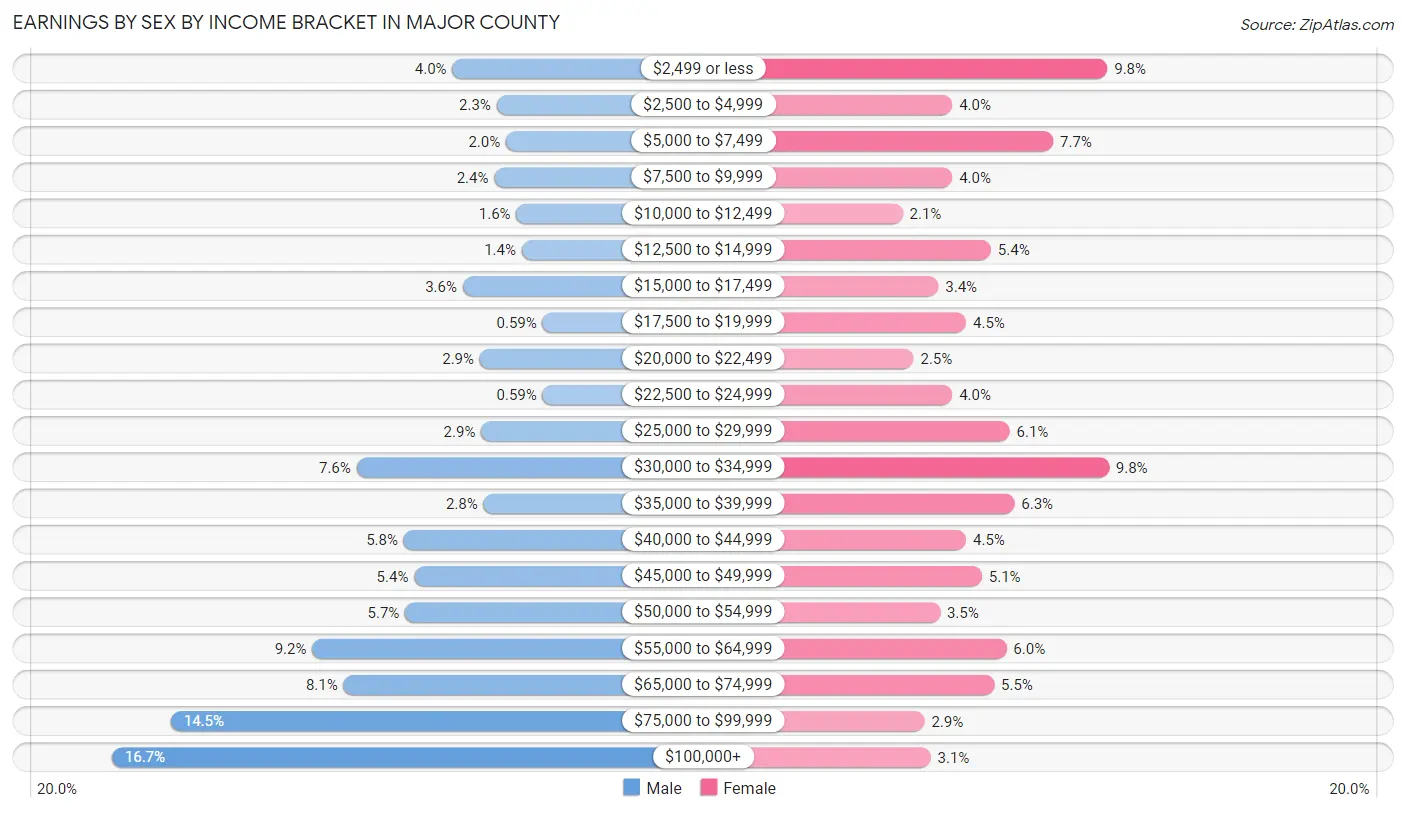
Earnings by Sex by Income Bracket in Major County
The most common earnings brackets in Major County are $100,000+ for men (341 | 16.7%) and $30,000 to $34,999 for women (169 | 9.8%).
| Income | Male | Female |
| $2,499 or less | 81 (4.0%) | 168 (9.8%) |
| $2,500 to $4,999 | 47 (2.3%) | 68 (4.0%) |
| $5,000 to $7,499 | 40 (2.0%) | 133 (7.7%) |
| $7,500 to $9,999 | 49 (2.4%) | 68 (4.0%) |
| $10,000 to $12,499 | 32 (1.6%) | 36 (2.1%) |
| $12,500 to $14,999 | 28 (1.4%) | 93 (5.4%) |
| $15,000 to $17,499 | 73 (3.6%) | 59 (3.4%) |
| $17,500 to $19,999 | 12 (0.6%) | 77 (4.5%) |
| $20,000 to $22,499 | 60 (2.9%) | 43 (2.5%) |
| $22,500 to $24,999 | 12 (0.6%) | 68 (4.0%) |
| $25,000 to $29,999 | 59 (2.9%) | 105 (6.1%) |
| $30,000 to $34,999 | 154 (7.6%) | 169 (9.8%) |
| $35,000 to $39,999 | 57 (2.8%) | 108 (6.3%) |
| $40,000 to $44,999 | 118 (5.8%) | 77 (4.5%) |
| $45,000 to $49,999 | 110 (5.4%) | 87 (5.1%) |
| $50,000 to $54,999 | 117 (5.7%) | 60 (3.5%) |
| $55,000 to $64,999 | 188 (9.2%) | 103 (6.0%) |
| $65,000 to $74,999 | 164 (8.1%) | 95 (5.5%) |
| $75,000 to $99,999 | 296 (14.5%) | 50 (2.9%) |
| $100,000+ | 341 (16.7%) | 54 (3.1%) |
| Total | 2,038 (100.0%) | 1,721 (100.0%) |
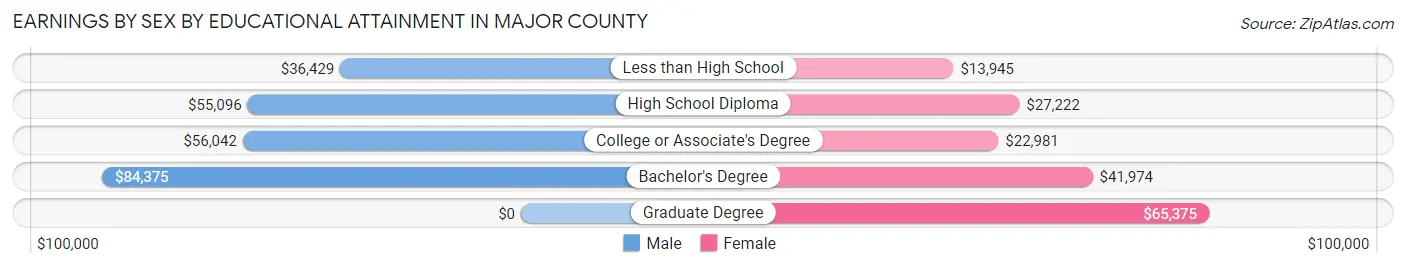
Earnings by Sex by Educational Attainment in Major County
Average earnings in Major County are $57,083 for men and $30,966 for women, a difference of 45.8%. Men with an educational attainment of bachelor's degree enjoy the highest average annual earnings of $84,375, while those with less than high school education earn the least with $36,429. Women with an educational attainment of graduate degree earn the most with the average annual earnings of $65,375, while those with less than high school education have the smallest earnings of $13,945.
| Educational Attainment | Male Income | Female Income |
| Less than High School | $36,429 | $13,945 |
| High School Diploma | $55,096 | $27,222 |
| College or Associate's Degree | $56,042 | $22,981 |
| Bachelor's Degree | $84,375 | $41,974 |
| Graduate Degree | - | - |
| Total | $57,083 | $30,966 |
Family Income in Major County
Family Income Brackets in Major County
According to the Major County family income data, there are 476 families falling into the $50,000 to $74,999 income range, which is the most common income bracket and makes up 21.1% of all families. Conversely, the less than $10,000 income bracket is the least frequent group with only 47 families (2.1%) belonging to this category.
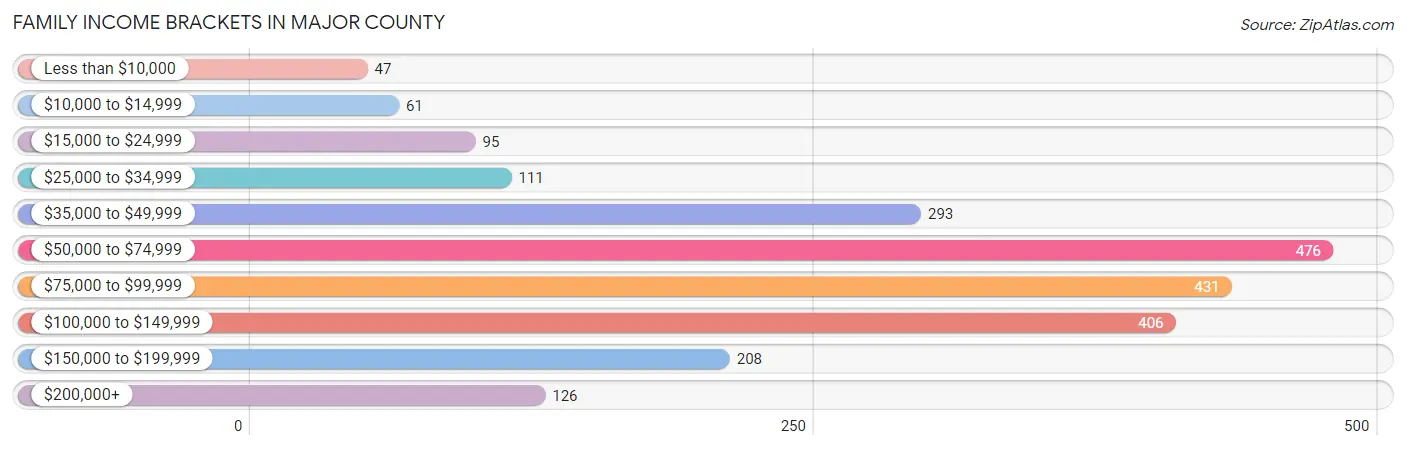
| Income Bracket | # Families | % Families |
| Less than $10,000 | 47 | 2.1% |
| $10,000 to $14,999 | 61 | 2.7% |
| $15,000 to $24,999 | 95 | 4.2% |
| $25,000 to $34,999 | 111 | 4.9% |
| $35,000 to $49,999 | 293 | 13.0% |
| $50,000 to $74,999 | 476 | 21.1% |
| $75,000 to $99,999 | 431 | 19.1% |
| $100,000 to $149,999 | 406 | 18.0% |
| $150,000 to $199,999 | 208 | 9.2% |
| $200,000+ | 126 | 5.6% |
Family Income by Famaliy Size in Major County
6-person families (44 | 1.9%) account for the highest median family income in Major County with $114,167 per family, while 2-person families (1,309 | 58.0%) have the highest median income of $38,492 per family member.
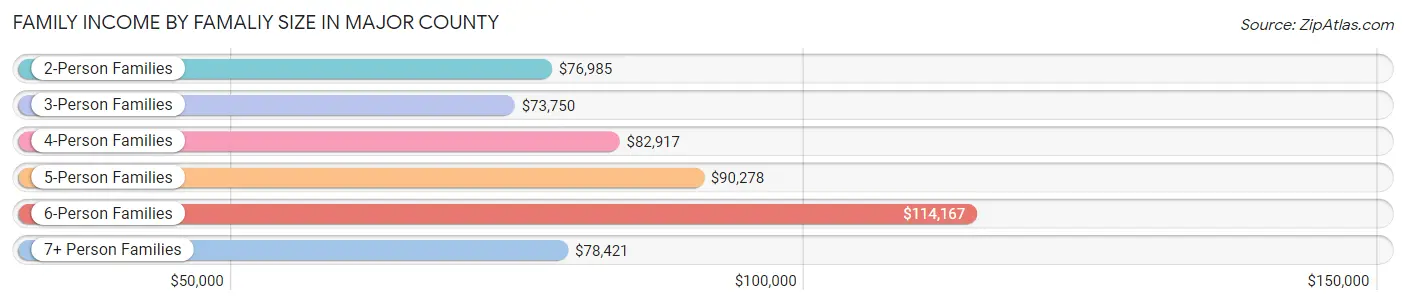
| Income Bracket | # Families | Median Income |
| 2-Person Families | 1,309 (58.0%) | $76,985 |
| 3-Person Families | 436 (19.3%) | $73,750 |
| 4-Person Families | 305 (13.5%) | $82,917 |
| 5-Person Families | 134 (5.9%) | $90,278 |
| 6-Person Families | 44 (1.9%) | $114,167 |
| 7+ Person Families | 28 (1.2%) | $78,421 |
| Total | 2,256 (100.0%) | $78,455 |
Family Income by Number of Earners in Major County
The median family income in Major County is $78,455, with families comprising 3+ earners (147) having the highest median family income of $141,875, while families with no earners (394) have the lowest median family income of $53,571, accounting for 6.5% and 17.5% of families, respectively.
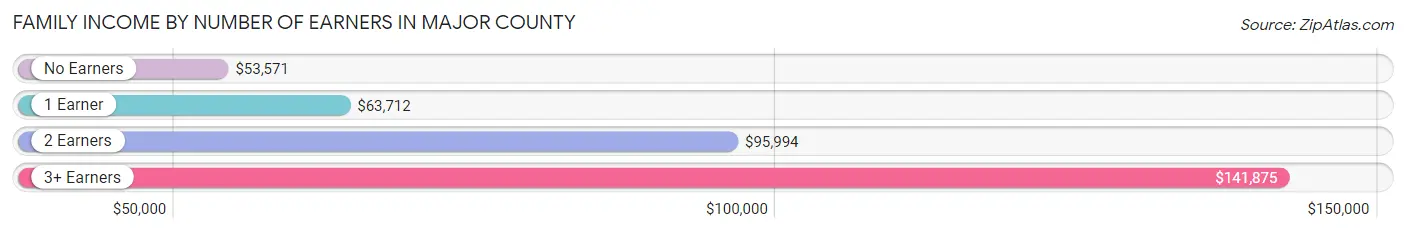
| Number of Earners | # Families | Median Income |
| No Earners | 394 (17.5%) | $53,571 |
| 1 Earner | 762 (33.8%) | $63,712 |
| 2 Earners | 953 (42.2%) | $95,994 |
| 3+ Earners | 147 (6.5%) | $141,875 |
| Total | 2,256 (100.0%) | $78,455 |
Household Income in Major County
Household Income Brackets in Major County
With 630 households falling in the category, the $50,000 to $74,999 income range is the most frequent in Major County, accounting for 19.9% of all households. In contrast, only 105 households (3.3%) fall into the $10,000 to $14,999 income bracket, making it the least populous group.
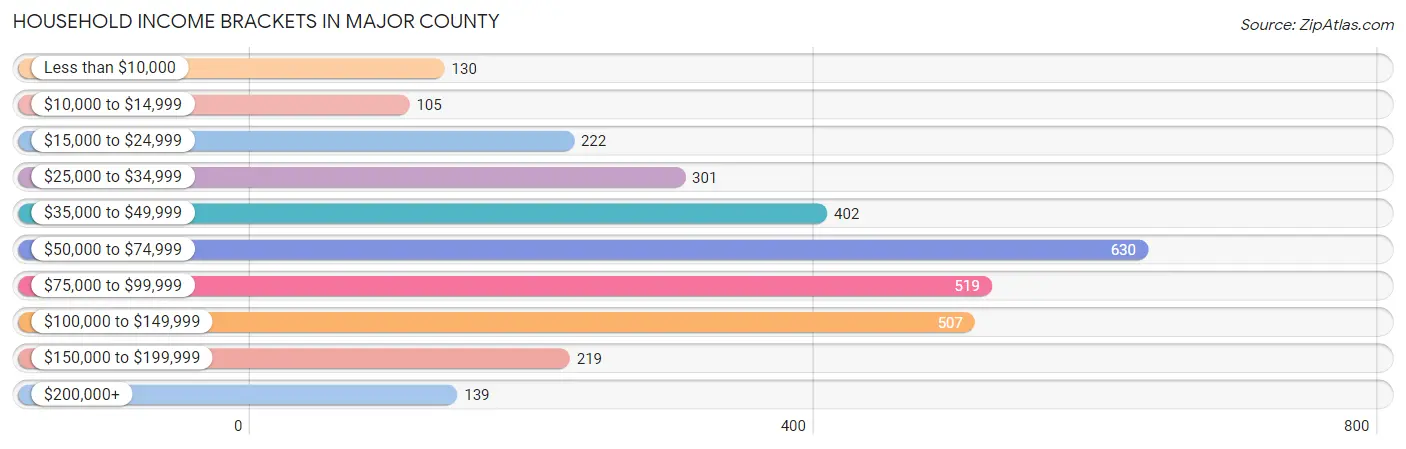
| Income Bracket | # Households | % Households |
| Less than $10,000 | 130 | 4.1% |
| $10,000 to $14,999 | 105 | 3.3% |
| $15,000 to $24,999 | 222 | 7.0% |
| $25,000 to $34,999 | 301 | 9.5% |
| $35,000 to $49,999 | 402 | 12.7% |
| $50,000 to $74,999 | 630 | 19.9% |
| $75,000 to $99,999 | 519 | 16.4% |
| $100,000 to $149,999 | 507 | 16.0% |
| $150,000 to $199,999 | 219 | 6.9% |
| $200,000+ | 139 | 4.4% |
Household Income by Householder Age in Major County
The median household income in Major County is $67,621, with the highest median household income of $78,732 found in the 25 to 44 years age bracket for the primary householder. A total of 899 households (28.4%) fall into this category. Meanwhile, the 65+ years age bracket for the primary householder has the lowest median household income of $47,381, with 1,020 households (32.2%) in this group.
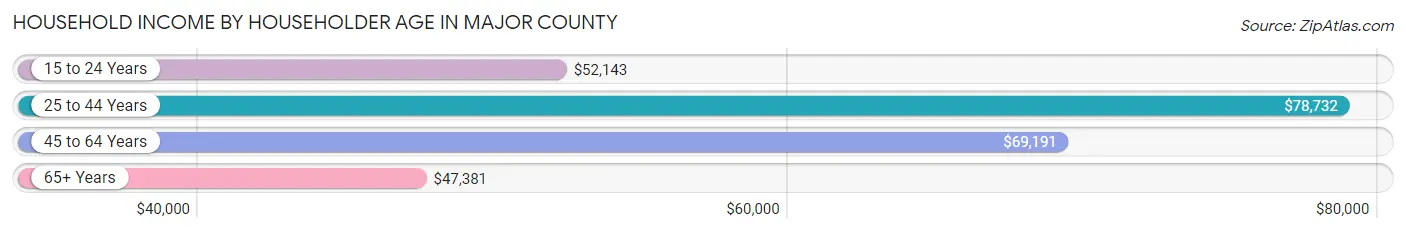
| Income Bracket | # Households | Median Income |
| 15 to 24 Years | 156 (4.9%) | $52,143 |
| 25 to 44 Years | 899 (28.4%) | $78,732 |
| 45 to 64 Years | 1,092 (34.5%) | $69,191 |
| 65+ Years | 1,020 (32.2%) | $47,381 |
| Total | 3,167 (100.0%) | $67,621 |
Poverty in Major County
Income Below Poverty by Sex and Age in Major County
With 10.6% poverty level for males and 12.7% for females among the residents of Major County, 12 to 14 year old males and 5 year old females are the most vulnerable to poverty, with 54 males (36.0%) and 5 females (62.5%) in their respective age groups living below the poverty level.
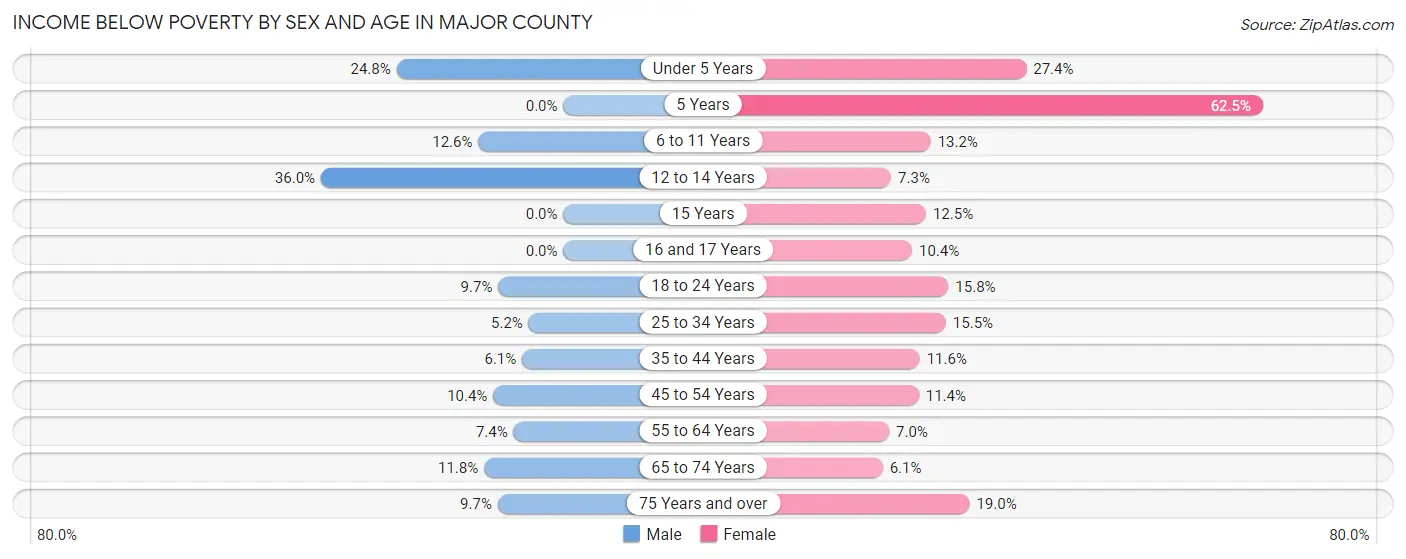
| Age Bracket | Male | Female |
| Under 5 Years | 55 (24.8%) | 60 (27.4%) |
| 5 Years | 0 (0.0%) | 5 (62.5%) |
| 6 to 11 Years | 50 (12.6%) | 45 (13.2%) |
| 12 to 14 Years | 54 (36.0%) | 11 (7.3%) |
| 15 Years | 0 (0.0%) | 10 (12.5%) |
| 16 and 17 Years | 0 (0.0%) | 12 (10.4%) |
| 18 to 24 Years | 26 (9.7%) | 38 (15.8%) |
| 25 to 34 Years | 19 (5.1%) | 60 (15.5%) |
| 35 to 44 Years | 29 (6.1%) | 50 (11.6%) |
| 45 to 54 Years | 45 (10.4%) | 52 (11.4%) |
| 55 to 64 Years | 40 (7.4%) | 35 (7.0%) |
| 65 to 74 Years | 51 (11.8%) | 27 (6.1%) |
| 75 Years and over | 26 (9.7%) | 73 (19.0%) |
| Total | 395 (10.6%) | 478 (12.7%) |
Income Above Poverty by Sex and Age in Major County
According to the poverty statistics in Major County, males aged 5 years and females aged 65 to 74 years are the age groups that are most secure financially, with 100.0% of males and 93.9% of females in these age groups living above the poverty line.
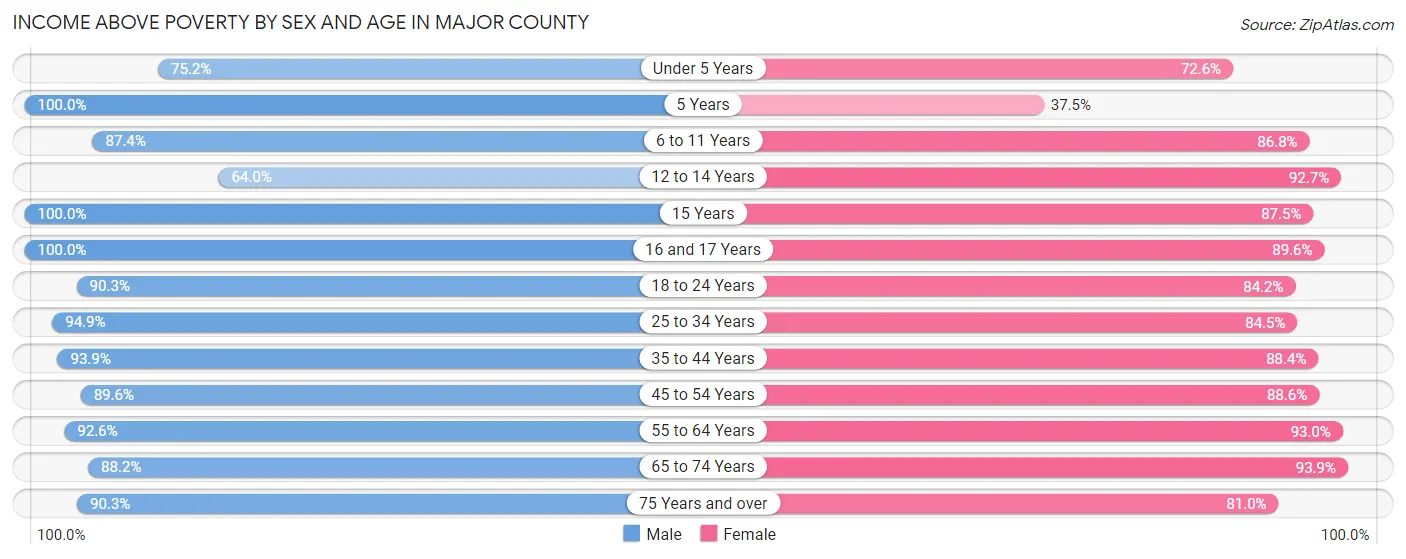
| Age Bracket | Male | Female |
| Under 5 Years | 167 (75.2%) | 159 (72.6%) |
| 5 Years | 22 (100.0%) | 3 (37.5%) |
| 6 to 11 Years | 346 (87.4%) | 296 (86.8%) |
| 12 to 14 Years | 96 (64.0%) | 139 (92.7%) |
| 15 Years | 96 (100.0%) | 70 (87.5%) |
| 16 and 17 Years | 70 (100.0%) | 103 (89.6%) |
| 18 to 24 Years | 243 (90.3%) | 202 (84.2%) |
| 25 to 34 Years | 350 (94.9%) | 328 (84.5%) |
| 35 to 44 Years | 445 (93.9%) | 382 (88.4%) |
| 45 to 54 Years | 387 (89.6%) | 403 (88.6%) |
| 55 to 64 Years | 501 (92.6%) | 463 (93.0%) |
| 65 to 74 Years | 382 (88.2%) | 417 (93.9%) |
| 75 Years and over | 241 (90.3%) | 312 (81.0%) |
| Total | 3,346 (89.4%) | 3,277 (87.3%) |
Income Below Poverty Among Married-Couple Families in Major County
The poverty statistics for married-couple families in Major County show that 4.3% or 80 of the total 1,884 families live below the poverty line. Families with 5 or more children have the highest poverty rate of 77.8%, comprising of 7 families. On the other hand, families with no children have the lowest poverty rate of 3.1%, which includes 37 families.
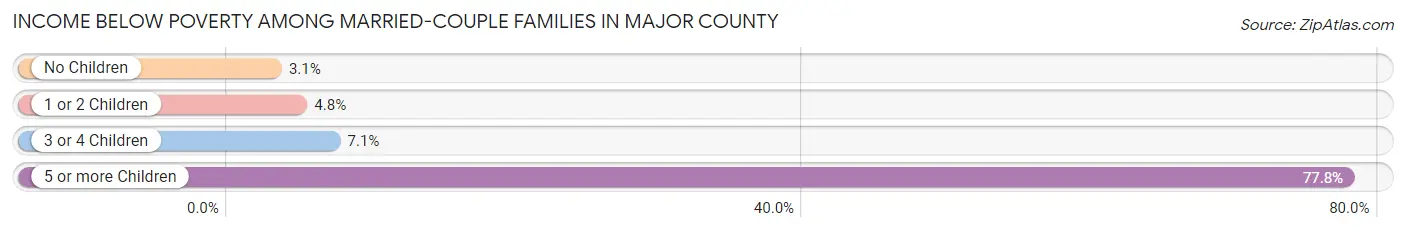
| Children | Above Poverty | Below Poverty |
| No Children | 1,173 (96.9%) | 37 (3.1%) |
| 1 or 2 Children | 473 (95.2%) | 24 (4.8%) |
| 3 or 4 Children | 156 (92.9%) | 12 (7.1%) |
| 5 or more Children | 2 (22.2%) | 7 (77.8%) |
| Total | 1,804 (95.8%) | 80 (4.3%) |
Income Below Poverty Among Single-Parent Households in Major County
According to the poverty data in Major County, 20.6% or 26 single-father households and 26.0% or 64 single-mother households are living below the poverty line. Among single-father households, those with 1 or 2 children have the highest poverty rate, with 24 households (32.4%) experiencing poverty. Likewise, among single-mother households, those with 1 or 2 children have the highest poverty rate, with 56 households (40.0%) falling below the poverty line.
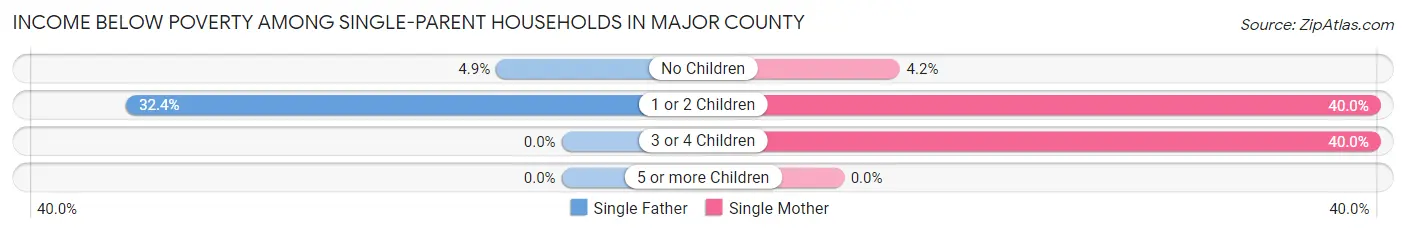
| Children | Single Father | Single Mother |
| No Children | 2 (4.9%) | 4 (4.2%) |
| 1 or 2 Children | 24 (32.4%) | 56 (40.0%) |
| 3 or 4 Children | 0 (0.0%) | 4 (40.0%) |
| 5 or more Children | 0 (0.0%) | 0 (0.0%) |
| Total | 26 (20.6%) | 64 (26.0%) |
Income Below Poverty Among Married-Couple vs Single-Parent Households in Major County
The poverty data for Major County shows that 80 of the married-couple family households (4.3%) and 90 of the single-parent households (24.2%) are living below the poverty level. Within the married-couple family households, those with 5 or more children have the highest poverty rate, with 7 households (77.8%) falling below the poverty line. Among the single-parent households, those with 1 or 2 children have the highest poverty rate, with 80 household (37.4%) living below poverty.
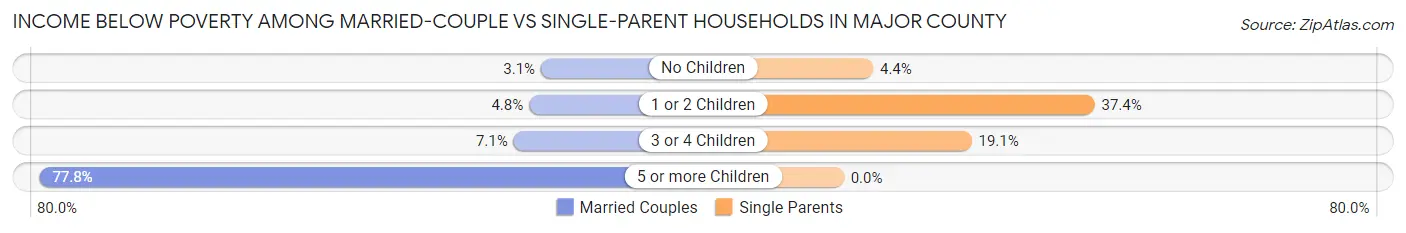
| Children | Married-Couple Families | Single-Parent Households |
| No Children | 37 (3.1%) | 6 (4.4%) |
| 1 or 2 Children | 24 (4.8%) | 80 (37.4%) |
| 3 or 4 Children | 12 (7.1%) | 4 (19.1%) |
| 5 or more Children | 7 (77.8%) | 0 (0.0%) |
| Total | 80 (4.3%) | 90 (24.2%) |
Race in Major County
The most populous races in Major County are White / Caucasian (6,560 | 85.4%), Hispanic or Latino (793 | 10.3%), and Two or more Races (615 | 8.0%).
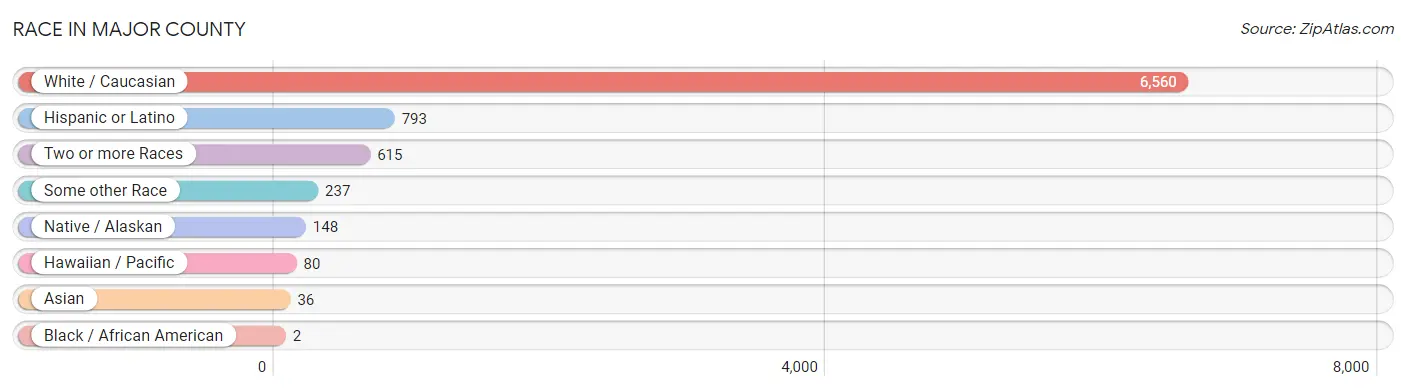
| Race | # Population | % Population |
| Asian | 36 | 0.5% |
| Black / African American | 2 | 0.0% |
| Hawaiian / Pacific | 80 | 1.0% |
| Hispanic or Latino | 793 | 10.3% |
| Native / Alaskan | 148 | 1.9% |
| White / Caucasian | 6,560 | 85.4% |
| Two or more Races | 615 | 8.0% |
| Some other Race | 237 | 3.1% |
| Total | 7,678 | 100.0% |
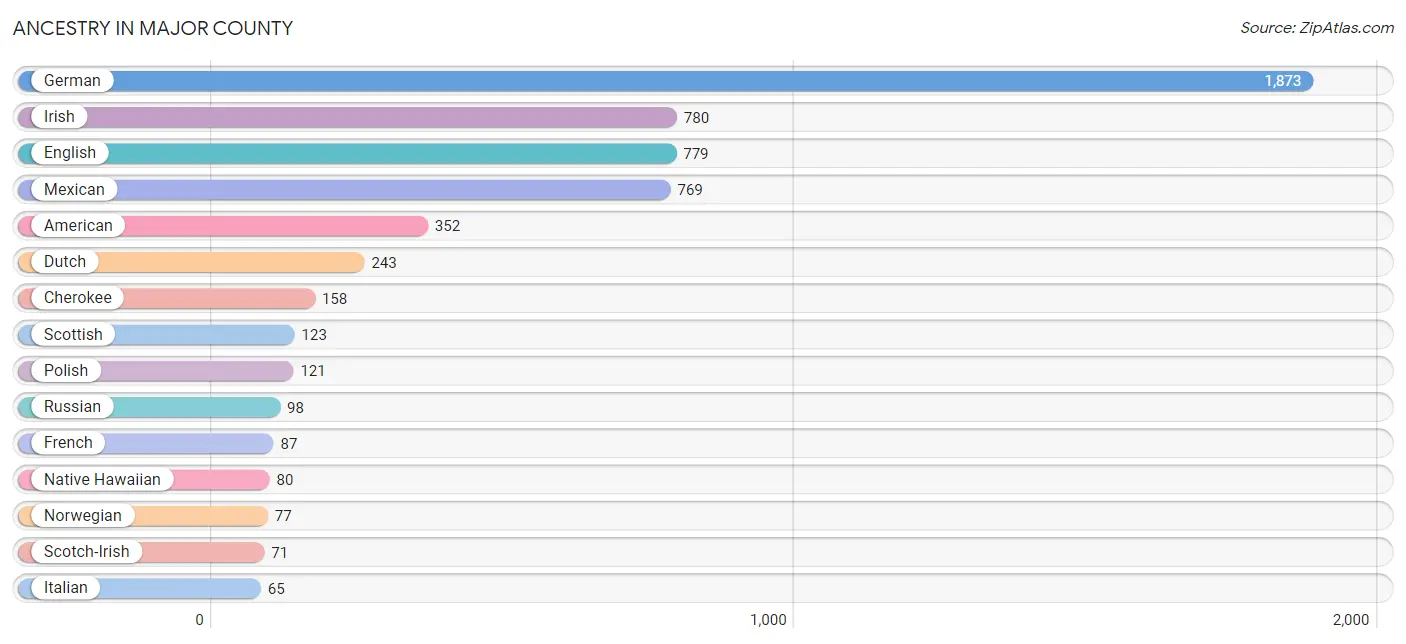
Ancestry in Major County
The most populous ancestries reported in Major County are German (1,873 | 24.4%), Irish (780 | 10.2%), English (779 | 10.2%), Mexican (769 | 10.0%), and American (352 | 4.6%), together accounting for 59.3% of all Major County residents.
| Ancestry | # Population | % Population |
| American | 352 | 4.6% |
| Apache | 36 | 0.5% |
| Arab | 4 | 0.1% |
| Arapaho | 2 | 0.0% |
| Assyrian / Chaldean / Syriac | 11 | 0.1% |
| Bhutanese | 20 | 0.3% |
| British | 3 | 0.0% |
| Bulgarian | 7 | 0.1% |
| Burmese | 3 | 0.0% |
| Central American | 9 | 0.1% |
| Cherokee | 158 | 2.1% |
| Chickasaw | 14 | 0.2% |
| Choctaw | 43 | 0.6% |
| Comanche | 2 | 0.0% |
| Czech | 53 | 0.7% |
| Danish | 25 | 0.3% |
| Delaware | 24 | 0.3% |
| Dutch | 243 | 3.2% |
| Eastern European | 2 | 0.0% |
| English | 779 | 10.2% |
| European | 64 | 0.8% |
| Finnish | 19 | 0.3% |
| French | 87 | 1.1% |
| French Canadian | 6 | 0.1% |
| German | 1,873 | 24.4% |
| German Russian | 3 | 0.0% |
| Guatemalan | 9 | 0.1% |
| Indian (Asian) | 2 | 0.0% |
| Irish | 780 | 10.2% |
| Iroquois | 2 | 0.0% |
| Italian | 65 | 0.9% |
| Korean | 54 | 0.7% |
| Latvian | 8 | 0.1% |
| Lebanese | 4 | 0.1% |
| Mexican | 769 | 10.0% |
| Mexican American Indian | 5 | 0.1% |
| Native Hawaiian | 80 | 1.0% |
| Navajo | 30 | 0.4% |
| Norwegian | 77 | 1.0% |
| Osage | 10 | 0.1% |
| Pennsylvania German | 4 | 0.1% |
| Polish | 121 | 1.6% |
| Portuguese | 19 | 0.3% |
| Russian | 98 | 1.3% |
| Scandinavian | 17 | 0.2% |
| Scotch-Irish | 71 | 0.9% |
| Scottish | 123 | 1.6% |
| Seminole | 2 | 0.0% |
| Spaniard | 5 | 0.1% |
| Spanish | 10 | 0.1% |
| Swedish | 6 | 0.1% |
| Swiss | 42 | 0.5% |
| Ukrainian | 3 | 0.0% |
| Welsh | 20 | 0.3% | View All 54 Rows |
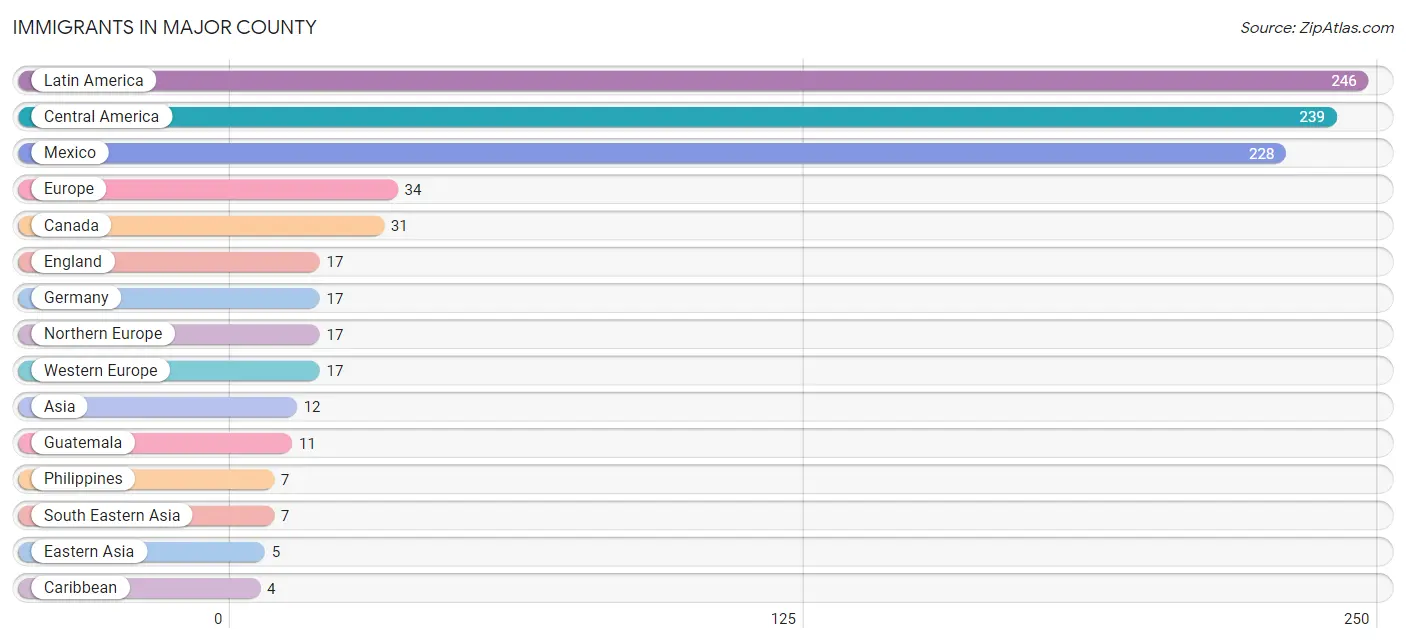
Immigrants in Major County
The most numerous immigrant groups reported in Major County came from Latin America (246 | 3.2%), Central America (239 | 3.1%), Mexico (228 | 3.0%), Europe (34 | 0.4%), and Canada (31 | 0.4%), together accounting for 10.1% of all Major County residents.
| Immigration Origin | # Population | % Population |
| Asia | 12 | 0.2% |
| Canada | 31 | 0.4% |
| Caribbean | 4 | 0.1% |
| Central America | 239 | 3.1% |
| China | 2 | 0.0% |
| Dominican Republic | 4 | 0.1% |
| Eastern Asia | 5 | 0.1% |
| England | 17 | 0.2% |
| Europe | 34 | 0.4% |
| Germany | 17 | 0.2% |
| Guatemala | 11 | 0.1% |
| Japan | 3 | 0.0% |
| Latin America | 246 | 3.2% |
| Mexico | 228 | 3.0% |
| Northern Europe | 17 | 0.2% |
| Philippines | 7 | 0.1% |
| South America | 3 | 0.0% |
| South Eastern Asia | 7 | 0.1% |
| Venezuela | 3 | 0.0% |
| Western Europe | 17 | 0.2% | View All 20 Rows |
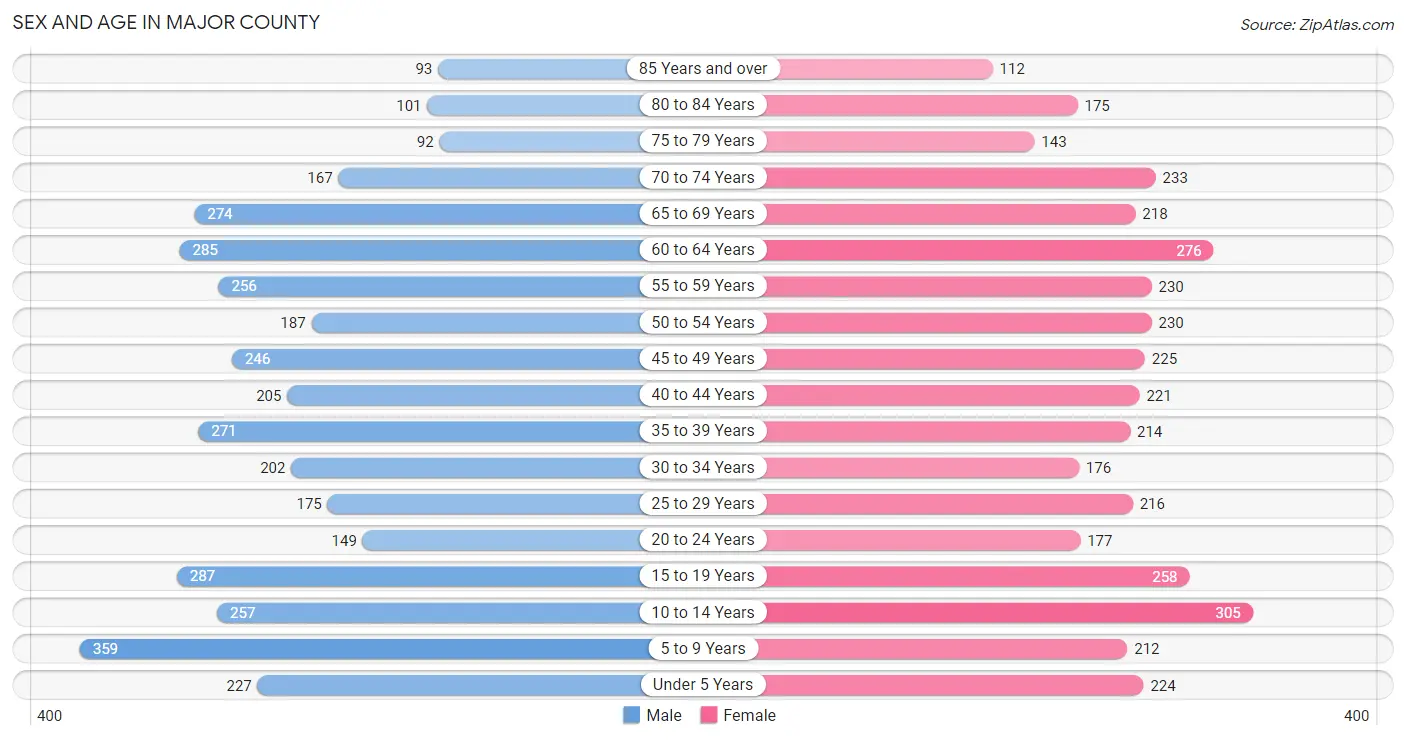
Sex and Age in Major County
Sex and Age in Major County
The most populous age groups in Major County are 5 to 9 Years (359 | 9.4%) for men and 10 to 14 Years (305 | 7.9%) for women.
| Age Bracket | Male | Female |
| Under 5 Years | 227 (5.9%) | 224 (5.8%) |
| 5 to 9 Years | 359 (9.4%) | 212 (5.5%) |
| 10 to 14 Years | 257 (6.7%) | 305 (7.9%) |
| 15 to 19 Years | 287 (7.5%) | 258 (6.7%) |
| 20 to 24 Years | 149 (3.9%) | 177 (4.6%) |
| 25 to 29 Years | 175 (4.6%) | 216 (5.6%) |
| 30 to 34 Years | 202 (5.3%) | 176 (4.6%) |
| 35 to 39 Years | 271 (7.1%) | 214 (5.6%) |
| 40 to 44 Years | 205 (5.3%) | 221 (5.8%) |
| 45 to 49 Years | 246 (6.4%) | 225 (5.9%) |
| 50 to 54 Years | 187 (4.9%) | 230 (6.0%) |
| 55 to 59 Years | 256 (6.7%) | 230 (6.0%) |
| 60 to 64 Years | 285 (7.4%) | 276 (7.2%) |
| 65 to 69 Years | 274 (7.1%) | 218 (5.7%) |
| 70 to 74 Years | 167 (4.4%) | 233 (6.1%) |
| 75 to 79 Years | 92 (2.4%) | 143 (3.7%) |
| 80 to 84 Years | 101 (2.6%) | 175 (4.5%) |
| 85 Years and over | 93 (2.4%) | 112 (2.9%) |
| Total | 3,833 (100.0%) | 3,845 (100.0%) |
Families and Households in Major County
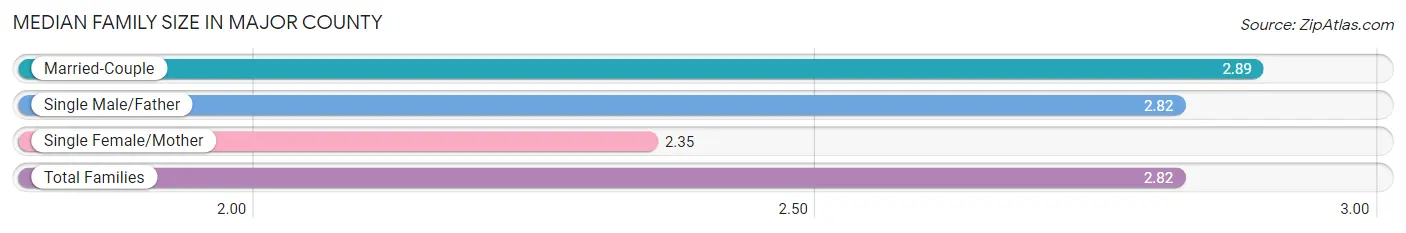
Median Family Size in Major County
The median family size in Major County is 2.82 persons per family, with married-couple families (1,884 | 83.5%) accounting for the largest median family size of 2.89 persons per family. On the other hand, single female/mother families (246 | 10.9%) represent the smallest median family size with 2.35 persons per family.
| Family Type | # Families | Family Size |
| Married-Couple | 1,884 (83.5%) | 2.89 |
| Single Male/Father | 126 (5.6%) | 2.82 |
| Single Female/Mother | 246 (10.9%) | 2.35 |
| Total Families | 2,256 (100.0%) | 2.82 |
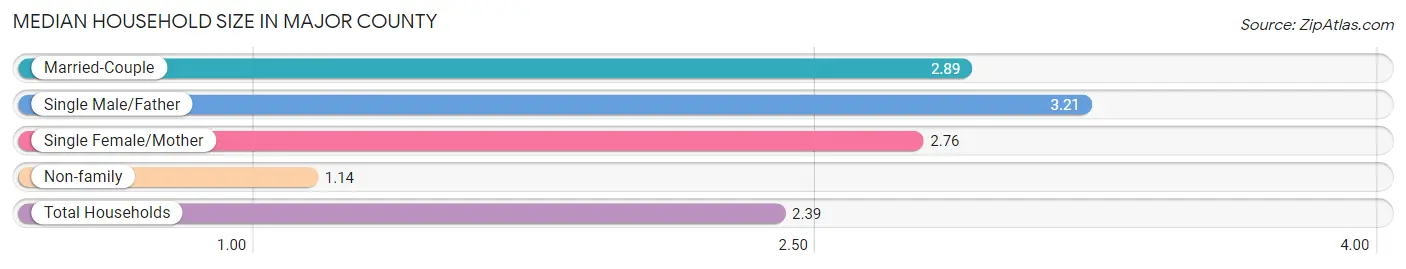
Median Household Size in Major County
The median household size in Major County is 2.39 persons per household, with single male/father households (126 | 4.0%) accounting for the largest median household size of 3.21 persons per household. non-family households (911 | 28.8%) represent the smallest median household size with 1.14 persons per household.
| Household Type | # Households | Household Size |
| Married-Couple | 1,884 (59.5%) | 2.89 |
| Single Male/Father | 126 (4.0%) | 3.21 |
| Single Female/Mother | 246 (7.8%) | 2.76 |
| Non-family | 911 (28.8%) | 1.14 |
| Total Households | 3,167 (100.0%) | 2.39 |
Household Size by Marriage Status in Major County
Out of a total of 3,167 households in Major County, 2,256 (71.2%) are family households, while 911 (28.8%) are nonfamily households. The most numerous type of family households are 2-person households, comprising 1,245, and the most common type of nonfamily households are 1-person households, comprising 777.
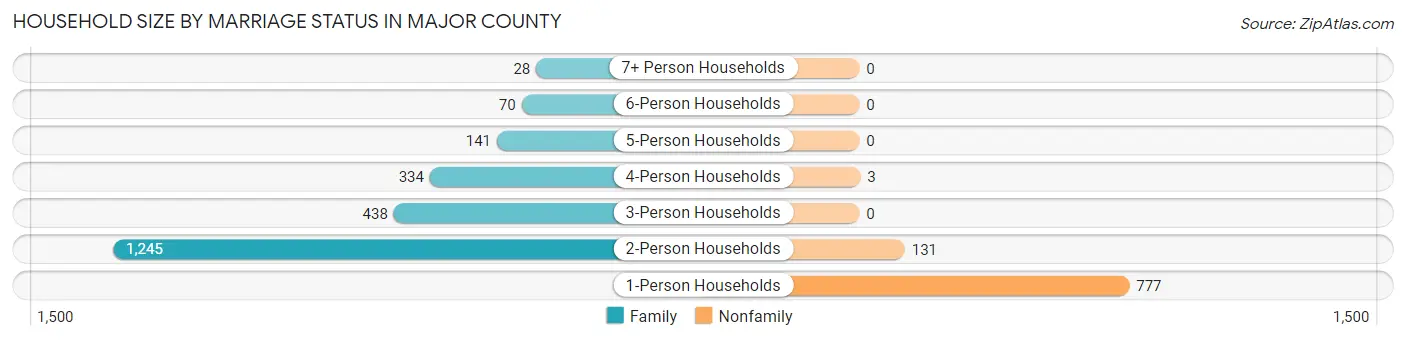
| Household Size | Family Households | Nonfamily Households |
| 1-Person Households | - | 777 (24.5%) |
| 2-Person Households | 1,245 (39.3%) | 131 (4.1%) |
| 3-Person Households | 438 (13.8%) | 0 (0.0%) |
| 4-Person Households | 334 (10.5%) | 3 (0.1%) |
| 5-Person Households | 141 (4.4%) | 0 (0.0%) |
| 6-Person Households | 70 (2.2%) | 0 (0.0%) |
| 7+ Person Households | 28 (0.9%) | 0 (0.0%) |
| Total | 2,256 (71.2%) | 911 (28.8%) |
Female Fertility in Major County
Fertility by Age in Major County
Average fertility rate in Major County is 80.0 births per 1,000 women. Women in the age bracket of 20 to 34 years have the highest fertility rate with 172.0 births per 1,000 women. Women in the age bracket of 20 to 34 years acount for 80.3% of all women with births.
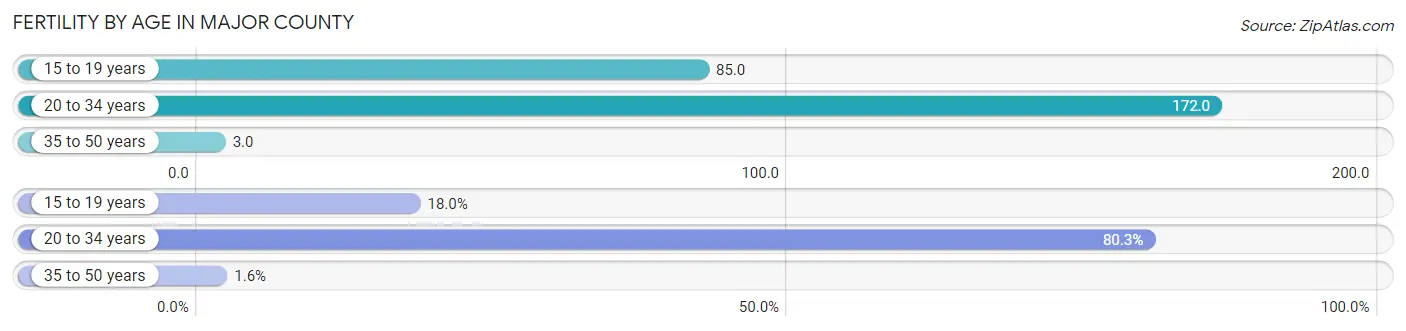
| Age Bracket | Women with Births | Births / 1,000 Women |
| 15 to 19 years | 22 (18.0%) | 85.0 |
| 20 to 34 years | 98 (80.3%) | 172.0 |
| 35 to 50 years | 2 (1.6%) | 3.0 |
| Total | 122 (100.0%) | 80.0 |
Fertility by Age by Marriage Status in Major County
73.8% of women with births (122) in Major County are married. The highest percentage of unmarried women with births falls into 15 to 19 years age bracket with 100.0% of them unmarried at the time of birth, while the lowest percentage of unmarried women with births belong to 35 to 50 years age bracket with 0.0% of them unmarried.
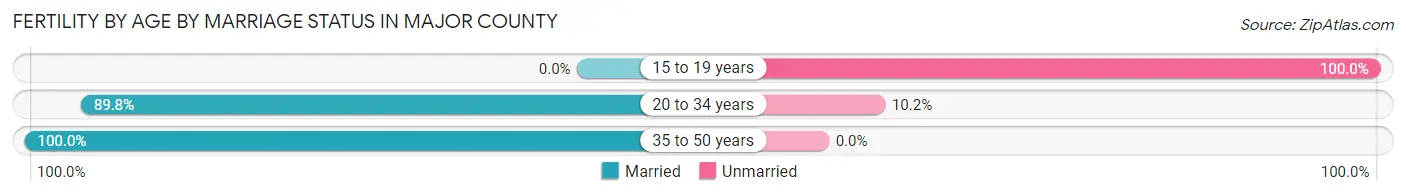
| Age Bracket | Married | Unmarried |
| 15 to 19 years | 0 (0.0%) | 22 (100.0%) |
| 20 to 34 years | 88 (89.8%) | 10 (10.2%) |
| 35 to 50 years | 2 (100.0%) | 0 (0.0%) |
| Total | 90 (73.8%) | 32 (26.2%) |
Fertility by Education in Major County
Average fertility rate in Major County is 80.0 births per 1,000 women. Women with the education attainment of graduate degree have the highest fertility rate of 227.0 births per 1,000 women, while women with the education attainment of bachelor's degree have the lowest fertility at 24.0 births per 1,000 women. Women with the education attainment of college or associate's degree represent 41.8% of all women with births.
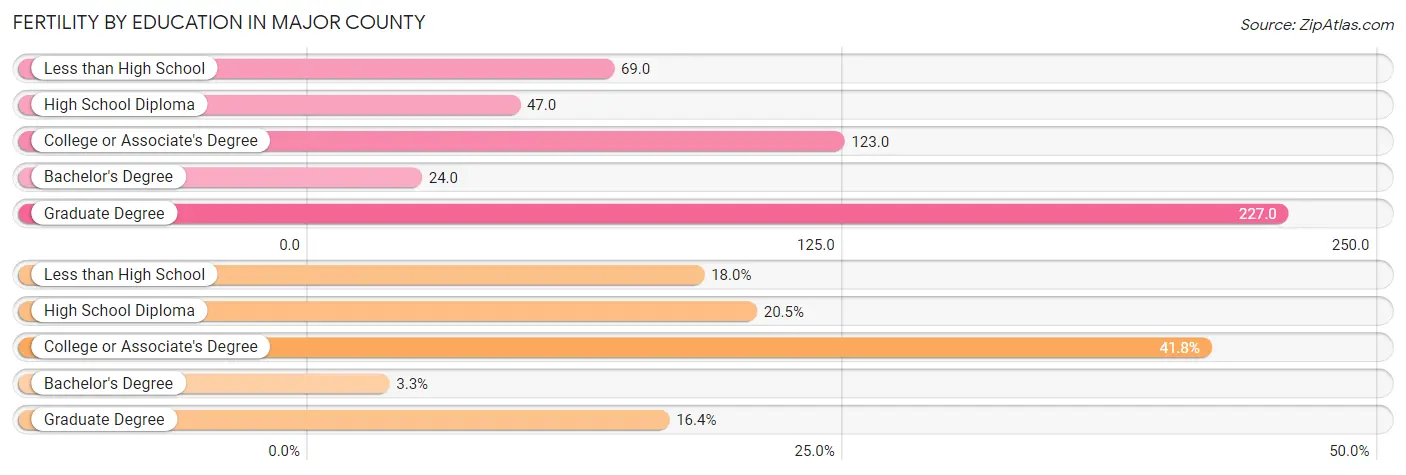
| Educational Attainment | Women with Births | Births / 1,000 Women |
| Less than High School | 22 (18.0%) | 69.0 |
| High School Diploma | 25 (20.5%) | 47.0 |
| College or Associate's Degree | 51 (41.8%) | 123.0 |
| Bachelor's Degree | 4 (3.3%) | 24.0 |
| Graduate Degree | 20 (16.4%) | 227.0 |
| Total | 122 (100.0%) | 80.0 |
Fertility by Education by Marriage Status in Major County
26.2% of women with births in Major County are unmarried. Women with the educational attainment of college or associate's degree are most likely to be married with 100.0% of them married at childbirth, while women with the educational attainment of less than high school are least likely to be married with 100.0% of them unmarried at childbirth.
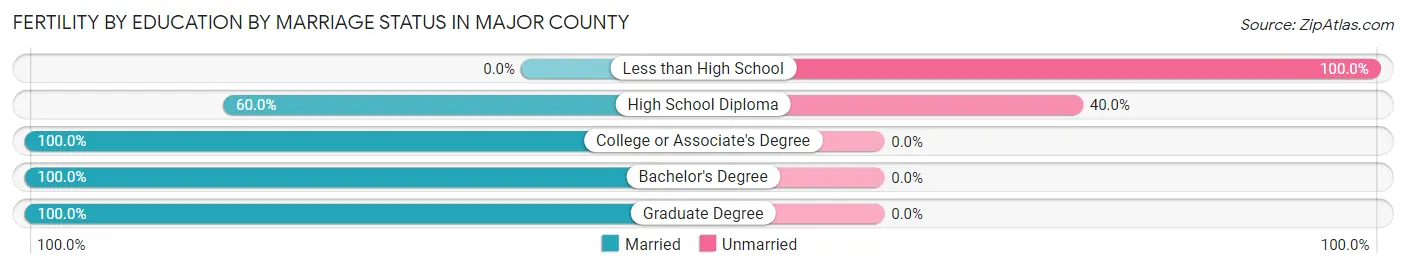
| Educational Attainment | Married | Unmarried |
| Less than High School | 0 (0.0%) | 22 (100.0%) |
| High School Diploma | 15 (60.0%) | 10 (40.0%) |
| College or Associate's Degree | 51 (100.0%) | 0 (0.0%) |
| Bachelor's Degree | 4 (100.0%) | 0 (0.0%) |
| Graduate Degree | 20 (100.0%) | 0 (0.0%) |
| Total | 90 (73.8%) | 32 (26.2%) |
Employment Characteristics in Major County
Employment by Class of Employer in Major County
Among the 3,387 employed individuals in Major County, private company employees (2,224 | 65.7%), self-employed (not incorporated) (386 | 11.4%), and local government employees (288 | 8.5%) make up the most common classes of employment.
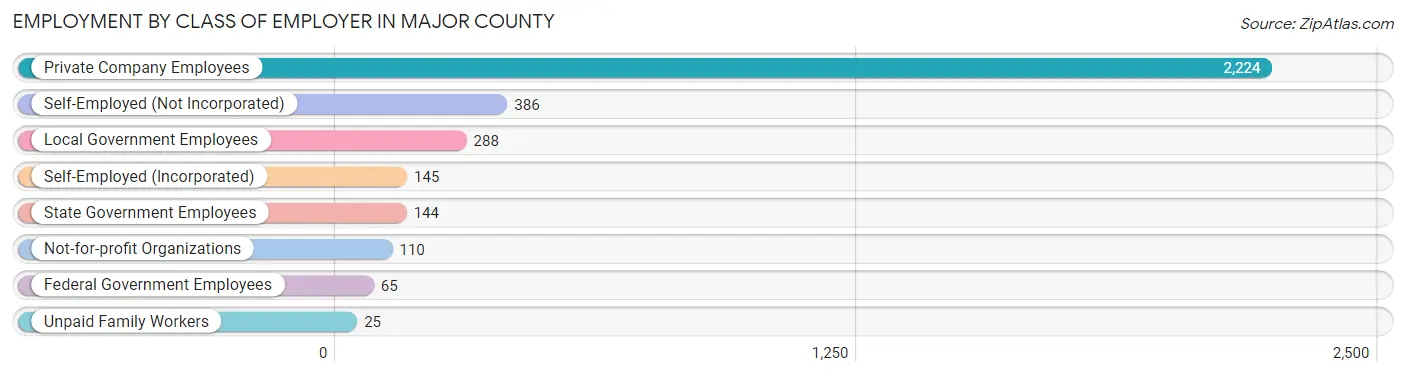
| Employer Class | # Employees | % Employees |
| Private Company Employees | 2,224 | 65.7% |
| Self-Employed (Incorporated) | 145 | 4.3% |
| Self-Employed (Not Incorporated) | 386 | 11.4% |
| Not-for-profit Organizations | 110 | 3.3% |
| Local Government Employees | 288 | 8.5% |
| State Government Employees | 144 | 4.3% |
| Federal Government Employees | 65 | 1.9% |
| Unpaid Family Workers | 25 | 0.7% |
| Total | 3,387 | 100.0% |
Employment Status by Age in Major County
According to the labor force statistics for Major County, out of the total population over 16 years of age (5,918), 59.1% or 3,498 individuals are in the labor force, with 1.8% or 63 of them unemployed. The age group with the highest labor force participation rate is 45 to 54 years, with 84.8% or 753 individuals in the labor force. Within the labor force, the 55 to 59 years age range has the highest percentage of unemployed individuals, with 3.7% or 14 of them being unemployed.
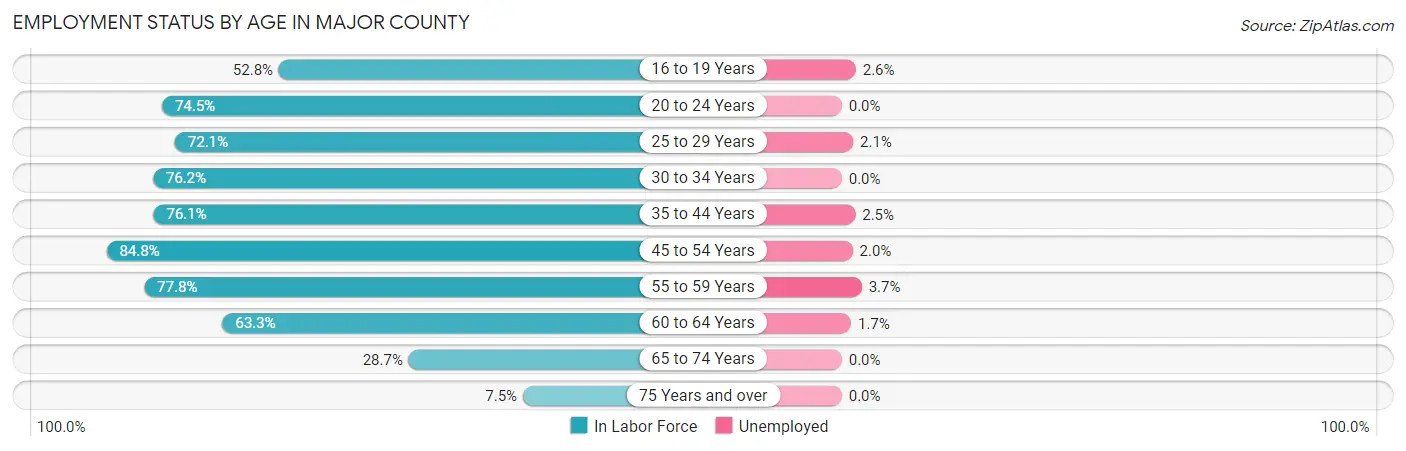
| Age Bracket | In Labor Force | Unemployed |
| 16 to 19 Years | 195 (52.8%) | 5 (2.6%) |
| 20 to 24 Years | 243 (74.5%) | 0 (0.0%) |
| 25 to 29 Years | 282 (72.1%) | 6 (2.1%) |
| 30 to 34 Years | 288 (76.2%) | 0 (0.0%) |
| 35 to 44 Years | 693 (76.1%) | 17 (2.5%) |
| 45 to 54 Years | 753 (84.8%) | 15 (2.0%) |
| 55 to 59 Years | 378 (77.8%) | 14 (3.7%) |
| 60 to 64 Years | 355 (63.3%) | 6 (1.7%) |
| 65 to 74 Years | 256 (28.7%) | 0 (0.0%) |
| 75 Years and over | 54 (7.5%) | 0 (0.0%) |
| Total | 3,498 (59.1%) | 63 (1.8%) |
Employment Status by Educational Attainment in Major County
According to labor force statistics for Major County, 76.0% of individuals (2,747) out of the total population between 25 and 64 years of age (3,615) are in the labor force, with 2.1% or 58 of them being unemployed. The group with the highest labor force participation rate are those with the educational attainment of bachelor's degree or higher, with 89.7% or 618 individuals in the labor force. Within the labor force, individuals with less than high school education have the highest percentage of unemployment, with 5.2% or 10 of them being unemployed.
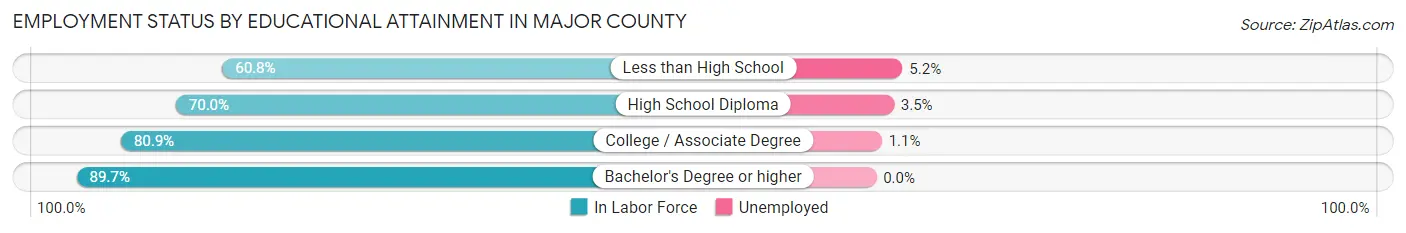
| Educational Attainment | In Labor Force | Unemployed |
| Less than High School | 192 (60.8%) | 16 (5.2%) |
| High School Diploma | 1,103 (70.0%) | 55 (3.5%) |
| College / Associate Degree | 837 (80.9%) | 11 (1.1%) |
| Bachelor's Degree or higher | 618 (89.7%) | 0 (0.0%) |
| Total | 2,747 (76.0%) | 76 (2.1%) |
Employment Occupations by Sex in Major County
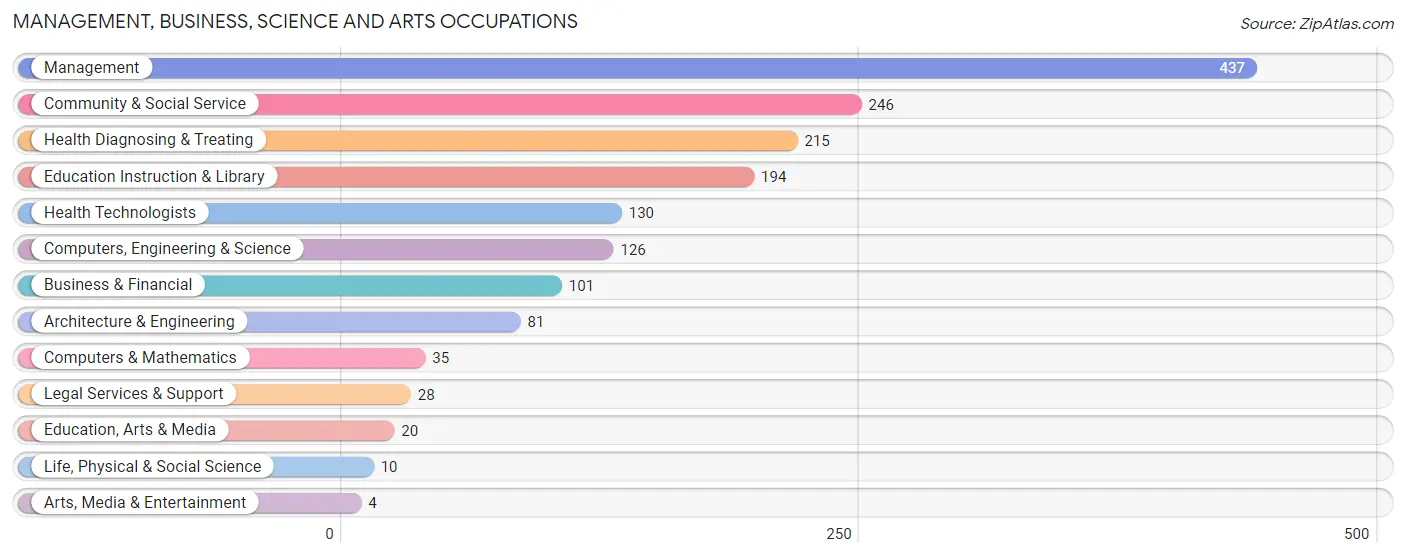
Management, Business, Science and Arts Occupations
The most common Management, Business, Science and Arts occupations in Major County are Management (437 | 12.7%), Community & Social Service (246 | 7.2%), Health Diagnosing & Treating (215 | 6.3%), Education Instruction & Library (194 | 5.7%), and Health Technologists (130 | 3.8%).
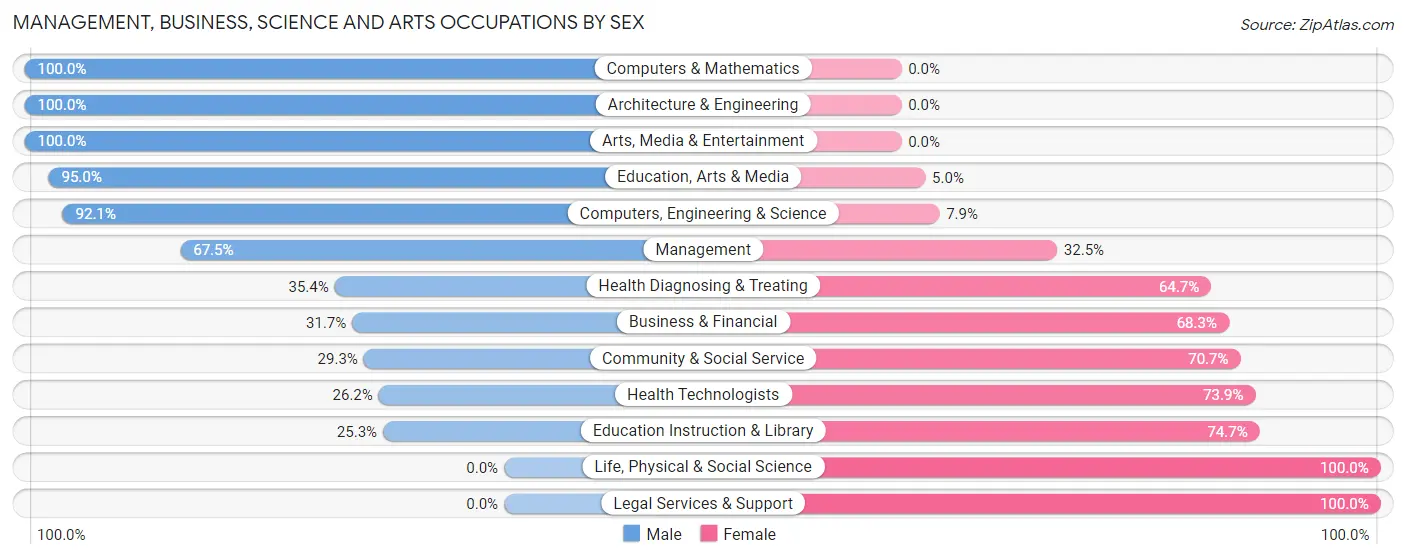
Management, Business, Science and Arts Occupations by Sex
Within the Management, Business, Science and Arts occupations in Major County, the most male-oriented occupations are Computers & Mathematics (100.0%), Architecture & Engineering (100.0%), and Arts, Media & Entertainment (100.0%), while the most female-oriented occupations are Life, Physical & Social Science (100.0%), Legal Services & Support (100.0%), and Education Instruction & Library (74.7%).
| Occupation | Male | Female |
| Management | 295 (67.5%) | 142 (32.5%) |
| Business & Financial | 32 (31.7%) | 69 (68.3%) |
| Computers, Engineering & Science | 116 (92.1%) | 10 (7.9%) |
| Computers & Mathematics | 35 (100.0%) | 0 (0.0%) |
| Architecture & Engineering | 81 (100.0%) | 0 (0.0%) |
| Life, Physical & Social Science | 0 (0.0%) | 10 (100.0%) |
| Community & Social Service | 72 (29.3%) | 174 (70.7%) |
| Education, Arts & Media | 19 (95.0%) | 1 (5.0%) |
| Legal Services & Support | 0 (0.0%) | 28 (100.0%) |
| Education Instruction & Library | 49 (25.3%) | 145 (74.7%) |
| Arts, Media & Entertainment | 4 (100.0%) | 0 (0.0%) |
| Health Diagnosing & Treating | 76 (35.3%) | 139 (64.6%) |
| Health Technologists | 34 (26.2%) | 96 (73.9%) |
| Total (Category) | 591 (52.5%) | 534 (47.5%) |
| Total (Overall) | 1,882 (54.8%) | 1,552 (45.2%) |
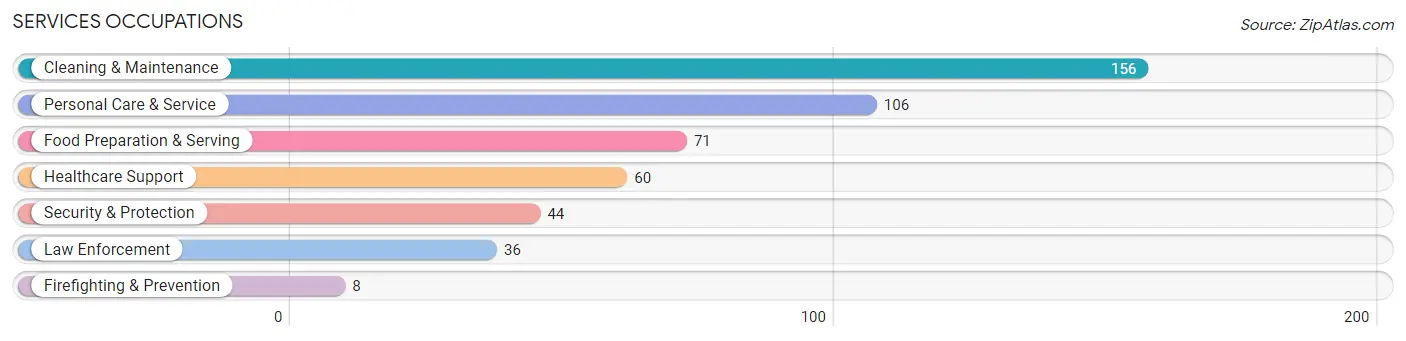
Services Occupations
The most common Services occupations in Major County are Cleaning & Maintenance (156 | 4.5%), Personal Care & Service (106 | 3.1%), Food Preparation & Serving (71 | 2.1%), Healthcare Support (60 | 1.8%), and Security & Protection (44 | 1.3%).
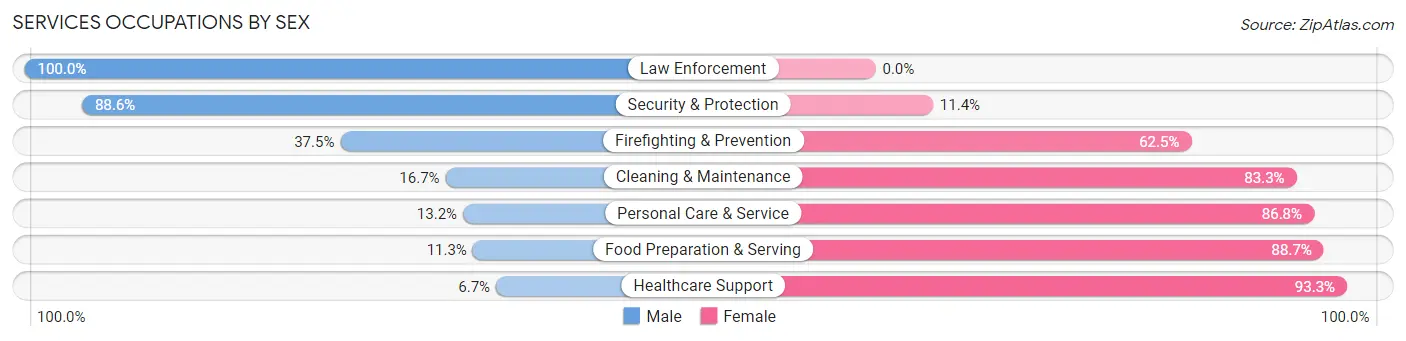
Services Occupations by Sex
Within the Services occupations in Major County, the most male-oriented occupations are Law Enforcement (100.0%), Security & Protection (88.6%), and Firefighting & Prevention (37.5%), while the most female-oriented occupations are Healthcare Support (93.3%), Food Preparation & Serving (88.7%), and Personal Care & Service (86.8%).
| Occupation | Male | Female |
| Healthcare Support | 4 (6.7%) | 56 (93.3%) |
| Security & Protection | 39 (88.6%) | 5 (11.4%) |
| Firefighting & Prevention | 3 (37.5%) | 5 (62.5%) |
| Law Enforcement | 36 (100.0%) | 0 (0.0%) |
| Food Preparation & Serving | 8 (11.3%) | 63 (88.7%) |
| Cleaning & Maintenance | 26 (16.7%) | 130 (83.3%) |
| Personal Care & Service | 14 (13.2%) | 92 (86.8%) |
| Total (Category) | 91 (20.8%) | 346 (79.2%) |
| Total (Overall) | 1,882 (54.8%) | 1,552 (45.2%) |
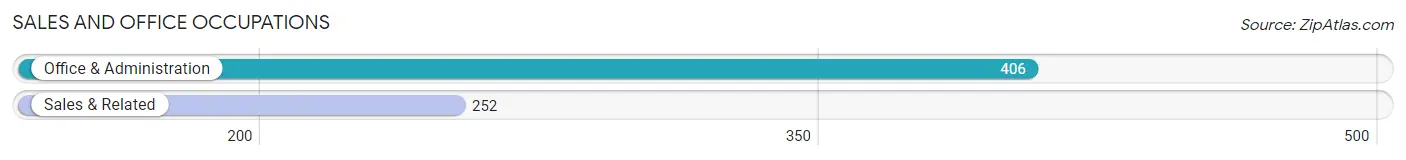
Sales and Office Occupations
The most common Sales and Office occupations in Major County are Office & Administration (406 | 11.8%), and Sales & Related (252 | 7.3%).
Sales and Office Occupations by Sex
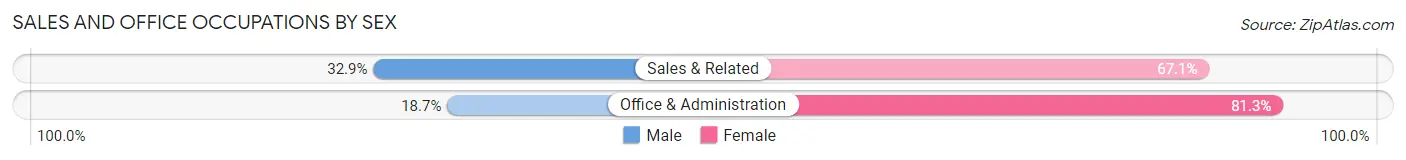
| Occupation | Male | Female |
| Sales & Related | 83 (32.9%) | 169 (67.1%) |
| Office & Administration | 76 (18.7%) | 330 (81.3%) |
| Total (Category) | 159 (24.2%) | 499 (75.8%) |
| Total (Overall) | 1,882 (54.8%) | 1,552 (45.2%) |
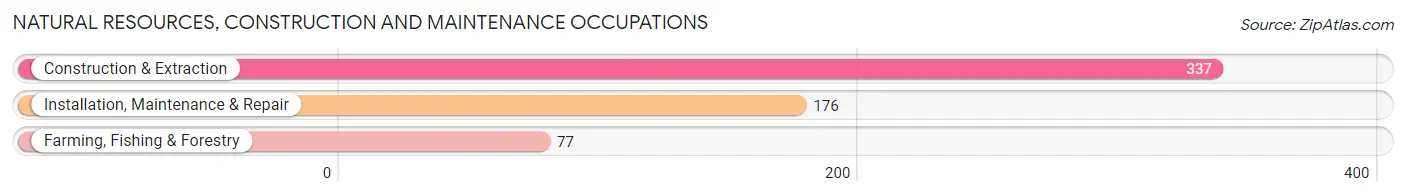
Natural Resources, Construction and Maintenance Occupations
The most common Natural Resources, Construction and Maintenance occupations in Major County are Construction & Extraction (337 | 9.8%), Installation, Maintenance & Repair (176 | 5.1%), and Farming, Fishing & Forestry (77 | 2.2%).
Natural Resources, Construction and Maintenance Occupations by Sex
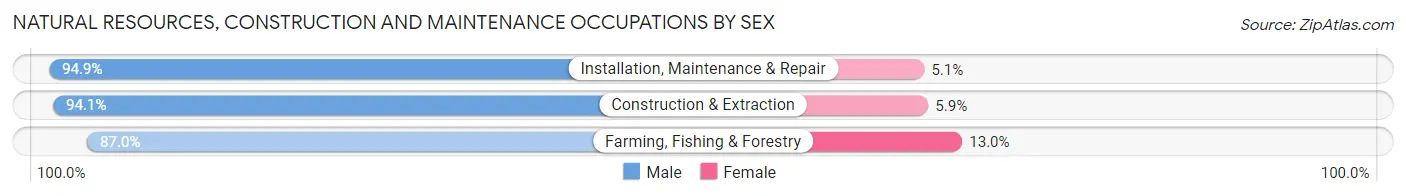
| Occupation | Male | Female |
| Farming, Fishing & Forestry | 67 (87.0%) | 10 (13.0%) |
| Construction & Extraction | 317 (94.1%) | 20 (5.9%) |
| Installation, Maintenance & Repair | 167 (94.9%) | 9 (5.1%) |
| Total (Category) | 551 (93.4%) | 39 (6.6%) |
| Total (Overall) | 1,882 (54.8%) | 1,552 (45.2%) |
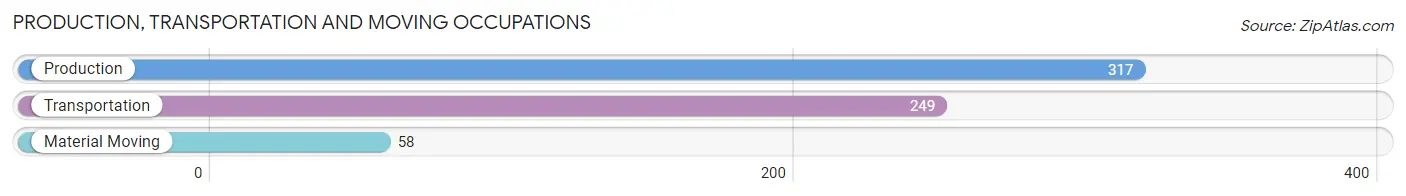
Production, Transportation and Moving Occupations
The most common Production, Transportation and Moving occupations in Major County are Production (317 | 9.2%), Transportation (249 | 7.2%), and Material Moving (58 | 1.7%).
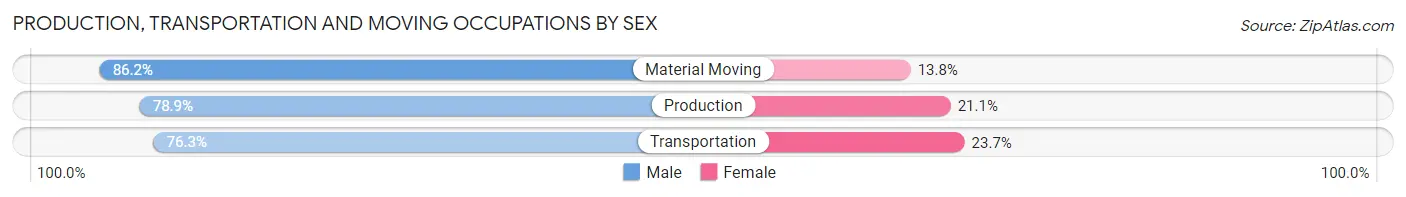
Production, Transportation and Moving Occupations by Sex
| Occupation | Male | Female |
| Production | 250 (78.9%) | 67 (21.1%) |
| Transportation | 190 (76.3%) | 59 (23.7%) |
| Material Moving | 50 (86.2%) | 8 (13.8%) |
| Total (Category) | 490 (78.5%) | 134 (21.5%) |
| Total (Overall) | 1,882 (54.8%) | 1,552 (45.2%) |
Employment Industries by Sex in Major County
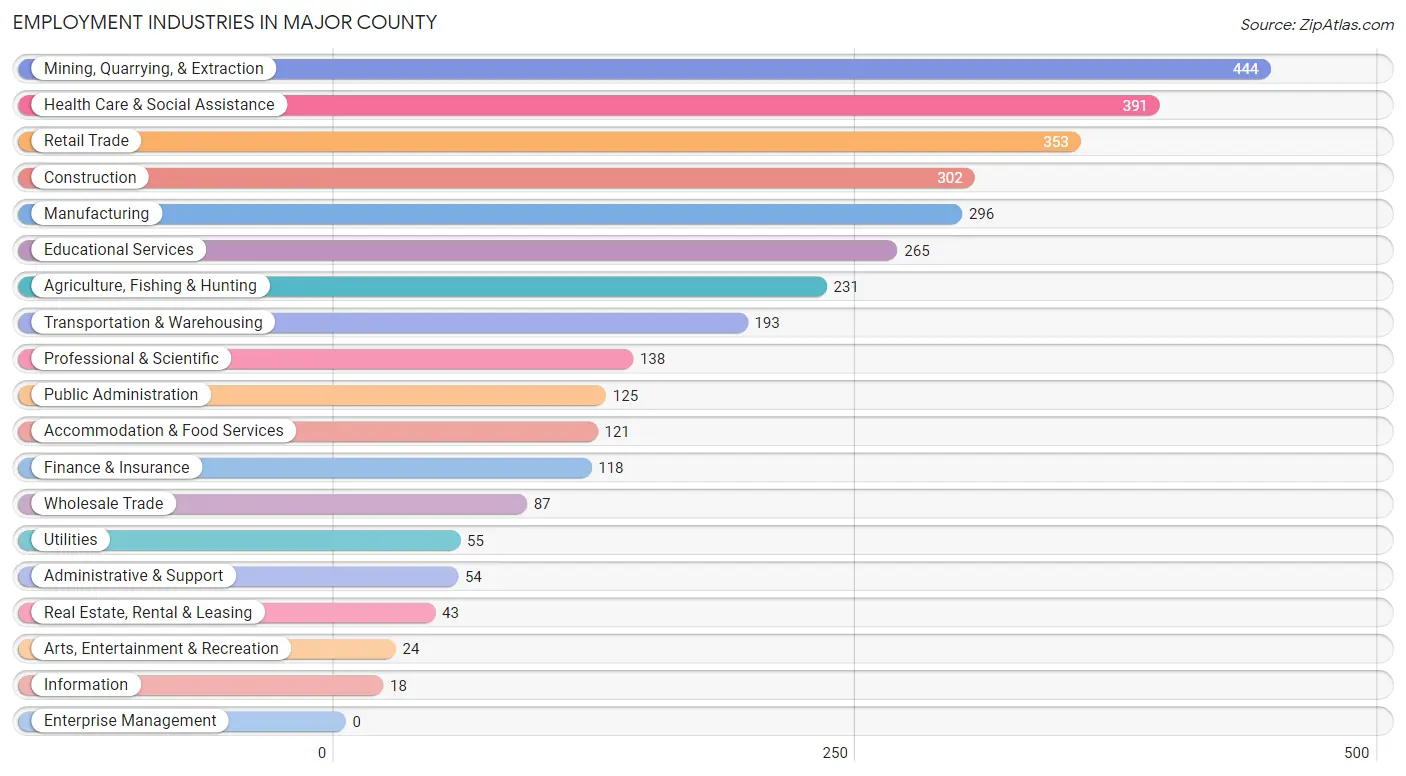
Employment Industries in Major County
The major employment industries in Major County include Mining, Quarrying, & Extraction (444 | 12.9%), Health Care & Social Assistance (391 | 11.4%), Retail Trade (353 | 10.3%), Construction (302 | 8.8%), and Manufacturing (296 | 8.6%).
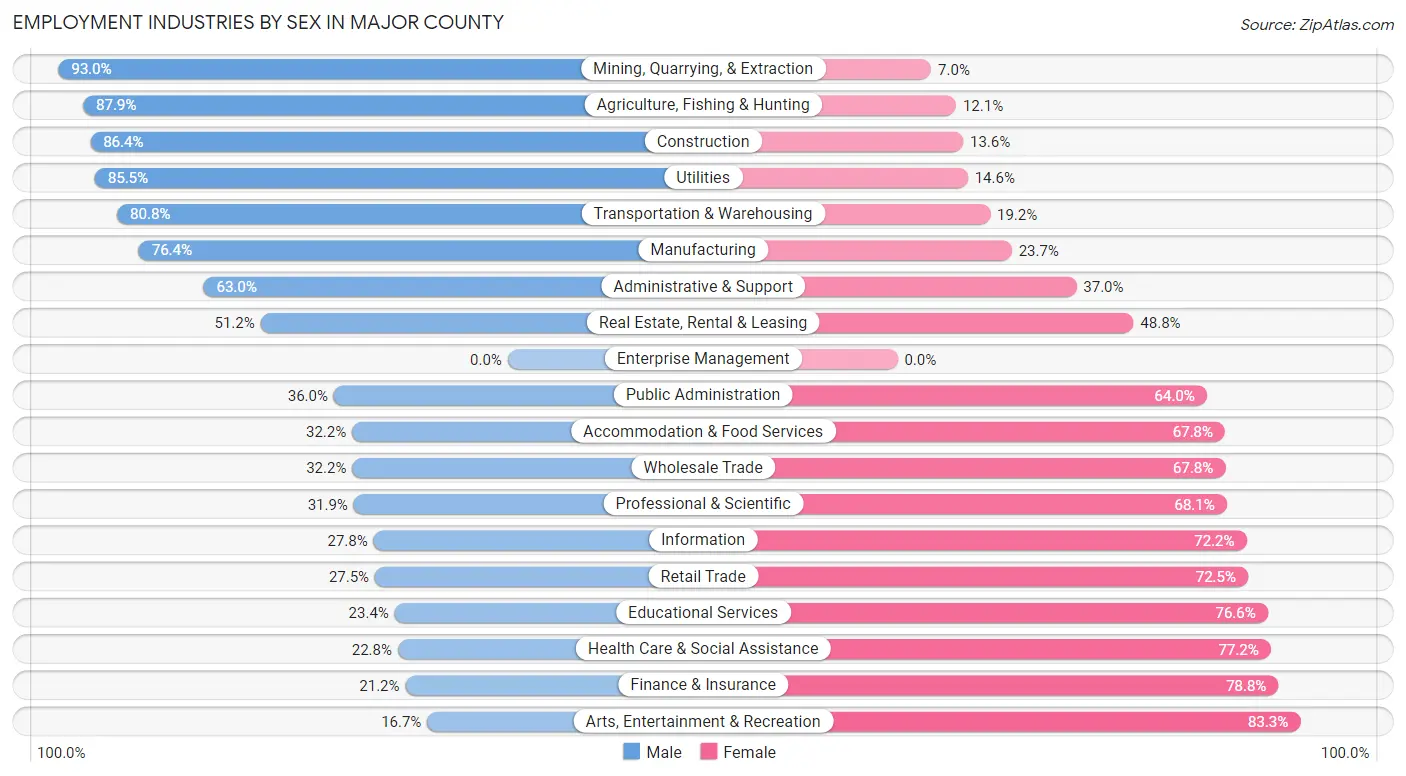
Employment Industries by Sex in Major County
The Major County industries that see more men than women are Mining, Quarrying, & Extraction (93.0%), Agriculture, Fishing & Hunting (87.9%), and Construction (86.4%), whereas the industries that tend to have a higher number of women are Arts, Entertainment & Recreation (83.3%), Finance & Insurance (78.8%), and Health Care & Social Assistance (77.2%).
| Industry | Male | Female |
| Agriculture, Fishing & Hunting | 203 (87.9%) | 28 (12.1%) |
| Mining, Quarrying, & Extraction | 413 (93.0%) | 31 (7.0%) |
| Construction | 261 (86.4%) | 41 (13.6%) |
| Manufacturing | 226 (76.3%) | 70 (23.6%) |
| Wholesale Trade | 28 (32.2%) | 59 (67.8%) |
| Retail Trade | 97 (27.5%) | 256 (72.5%) |
| Transportation & Warehousing | 156 (80.8%) | 37 (19.2%) |
| Utilities | 47 (85.5%) | 8 (14.5%) |
| Information | 5 (27.8%) | 13 (72.2%) |
| Finance & Insurance | 25 (21.2%) | 93 (78.8%) |
| Real Estate, Rental & Leasing | 22 (51.2%) | 21 (48.8%) |
| Professional & Scientific | 44 (31.9%) | 94 (68.1%) |
| Enterprise Management | 0 (0.0%) | 0 (0.0%) |
| Administrative & Support | 34 (63.0%) | 20 (37.0%) |
| Educational Services | 62 (23.4%) | 203 (76.6%) |
| Health Care & Social Assistance | 89 (22.8%) | 302 (77.2%) |
| Arts, Entertainment & Recreation | 4 (16.7%) | 20 (83.3%) |
| Accommodation & Food Services | 39 (32.2%) | 82 (67.8%) |
| Public Administration | 45 (36.0%) | 80 (64.0%) |
| Total | 1,882 (54.8%) | 1,552 (45.2%) |
Education in Major County
School Enrollment in Major County
The most common levels of schooling among the 1,797 students in Major County are middle school (506 | 28.2%), elementary school (455 | 25.3%), and high school (424 | 23.6%).
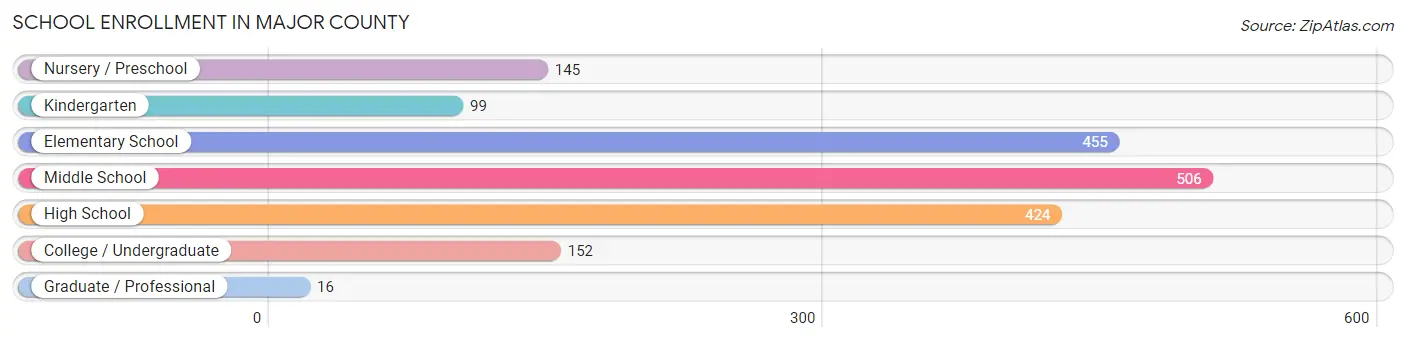
| School Level | # Students | % Students |
| Nursery / Preschool | 145 | 8.1% |
| Kindergarten | 99 | 5.5% |
| Elementary School | 455 | 25.3% |
| Middle School | 506 | 28.2% |
| High School | 424 | 23.6% |
| College / Undergraduate | 152 | 8.5% |
| Graduate / Professional | 16 | 0.9% |
| Total | 1,797 | 100.0% |
School Enrollment by Age by Funding Source in Major County
Out of a total of 1,797 students who are enrolled in schools in Major County, 131 (7.3%) attend a private institution, while the remaining 1,666 (92.7%) are enrolled in public schools. The age group of 20 to 24 year olds has the highest likelihood of being enrolled in private schools, with 12 (24.0% in the age bracket) enrolled. Conversely, the age group of 25 to 34 year olds has the lowest likelihood of being enrolled in a private school, with 77 (100.0% in the age bracket) attending a public institution.
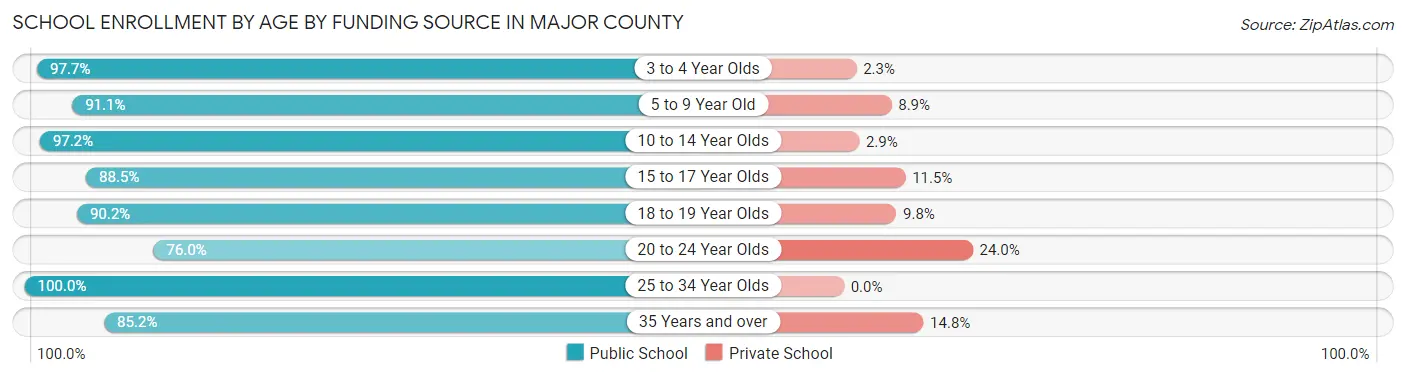
| Age Bracket | Public School | Private School |
| 3 to 4 Year Olds | 84 (97.7%) | 2 (2.3%) |
| 5 to 9 Year Old | 514 (91.1%) | 50 (8.9%) |
| 10 to 14 Year Olds | 546 (97.2%) | 16 (2.9%) |
| 15 to 17 Year Olds | 309 (88.5%) | 40 (11.5%) |
| 18 to 19 Year Olds | 74 (90.2%) | 8 (9.8%) |
| 20 to 24 Year Olds | 38 (76.0%) | 12 (24.0%) |
| 25 to 34 Year Olds | 77 (100.0%) | 0 (0.0%) |
| 35 Years and over | 23 (85.2%) | 4 (14.8%) |
| Total | 1,666 (92.7%) | 131 (7.3%) |
Educational Attainment by Field of Study in Major County
Education (230 | 22.5%), science & technology (208 | 20.3%), bio, nature & agricultural (173 | 16.9%), business (149 | 14.6%), and arts & humanities (67 | 6.6%) are the most common fields of study among 1,022 individuals in Major County who have obtained a bachelor's degree or higher.
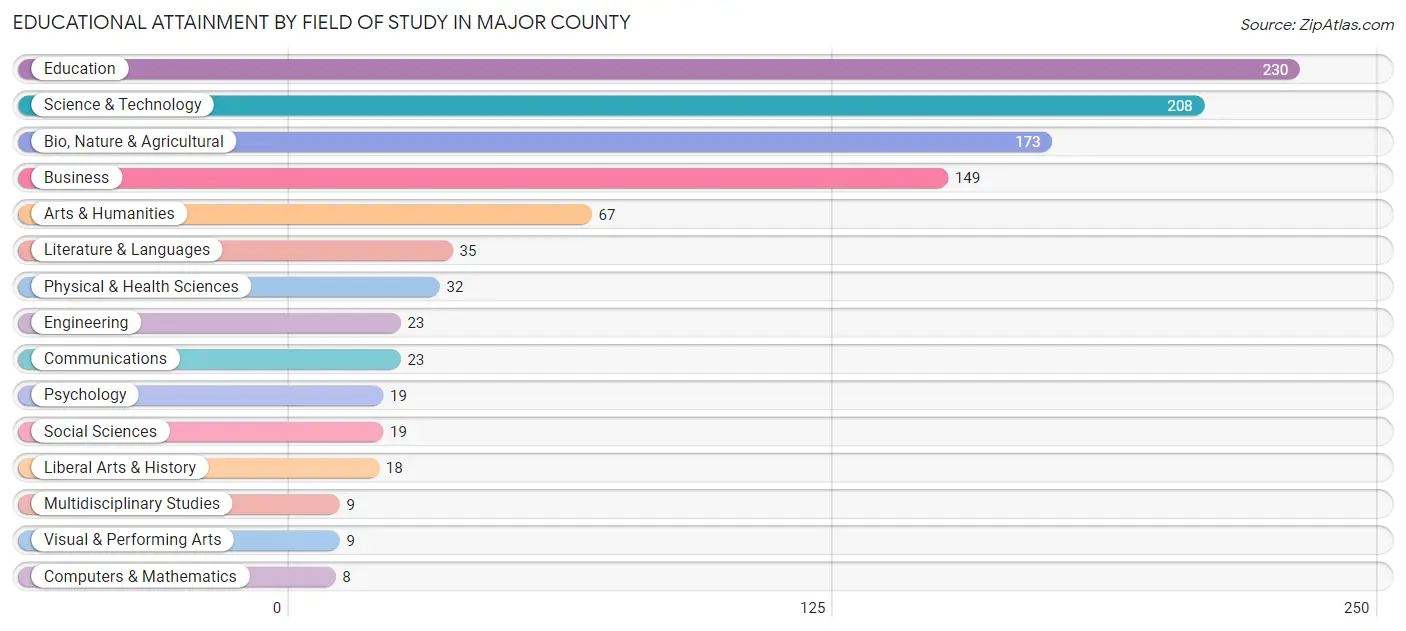
| Field of Study | # Graduates | % Graduates |
| Computers & Mathematics | 8 | 0.8% |
| Bio, Nature & Agricultural | 173 | 16.9% |
| Physical & Health Sciences | 32 | 3.1% |
| Psychology | 19 | 1.9% |
| Social Sciences | 19 | 1.9% |
| Engineering | 23 | 2.2% |
| Multidisciplinary Studies | 9 | 0.9% |
| Science & Technology | 208 | 20.3% |
| Business | 149 | 14.6% |
| Education | 230 | 22.5% |
| Literature & Languages | 35 | 3.4% |
| Liberal Arts & History | 18 | 1.8% |
| Visual & Performing Arts | 9 | 0.9% |
| Communications | 23 | 2.2% |
| Arts & Humanities | 67 | 6.6% |
| Total | 1,022 | 100.0% |
Transportation & Commute in Major County
Vehicle Availability by Sex in Major County
The most prevalent vehicle ownership categories in Major County are males with 2 vehicles (708, accounting for 38.1%) and females with 2 vehicles (569, making up 46.3%).
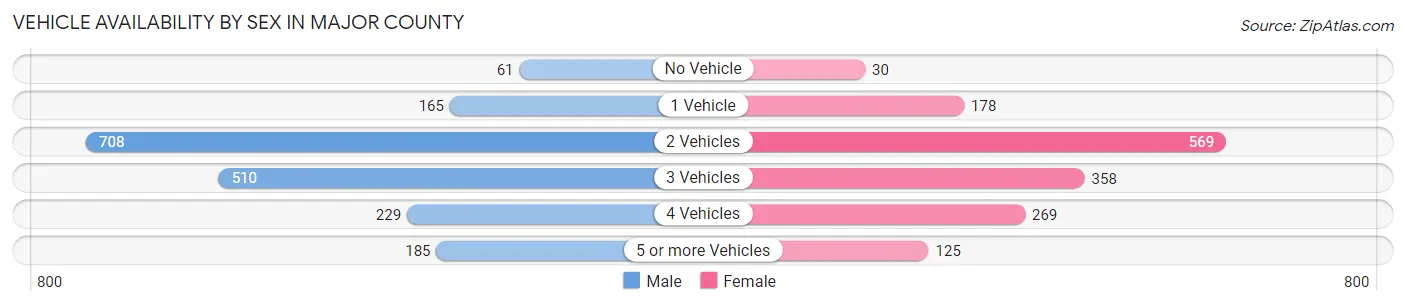
| Vehicles Available | Male | Female |
| No Vehicle | 61 (3.3%) | 30 (2.0%) |
| 1 Vehicle | 165 (8.9%) | 178 (11.6%) |
| 2 Vehicles | 708 (38.1%) | 569 (37.2%) |
| 3 Vehicles | 510 (27.5%) | 358 (23.4%) |
| 4 Vehicles | 229 (12.3%) | 269 (17.6%) |
| 5 or more Vehicles | 185 (10.0%) | 125 (8.2%) |
| Total | 1,858 (100.0%) | 1,529 (100.0%) |
Commute Time in Major County
The most frequently occuring commute durations in Major County are 5 to 9 minutes (703 commuters, 21.5%), 30 to 34 minutes (461 commuters, 14.1%), and less than 5 minutes (405 commuters, 12.4%).
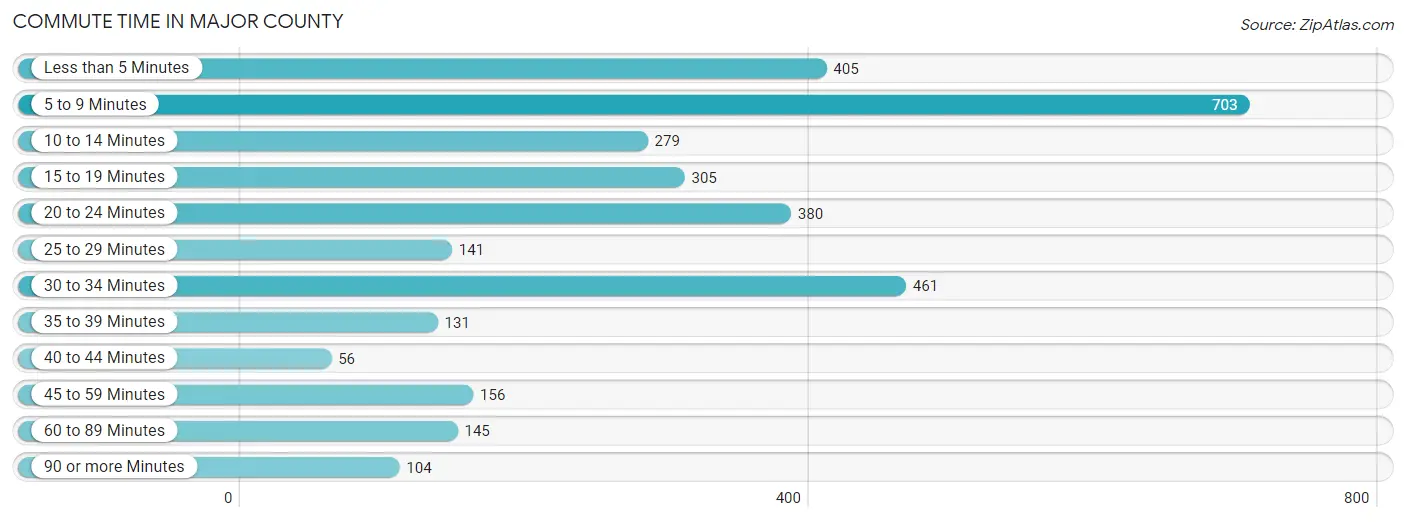
| Commute Time | # Commuters | % Commuters |
| Less than 5 Minutes | 405 | 12.4% |
| 5 to 9 Minutes | 703 | 21.5% |
| 10 to 14 Minutes | 279 | 8.5% |
| 15 to 19 Minutes | 305 | 9.3% |
| 20 to 24 Minutes | 380 | 11.6% |
| 25 to 29 Minutes | 141 | 4.3% |
| 30 to 34 Minutes | 461 | 14.1% |
| 35 to 39 Minutes | 131 | 4.0% |
| 40 to 44 Minutes | 56 | 1.7% |
| 45 to 59 Minutes | 156 | 4.8% |
| 60 to 89 Minutes | 145 | 4.4% |
| 90 or more Minutes | 104 | 3.2% |
Commute Time by Sex in Major County
The most common commute times in Major County are 5 to 9 minutes (374 commuters, 20.8%) for males and 5 to 9 minutes (329 commuters, 22.4%) for females.
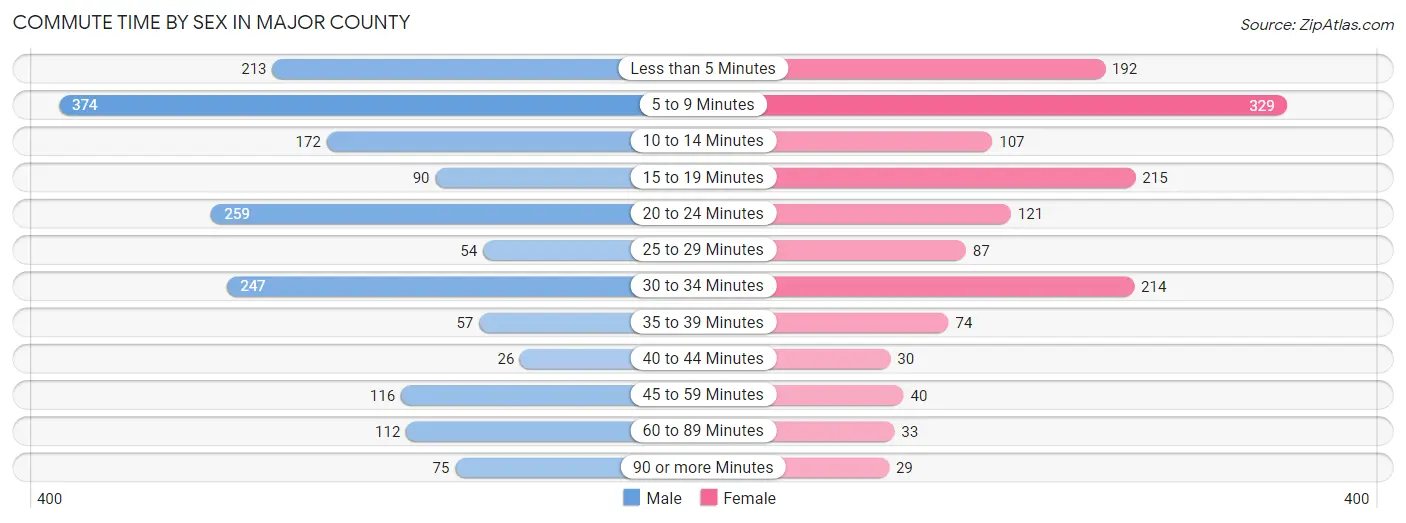
| Commute Time | Male | Female |
| Less than 5 Minutes | 213 (11.9%) | 192 (13.1%) |
| 5 to 9 Minutes | 374 (20.8%) | 329 (22.4%) |
| 10 to 14 Minutes | 172 (9.6%) | 107 (7.3%) |
| 15 to 19 Minutes | 90 (5.0%) | 215 (14.6%) |
| 20 to 24 Minutes | 259 (14.4%) | 121 (8.2%) |
| 25 to 29 Minutes | 54 (3.0%) | 87 (5.9%) |
| 30 to 34 Minutes | 247 (13.8%) | 214 (14.5%) |
| 35 to 39 Minutes | 57 (3.2%) | 74 (5.0%) |
| 40 to 44 Minutes | 26 (1.5%) | 30 (2.0%) |
| 45 to 59 Minutes | 116 (6.5%) | 40 (2.7%) |
| 60 to 89 Minutes | 112 (6.2%) | 33 (2.2%) |
| 90 or more Minutes | 75 (4.2%) | 29 (2.0%) |
Time of Departure to Work by Sex in Major County
The most frequent times of departure to work in Major County are 6:30 AM to 6:59 AM (372, 20.7%) for males and 7:30 AM to 7:59 AM (286, 19.4%) for females.
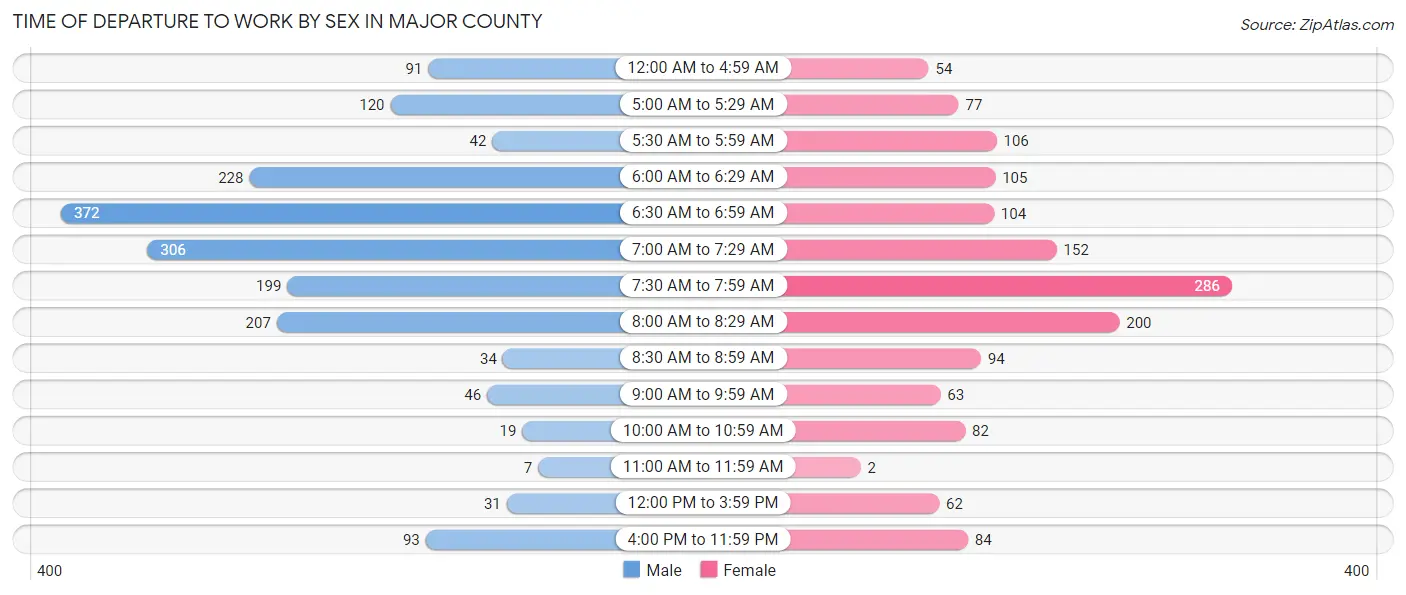
| Time of Departure | Male | Female |
| 12:00 AM to 4:59 AM | 91 (5.1%) | 54 (3.7%) |
| 5:00 AM to 5:29 AM | 120 (6.7%) | 77 (5.2%) |
| 5:30 AM to 5:59 AM | 42 (2.3%) | 106 (7.2%) |
| 6:00 AM to 6:29 AM | 228 (12.7%) | 105 (7.1%) |
| 6:30 AM to 6:59 AM | 372 (20.7%) | 104 (7.1%) |
| 7:00 AM to 7:29 AM | 306 (17.1%) | 152 (10.3%) |
| 7:30 AM to 7:59 AM | 199 (11.1%) | 286 (19.4%) |
| 8:00 AM to 8:29 AM | 207 (11.5%) | 200 (13.6%) |
| 8:30 AM to 8:59 AM | 34 (1.9%) | 94 (6.4%) |
| 9:00 AM to 9:59 AM | 46 (2.6%) | 63 (4.3%) |
| 10:00 AM to 10:59 AM | 19 (1.1%) | 82 (5.6%) |
| 11:00 AM to 11:59 AM | 7 (0.4%) | 2 (0.1%) |
| 12:00 PM to 3:59 PM | 31 (1.7%) | 62 (4.2%) |
| 4:00 PM to 11:59 PM | 93 (5.2%) | 84 (5.7%) |
| Total | 1,795 (100.0%) | 1,471 (100.0%) |
Housing Occupancy in Major County
Occupancy by Ownership in Major County
Of the total 3,167 dwellings in Major County, owner-occupied units account for 2,600 (82.1%), while renter-occupied units make up 567 (17.9%).
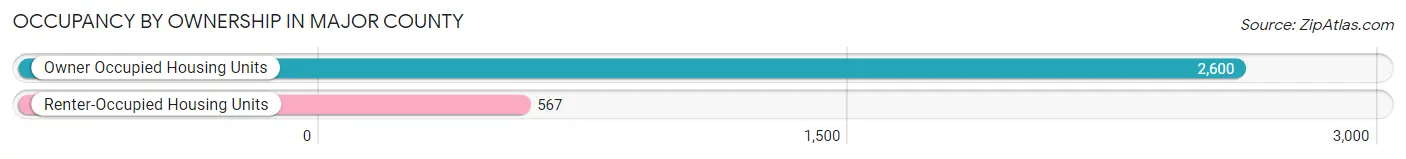
| Occupancy | # Housing Units | % Housing Units |
| Owner Occupied Housing Units | 2,600 | 82.1% |
| Renter-Occupied Housing Units | 567 | 17.9% |
| Total Occupied Housing Units | 3,167 | 100.0% |
Occupancy by Household Size in Major County
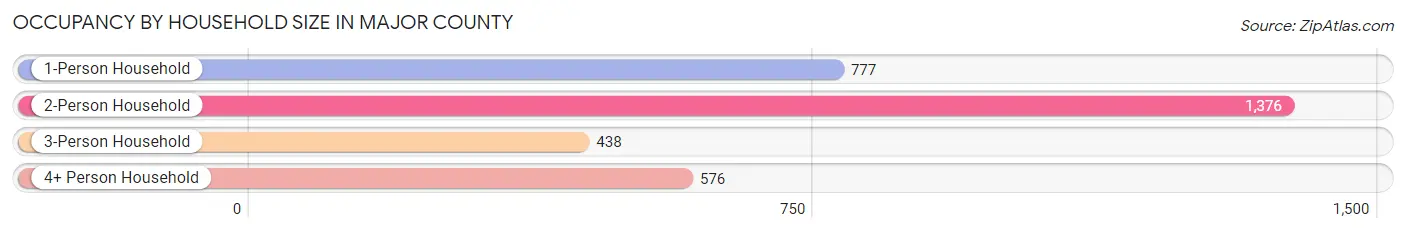
| Household Size | # Housing Units | % Housing Units |
| 1-Person Household | 777 | 24.5% |
| 2-Person Household | 1,376 | 43.4% |
| 3-Person Household | 438 | 13.8% |
| 4+ Person Household | 576 | 18.2% |
| Total Housing Units | 3,167 | 100.0% |
Occupancy by Ownership by Household Size in Major County
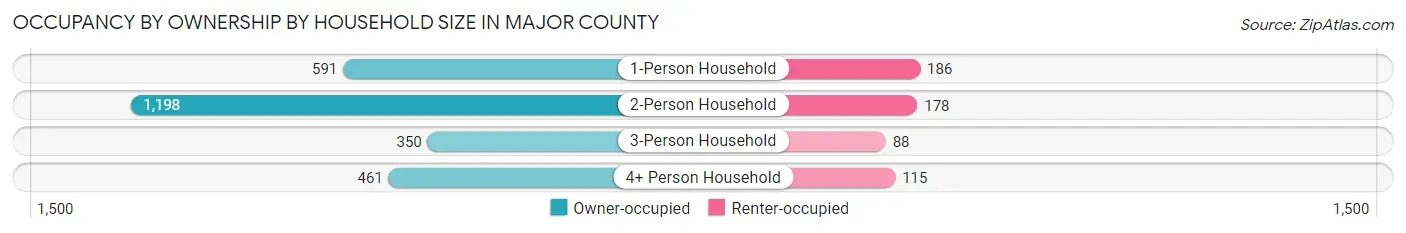
| Household Size | Owner-occupied | Renter-occupied |
| 1-Person Household | 591 (76.1%) | 186 (23.9%) |
| 2-Person Household | 1,198 (87.1%) | 178 (12.9%) |
| 3-Person Household | 350 (79.9%) | 88 (20.1%) |
| 4+ Person Household | 461 (80.0%) | 115 (20.0%) |
| Total Housing Units | 2,600 (82.1%) | 567 (17.9%) |
Occupancy by Educational Attainment in Major County
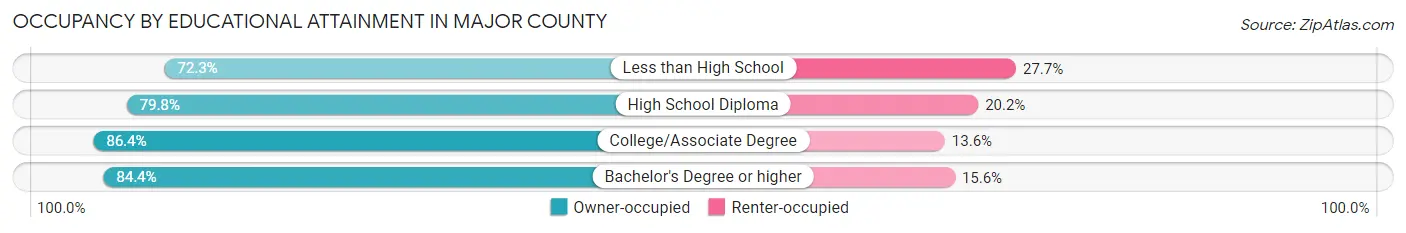
| Household Size | Owner-occupied | Renter-occupied |
| Less than High School | 159 (72.3%) | 61 (27.7%) |
| High School Diploma | 1,128 (79.8%) | 286 (20.2%) |
| College/Associate Degree | 843 (86.4%) | 133 (13.6%) |
| Bachelor's Degree or higher | 470 (84.4%) | 87 (15.6%) |
Occupancy by Age of Householder in Major County
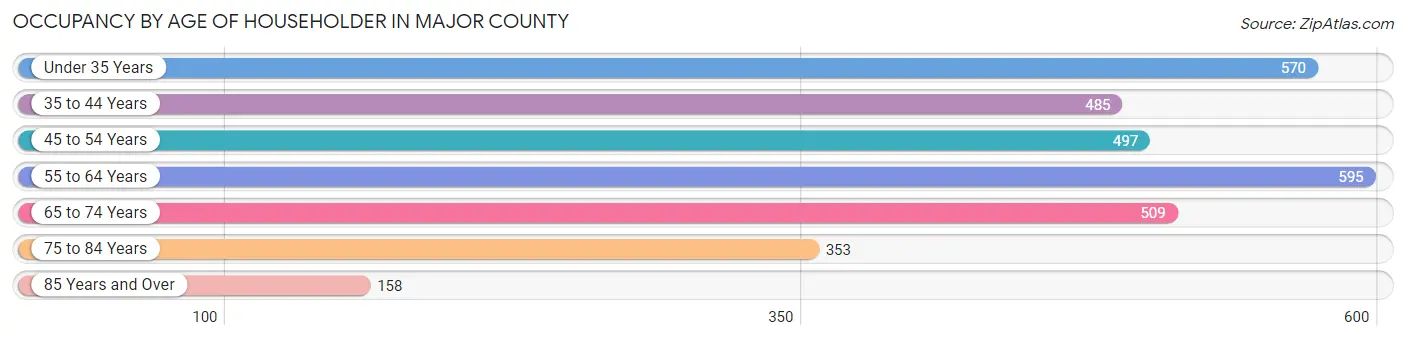
| Age Bracket | # Households | % Households |
| Under 35 Years | 570 | 18.0% |
| 35 to 44 Years | 485 | 15.3% |
| 45 to 54 Years | 497 | 15.7% |
| 55 to 64 Years | 595 | 18.8% |
| 65 to 74 Years | 509 | 16.1% |
| 75 to 84 Years | 353 | 11.2% |
| 85 Years and Over | 158 | 5.0% |
| Total | 3,167 | 100.0% |
Housing Finances in Major County
Median Income by Occupancy in Major County
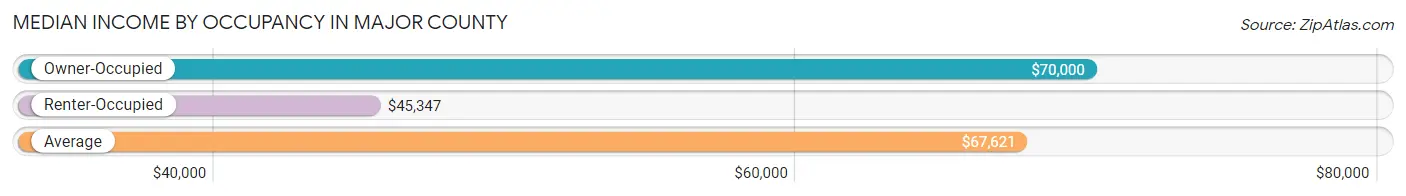
| Occupancy Type | # Households | Median Income |
| Owner-Occupied | 2,600 (82.1%) | $70,000 |
| Renter-Occupied | 567 (17.9%) | $45,347 |
| Average | 3,167 (100.0%) | $67,621 |
Occupancy by Householder Income Bracket in Major County
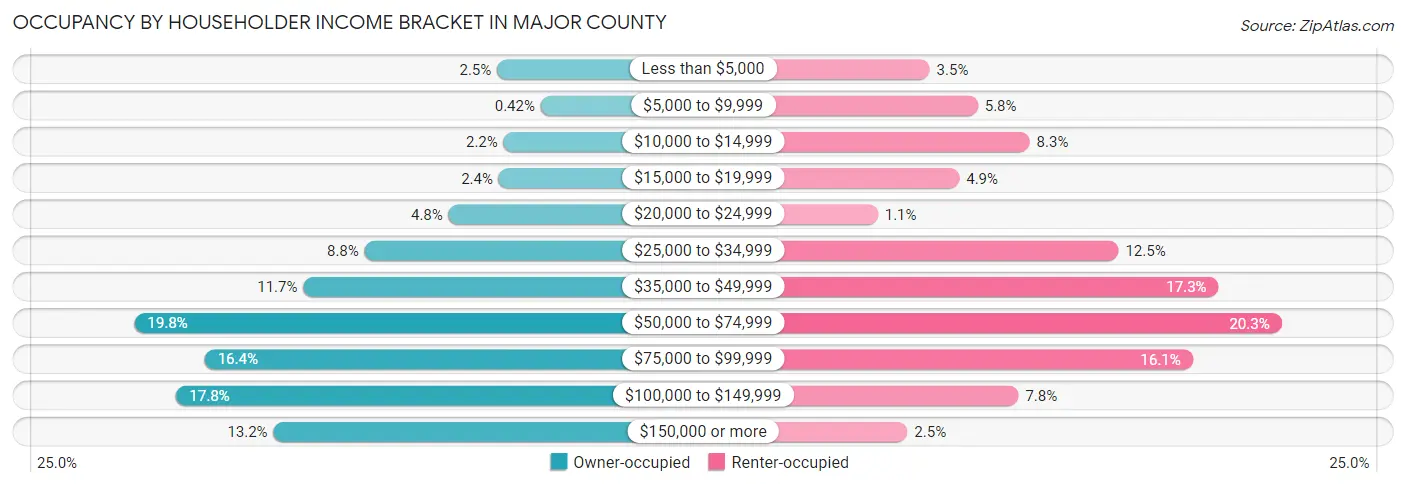
| Income Bracket | Owner-occupied | Renter-occupied |
| Less than $5,000 | 65 (2.5%) | 20 (3.5%) |
| $5,000 to $9,999 | 11 (0.4%) | 33 (5.8%) |
| $10,000 to $14,999 | 57 (2.2%) | 47 (8.3%) |
| $15,000 to $19,999 | 63 (2.4%) | 28 (4.9%) |
| $20,000 to $24,999 | 125 (4.8%) | 6 (1.1%) |
| $25,000 to $34,999 | 229 (8.8%) | 71 (12.5%) |
| $35,000 to $49,999 | 305 (11.7%) | 98 (17.3%) |
| $50,000 to $74,999 | 514 (19.8%) | 115 (20.3%) |
| $75,000 to $99,999 | 427 (16.4%) | 91 (16.1%) |
| $100,000 to $149,999 | 462 (17.8%) | 44 (7.8%) |
| $150,000 or more | 342 (13.2%) | 14 (2.5%) |
| Total | 2,600 (100.0%) | 567 (100.0%) |
Monthly Housing Cost Tiers in Major County
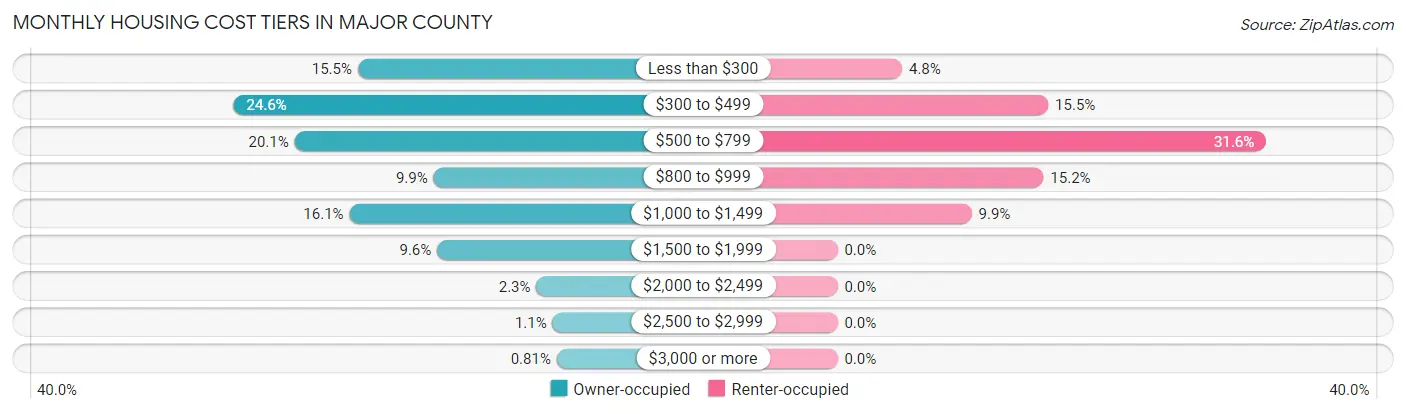
| Monthly Cost | Owner-occupied | Renter-occupied |
| Less than $300 | 402 (15.5%) | 27 (4.8%) |
| $300 to $499 | 640 (24.6%) | 88 (15.5%) |
| $500 to $799 | 523 (20.1%) | 179 (31.6%) |
| $800 to $999 | 257 (9.9%) | 86 (15.2%) |
| $1,000 to $1,499 | 418 (16.1%) | 56 (9.9%) |
| $1,500 to $1,999 | 250 (9.6%) | 0 (0.0%) |
| $2,000 to $2,499 | 60 (2.3%) | 0 (0.0%) |
| $2,500 to $2,999 | 29 (1.1%) | 0 (0.0%) |
| $3,000 or more | 21 (0.8%) | 0 (0.0%) |
| Total | 2,600 (100.0%) | 567 (100.0%) |
Physical Housing Characteristics in Major County
Housing Structures in Major County
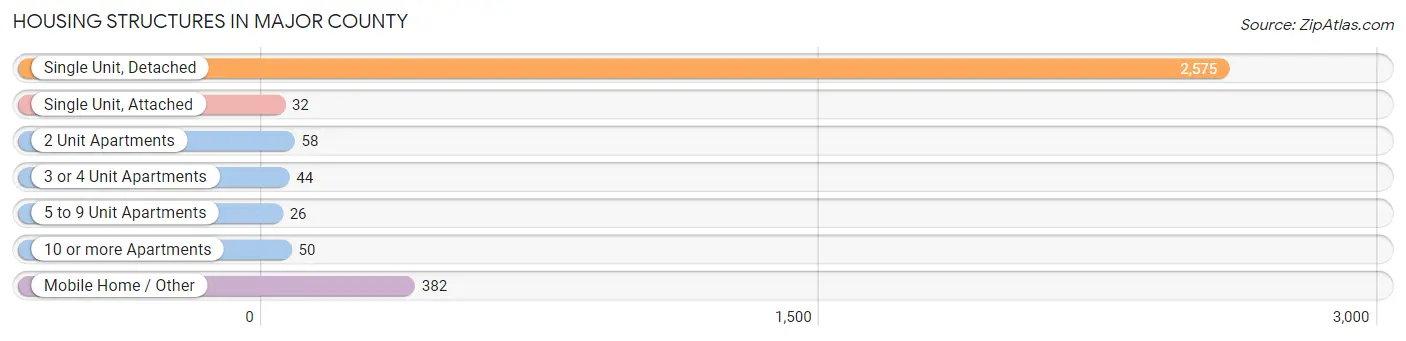
| Structure Type | # Housing Units | % Housing Units |
| Single Unit, Detached | 2,575 | 81.3% |
| Single Unit, Attached | 32 | 1.0% |
| 2 Unit Apartments | 58 | 1.8% |
| 3 or 4 Unit Apartments | 44 | 1.4% |
| 5 to 9 Unit Apartments | 26 | 0.8% |
| 10 or more Apartments | 50 | 1.6% |
| Mobile Home / Other | 382 | 12.1% |
| Total | 3,167 | 100.0% |
Housing Structures by Occupancy in Major County
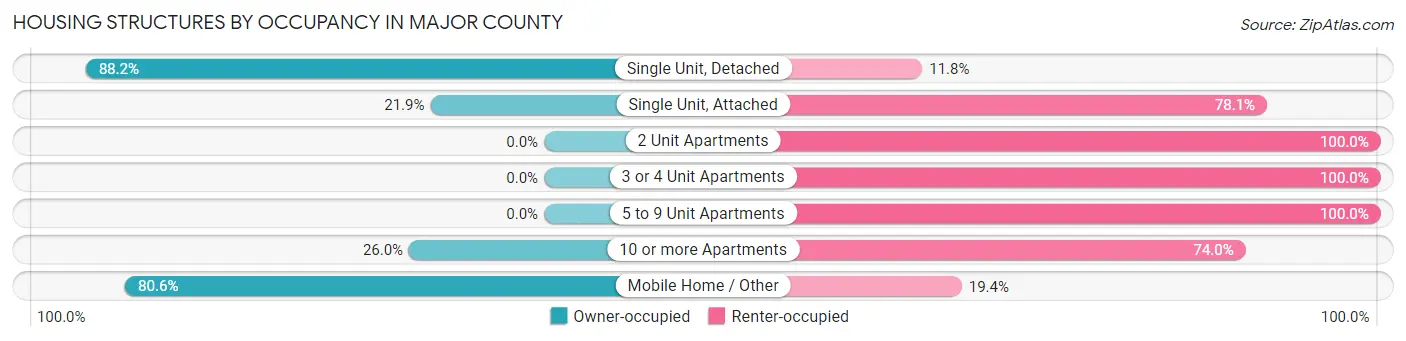
| Structure Type | Owner-occupied | Renter-occupied |
| Single Unit, Detached | 2,272 (88.2%) | 303 (11.8%) |
| Single Unit, Attached | 7 (21.9%) | 25 (78.1%) |
| 2 Unit Apartments | 0 (0.0%) | 58 (100.0%) |
| 3 or 4 Unit Apartments | 0 (0.0%) | 44 (100.0%) |
| 5 to 9 Unit Apartments | 0 (0.0%) | 26 (100.0%) |
| 10 or more Apartments | 13 (26.0%) | 37 (74.0%) |
| Mobile Home / Other | 308 (80.6%) | 74 (19.4%) |
| Total | 2,600 (82.1%) | 567 (17.9%) |
Housing Structures by Number of Rooms in Major County
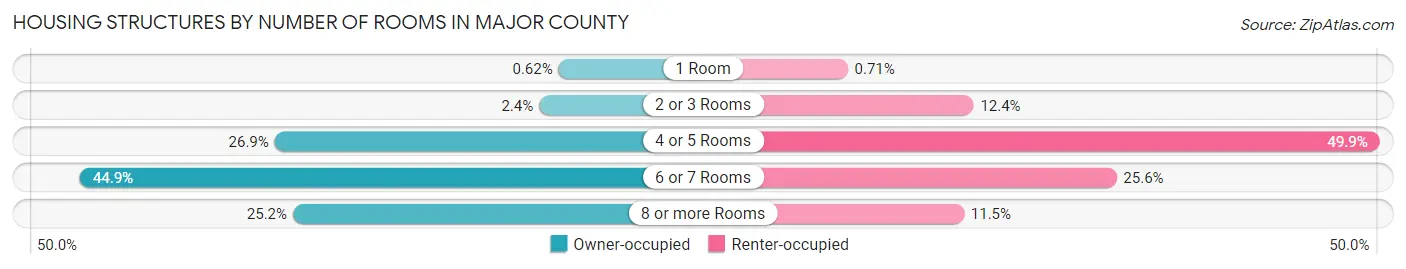
| Number of Rooms | Owner-occupied | Renter-occupied |
| 1 Room | 16 (0.6%) | 4 (0.7%) |
| 2 or 3 Rooms | 63 (2.4%) | 70 (12.3%) |
| 4 or 5 Rooms | 699 (26.9%) | 283 (49.9%) |
| 6 or 7 Rooms | 1,167 (44.9%) | 145 (25.6%) |
| 8 or more Rooms | 655 (25.2%) | 65 (11.5%) |
| Total | 2,600 (100.0%) | 567 (100.0%) |
Housing Structure by Heating Type in Major County
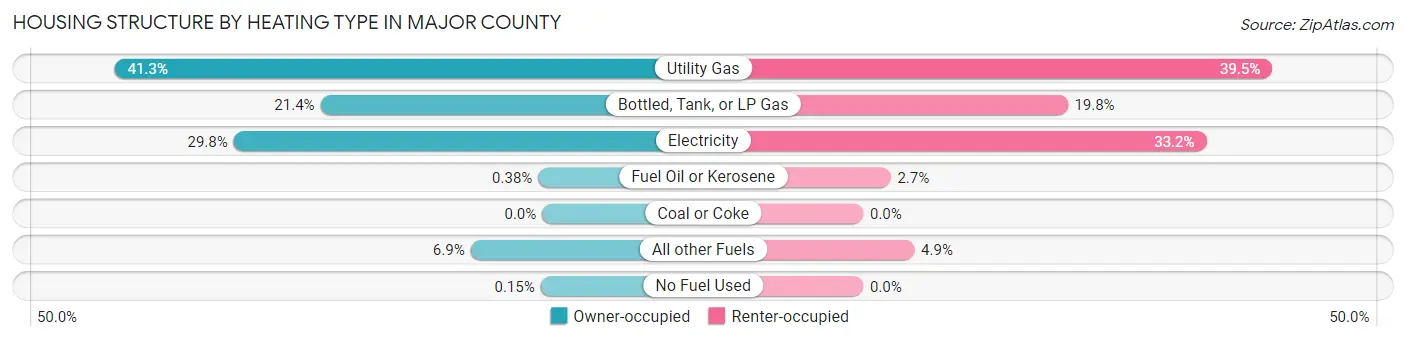
| Heating Type | Owner-occupied | Renter-occupied |
| Utility Gas | 1,074 (41.3%) | 224 (39.5%) |
| Bottled, Tank, or LP Gas | 557 (21.4%) | 112 (19.8%) |
| Electricity | 775 (29.8%) | 188 (33.2%) |
| Fuel Oil or Kerosene | 10 (0.4%) | 15 (2.6%) |
| Coal or Coke | 0 (0.0%) | 0 (0.0%) |
| All other Fuels | 180 (6.9%) | 28 (4.9%) |
| No Fuel Used | 4 (0.2%) | 0 (0.0%) |
| Total | 2,600 (100.0%) | 567 (100.0%) |
Household Vehicle Usage in Major County
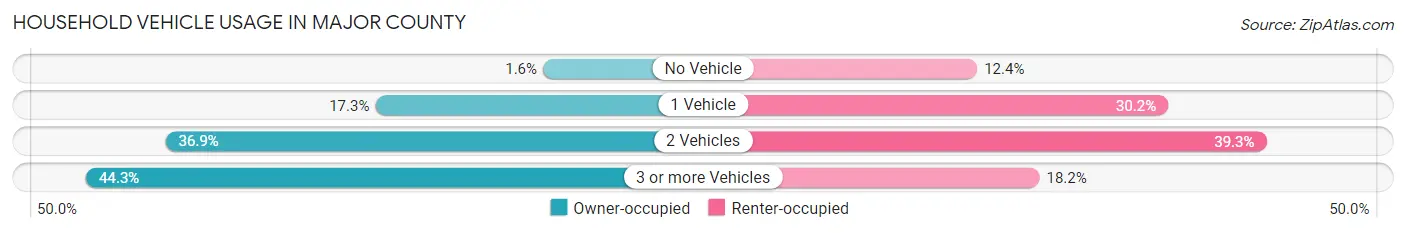
| Vehicles per Household | Owner-occupied | Renter-occupied |
| No Vehicle | 42 (1.6%) | 70 (12.3%) |
| 1 Vehicle | 449 (17.3%) | 171 (30.2%) |
| 2 Vehicles | 958 (36.8%) | 223 (39.3%) |
| 3 or more Vehicles | 1,151 (44.3%) | 103 (18.2%) |
| Total | 2,600 (100.0%) | 567 (100.0%) |
Real Estate & Mortgages in Major County
Real Estate and Mortgage Overview in Major County
| Characteristic | Without Mortgage | With Mortgage |
| Housing Units | 1,603 | 997 |
| Median Property Value | $111,300 | $139,500 |
| Median Household Income | $61,354 | $170 |
| Monthly Housing Costs | $408 | $21 |
| Real Estate Taxes | $578 | $24 |
Property Value by Mortgage Status in Major County
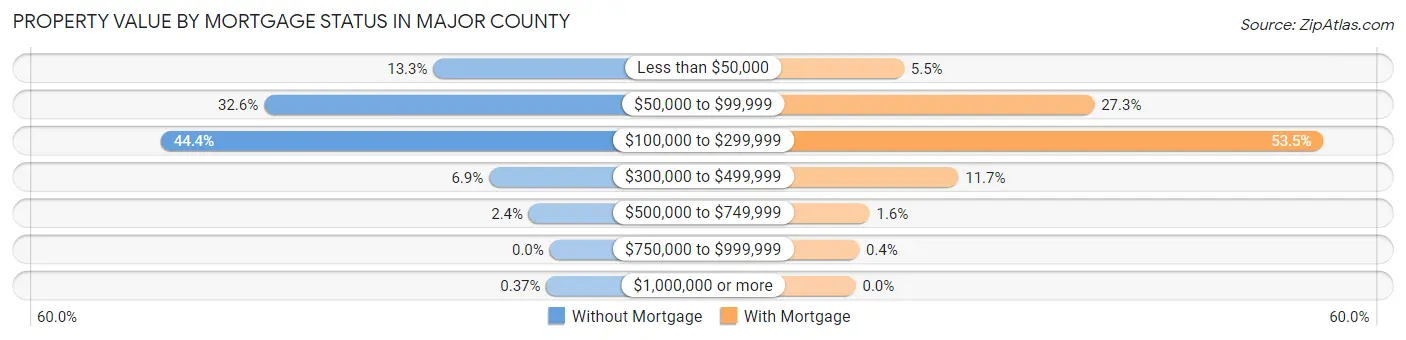
| Property Value | Without Mortgage | With Mortgage |
| Less than $50,000 | 213 (13.3%) | 55 (5.5%) |
| $50,000 to $99,999 | 523 (32.6%) | 272 (27.3%) |
| $100,000 to $299,999 | 712 (44.4%) | 533 (53.5%) |
| $300,000 to $499,999 | 111 (6.9%) | 117 (11.7%) |
| $500,000 to $749,999 | 38 (2.4%) | 16 (1.6%) |
| $750,000 to $999,999 | 0 (0.0%) | 4 (0.4%) |
| $1,000,000 or more | 6 (0.4%) | 0 (0.0%) |
| Total | 1,603 (100.0%) | 997 (100.0%) |
Household Income by Mortgage Status in Major County
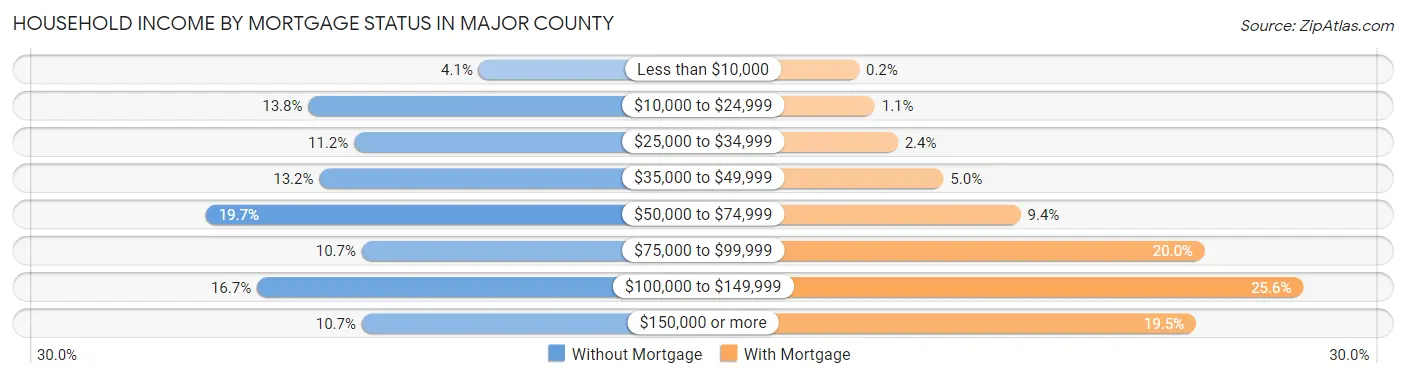
| Household Income | Without Mortgage | With Mortgage |
| Less than $10,000 | 65 (4.1%) | 2 (0.2%) |
| $10,000 to $24,999 | 221 (13.8%) | 11 (1.1%) |
| $25,000 to $34,999 | 179 (11.2%) | 24 (2.4%) |
| $35,000 to $49,999 | 211 (13.2%) | 50 (5.0%) |
| $50,000 to $74,999 | 315 (19.7%) | 94 (9.4%) |
| $75,000 to $99,999 | 172 (10.7%) | 199 (20.0%) |
| $100,000 to $149,999 | 268 (16.7%) | 255 (25.6%) |
| $150,000 or more | 172 (10.7%) | 194 (19.5%) |
| Total | 1,603 (100.0%) | 997 (100.0%) |
Property Value to Household Income Ratio in Major County
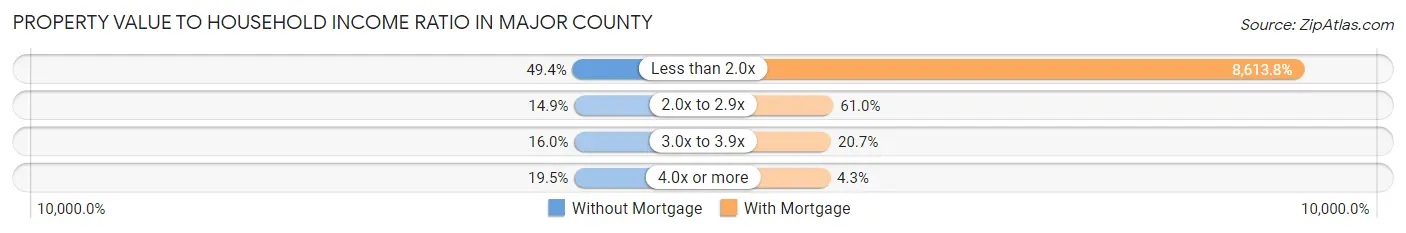
| Value-to-Income Ratio | Without Mortgage | With Mortgage |
| Less than 2.0x | 792 (49.4%) | 85,880 (8,613.8%) |
| 2.0x to 2.9x | 239 (14.9%) | 608 (61.0%) |
| 3.0x to 3.9x | 257 (16.0%) | 206 (20.7%) |
| 4.0x or more | 313 (19.5%) | 43 (4.3%) |
| Total | 1,603 (100.0%) | 997 (100.0%) |
Real Estate Taxes by Mortgage Status in Major County
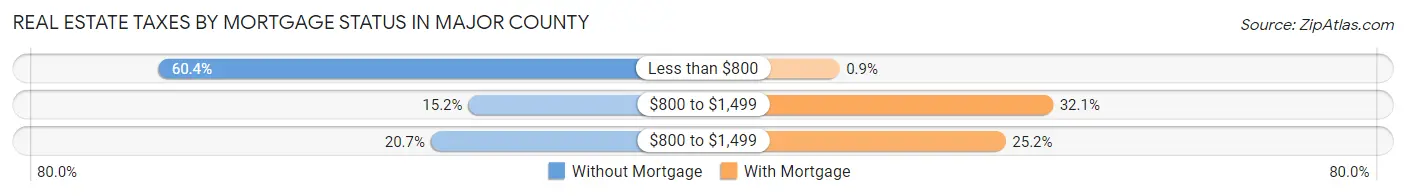
| Property Taxes | Without Mortgage | With Mortgage |
| Less than $800 | 968 (60.4%) | 9 (0.9%) |
| $800 to $1,499 | 243 (15.2%) | 320 (32.1%) |
| $800 to $1,499 | 331 (20.6%) | 251 (25.2%) |
| Total | 1,603 (100.0%) | 997 (100.0%) |
Health & Disability in Major County
Health Insurance Coverage by Age in Major County
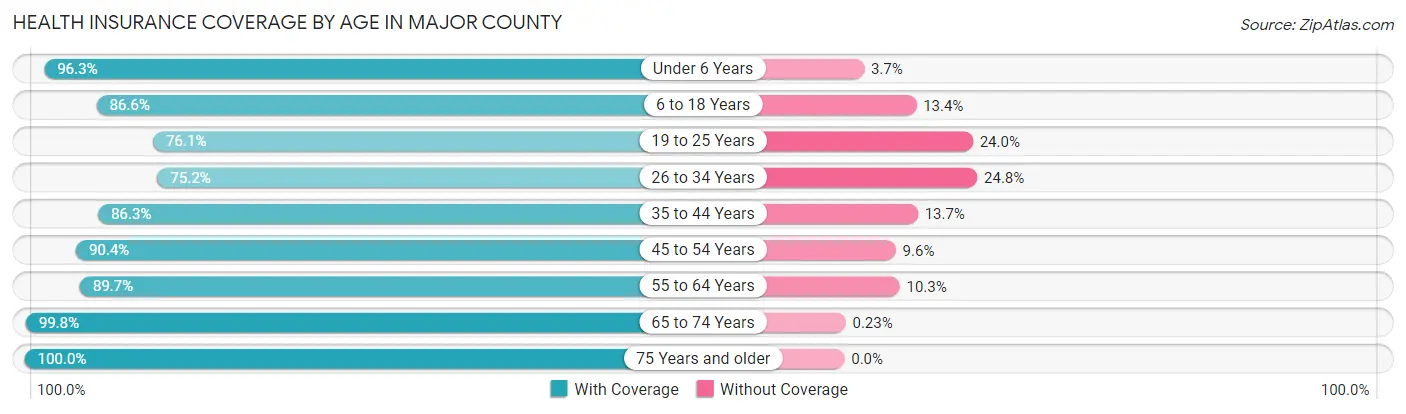
| Age Bracket | With Coverage | Without Coverage |
| Under 6 Years | 499 (96.3%) | 19 (3.7%) |
| 6 to 18 Years | 1,317 (86.6%) | 204 (13.4%) |
| 19 to 25 Years | 400 (76.0%) | 126 (23.9%) |
| 26 to 34 Years | 486 (75.2%) | 160 (24.8%) |
| 35 to 44 Years | 782 (86.3%) | 124 (13.7%) |
| 45 to 54 Years | 802 (90.4%) | 85 (9.6%) |
| 55 to 64 Years | 932 (89.7%) | 107 (10.3%) |
| 65 to 74 Years | 875 (99.8%) | 2 (0.2%) |
| 75 Years and older | 652 (100.0%) | 0 (0.0%) |
| Total | 6,745 (89.1%) | 827 (10.9%) |
Health Insurance Coverage by Citizenship Status in Major County
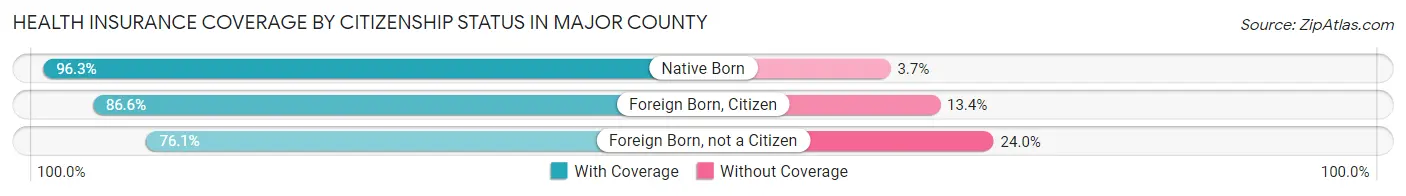
| Citizenship Status | With Coverage | Without Coverage |
| Native Born | 499 (96.3%) | 19 (3.7%) |
| Foreign Born, Citizen | 1,317 (86.6%) | 204 (13.4%) |
| Foreign Born, not a Citizen | 400 (76.0%) | 126 (23.9%) |
Health Insurance Coverage by Household Income in Major County
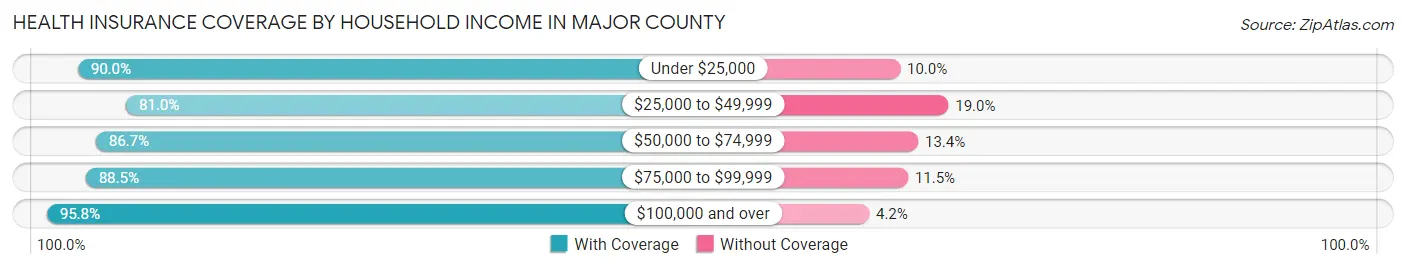
| Household Income | With Coverage | Without Coverage |
| Under $25,000 | 704 (90.0%) | 78 (10.0%) |
| $25,000 to $49,999 | 1,197 (81.0%) | 281 (19.0%) |
| $50,000 to $74,999 | 1,357 (86.7%) | 209 (13.4%) |
| $75,000 to $99,999 | 1,252 (88.5%) | 162 (11.5%) |
| $100,000 and over | 2,230 (95.8%) | 97 (4.2%) |
Public vs Private Health Insurance Coverage by Age in Major County
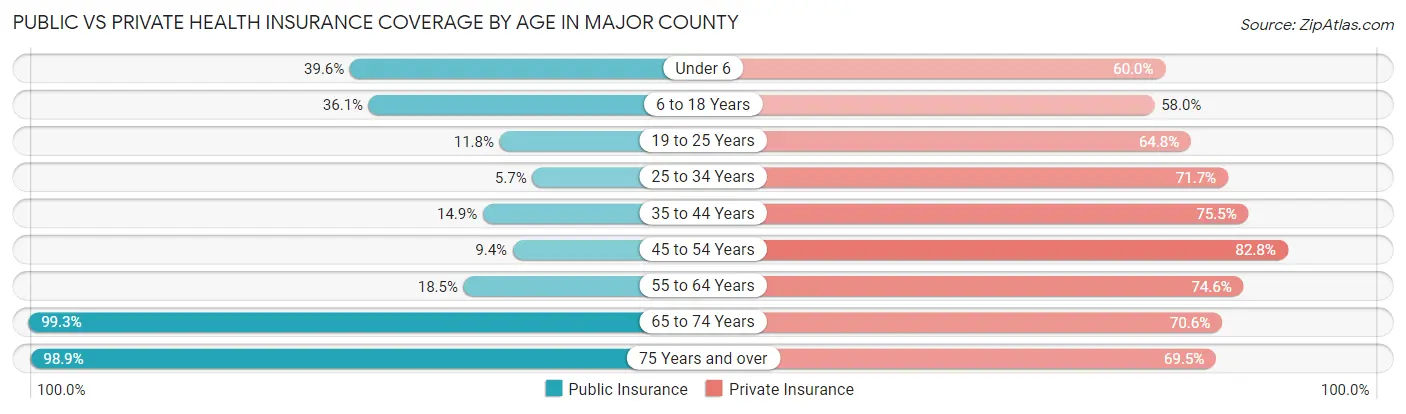
| Age Bracket | Public Insurance | Private Insurance |
| Under 6 | 205 (39.6%) | 311 (60.0%) |
| 6 to 18 Years | 549 (36.1%) | 882 (58.0%) |
| 19 to 25 Years | 62 (11.8%) | 341 (64.8%) |
| 25 to 34 Years | 37 (5.7%) | 463 (71.7%) |
| 35 to 44 Years | 135 (14.9%) | 684 (75.5%) |
| 45 to 54 Years | 83 (9.4%) | 734 (82.8%) |
| 55 to 64 Years | 192 (18.5%) | 775 (74.6%) |
| 65 to 74 Years | 871 (99.3%) | 619 (70.6%) |
| 75 Years and over | 645 (98.9%) | 453 (69.5%) |
| Total | 2,779 (36.7%) | 5,262 (69.5%) |
Disability Status by Sex by Age in Major County
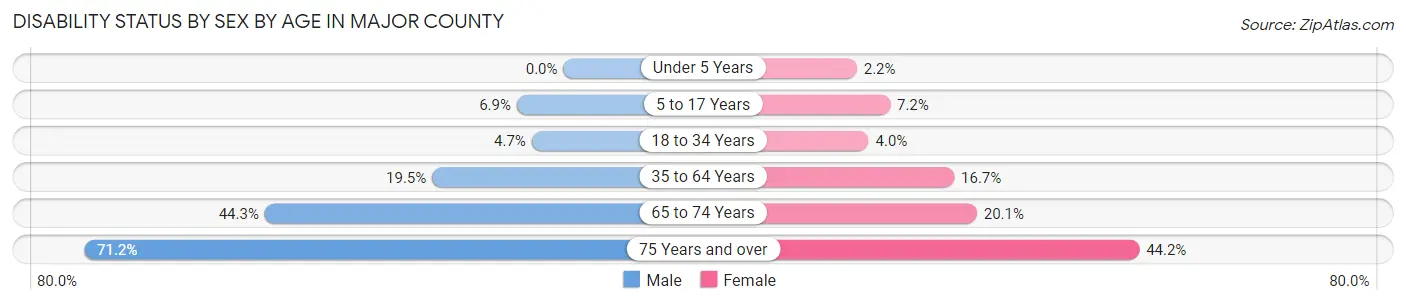
| Age Bracket | Male | Female |
| Under 5 Years | 0 (0.0%) | 5 (2.2%) |
| 5 to 17 Years | 54 (6.9%) | 51 (7.2%) |
| 18 to 34 Years | 30 (4.7%) | 25 (4.0%) |
| 35 to 64 Years | 282 (19.5%) | 231 (16.7%) |
| 65 to 74 Years | 192 (44.3%) | 89 (20.1%) |
| 75 Years and over | 190 (71.2%) | 170 (44.2%) |
Disability Class by Sex by Age in Major County
Disability Class: Hearing Difficulty
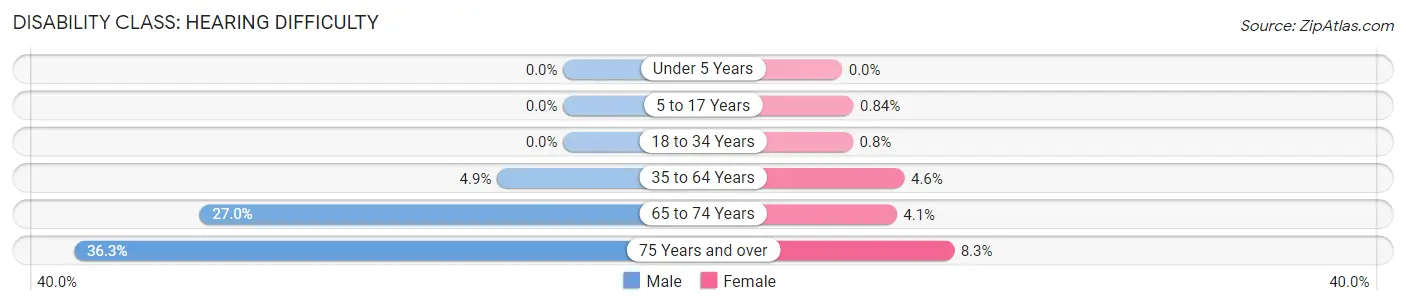
| Age Bracket | Male | Female |
| Under 5 Years | 0 (0.0%) | 0 (0.0%) |
| 5 to 17 Years | 0 (0.0%) | 6 (0.8%) |
| 18 to 34 Years | 0 (0.0%) | 5 (0.8%) |
| 35 to 64 Years | 71 (4.9%) | 64 (4.6%) |
| 65 to 74 Years | 117 (27.0%) | 18 (4.1%) |
| 75 Years and over | 97 (36.3%) | 32 (8.3%) |
Disability Class: Vision Difficulty
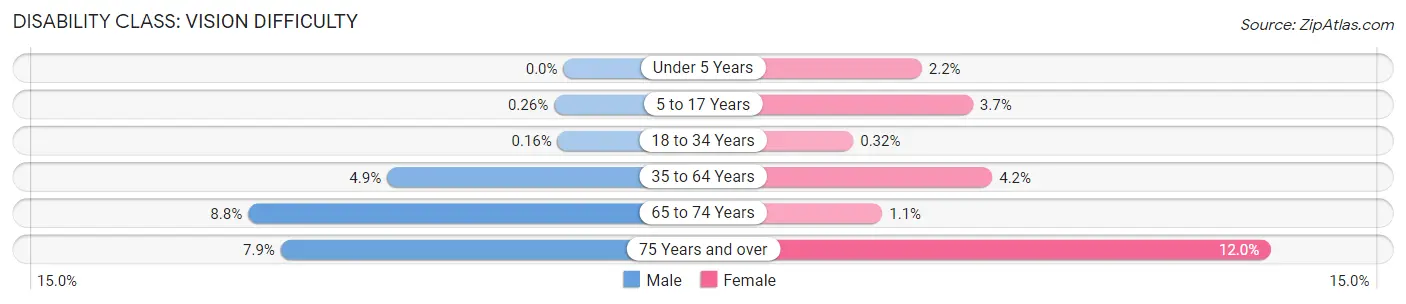
| Age Bracket | Male | Female |
| Under 5 Years | 0 (0.0%) | 5 (2.2%) |
| 5 to 17 Years | 2 (0.3%) | 26 (3.6%) |
| 18 to 34 Years | 1 (0.2%) | 2 (0.3%) |
| 35 to 64 Years | 71 (4.9%) | 58 (4.2%) |
| 65 to 74 Years | 38 (8.8%) | 5 (1.1%) |
| 75 Years and over | 21 (7.9%) | 46 (11.9%) |
Disability Class: Cognitive Difficulty
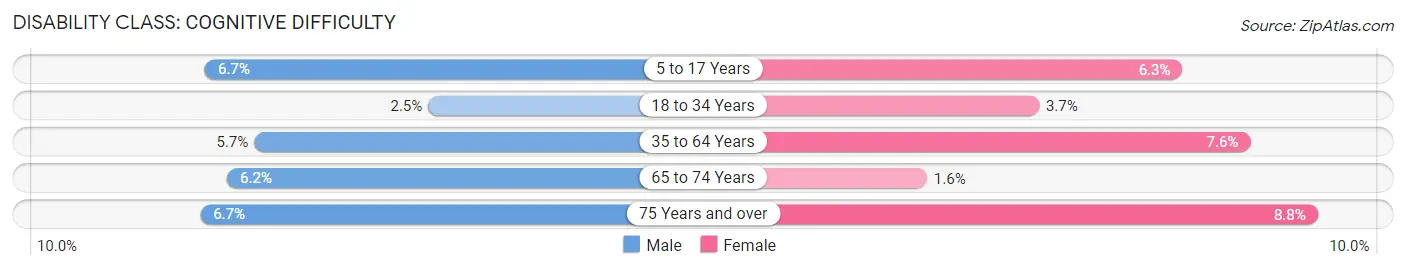
| Age Bracket | Male | Female |
| 5 to 17 Years | 52 (6.7%) | 45 (6.3%) |
| 18 to 34 Years | 16 (2.5%) | 23 (3.7%) |
| 35 to 64 Years | 83 (5.7%) | 105 (7.6%) |
| 65 to 74 Years | 27 (6.2%) | 7 (1.6%) |
| 75 Years and over | 18 (6.7%) | 34 (8.8%) |
Disability Class: Ambulatory Difficulty
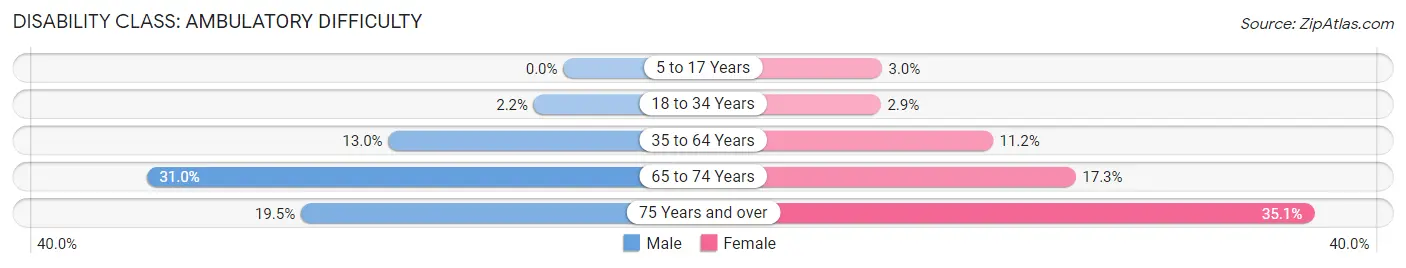
| Age Bracket | Male | Female |
| 5 to 17 Years | 0 (0.0%) | 21 (2.9%) |
| 18 to 34 Years | 14 (2.2%) | 18 (2.9%) |
| 35 to 64 Years | 188 (13.0%) | 155 (11.2%) |
| 65 to 74 Years | 134 (30.9%) | 77 (17.3%) |
| 75 Years and over | 52 (19.5%) | 135 (35.1%) |
Disability Class: Self-Care Difficulty
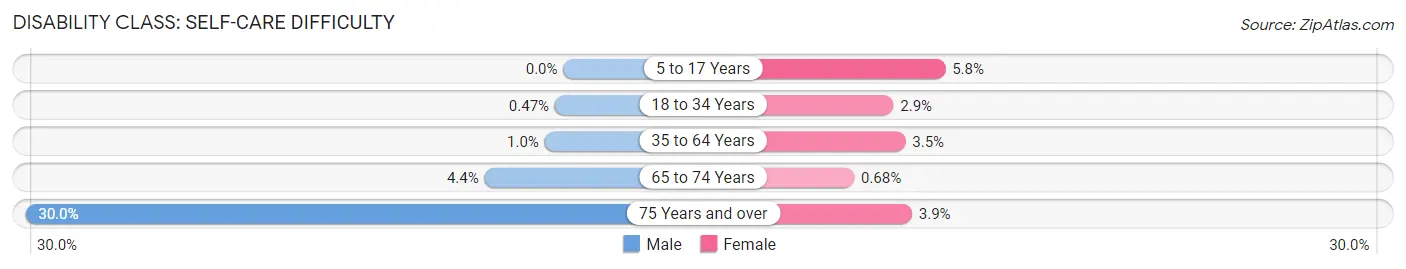
| Age Bracket | Male | Female |
| 5 to 17 Years | 0 (0.0%) | 41 (5.8%) |
| 18 to 34 Years | 3 (0.5%) | 18 (2.9%) |
| 35 to 64 Years | 15 (1.0%) | 49 (3.5%) |
| 65 to 74 Years | 19 (4.4%) | 3 (0.7%) |
| 75 Years and over | 80 (30.0%) | 15 (3.9%) |
Technology Access in Major County
Computing Device Access in Major County
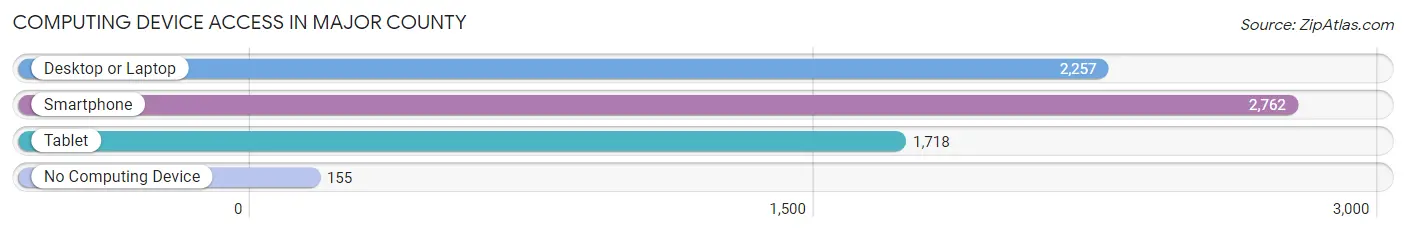
| Device Type | # Households | % Households |
| Desktop or Laptop | 2,257 | 71.3% |
| Smartphone | 2,762 | 87.2% |
| Tablet | 1,718 | 54.2% |
| No Computing Device | 155 | 4.9% |
| Total | 3,167 | 100.0% |
Internet Access in Major County
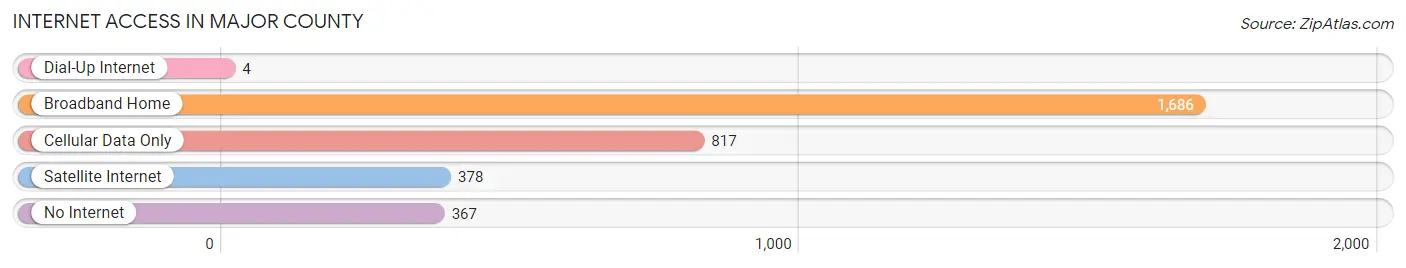
| Internet Type | # Households | % Households |
| Dial-Up Internet | 4 | 0.1% |
| Broadband Home | 1,686 | 53.2% |
| Cellular Data Only | 817 | 25.8% |
| Satellite Internet | 378 | 11.9% |
| No Internet | 367 | 11.6% |
| Total | 3,167 | 100.0% |
Major County Summary
Major County is located in the northwestern part of Oklahoma, and is bordered by Garfield County to the north, Woods County to the east, Alfalfa County to the south, and Harper County to the west. The county seat is Fairview, and the largest city is Ringwood. Major County was created in 1907 from part of Woods County, and was named for Major John T. Burris, a prominent local rancher.
Geography
Major County covers an area of 845 square miles, and is located in the Osage Plains region of Oklahoma. The terrain is mostly flat, with some rolling hills in the western part of the county. The Cimarron River flows through the county, and there are several small lakes and reservoirs. The county is mostly covered in grassland, with some areas of woodland.
The climate of Major County is semi-arid, with hot summers and cold winters. The average annual temperature is around 60°F, and the average annual precipitation is around 25 inches.
Demographics
As of the 2010 census, there were 7,527 people living in Major County. The population density was 8.9 people per square mile. The racial makeup of the county was 95.2% White, 0.7% African American, 1.2% Native American, 0.2% Asian, 0.1% Pacific Islander, 0.7% from other races, and 1.9% from two or more races. Hispanic or Latino of any race were 2.3% of the population.
The median income for a household in Major County was $37,917, and the median income for a family was $45,938. The per capita income for the county was $18,945. About 11.2% of families and 14.2% of the population were below the poverty line, including 17.2% of those under age 18 and 10.2% of those age 65 or over.
Economy
The economy of Major County is largely based on agriculture. The county is home to several large farms and ranches, and the main crops grown are wheat, corn, and hay. Cattle and poultry are also raised in the county.
The county is also home to several oil and gas fields, and there are several oil and gas related businesses in the area. The county is also home to several manufacturing companies, including a plastics plant and a furniture factory.
The county is served by two airports, the Fairview Municipal Airport and the Ringwood Municipal Airport. The county is also served by several highways, including US Highway 60, US Highway 64, and State Highway 11.
Conclusion
Major County is a rural county located in northwestern Oklahoma. The county is mostly agricultural, with some oil and gas production and manufacturing. The population of the county is mostly white, with a small minority population. The median income for the county is slightly below the state average, and the poverty rate is slightly higher than the state average.
Common Questions
What is Per Capita Income in Major County?
Per Capita income in Major County is $33,480.
What is the Median Family Income in Major County?
Median Family Income in Major County is $78,455.
What is the Median Household income in Major County?
Median Household Income in Major County is $67,621.
What is Income or Wage Gap in Major County?
Income or Wage Gap in Major County is 48.9%.
Women in Major County earn 51.1 cents for every dollar earned by a man.
What is Family Income Deficit in Major County?
Family Income Deficit in Major County is $9,024.
Families that are below poverty line in Major County earn $9,024 less on average than the poverty threshold level.
What is Inequality or Gini Index in Major County?
Inequality or Gini Index in Major County is 0.41.
What is the Total Population of Major County?
Total Population of Major County is 7,678.
What is the Total Male Population of Major County?
Total Male Population of Major County is 3,833.
What is the Total Female Population of Major County?
Total Female Population of Major County is 3,845.
What is the Ratio of Males per 100 Females in Major County?
There are 99.69 Males per 100 Females in Major County.
What is the Ratio of Females per 100 Males in Major County?
There are 100.31 Females per 100 Males in Major County.
What is the Median Population Age in Major County?
Median Population Age in Major County is 42.2 Years.
What is the Average Family Size in Major County
Average Family Size in Major County is 2.8 People.
What is the Average Household Size in Major County
Average Household Size in Major County is 2.4 People.
How Large is the Labor Force in Major County?
There are 3,498 People in the Labor Forcein in Major County.
What is the Percentage of People in the Labor Force in Major County?
59.1% of People are in the Labor Force in Major County.
What is the Unemployment Rate in Major County?
Unemployment Rate in Major County is 1.8%.