Love County, OK Map & Demographics
Love County Map
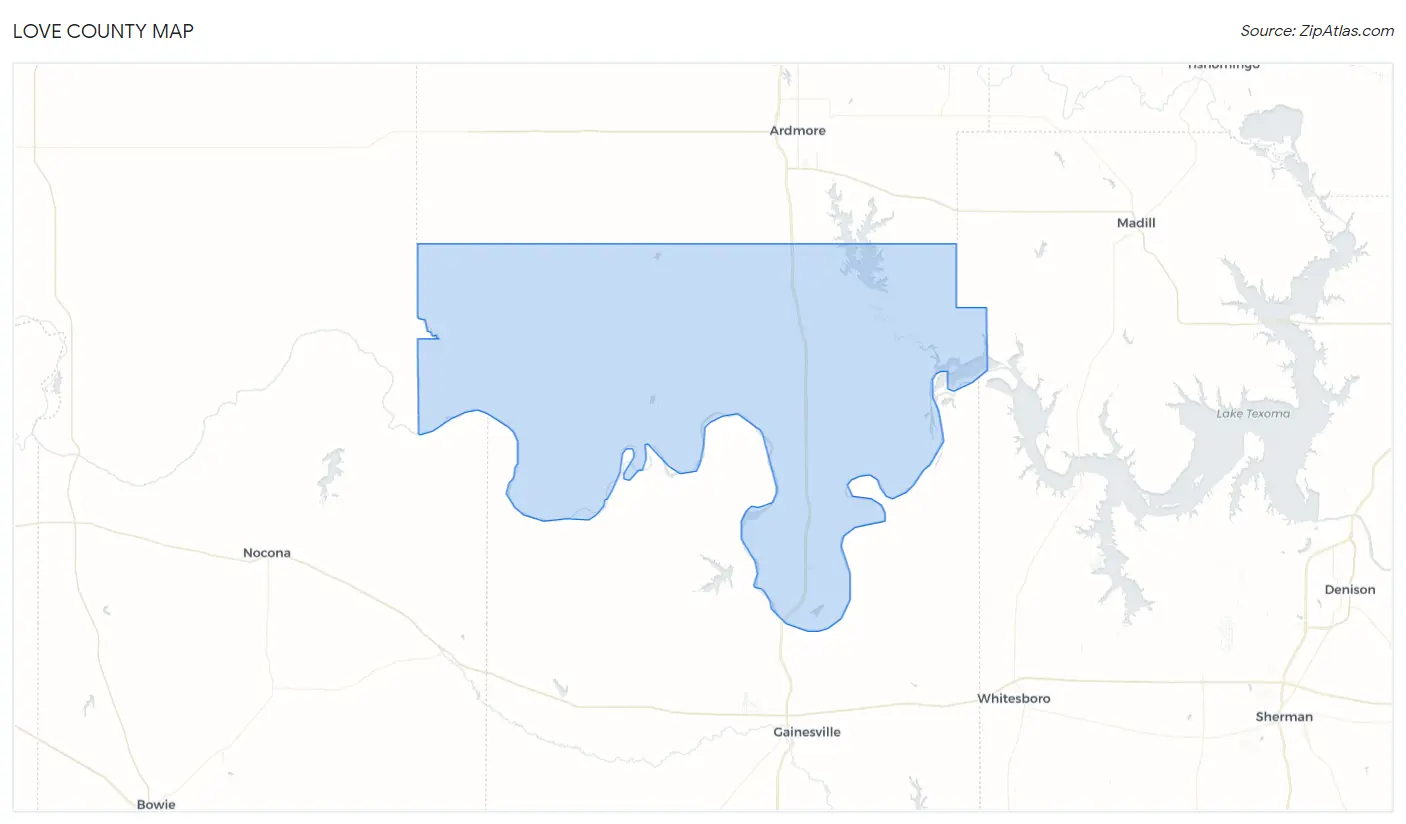
Love County Overview
$28,560
PER CAPITA INCOME
$70,952
AVG FAMILY INCOME
$60,758
AVG HOUSEHOLD INCOME
37.1%
WAGE / INCOME GAP [ % ]
62.9¢/ $1
WAGE / INCOME GAP [ $ ]
$10,496
FAMILY INCOME DEFICIT
0.41
INEQUALITY / GINI INDEX
10,158
TOTAL POPULATION
5,137
MALE POPULATION
5,021
FEMALE POPULATION
102.31
MALES / 100 FEMALES
97.74
FEMALES / 100 MALES
39.0
MEDIAN AGE
3.4
AVG FAMILY SIZE
2.7
AVG HOUSEHOLD SIZE
4,645
LABOR FORCE [ PEOPLE ]
58.3%
PERCENT IN LABOR FORCE
5.4%
UNEMPLOYMENT RATE
Love County Area Codes
Income in Love County
Income Overview in Love County
Per Capita Income in Love County is $28,560, while median incomes of families and households are $70,952 and $60,758 respectively.
| Characteristic | Number | Measure |
| Per Capita Income | 10,158 | $28,560 |
| Median Family Income | 2,476 | $70,952 |
| Mean Family Income | 2,476 | $84,864 |
| Median Household Income | 3,686 | $60,758 |
| Mean Household Income | 3,686 | $74,687 |
| Income Deficit | 2,476 | $10,496 |
| Wage / Income Gap (%) | 10,158 | 37.05% |
| Wage / Income Gap ($) | 10,158 | 62.95¢ per $1 |
| Gini / Inequality Index | 10,158 | 0.41 |
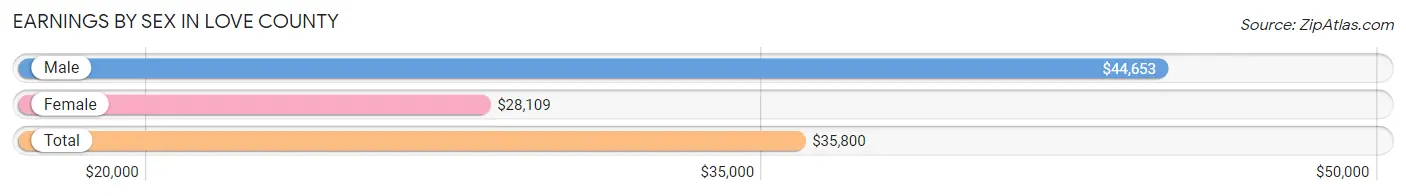
Earnings by Sex in Love County
Average Earnings in Love County are $35,800, $44,653 for men and $28,109 for women, a difference of 37.0%.
| Sex | Number | Average Earnings |
| Male | 2,630 (54.1%) | $44,653 |
| Female | 2,233 (45.9%) | $28,109 |
| Total | 4,863 (100.0%) | $35,800 |
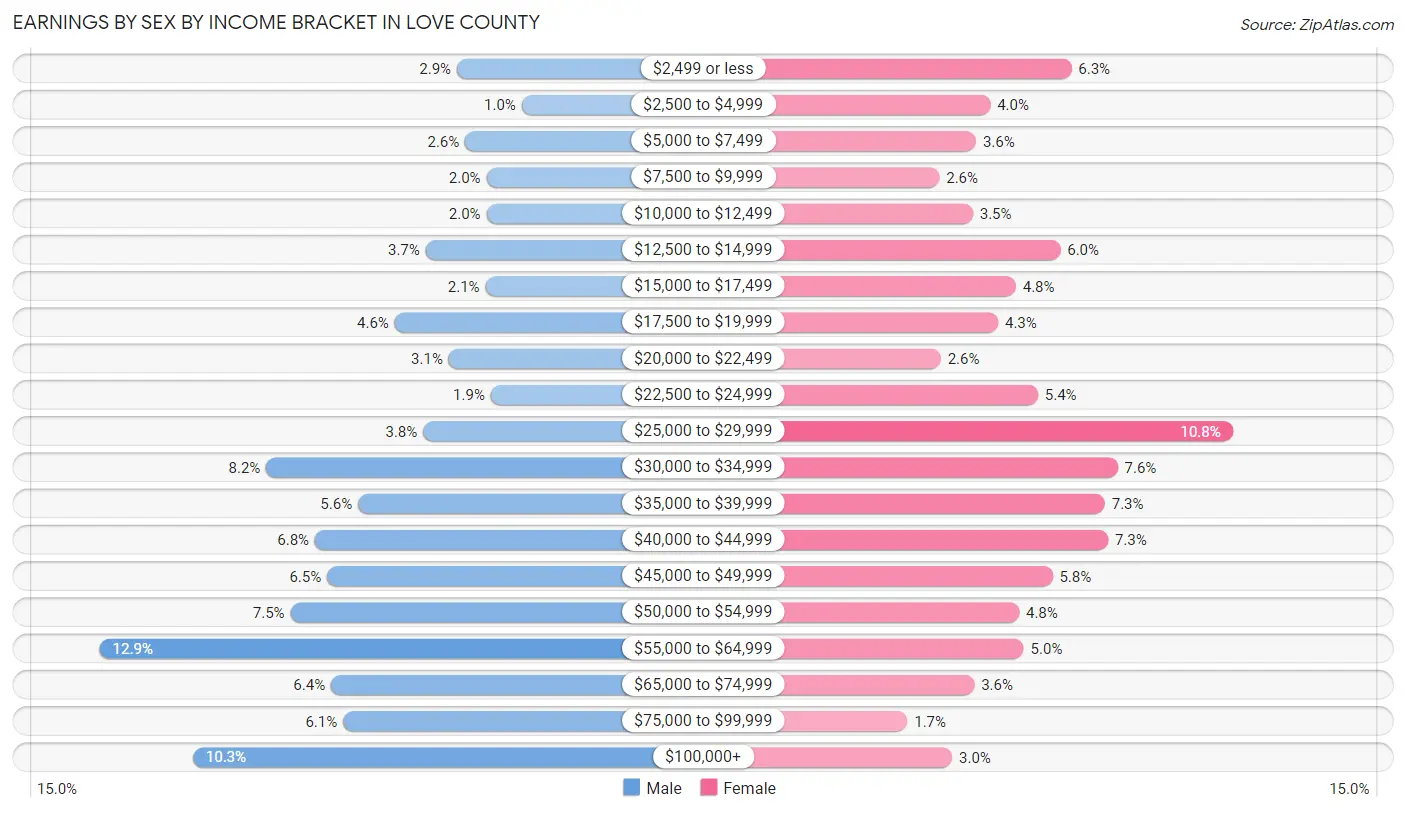
Earnings by Sex by Income Bracket in Love County
The most common earnings brackets in Love County are $55,000 to $64,999 for men (339 | 12.9%) and $25,000 to $29,999 for women (242 | 10.8%).
| Income | Male | Female |
| $2,499 or less | 75 (2.9%) | 141 (6.3%) |
| $2,500 to $4,999 | 27 (1.0%) | 90 (4.0%) |
| $5,000 to $7,499 | 69 (2.6%) | 81 (3.6%) |
| $7,500 to $9,999 | 53 (2.0%) | 58 (2.6%) |
| $10,000 to $12,499 | 53 (2.0%) | 79 (3.5%) |
| $12,500 to $14,999 | 98 (3.7%) | 134 (6.0%) |
| $15,000 to $17,499 | 54 (2.1%) | 106 (4.8%) |
| $17,500 to $19,999 | 121 (4.6%) | 95 (4.3%) |
| $20,000 to $22,499 | 81 (3.1%) | 59 (2.6%) |
| $22,500 to $24,999 | 50 (1.9%) | 120 (5.4%) |
| $25,000 to $29,999 | 100 (3.8%) | 242 (10.8%) |
| $30,000 to $34,999 | 216 (8.2%) | 170 (7.6%) |
| $35,000 to $39,999 | 148 (5.6%) | 162 (7.2%) |
| $40,000 to $44,999 | 180 (6.8%) | 164 (7.3%) |
| $45,000 to $49,999 | 171 (6.5%) | 129 (5.8%) |
| $50,000 to $54,999 | 198 (7.5%) | 108 (4.8%) |
| $55,000 to $64,999 | 339 (12.9%) | 111 (5.0%) |
| $65,000 to $74,999 | 168 (6.4%) | 80 (3.6%) |
| $75,000 to $99,999 | 159 (6.0%) | 38 (1.7%) |
| $100,000+ | 270 (10.3%) | 66 (3.0%) |
| Total | 2,630 (100.0%) | 2,233 (100.0%) |
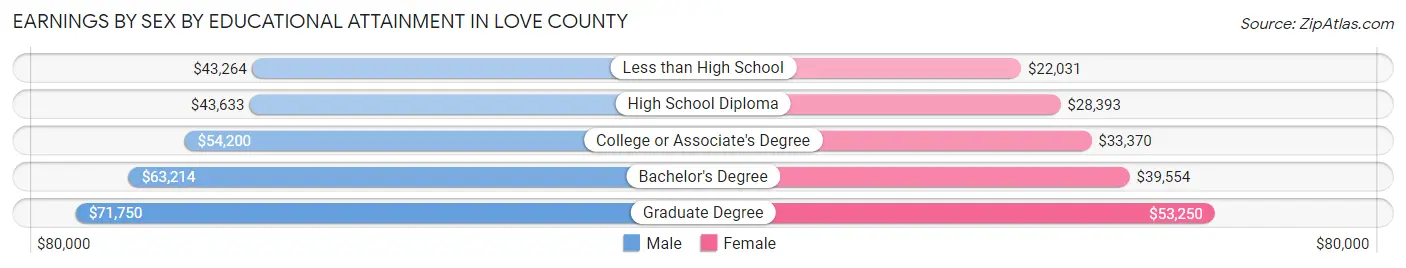
Earnings by Sex by Educational Attainment in Love County
Average earnings in Love County are $49,886 for men and $31,330 for women, a difference of 37.2%. Men with an educational attainment of graduate degree enjoy the highest average annual earnings of $71,750, while those with less than high school education earn the least with $43,264. Women with an educational attainment of graduate degree earn the most with the average annual earnings of $53,250, while those with less than high school education have the smallest earnings of $22,031.
| Educational Attainment | Male Income | Female Income |
| Less than High School | $43,264 | $22,031 |
| High School Diploma | $43,633 | $28,393 |
| College or Associate's Degree | $54,200 | $33,370 |
| Bachelor's Degree | $63,214 | $39,554 |
| Graduate Degree | $71,750 | $53,250 |
| Total | $49,886 | $31,330 |
Family Income in Love County
Family Income Brackets in Love County
According to the Love County family income data, there are 495 families falling into the $50,000 to $74,999 income range, which is the most common income bracket and makes up 20.0% of all families. Conversely, the $10,000 to $14,999 income bracket is the least frequent group with only 30 families (1.2%) belonging to this category.
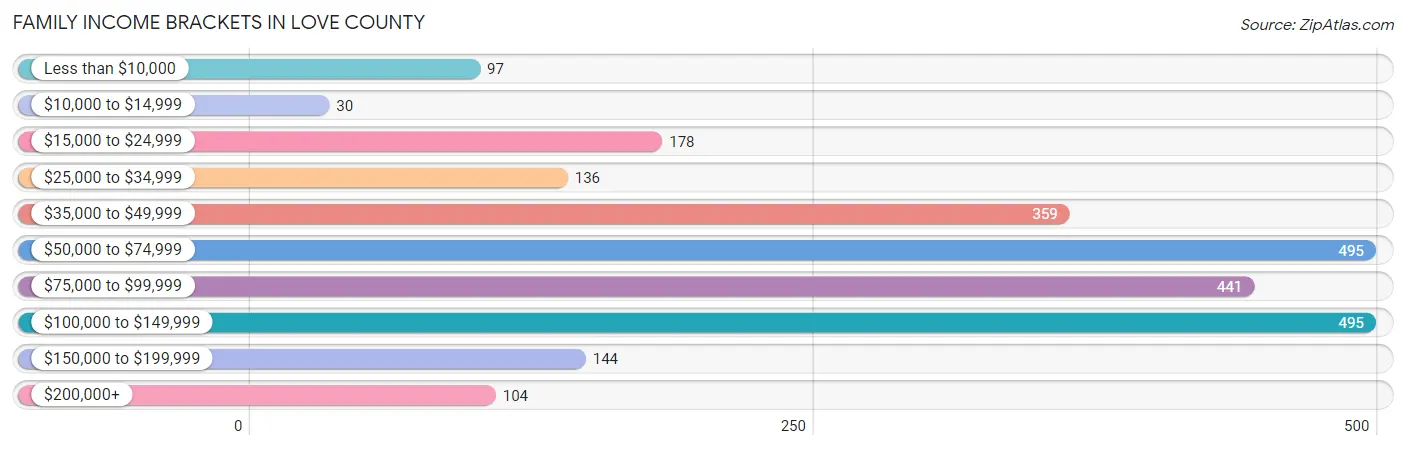
| Income Bracket | # Families | % Families |
| Less than $10,000 | 97 | 3.9% |
| $10,000 to $14,999 | 30 | 1.2% |
| $15,000 to $24,999 | 178 | 7.2% |
| $25,000 to $34,999 | 136 | 5.5% |
| $35,000 to $49,999 | 359 | 14.5% |
| $50,000 to $74,999 | 495 | 20.0% |
| $75,000 to $99,999 | 441 | 17.8% |
| $100,000 to $149,999 | 495 | 20.0% |
| $150,000 to $199,999 | 144 | 5.8% |
| $200,000+ | 104 | 4.2% |
Family Income by Famaliy Size in Love County
6-person families (63 | 2.5%) account for the highest median family income in Love County with $127,917 per family, while 2-person families (1,220 | 49.3%) have the highest median income of $31,212 per family member.
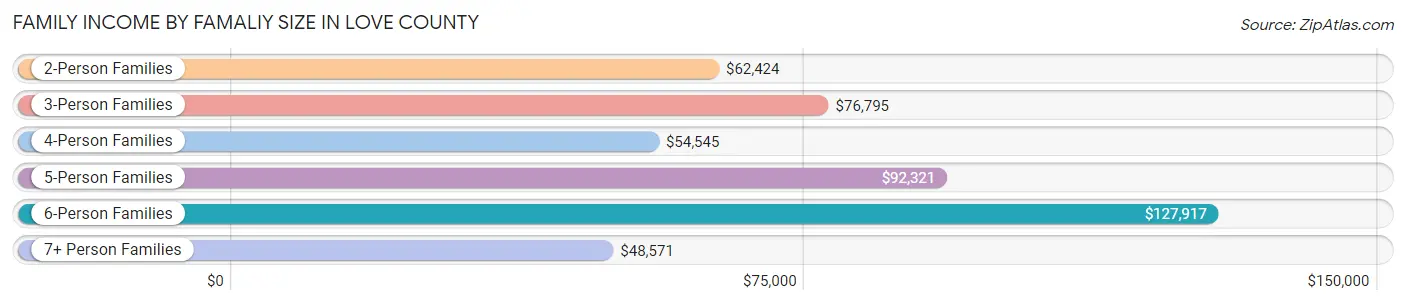
| Income Bracket | # Families | Median Income |
| 2-Person Families | 1,220 (49.3%) | $62,424 |
| 3-Person Families | 578 (23.3%) | $76,795 |
| 4-Person Families | 328 (13.3%) | $54,545 |
| 5-Person Families | 245 (9.9%) | $92,321 |
| 6-Person Families | 63 (2.5%) | $127,917 |
| 7+ Person Families | 42 (1.7%) | $48,571 |
| Total | 2,476 (100.0%) | $70,952 |
Family Income by Number of Earners in Love County
The median family income in Love County is $70,952, with families comprising 3+ earners (205) having the highest median family income of $102,438, while families with no earners (519) have the lowest median family income of $46,964, accounting for 8.3% and 21.0% of families, respectively.
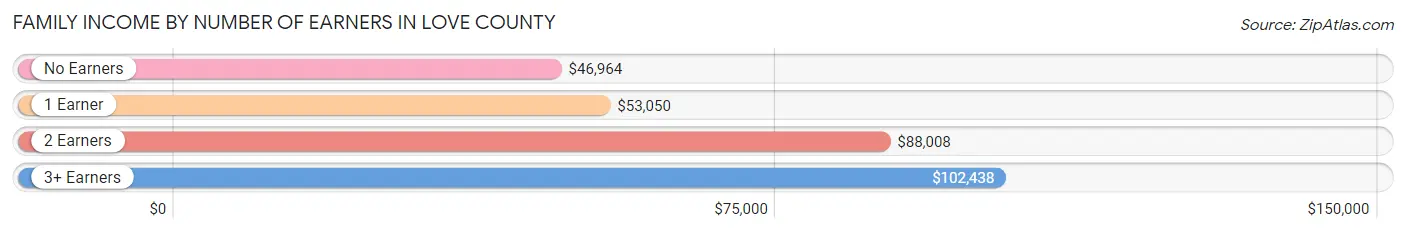
| Number of Earners | # Families | Median Income |
| No Earners | 519 (21.0%) | $46,964 |
| 1 Earner | 747 (30.2%) | $53,050 |
| 2 Earners | 1,005 (40.6%) | $88,008 |
| 3+ Earners | 205 (8.3%) | $102,438 |
| Total | 2,476 (100.0%) | $70,952 |
Household Income in Love County
Household Income Brackets in Love County
With 686 households falling in the category, the $50,000 to $74,999 income range is the most frequent in Love County, accounting for 18.6% of all households. In contrast, only 111 households (3.0%) fall into the $200,000+ income bracket, making it the least populous group.
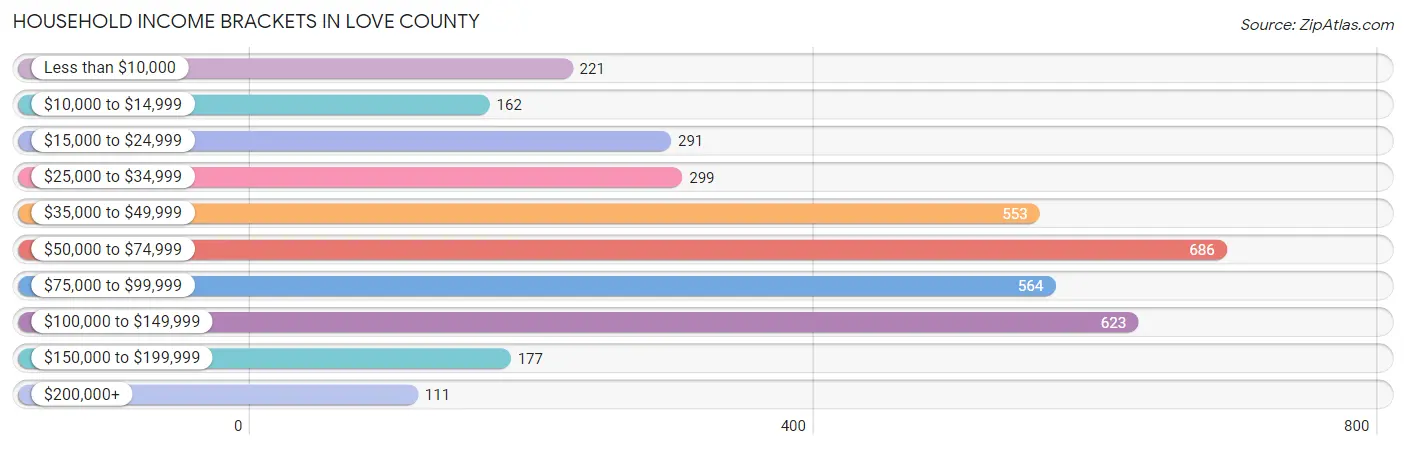
| Income Bracket | # Households | % Households |
| Less than $10,000 | 221 | 6.0% |
| $10,000 to $14,999 | 162 | 4.4% |
| $15,000 to $24,999 | 291 | 7.9% |
| $25,000 to $34,999 | 299 | 8.1% |
| $35,000 to $49,999 | 553 | 15.0% |
| $50,000 to $74,999 | 686 | 18.6% |
| $75,000 to $99,999 | 564 | 15.3% |
| $100,000 to $149,999 | 623 | 16.9% |
| $150,000 to $199,999 | 177 | 4.8% |
| $200,000+ | 111 | 3.0% |
Household Income by Householder Age in Love County
The median household income in Love County is $60,758, with the highest median household income of $68,254 found in the 25 to 44 years age bracket for the primary householder. A total of 1,019 households (27.7%) fall into this category. Meanwhile, the 15 to 24 years age bracket for the primary householder has the lowest median household income of $43,182, with 172 households (4.7%) in this group.
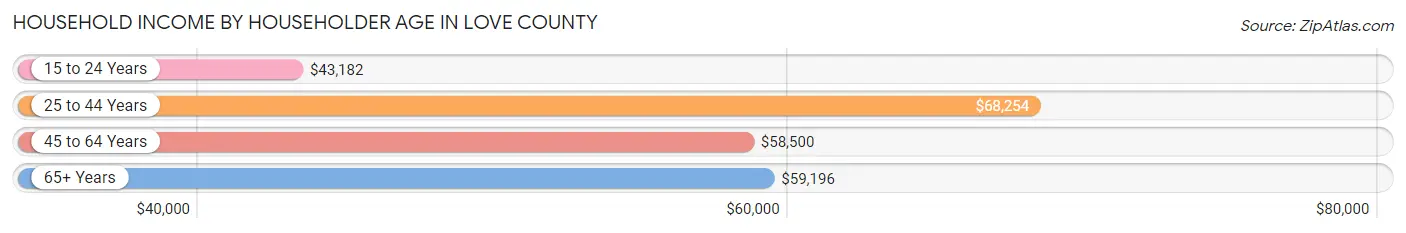
| Income Bracket | # Households | Median Income |
| 15 to 24 Years | 172 (4.7%) | $43,182 |
| 25 to 44 Years | 1,019 (27.7%) | $68,254 |
| 45 to 64 Years | 1,340 (36.3%) | $58,500 |
| 65+ Years | 1,155 (31.3%) | $59,196 |
| Total | 3,686 (100.0%) | $60,758 |
Poverty in Love County
Income Below Poverty by Sex and Age in Love County
With 13.2% poverty level for males and 15.2% for females among the residents of Love County, 12 to 14 year old males and 15 year old females are the most vulnerable to poverty, with 43 males (28.9%) and 23 females (26.4%) in their respective age groups living below the poverty level.
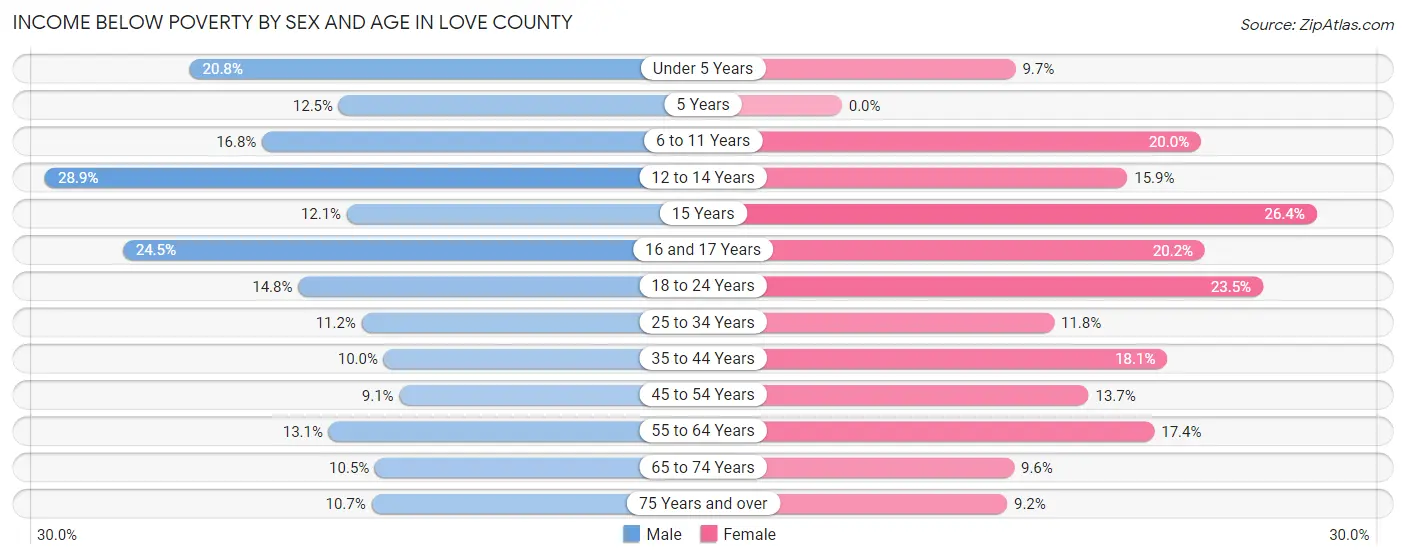
| Age Bracket | Male | Female |
| Under 5 Years | 67 (20.8%) | 29 (9.7%) |
| 5 Years | 8 (12.5%) | 0 (0.0%) |
| 6 to 11 Years | 82 (16.8%) | 85 (20.0%) |
| 12 to 14 Years | 43 (28.9%) | 31 (15.9%) |
| 15 Years | 10 (12.0%) | 23 (26.4%) |
| 16 and 17 Years | 26 (24.5%) | 36 (20.2%) |
| 18 to 24 Years | 71 (14.8%) | 102 (23.4%) |
| 25 to 34 Years | 71 (11.2%) | 69 (11.8%) |
| 35 to 44 Years | 56 (10.0%) | 100 (18.1%) |
| 45 to 54 Years | 59 (9.1%) | 87 (13.7%) |
| 55 to 64 Years | 85 (13.1%) | 111 (17.4%) |
| 65 to 74 Years | 55 (10.5%) | 51 (9.6%) |
| 75 Years and over | 41 (10.7%) | 32 (9.2%) |
| Total | 674 (13.2%) | 756 (15.2%) |
Income Above Poverty by Sex and Age in Love County
According to the poverty statistics in Love County, males aged 45 to 54 years and females aged 5 years are the age groups that are most secure financially, with 90.9% of males and 100.0% of females in these age groups living above the poverty line.
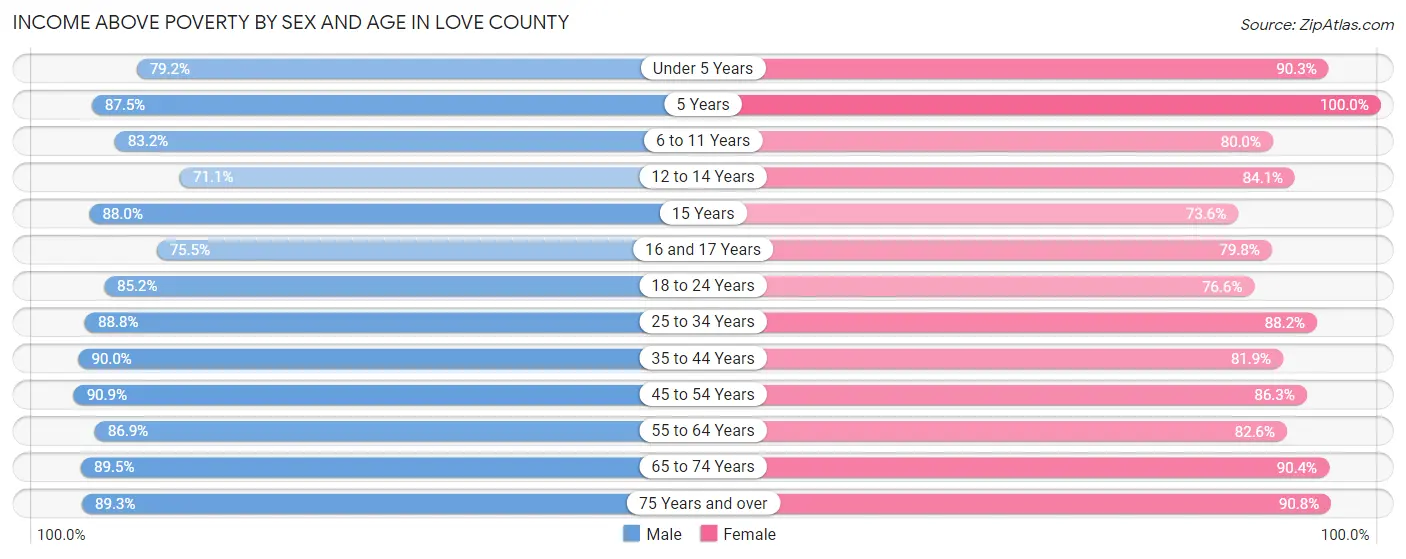
| Age Bracket | Male | Female |
| Under 5 Years | 255 (79.2%) | 271 (90.3%) |
| 5 Years | 56 (87.5%) | 61 (100.0%) |
| 6 to 11 Years | 407 (83.2%) | 340 (80.0%) |
| 12 to 14 Years | 106 (71.1%) | 164 (84.1%) |
| 15 Years | 73 (87.9%) | 64 (73.6%) |
| 16 and 17 Years | 80 (75.5%) | 142 (79.8%) |
| 18 to 24 Years | 410 (85.2%) | 333 (76.5%) |
| 25 to 34 Years | 561 (88.8%) | 515 (88.2%) |
| 35 to 44 Years | 504 (90.0%) | 452 (81.9%) |
| 45 to 54 Years | 587 (90.9%) | 546 (86.3%) |
| 55 to 64 Years | 566 (86.9%) | 527 (82.6%) |
| 65 to 74 Years | 470 (89.5%) | 481 (90.4%) |
| 75 Years and over | 343 (89.3%) | 316 (90.8%) |
| Total | 4,418 (86.8%) | 4,212 (84.8%) |
Income Below Poverty Among Married-Couple Families in Love County
The poverty statistics for married-couple families in Love County show that 6.9% or 134 of the total 1,940 families live below the poverty line. Families with 5 or more children have the highest poverty rate of 27.0%, comprising of 10 families. On the other hand, families with no children have the lowest poverty rate of 5.2%, which includes 63 families.
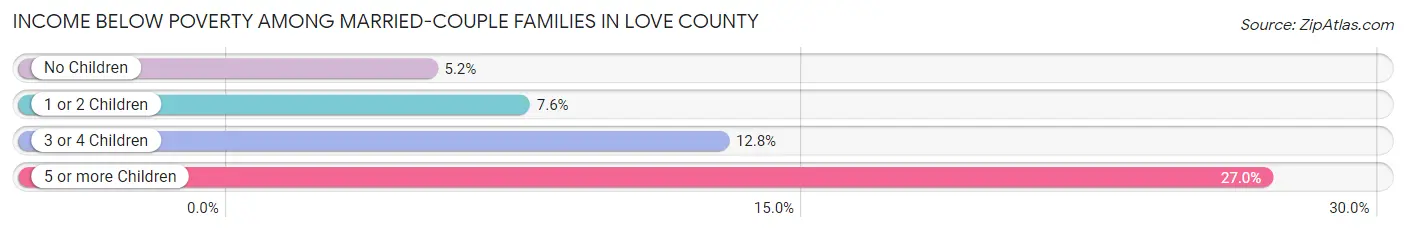
| Children | Above Poverty | Below Poverty |
| No Children | 1,146 (94.8%) | 63 (5.2%) |
| 1 or 2 Children | 497 (92.4%) | 41 (7.6%) |
| 3 or 4 Children | 136 (87.2%) | 20 (12.8%) |
| 5 or more Children | 27 (73.0%) | 10 (27.0%) |
| Total | 1,806 (93.1%) | 134 (6.9%) |
Income Below Poverty Among Single-Parent Households in Love County
According to the poverty data in Love County, 9.8% or 17 single-father households and 26.5% or 96 single-mother households are living below the poverty line. Among single-father households, those with 3 or 4 children have the highest poverty rate, with 5 households (50.0%) experiencing poverty. Likewise, among single-mother households, those with 3 or 4 children have the highest poverty rate, with 34 households (51.5%) falling below the poverty line.
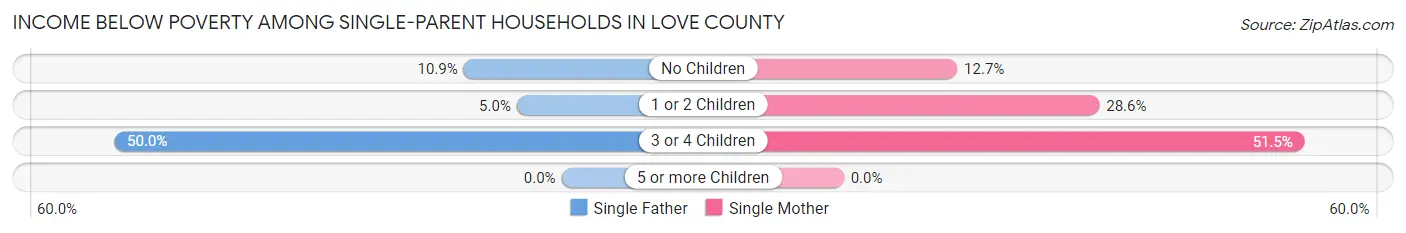
| Children | Single Father | Single Mother |
| No Children | 7 (10.9%) | 18 (12.7%) |
| 1 or 2 Children | 5 (5.0%) | 44 (28.6%) |
| 3 or 4 Children | 5 (50.0%) | 34 (51.5%) |
| 5 or more Children | 0 (0.0%) | 0 (0.0%) |
| Total | 17 (9.8%) | 96 (26.5%) |
Income Below Poverty Among Married-Couple vs Single-Parent Households in Love County
The poverty data for Love County shows that 134 of the married-couple family households (6.9%) and 113 of the single-parent households (21.1%) are living below the poverty level. Within the married-couple family households, those with 5 or more children have the highest poverty rate, with 10 households (27.0%) falling below the poverty line. Among the single-parent households, those with 3 or 4 children have the highest poverty rate, with 39 household (51.3%) living below poverty.
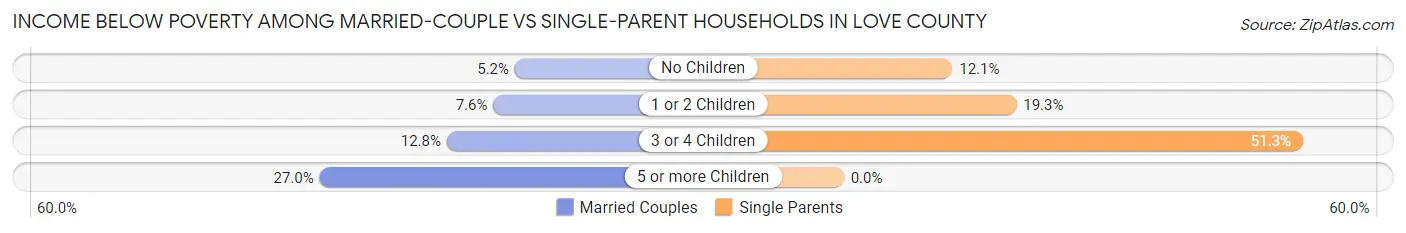
| Children | Married-Couple Families | Single-Parent Households |
| No Children | 63 (5.2%) | 25 (12.1%) |
| 1 or 2 Children | 41 (7.6%) | 49 (19.3%) |
| 3 or 4 Children | 20 (12.8%) | 39 (51.3%) |
| 5 or more Children | 10 (27.0%) | 0 (0.0%) |
| Total | 134 (6.9%) | 113 (21.1%) |
Race in Love County
The most populous races in Love County are White / Caucasian (7,646 | 75.3%), Hispanic or Latino (1,757 | 17.3%), and Two or more Races (1,428 | 14.1%).
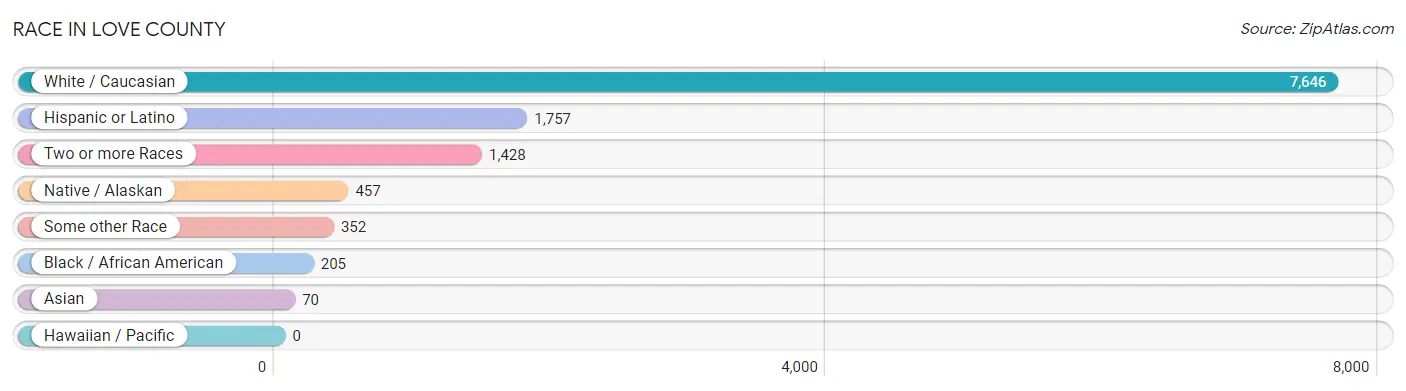
| Race | # Population | % Population |
| Asian | 70 | 0.7% |
| Black / African American | 205 | 2.0% |
| Hawaiian / Pacific | 0 | 0.0% |
| Hispanic or Latino | 1,757 | 17.3% |
| Native / Alaskan | 457 | 4.5% |
| White / Caucasian | 7,646 | 75.3% |
| Two or more Races | 1,428 | 14.1% |
| Some other Race | 352 | 3.5% |
| Total | 10,158 | 100.0% |
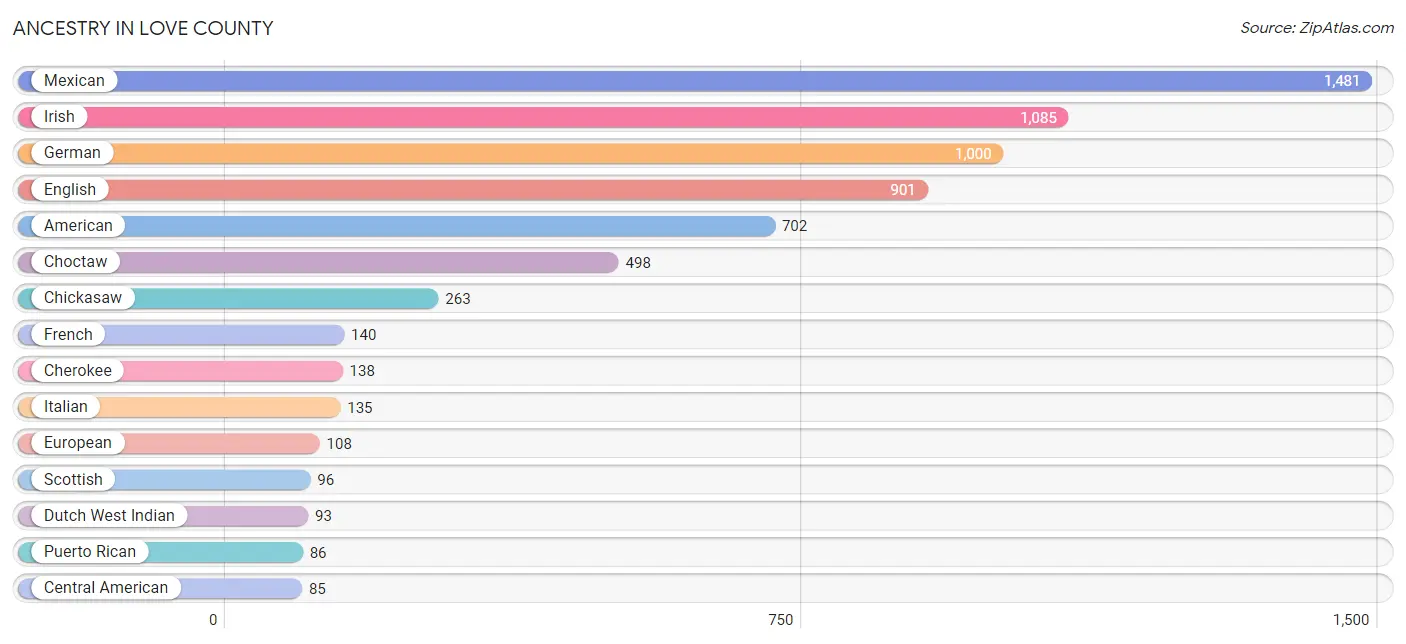
Ancestry in Love County
The most populous ancestries reported in Love County are Mexican (1,481 | 14.6%), Irish (1,085 | 10.7%), German (1,000 | 9.8%), English (901 | 8.9%), and American (702 | 6.9%), together accounting for 50.9% of all Love County residents.
| Ancestry | # Population | % Population |
| African | 19 | 0.2% |
| American | 702 | 6.9% |
| Apache | 31 | 0.3% |
| Australian | 1 | 0.0% |
| Austrian | 12 | 0.1% |
| Bhutanese | 11 | 0.1% |
| Blackfeet | 14 | 0.1% |
| British | 23 | 0.2% |
| Burmese | 4 | 0.0% |
| Central American | 85 | 0.8% |
| Cherokee | 138 | 1.4% |
| Chickasaw | 263 | 2.6% |
| Choctaw | 498 | 4.9% |
| Colombian | 16 | 0.2% |
| Comanche | 28 | 0.3% |
| Cree | 18 | 0.2% |
| Creek | 29 | 0.3% |
| Croatian | 4 | 0.0% |
| Czech | 12 | 0.1% |
| Danish | 12 | 0.1% |
| Dutch | 77 | 0.8% |
| Dutch West Indian | 93 | 0.9% |
| Eastern European | 17 | 0.2% |
| English | 901 | 8.9% |
| European | 108 | 1.1% |
| French | 140 | 1.4% |
| French Canadian | 9 | 0.1% |
| German | 1,000 | 9.8% |
| German Russian | 3 | 0.0% |
| Greek | 23 | 0.2% |
| Guatemalan | 20 | 0.2% |
| Honduran | 59 | 0.6% |
| Hungarian | 6 | 0.1% |
| Indian (Asian) | 4 | 0.0% |
| Iranian | 5 | 0.1% |
| Irish | 1,085 | 10.7% |
| Italian | 135 | 1.3% |
| Kiowa | 16 | 0.2% |
| Korean | 35 | 0.3% |
| Mexican | 1,481 | 14.6% |
| Mexican American Indian | 20 | 0.2% |
| Norwegian | 46 | 0.4% |
| Osage | 4 | 0.0% |
| Pakistani | 13 | 0.1% |
| Polish | 63 | 0.6% |
| Portuguese | 1 | 0.0% |
| Puerto Rican | 86 | 0.9% |
| Russian | 18 | 0.2% |
| Salvadoran | 6 | 0.1% |
| Scandinavian | 20 | 0.2% |
| Scotch-Irish | 54 | 0.5% |
| Scottish | 96 | 0.9% |
| Sioux | 19 | 0.2% |
| Slovak | 4 | 0.0% |
| South American | 16 | 0.2% |
| Spaniard | 19 | 0.2% |
| Spanish | 38 | 0.4% |
| Spanish American | 6 | 0.1% |
| Sri Lankan | 20 | 0.2% |
| Subsaharan African | 19 | 0.2% |
| Swedish | 3 | 0.0% |
| Swiss | 6 | 0.1% |
| Thai | 21 | 0.2% |
| Turkish | 15 | 0.2% |
| Welsh | 78 | 0.8% |
| Yaqui | 2 | 0.0% | View All 66 Rows |
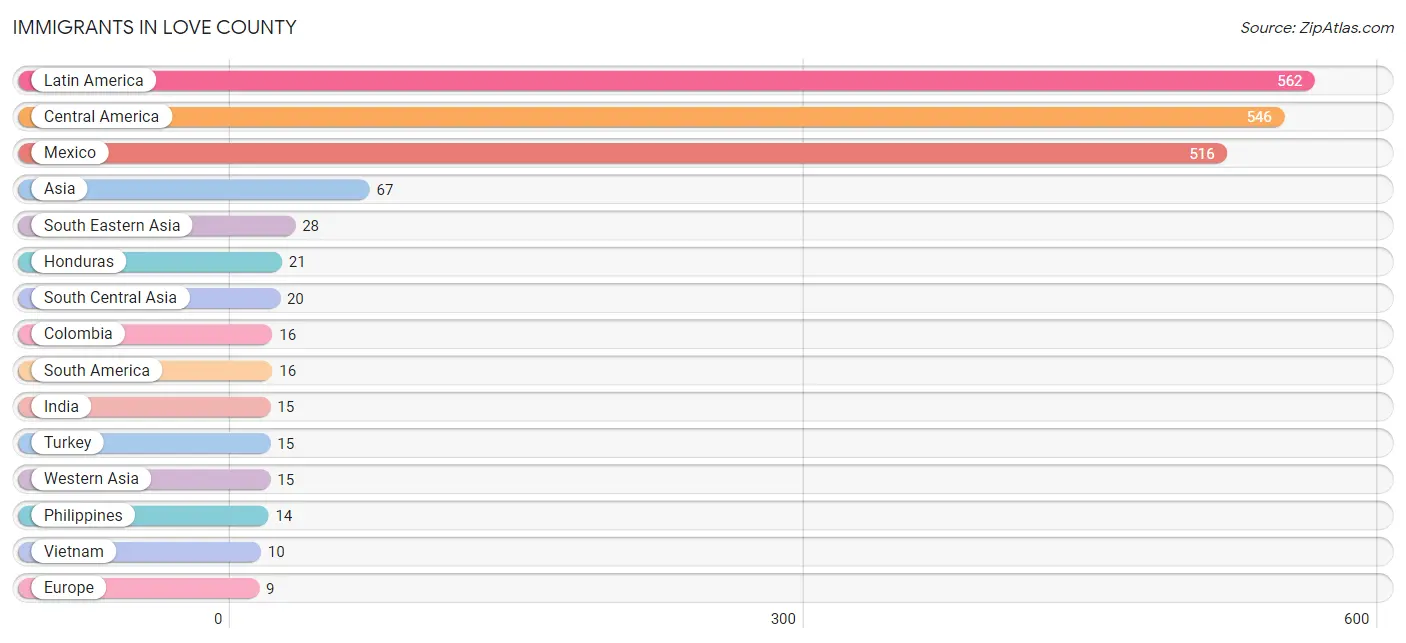
Immigrants in Love County
The most numerous immigrant groups reported in Love County came from Latin America (562 | 5.5%), Central America (546 | 5.4%), Mexico (516 | 5.1%), Asia (67 | 0.7%), and South Eastern Asia (28 | 0.3%), together accounting for 16.9% of all Love County residents.
| Immigration Origin | # Population | % Population |
| Asia | 67 | 0.7% |
| Central America | 546 | 5.4% |
| Colombia | 16 | 0.2% |
| Eastern Asia | 4 | 0.0% |
| Eastern Europe | 2 | 0.0% |
| Europe | 9 | 0.1% |
| Germany | 3 | 0.0% |
| Guatemala | 9 | 0.1% |
| Honduras | 21 | 0.2% |
| Hungary | 2 | 0.0% |
| India | 15 | 0.2% |
| Iran | 5 | 0.1% |
| Korea | 4 | 0.0% |
| Latin America | 562 | 5.5% |
| Mexico | 516 | 5.1% |
| Northern Europe | 4 | 0.0% |
| Philippines | 14 | 0.1% |
| Scotland | 4 | 0.0% |
| South America | 16 | 0.2% |
| South Central Asia | 20 | 0.2% |
| South Eastern Asia | 28 | 0.3% |
| Thailand | 4 | 0.0% |
| Turkey | 15 | 0.2% |
| Vietnam | 10 | 0.1% |
| Western Asia | 15 | 0.2% |
| Western Europe | 3 | 0.0% | View All 26 Rows |
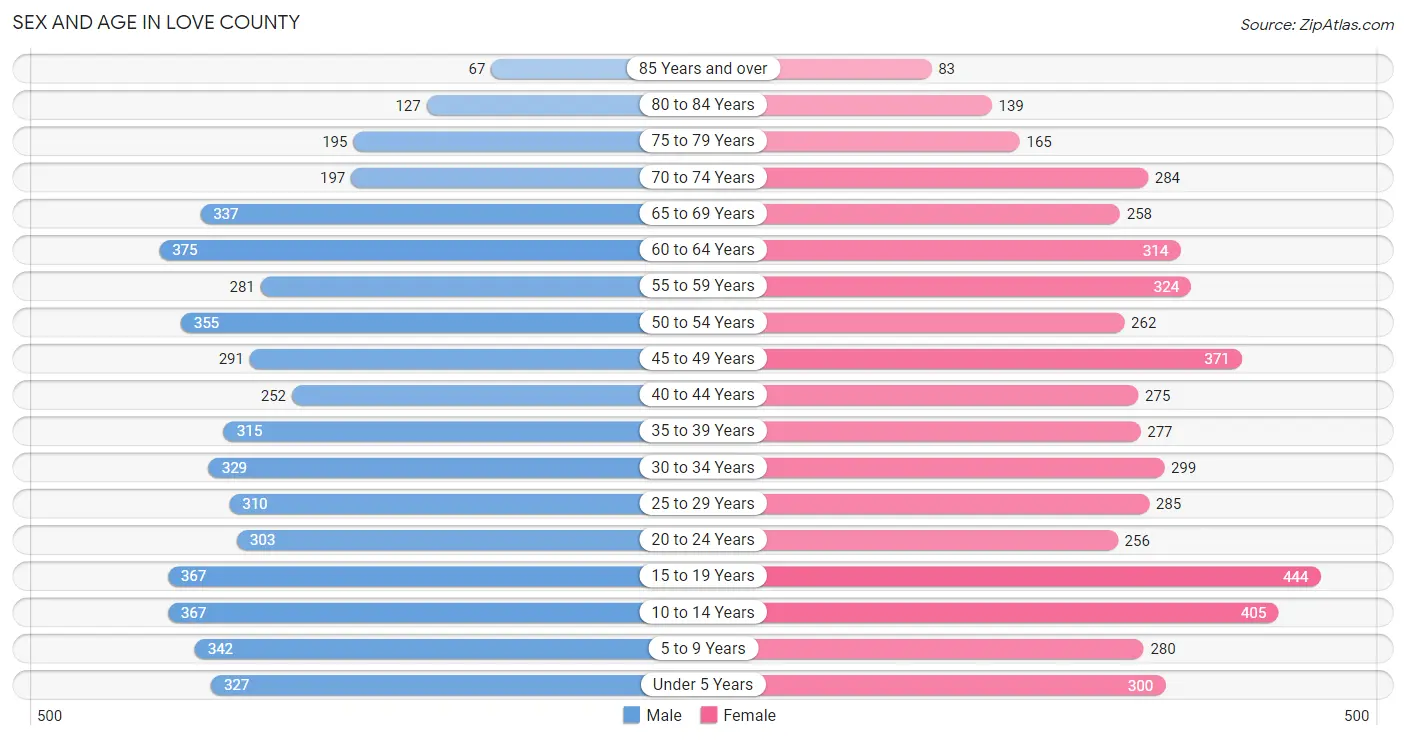
Sex and Age in Love County
Sex and Age in Love County
The most populous age groups in Love County are 60 to 64 Years (375 | 7.3%) for men and 15 to 19 Years (444 | 8.8%) for women.
| Age Bracket | Male | Female |
| Under 5 Years | 327 (6.4%) | 300 (6.0%) |
| 5 to 9 Years | 342 (6.7%) | 280 (5.6%) |
| 10 to 14 Years | 367 (7.1%) | 405 (8.1%) |
| 15 to 19 Years | 367 (7.1%) | 444 (8.8%) |
| 20 to 24 Years | 303 (5.9%) | 256 (5.1%) |
| 25 to 29 Years | 310 (6.0%) | 285 (5.7%) |
| 30 to 34 Years | 329 (6.4%) | 299 (5.9%) |
| 35 to 39 Years | 315 (6.1%) | 277 (5.5%) |
| 40 to 44 Years | 252 (4.9%) | 275 (5.5%) |
| 45 to 49 Years | 291 (5.7%) | 371 (7.4%) |
| 50 to 54 Years | 355 (6.9%) | 262 (5.2%) |
| 55 to 59 Years | 281 (5.5%) | 324 (6.5%) |
| 60 to 64 Years | 375 (7.3%) | 314 (6.2%) |
| 65 to 69 Years | 337 (6.6%) | 258 (5.1%) |
| 70 to 74 Years | 197 (3.8%) | 284 (5.7%) |
| 75 to 79 Years | 195 (3.8%) | 165 (3.3%) |
| 80 to 84 Years | 127 (2.5%) | 139 (2.8%) |
| 85 Years and over | 67 (1.3%) | 83 (1.7%) |
| Total | 5,137 (100.0%) | 5,021 (100.0%) |
Families and Households in Love County
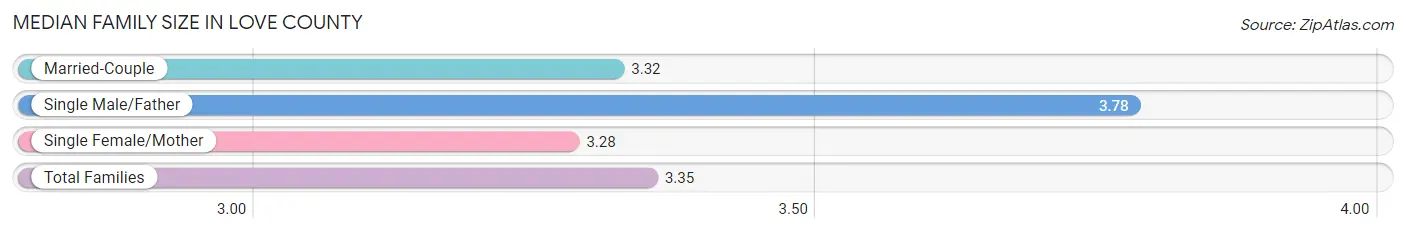
Median Family Size in Love County
The median family size in Love County is 3.35 persons per family, with single male/father families (174 | 7.0%) accounting for the largest median family size of 3.78 persons per family. On the other hand, single female/mother families (362 | 14.6%) represent the smallest median family size with 3.28 persons per family.
| Family Type | # Families | Family Size |
| Married-Couple | 1,940 (78.3%) | 3.32 |
| Single Male/Father | 174 (7.0%) | 3.78 |
| Single Female/Mother | 362 (14.6%) | 3.28 |
| Total Families | 2,476 (100.0%) | 3.35 |
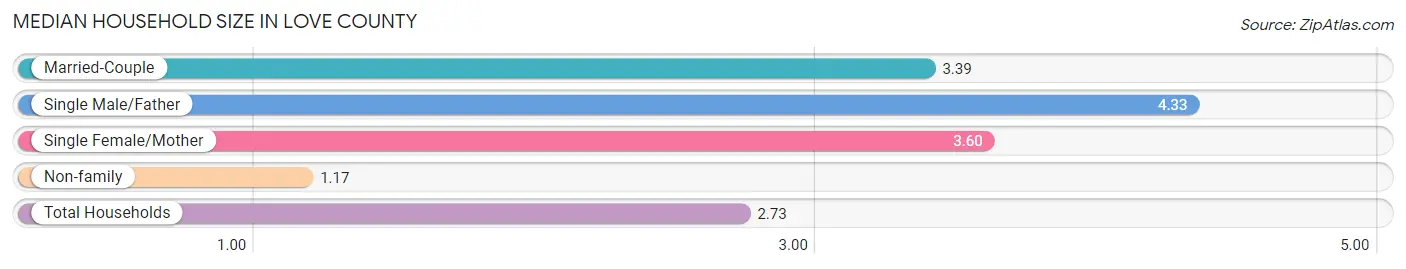
Median Household Size in Love County
The median household size in Love County is 2.73 persons per household, with single male/father households (174 | 4.7%) accounting for the largest median household size of 4.33 persons per household. non-family households (1,210 | 32.8%) represent the smallest median household size with 1.17 persons per household.
| Household Type | # Households | Household Size |
| Married-Couple | 1,940 (52.6%) | 3.39 |
| Single Male/Father | 174 (4.7%) | 4.33 |
| Single Female/Mother | 362 (9.8%) | 3.60 |
| Non-family | 1,210 (32.8%) | 1.17 |
| Total Households | 3,686 (100.0%) | 2.73 |
Household Size by Marriage Status in Love County
Out of a total of 3,686 households in Love County, 2,476 (67.2%) are family households, while 1,210 (32.8%) are nonfamily households. The most numerous type of family households are 2-person households, comprising 1,144, and the most common type of nonfamily households are 1-person households, comprising 1,033.
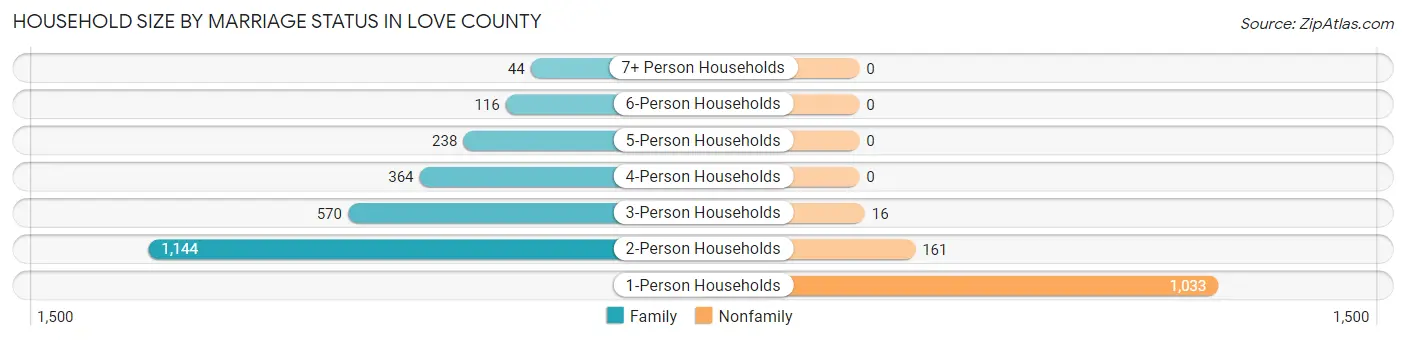
| Household Size | Family Households | Nonfamily Households |
| 1-Person Households | - | 1,033 (28.0%) |
| 2-Person Households | 1,144 (31.0%) | 161 (4.4%) |
| 3-Person Households | 570 (15.5%) | 16 (0.4%) |
| 4-Person Households | 364 (9.9%) | 0 (0.0%) |
| 5-Person Households | 238 (6.5%) | 0 (0.0%) |
| 6-Person Households | 116 (3.2%) | 0 (0.0%) |
| 7+ Person Households | 44 (1.2%) | 0 (0.0%) |
| Total | 2,476 (67.2%) | 1,210 (32.8%) |
Female Fertility in Love County
Fertility by Age in Love County
Average fertility rate in Love County is 43.0 births per 1,000 women. Women in the age bracket of 20 to 34 years have the highest fertility rate with 100.0 births per 1,000 women. Women in the age bracket of 20 to 34 years acount for 84.9% of all women with births.
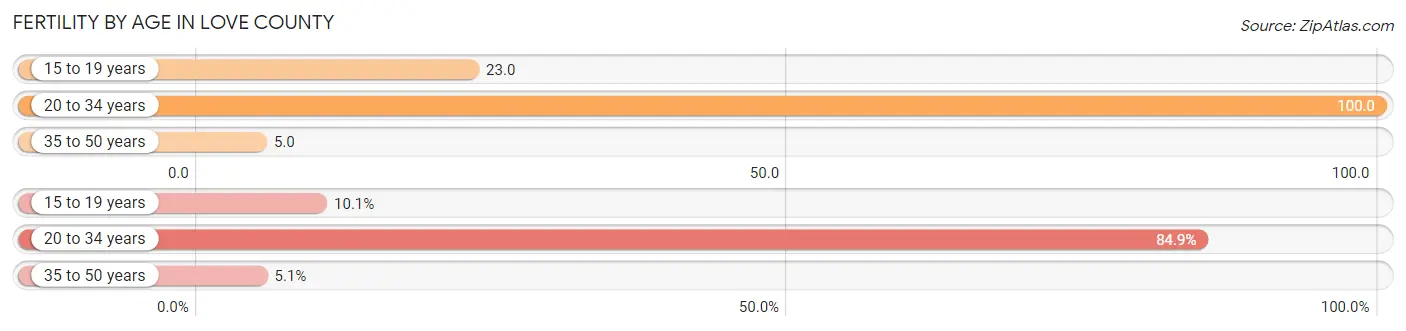
| Age Bracket | Women with Births | Births / 1,000 Women |
| 15 to 19 years | 10 (10.1%) | 23.0 |
| 20 to 34 years | 84 (84.9%) | 100.0 |
| 35 to 50 years | 5 (5.1%) | 5.0 |
| Total | 99 (100.0%) | 43.0 |
Fertility by Age by Marriage Status in Love County
60.6% of women with births (99) in Love County are married. The highest percentage of unmarried women with births falls into 15 to 19 years age bracket with 100.0% of them unmarried at the time of birth, while the lowest percentage of unmarried women with births belong to 20 to 34 years age bracket with 28.6% of them unmarried.
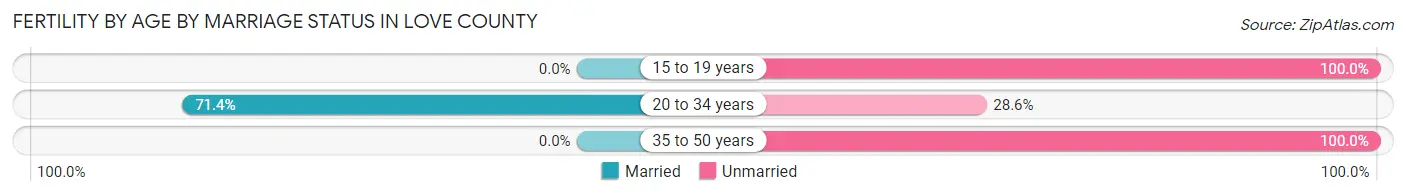
| Age Bracket | Married | Unmarried |
| 15 to 19 years | 0 (0.0%) | 10 (100.0%) |
| 20 to 34 years | 60 (71.4%) | 24 (28.6%) |
| 35 to 50 years | 0 (0.0%) | 5 (100.0%) |
| Total | 60 (60.6%) | 39 (39.4%) |
Fertility by Education in Love County
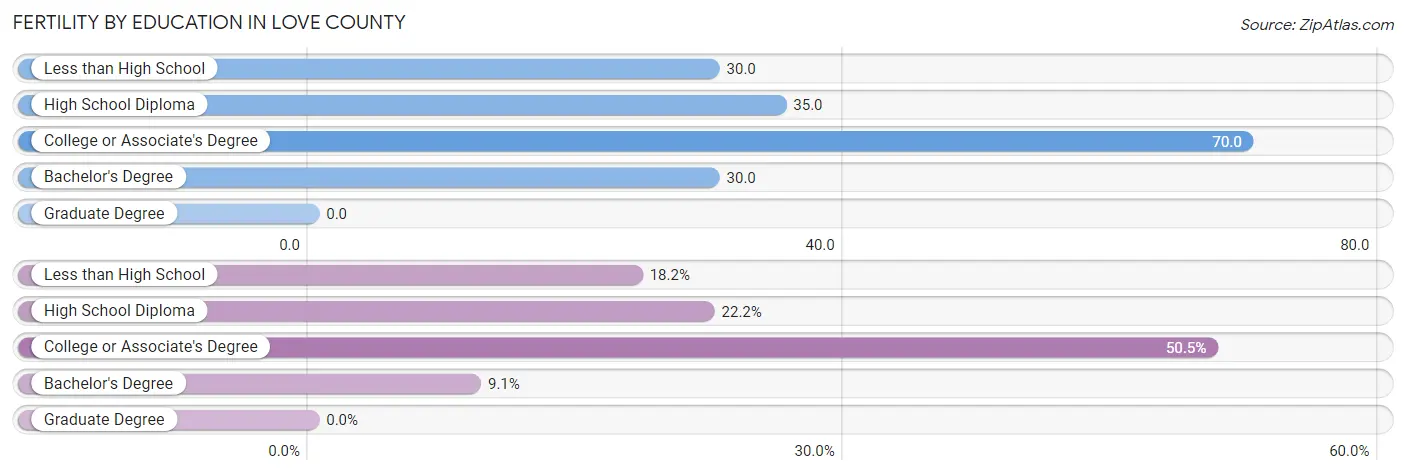
| Educational Attainment | Women with Births | Births / 1,000 Women |
| Less than High School | 18 (18.2%) | 30.0 |
| High School Diploma | 22 (22.2%) | 35.0 |
| College or Associate's Degree | 50 (50.5%) | 70.0 |
| Bachelor's Degree | 9 (9.1%) | 30.0 |
| Graduate Degree | 0 (0.0%) | 0.0 |
| Total | 99 (100.0%) | 43.0 |
Fertility by Education by Marriage Status in Love County
39.4% of women with births in Love County are unmarried. Women with the educational attainment of bachelor's degree are most likely to be married with 100.0% of them married at childbirth, while women with the educational attainment of less than high school are least likely to be married with 100.0% of them unmarried at childbirth.
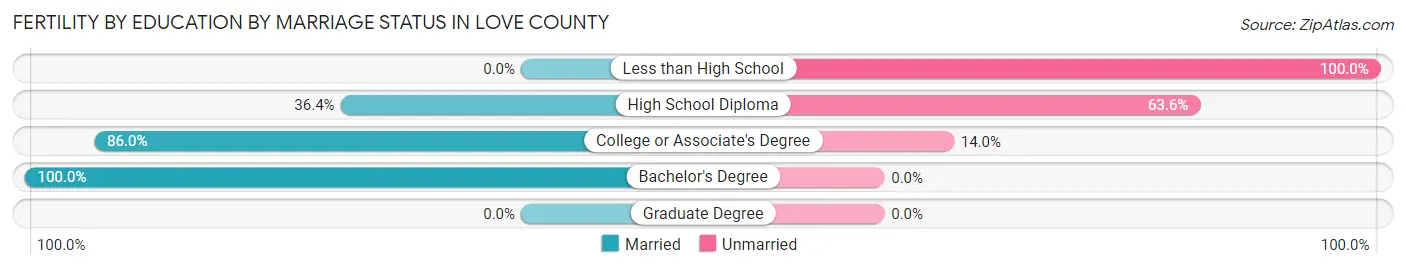
| Educational Attainment | Married | Unmarried |
| Less than High School | 0 (0.0%) | 18 (100.0%) |
| High School Diploma | 8 (36.4%) | 14 (63.6%) |
| College or Associate's Degree | 43 (86.0%) | 7 (14.0%) |
| Bachelor's Degree | 9 (100.0%) | 0 (0.0%) |
| Graduate Degree | 0 (0.0%) | 0 (0.0%) |
| Total | 60 (60.6%) | 39 (39.4%) |
Employment Characteristics in Love County
Employment by Class of Employer in Love County
Among the 4,203 employed individuals in Love County, private company employees (2,870 | 68.3%), self-employed (not incorporated) (316 | 7.5%), and local government employees (315 | 7.5%) make up the most common classes of employment.
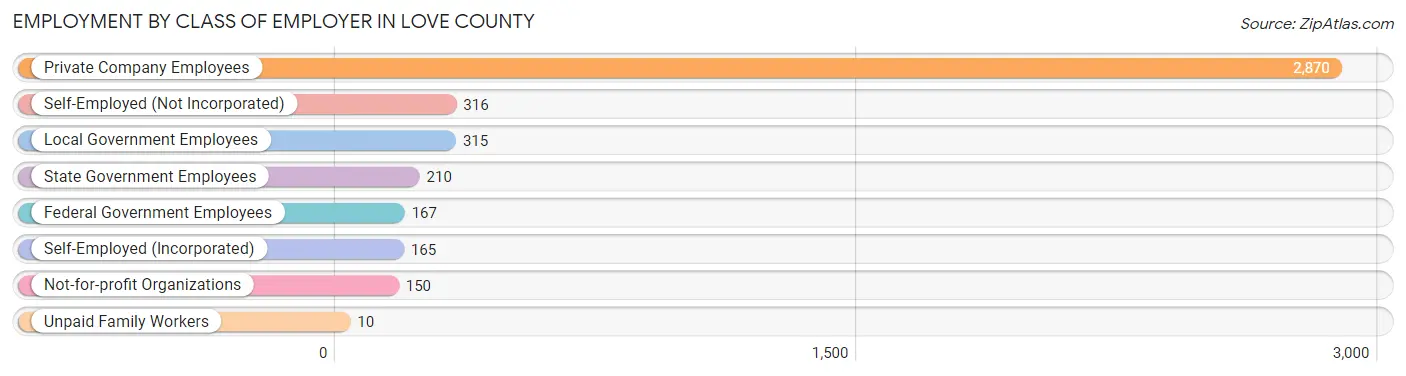
| Employer Class | # Employees | % Employees |
| Private Company Employees | 2,870 | 68.3% |
| Self-Employed (Incorporated) | 165 | 3.9% |
| Self-Employed (Not Incorporated) | 316 | 7.5% |
| Not-for-profit Organizations | 150 | 3.6% |
| Local Government Employees | 315 | 7.5% |
| State Government Employees | 210 | 5.0% |
| Federal Government Employees | 167 | 4.0% |
| Unpaid Family Workers | 10 | 0.2% |
| Total | 4,203 | 100.0% |
Employment Status by Age in Love County
According to the labor force statistics for Love County, out of the total population over 16 years of age (7,967), 58.3% or 4,645 individuals are in the labor force, with 5.4% or 251 of them unemployed. The age group with the highest labor force participation rate is 25 to 29 years, with 86.2% or 513 individuals in the labor force. Within the labor force, the 16 to 19 years age range has the highest percentage of unemployed individuals, with 26.5% or 50 of them being unemployed.
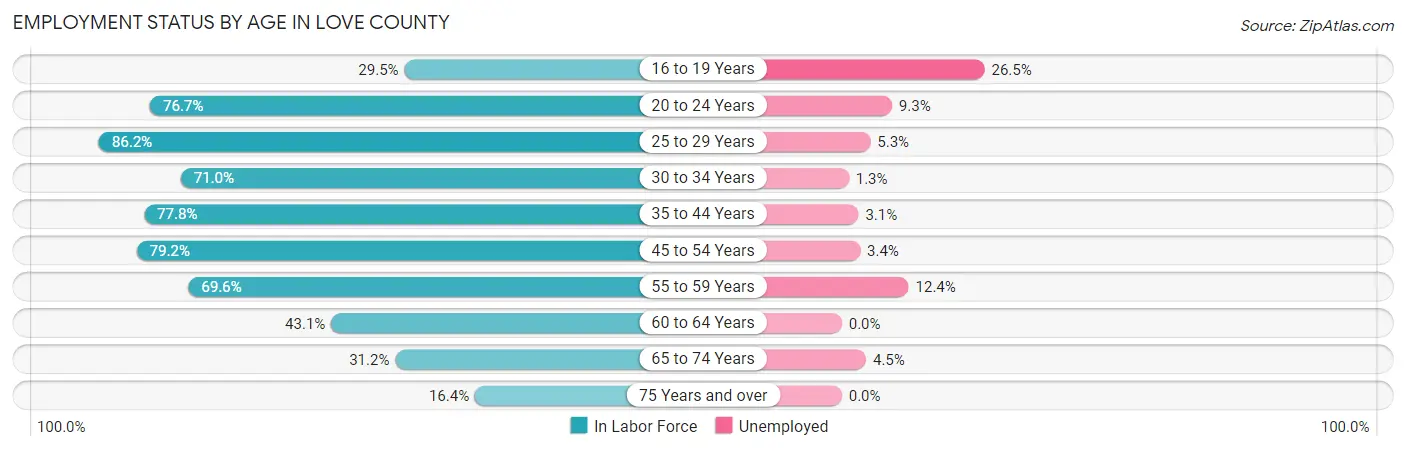
| Age Bracket | In Labor Force | Unemployed |
| 16 to 19 Years | 189 (29.5%) | 50 (26.5%) |
| 20 to 24 Years | 429 (76.7%) | 40 (9.3%) |
| 25 to 29 Years | 513 (86.2%) | 27 (5.3%) |
| 30 to 34 Years | 446 (71.0%) | 6 (1.3%) |
| 35 to 44 Years | 871 (77.8%) | 27 (3.1%) |
| 45 to 54 Years | 1,013 (79.2%) | 34 (3.4%) |
| 55 to 59 Years | 421 (69.6%) | 52 (12.4%) |
| 60 to 64 Years | 297 (43.1%) | 0 (0.0%) |
| 65 to 74 Years | 336 (31.2%) | 15 (4.5%) |
| 75 Years and over | 127 (16.4%) | 0 (0.0%) |
| Total | 4,645 (58.3%) | 251 (5.4%) |
Employment Status by Educational Attainment in Love County
According to labor force statistics for Love County, 72.5% of individuals (3,563) out of the total population between 25 and 64 years of age (4,915) are in the labor force, with 4.1% or 146 of them being unemployed. The group with the highest labor force participation rate are those with the educational attainment of bachelor's degree or higher, with 84.7% or 605 individuals in the labor force. Within the labor force, individuals with college / associate degree education have the highest percentage of unemployment, with 5.0% or 59 of them being unemployed.
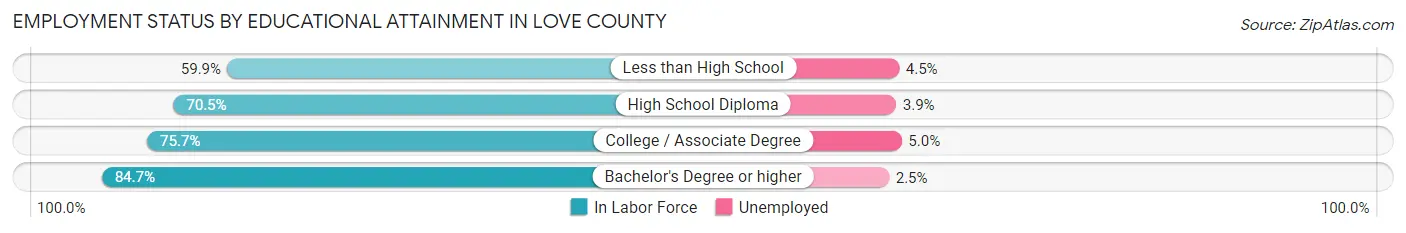
| Educational Attainment | In Labor Force | Unemployed |
| Less than High School | 485 (59.9%) | 36 (4.5%) |
| High School Diploma | 1,292 (70.5%) | 71 (3.9%) |
| College / Associate Degree | 1,180 (75.7%) | 78 (5.0%) |
| Bachelor's Degree or higher | 605 (84.7%) | 18 (2.5%) |
| Total | 3,563 (72.5%) | 202 (4.1%) |
Employment Occupations by Sex in Love County
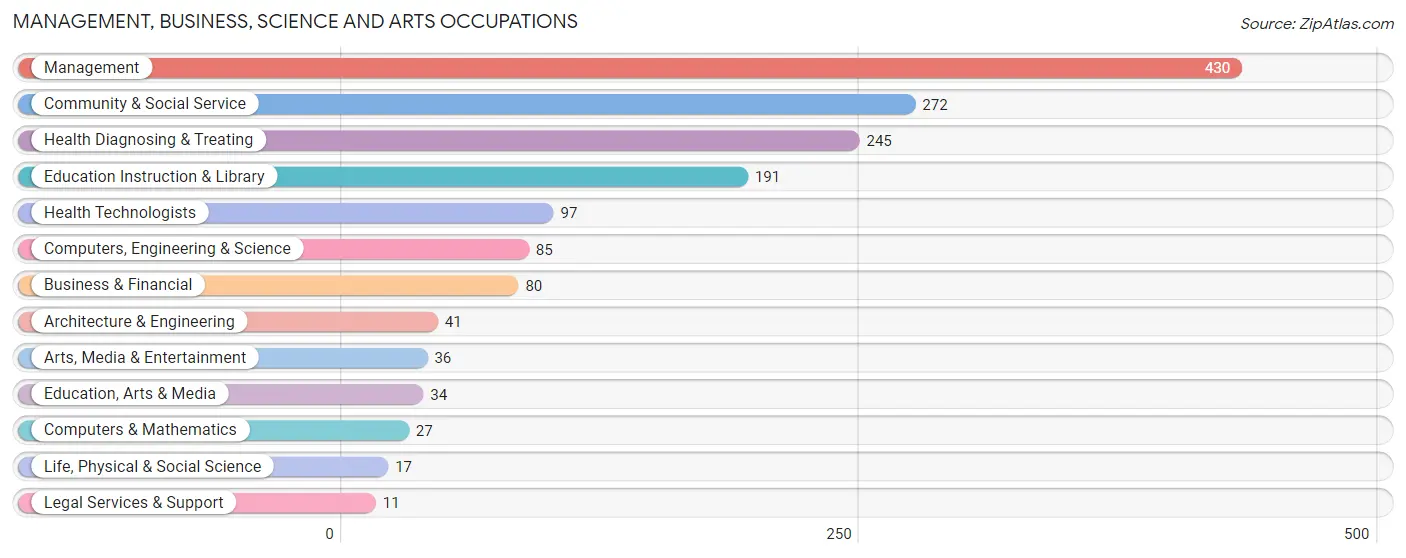
Management, Business, Science and Arts Occupations
The most common Management, Business, Science and Arts occupations in Love County are Management (430 | 9.8%), Community & Social Service (272 | 6.2%), Health Diagnosing & Treating (245 | 5.6%), Education Instruction & Library (191 | 4.4%), and Health Technologists (97 | 2.2%).
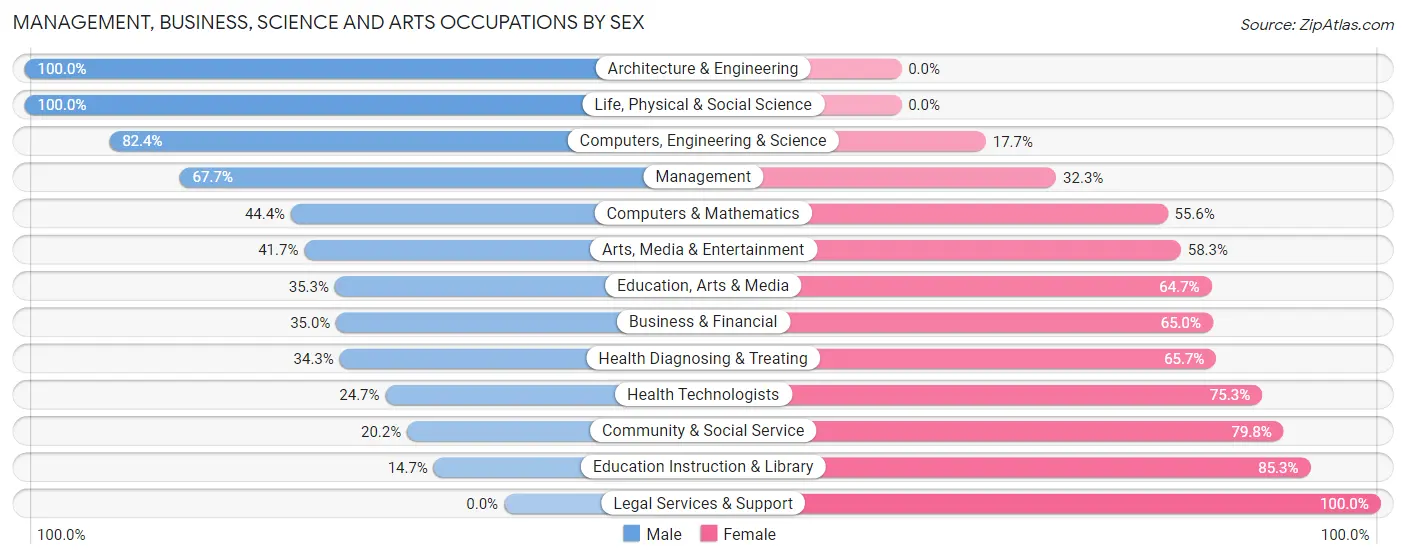
Management, Business, Science and Arts Occupations by Sex
Within the Management, Business, Science and Arts occupations in Love County, the most male-oriented occupations are Architecture & Engineering (100.0%), Life, Physical & Social Science (100.0%), and Computers, Engineering & Science (82.4%), while the most female-oriented occupations are Legal Services & Support (100.0%), Education Instruction & Library (85.3%), and Community & Social Service (79.8%).
| Occupation | Male | Female |
| Management | 291 (67.7%) | 139 (32.3%) |
| Business & Financial | 28 (35.0%) | 52 (65.0%) |
| Computers, Engineering & Science | 70 (82.4%) | 15 (17.6%) |
| Computers & Mathematics | 12 (44.4%) | 15 (55.6%) |
| Architecture & Engineering | 41 (100.0%) | 0 (0.0%) |
| Life, Physical & Social Science | 17 (100.0%) | 0 (0.0%) |
| Community & Social Service | 55 (20.2%) | 217 (79.8%) |
| Education, Arts & Media | 12 (35.3%) | 22 (64.7%) |
| Legal Services & Support | 0 (0.0%) | 11 (100.0%) |
| Education Instruction & Library | 28 (14.7%) | 163 (85.3%) |
| Arts, Media & Entertainment | 15 (41.7%) | 21 (58.3%) |
| Health Diagnosing & Treating | 84 (34.3%) | 161 (65.7%) |
| Health Technologists | 24 (24.7%) | 73 (75.3%) |
| Total (Category) | 528 (47.5%) | 584 (52.5%) |
| Total (Overall) | 2,377 (54.2%) | 2,006 (45.8%) |
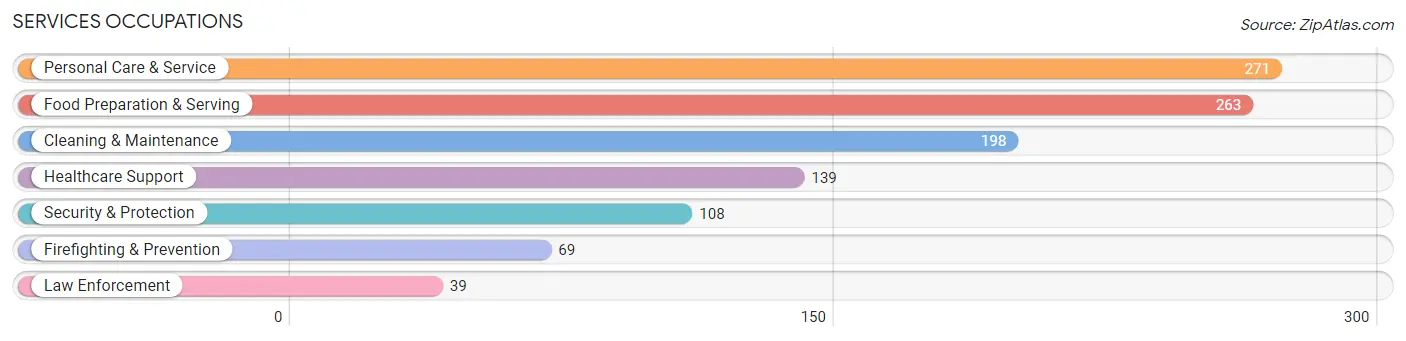
Services Occupations
The most common Services occupations in Love County are Personal Care & Service (271 | 6.2%), Food Preparation & Serving (263 | 6.0%), Cleaning & Maintenance (198 | 4.5%), Healthcare Support (139 | 3.2%), and Security & Protection (108 | 2.5%).
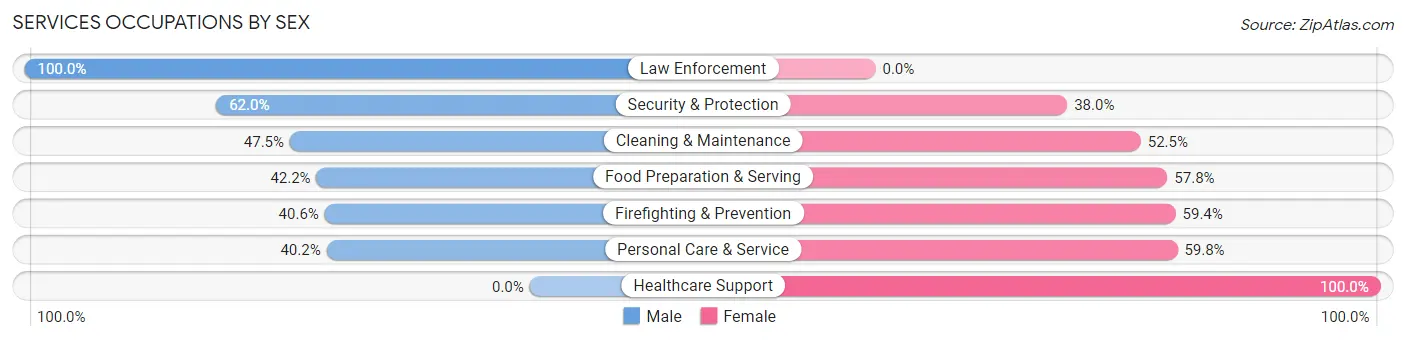
Services Occupations by Sex
Within the Services occupations in Love County, the most male-oriented occupations are Law Enforcement (100.0%), Security & Protection (62.0%), and Cleaning & Maintenance (47.5%), while the most female-oriented occupations are Healthcare Support (100.0%), Personal Care & Service (59.8%), and Firefighting & Prevention (59.4%).
| Occupation | Male | Female |
| Healthcare Support | 0 (0.0%) | 139 (100.0%) |
| Security & Protection | 67 (62.0%) | 41 (38.0%) |
| Firefighting & Prevention | 28 (40.6%) | 41 (59.4%) |
| Law Enforcement | 39 (100.0%) | 0 (0.0%) |
| Food Preparation & Serving | 111 (42.2%) | 152 (57.8%) |
| Cleaning & Maintenance | 94 (47.5%) | 104 (52.5%) |
| Personal Care & Service | 109 (40.2%) | 162 (59.8%) |
| Total (Category) | 381 (38.9%) | 598 (61.1%) |
| Total (Overall) | 2,377 (54.2%) | 2,006 (45.8%) |
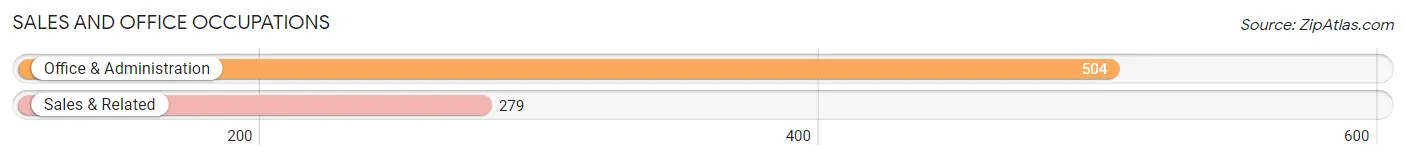
Sales and Office Occupations
The most common Sales and Office occupations in Love County are Office & Administration (504 | 11.5%), and Sales & Related (279 | 6.4%).
Sales and Office Occupations by Sex
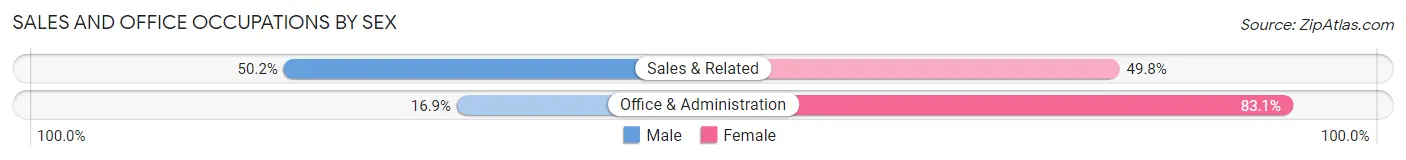
| Occupation | Male | Female |
| Sales & Related | 140 (50.2%) | 139 (49.8%) |
| Office & Administration | 85 (16.9%) | 419 (83.1%) |
| Total (Category) | 225 (28.7%) | 558 (71.3%) |
| Total (Overall) | 2,377 (54.2%) | 2,006 (45.8%) |
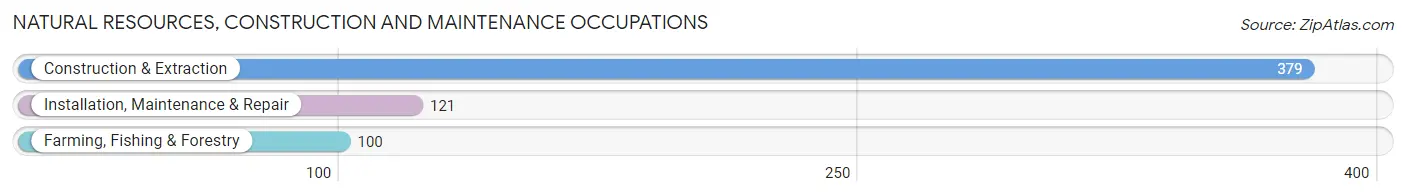
Natural Resources, Construction and Maintenance Occupations
The most common Natural Resources, Construction and Maintenance occupations in Love County are Construction & Extraction (379 | 8.6%), Installation, Maintenance & Repair (121 | 2.8%), and Farming, Fishing & Forestry (100 | 2.3%).
Natural Resources, Construction and Maintenance Occupations by Sex
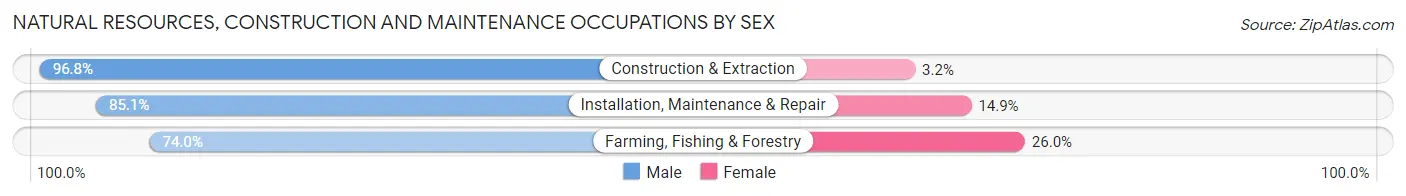
| Occupation | Male | Female |
| Farming, Fishing & Forestry | 74 (74.0%) | 26 (26.0%) |
| Construction & Extraction | 367 (96.8%) | 12 (3.2%) |
| Installation, Maintenance & Repair | 103 (85.1%) | 18 (14.9%) |
| Total (Category) | 544 (90.7%) | 56 (9.3%) |
| Total (Overall) | 2,377 (54.2%) | 2,006 (45.8%) |
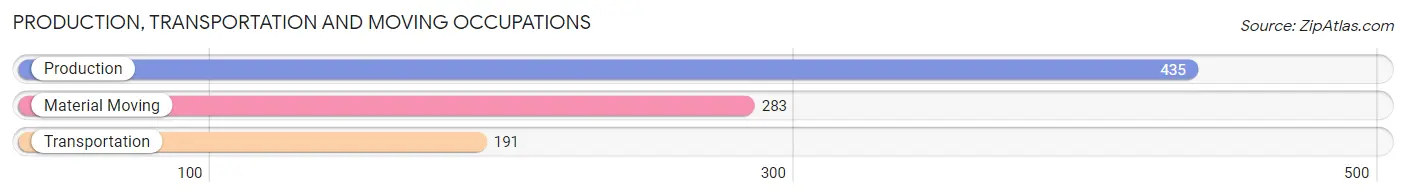
Production, Transportation and Moving Occupations
The most common Production, Transportation and Moving occupations in Love County are Production (435 | 9.9%), Material Moving (283 | 6.5%), and Transportation (191 | 4.4%).
Production, Transportation and Moving Occupations by Sex
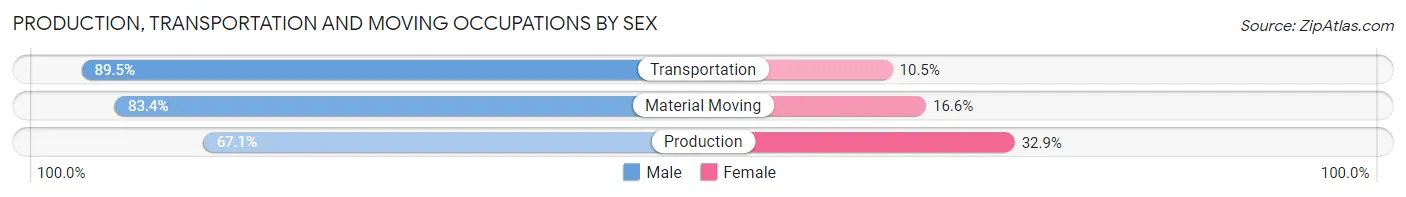
| Occupation | Male | Female |
| Production | 292 (67.1%) | 143 (32.9%) |
| Transportation | 171 (89.5%) | 20 (10.5%) |
| Material Moving | 236 (83.4%) | 47 (16.6%) |
| Total (Category) | 699 (76.9%) | 210 (23.1%) |
| Total (Overall) | 2,377 (54.2%) | 2,006 (45.8%) |
Employment Industries by Sex in Love County
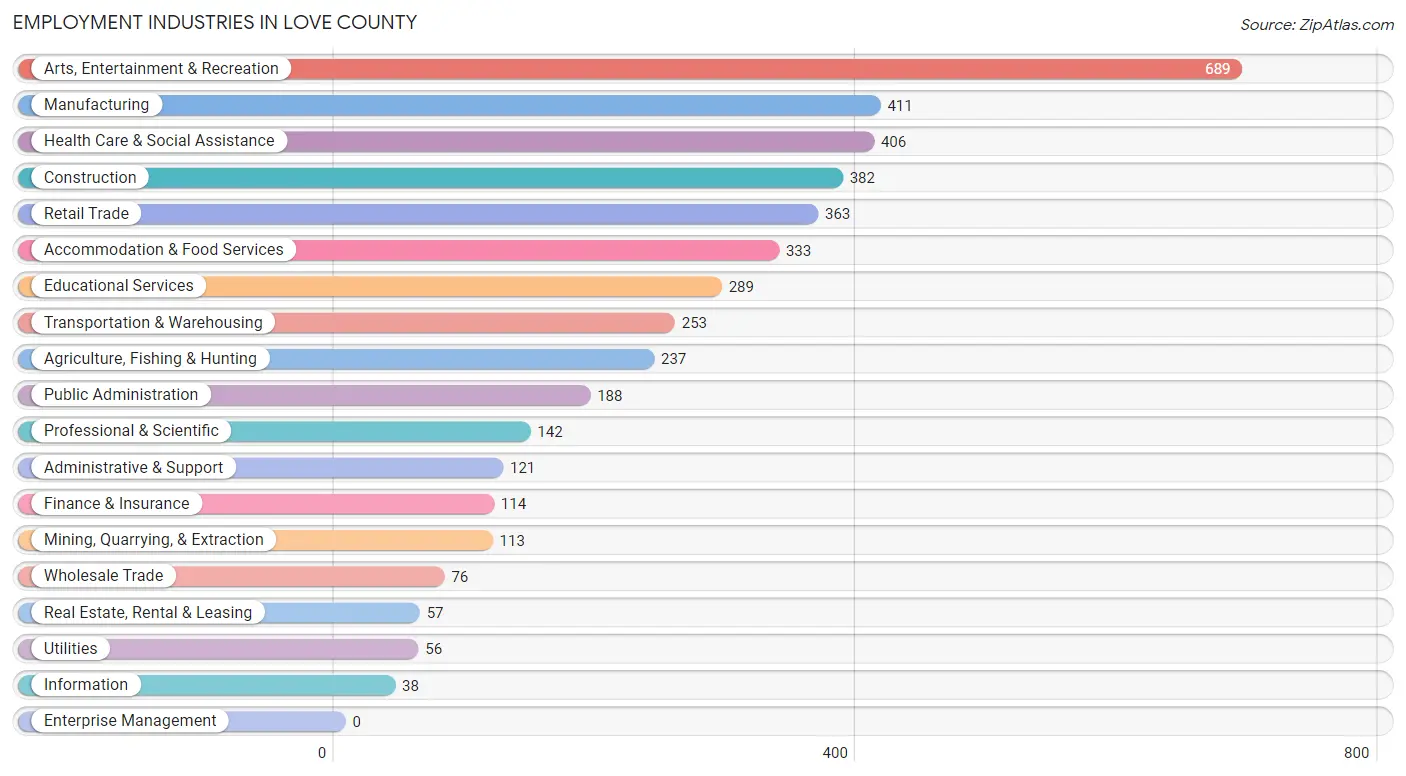
Employment Industries in Love County
The major employment industries in Love County include Arts, Entertainment & Recreation (689 | 15.7%), Manufacturing (411 | 9.4%), Health Care & Social Assistance (406 | 9.3%), Construction (382 | 8.7%), and Retail Trade (363 | 8.3%).
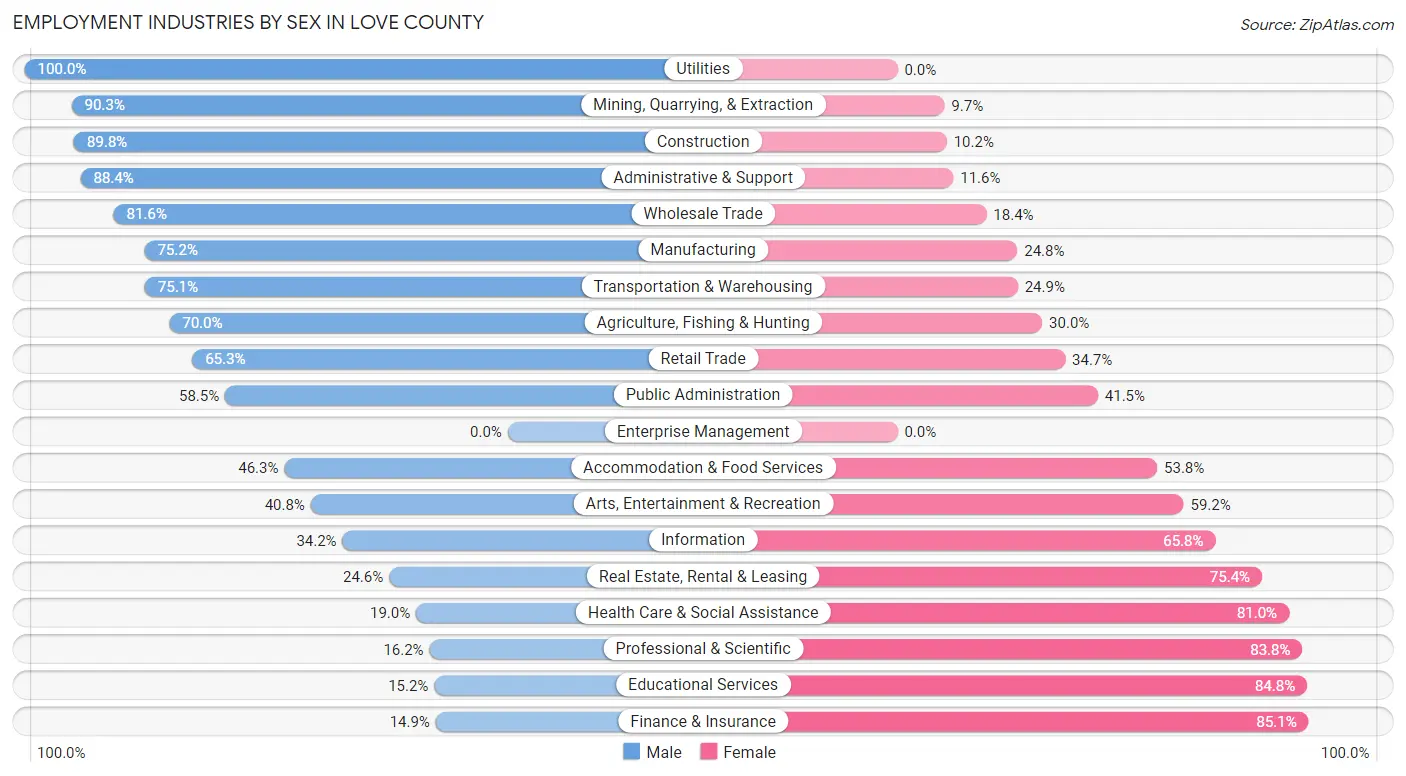
Employment Industries by Sex in Love County
The Love County industries that see more men than women are Utilities (100.0%), Mining, Quarrying, & Extraction (90.3%), and Construction (89.8%), whereas the industries that tend to have a higher number of women are Finance & Insurance (85.1%), Educational Services (84.8%), and Professional & Scientific (83.8%).
| Industry | Male | Female |
| Agriculture, Fishing & Hunting | 166 (70.0%) | 71 (30.0%) |
| Mining, Quarrying, & Extraction | 102 (90.3%) | 11 (9.7%) |
| Construction | 343 (89.8%) | 39 (10.2%) |
| Manufacturing | 309 (75.2%) | 102 (24.8%) |
| Wholesale Trade | 62 (81.6%) | 14 (18.4%) |
| Retail Trade | 237 (65.3%) | 126 (34.7%) |
| Transportation & Warehousing | 190 (75.1%) | 63 (24.9%) |
| Utilities | 56 (100.0%) | 0 (0.0%) |
| Information | 13 (34.2%) | 25 (65.8%) |
| Finance & Insurance | 17 (14.9%) | 97 (85.1%) |
| Real Estate, Rental & Leasing | 14 (24.6%) | 43 (75.4%) |
| Professional & Scientific | 23 (16.2%) | 119 (83.8%) |
| Enterprise Management | 0 (0.0%) | 0 (0.0%) |
| Administrative & Support | 107 (88.4%) | 14 (11.6%) |
| Educational Services | 44 (15.2%) | 245 (84.8%) |
| Health Care & Social Assistance | 77 (19.0%) | 329 (81.0%) |
| Arts, Entertainment & Recreation | 281 (40.8%) | 408 (59.2%) |
| Accommodation & Food Services | 154 (46.3%) | 179 (53.7%) |
| Public Administration | 110 (58.5%) | 78 (41.5%) |
| Total | 2,377 (54.2%) | 2,006 (45.8%) |
Education in Love County
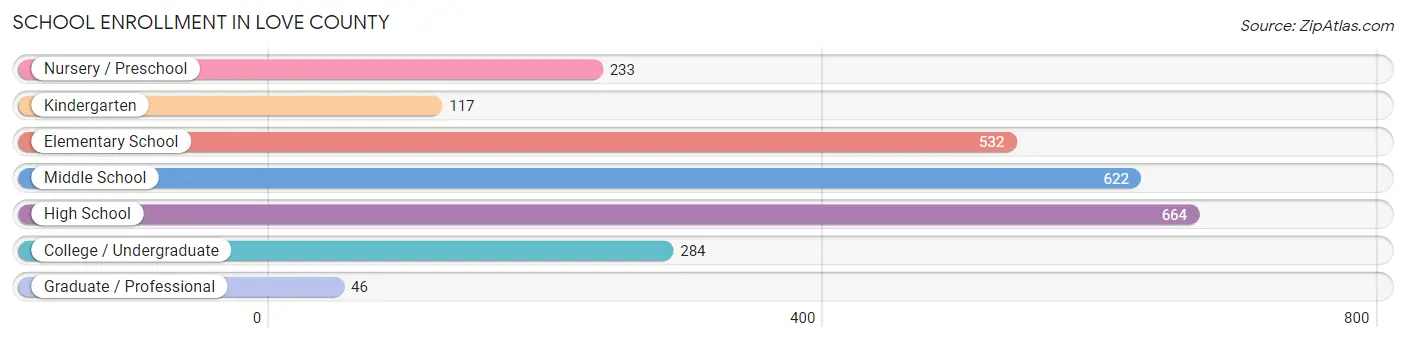
School Enrollment in Love County
The most common levels of schooling among the 2,498 students in Love County are high school (664 | 26.6%), middle school (622 | 24.9%), and elementary school (532 | 21.3%).
| School Level | # Students | % Students |
| Nursery / Preschool | 233 | 9.3% |
| Kindergarten | 117 | 4.7% |
| Elementary School | 532 | 21.3% |
| Middle School | 622 | 24.9% |
| High School | 664 | 26.6% |
| College / Undergraduate | 284 | 11.4% |
| Graduate / Professional | 46 | 1.8% |
| Total | 2,498 | 100.0% |
School Enrollment by Age by Funding Source in Love County
Out of a total of 2,498 students who are enrolled in schools in Love County, 130 (5.2%) attend a private institution, while the remaining 2,368 (94.8%) are enrolled in public schools. The age group of 3 to 4 year olds has the highest likelihood of being enrolled in private schools, with 17 (12.0% in the age bracket) enrolled. Conversely, the age group of 25 to 34 year olds has the lowest likelihood of being enrolled in a private school, with 93 (100.0% in the age bracket) attending a public institution.

| Age Bracket | Public School | Private School |
| 3 to 4 Year Olds | 125 (88.0%) | 17 (12.0%) |
| 5 to 9 Year Old | 572 (95.5%) | 27 (4.5%) |
| 10 to 14 Year Olds | 721 (94.5%) | 42 (5.5%) |
| 15 to 17 Year Olds | 429 (95.6%) | 20 (4.4%) |
| 18 to 19 Year Olds | 242 (92.0%) | 21 (8.0%) |
| 20 to 24 Year Olds | 81 (96.4%) | 3 (3.6%) |
| 25 to 34 Year Olds | 93 (100.0%) | 0 (0.0%) |
| 35 Years and over | 105 (100.0%) | 0 (0.0%) |
| Total | 2,368 (94.8%) | 130 (5.2%) |
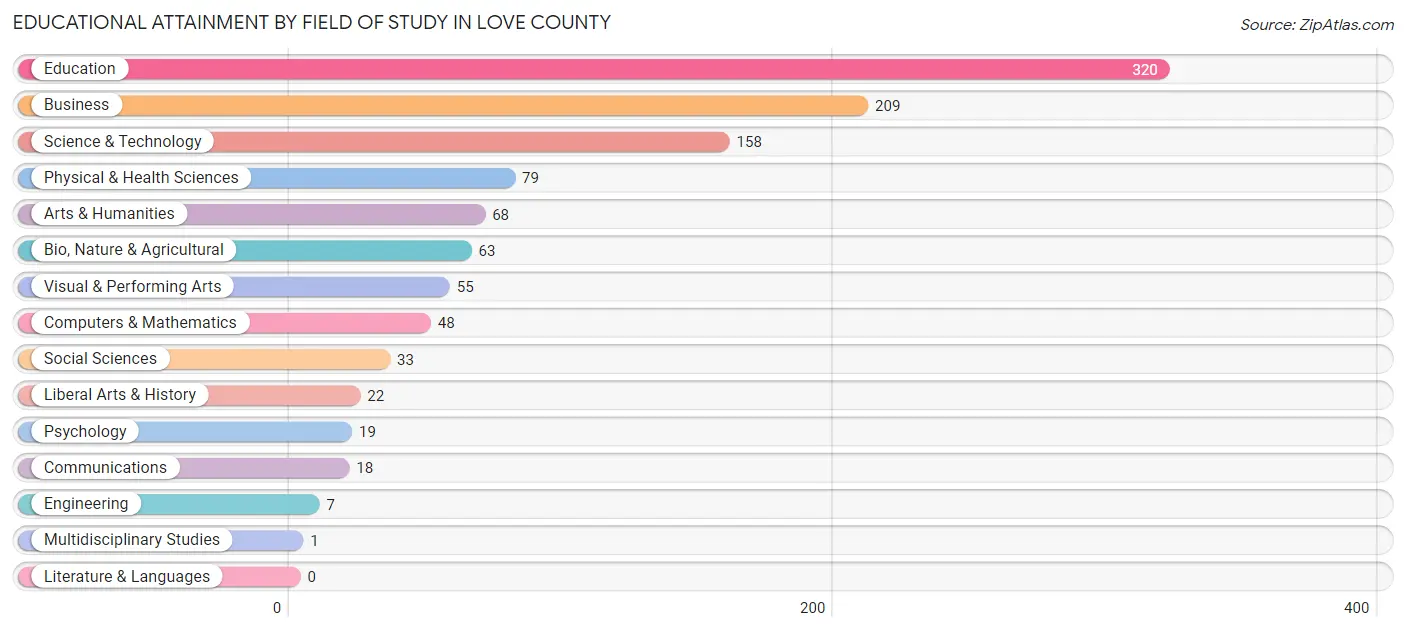
Educational Attainment by Field of Study in Love County
Education (320 | 29.1%), business (209 | 19.0%), science & technology (158 | 14.4%), physical & health sciences (79 | 7.2%), and arts & humanities (68 | 6.2%) are the most common fields of study among 1,100 individuals in Love County who have obtained a bachelor's degree or higher.
| Field of Study | # Graduates | % Graduates |
| Computers & Mathematics | 48 | 4.4% |
| Bio, Nature & Agricultural | 63 | 5.7% |
| Physical & Health Sciences | 79 | 7.2% |
| Psychology | 19 | 1.7% |
| Social Sciences | 33 | 3.0% |
| Engineering | 7 | 0.6% |
| Multidisciplinary Studies | 1 | 0.1% |
| Science & Technology | 158 | 14.4% |
| Business | 209 | 19.0% |
| Education | 320 | 29.1% |
| Literature & Languages | 0 | 0.0% |
| Liberal Arts & History | 22 | 2.0% |
| Visual & Performing Arts | 55 | 5.0% |
| Communications | 18 | 1.6% |
| Arts & Humanities | 68 | 6.2% |
| Total | 1,100 | 100.0% |
Transportation & Commute in Love County
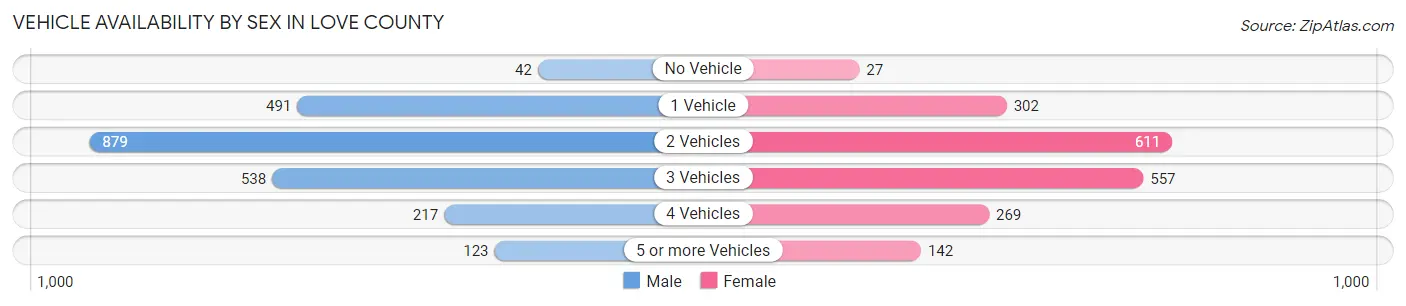
Vehicle Availability by Sex in Love County
The most prevalent vehicle ownership categories in Love County are males with 2 vehicles (879, accounting for 38.4%) and females with 2 vehicles (611, making up 46.1%).
| Vehicles Available | Male | Female |
| No Vehicle | 42 (1.8%) | 27 (1.4%) |
| 1 Vehicle | 491 (21.4%) | 302 (15.8%) |
| 2 Vehicles | 879 (38.4%) | 611 (32.0%) |
| 3 Vehicles | 538 (23.5%) | 557 (29.2%) |
| 4 Vehicles | 217 (9.5%) | 269 (14.1%) |
| 5 or more Vehicles | 123 (5.4%) | 142 (7.4%) |
| Total | 2,290 (100.0%) | 1,908 (100.0%) |
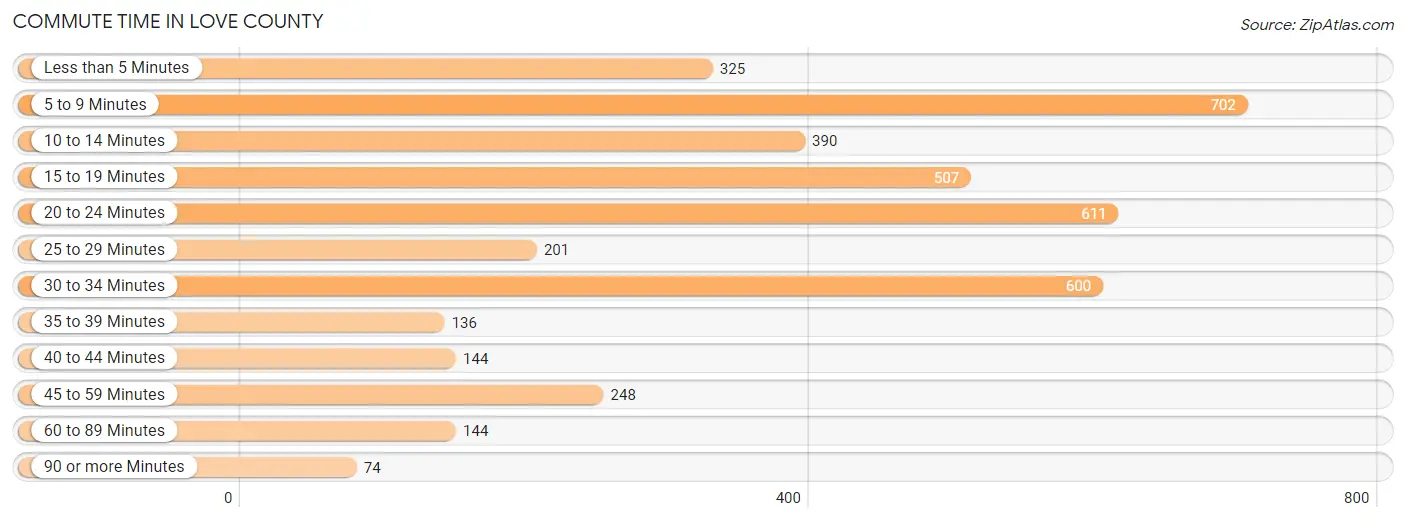
Commute Time in Love County
The most frequently occuring commute durations in Love County are 5 to 9 minutes (702 commuters, 17.2%), 20 to 24 minutes (611 commuters, 15.0%), and 30 to 34 minutes (600 commuters, 14.7%).
| Commute Time | # Commuters | % Commuters |
| Less than 5 Minutes | 325 | 8.0% |
| 5 to 9 Minutes | 702 | 17.2% |
| 10 to 14 Minutes | 390 | 9.6% |
| 15 to 19 Minutes | 507 | 12.4% |
| 20 to 24 Minutes | 611 | 15.0% |
| 25 to 29 Minutes | 201 | 4.9% |
| 30 to 34 Minutes | 600 | 14.7% |
| 35 to 39 Minutes | 136 | 3.3% |
| 40 to 44 Minutes | 144 | 3.5% |
| 45 to 59 Minutes | 248 | 6.1% |
| 60 to 89 Minutes | 144 | 3.5% |
| 90 or more Minutes | 74 | 1.8% |
Commute Time by Sex in Love County
The most common commute times in Love County are 30 to 34 minutes (390 commuters, 17.4%) for males and 20 to 24 minutes (322 commuters, 17.4%) for females.
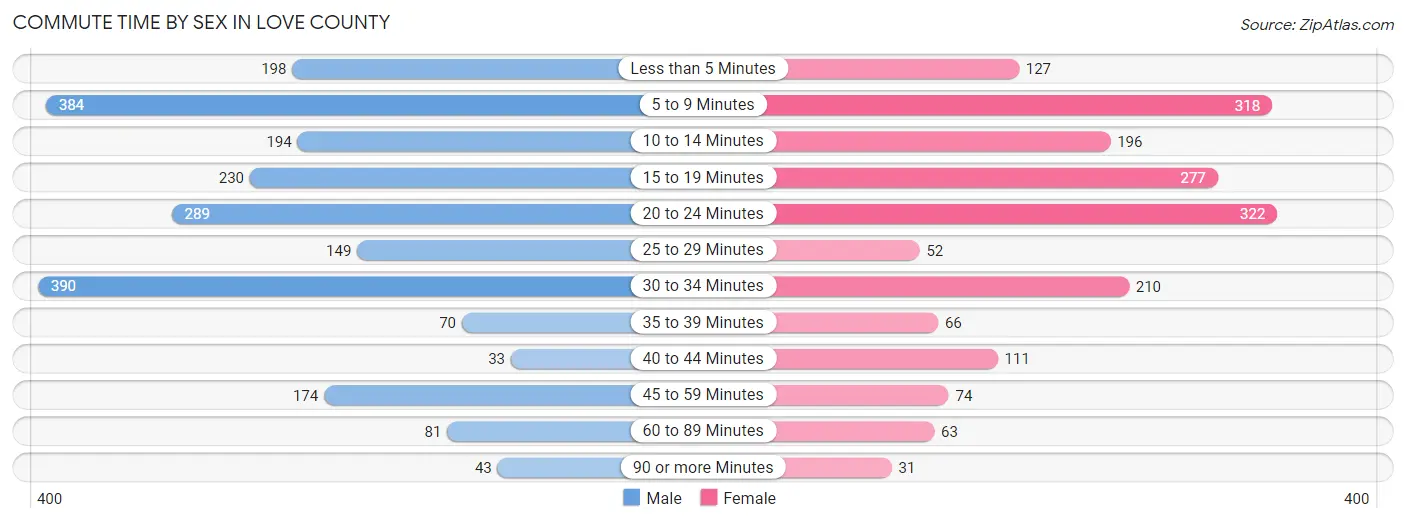
| Commute Time | Male | Female |
| Less than 5 Minutes | 198 (8.9%) | 127 (6.9%) |
| 5 to 9 Minutes | 384 (17.2%) | 318 (17.2%) |
| 10 to 14 Minutes | 194 (8.7%) | 196 (10.6%) |
| 15 to 19 Minutes | 230 (10.3%) | 277 (15.0%) |
| 20 to 24 Minutes | 289 (12.9%) | 322 (17.4%) |
| 25 to 29 Minutes | 149 (6.7%) | 52 (2.8%) |
| 30 to 34 Minutes | 390 (17.4%) | 210 (11.4%) |
| 35 to 39 Minutes | 70 (3.1%) | 66 (3.6%) |
| 40 to 44 Minutes | 33 (1.5%) | 111 (6.0%) |
| 45 to 59 Minutes | 174 (7.8%) | 74 (4.0%) |
| 60 to 89 Minutes | 81 (3.6%) | 63 (3.4%) |
| 90 or more Minutes | 43 (1.9%) | 31 (1.7%) |
Time of Departure to Work by Sex in Love County
The most frequent times of departure to work in Love County are 6:00 AM to 6:29 AM (330, 14.8%) for males and 7:30 AM to 7:59 AM (371, 20.1%) for females.
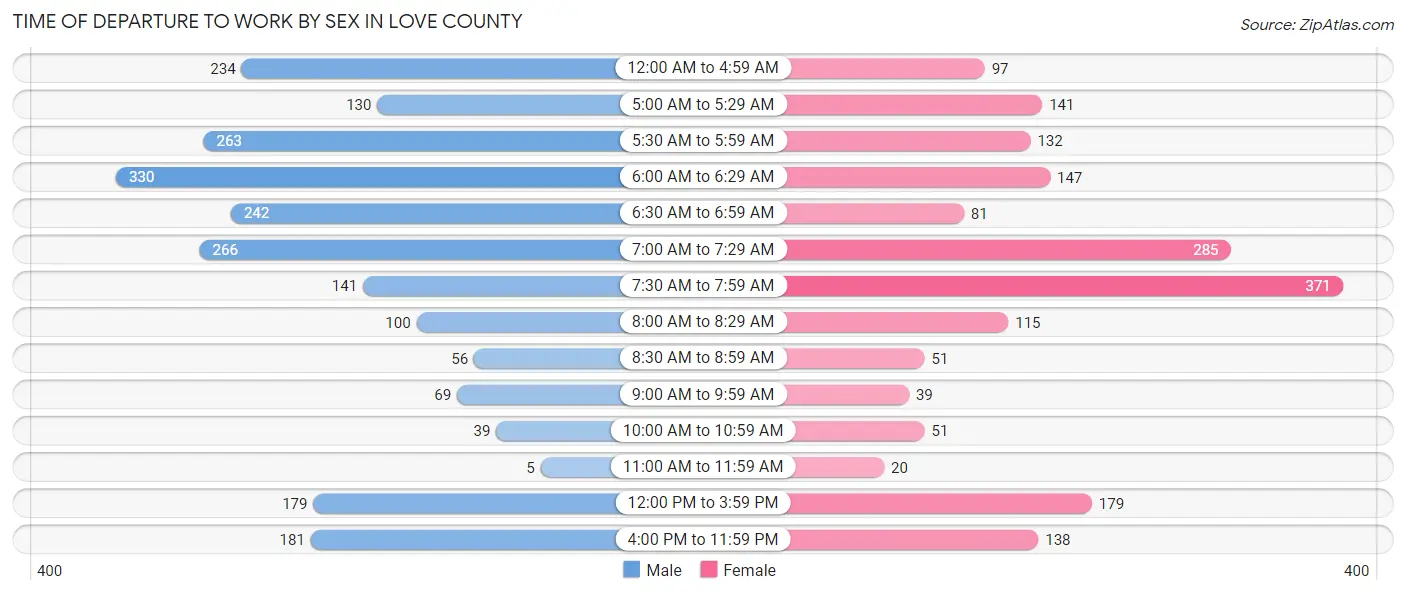
| Time of Departure | Male | Female |
| 12:00 AM to 4:59 AM | 234 (10.5%) | 97 (5.2%) |
| 5:00 AM to 5:29 AM | 130 (5.8%) | 141 (7.6%) |
| 5:30 AM to 5:59 AM | 263 (11.8%) | 132 (7.1%) |
| 6:00 AM to 6:29 AM | 330 (14.8%) | 147 (8.0%) |
| 6:30 AM to 6:59 AM | 242 (10.8%) | 81 (4.4%) |
| 7:00 AM to 7:29 AM | 266 (11.9%) | 285 (15.4%) |
| 7:30 AM to 7:59 AM | 141 (6.3%) | 371 (20.1%) |
| 8:00 AM to 8:29 AM | 100 (4.5%) | 115 (6.2%) |
| 8:30 AM to 8:59 AM | 56 (2.5%) | 51 (2.8%) |
| 9:00 AM to 9:59 AM | 69 (3.1%) | 39 (2.1%) |
| 10:00 AM to 10:59 AM | 39 (1.7%) | 51 (2.8%) |
| 11:00 AM to 11:59 AM | 5 (0.2%) | 20 (1.1%) |
| 12:00 PM to 3:59 PM | 179 (8.0%) | 179 (9.7%) |
| 4:00 PM to 11:59 PM | 181 (8.1%) | 138 (7.5%) |
| Total | 2,235 (100.0%) | 1,847 (100.0%) |
Housing Occupancy in Love County
Occupancy by Ownership in Love County
Of the total 3,686 dwellings in Love County, owner-occupied units account for 2,637 (71.5%), while renter-occupied units make up 1,049 (28.5%).
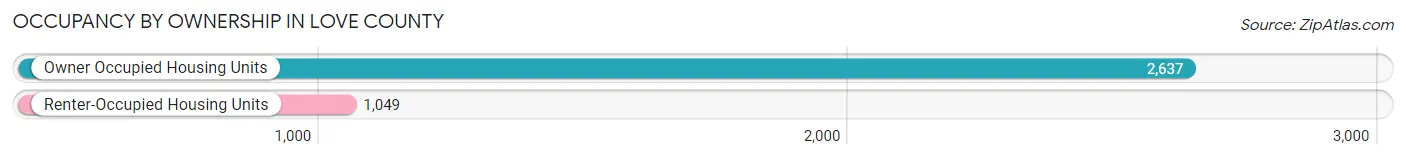
| Occupancy | # Housing Units | % Housing Units |
| Owner Occupied Housing Units | 2,637 | 71.5% |
| Renter-Occupied Housing Units | 1,049 | 28.5% |
| Total Occupied Housing Units | 3,686 | 100.0% |
Occupancy by Household Size in Love County
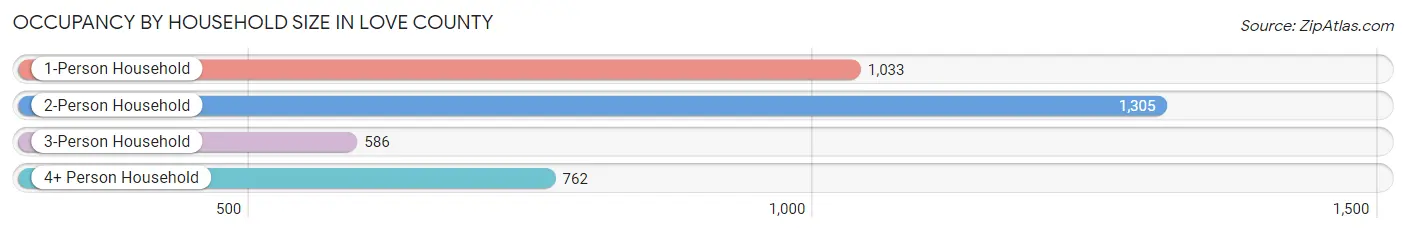
| Household Size | # Housing Units | % Housing Units |
| 1-Person Household | 1,033 | 28.0% |
| 2-Person Household | 1,305 | 35.4% |
| 3-Person Household | 586 | 15.9% |
| 4+ Person Household | 762 | 20.7% |
| Total Housing Units | 3,686 | 100.0% |
Occupancy by Ownership by Household Size in Love County
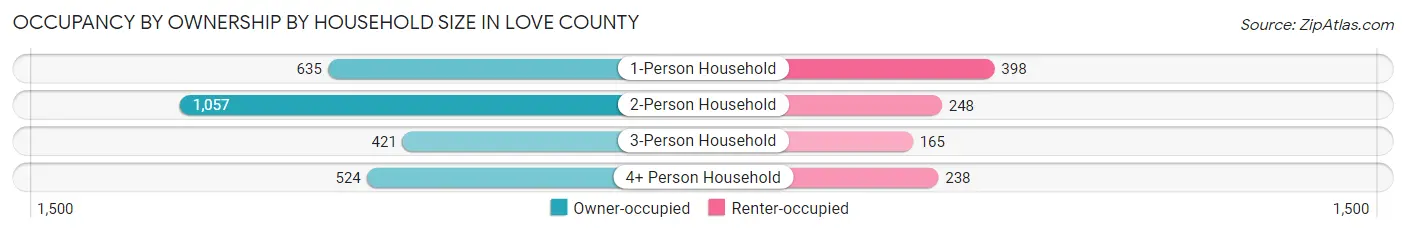
| Household Size | Owner-occupied | Renter-occupied |
| 1-Person Household | 635 (61.5%) | 398 (38.5%) |
| 2-Person Household | 1,057 (81.0%) | 248 (19.0%) |
| 3-Person Household | 421 (71.8%) | 165 (28.2%) |
| 4+ Person Household | 524 (68.8%) | 238 (31.2%) |
| Total Housing Units | 2,637 (71.5%) | 1,049 (28.5%) |
Occupancy by Educational Attainment in Love County
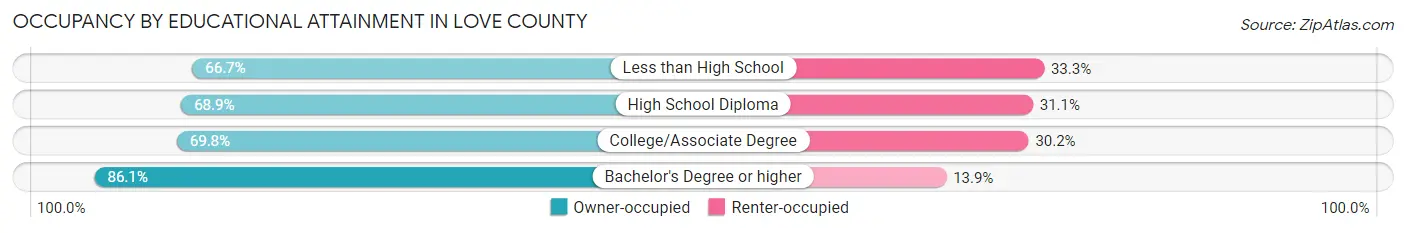
| Household Size | Owner-occupied | Renter-occupied |
| Less than High School | 359 (66.7%) | 179 (33.3%) |
| High School Diploma | 890 (68.9%) | 401 (31.1%) |
| College/Associate Degree | 904 (69.8%) | 391 (30.2%) |
| Bachelor's Degree or higher | 484 (86.1%) | 78 (13.9%) |
Occupancy by Age of Householder in Love County
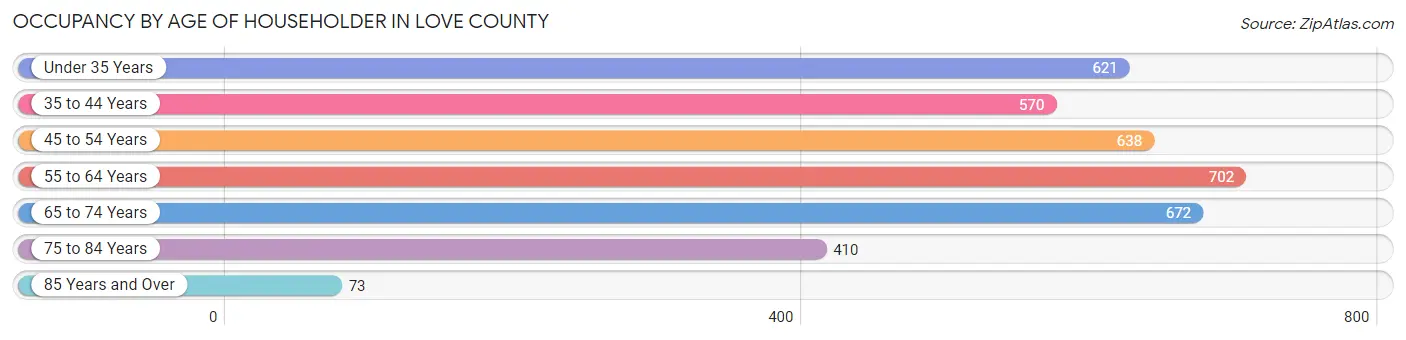
| Age Bracket | # Households | % Households |
| Under 35 Years | 621 | 16.9% |
| 35 to 44 Years | 570 | 15.5% |
| 45 to 54 Years | 638 | 17.3% |
| 55 to 64 Years | 702 | 19.1% |
| 65 to 74 Years | 672 | 18.2% |
| 75 to 84 Years | 410 | 11.1% |
| 85 Years and Over | 73 | 2.0% |
| Total | 3,686 | 100.0% |
Housing Finances in Love County
Median Income by Occupancy in Love County
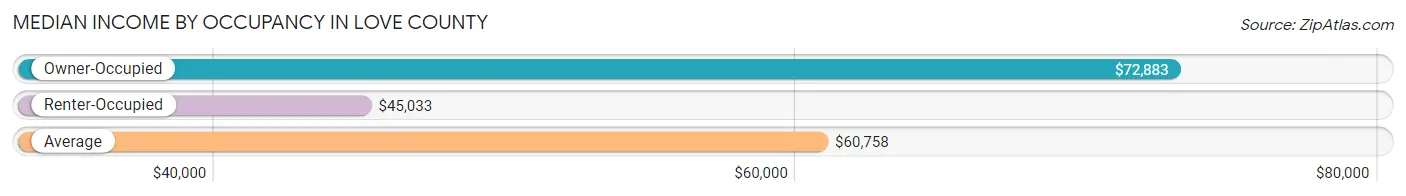
| Occupancy Type | # Households | Median Income |
| Owner-Occupied | 2,637 (71.5%) | $72,883 |
| Renter-Occupied | 1,049 (28.5%) | $45,033 |
| Average | 3,686 (100.0%) | $60,758 |
Occupancy by Householder Income Bracket in Love County
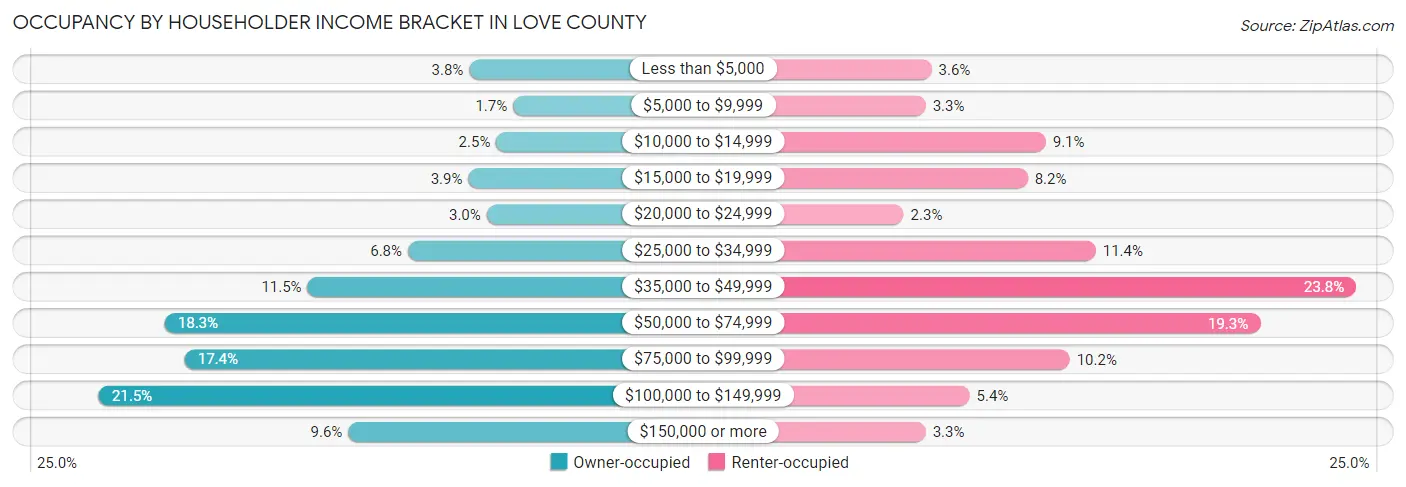
| Income Bracket | Owner-occupied | Renter-occupied |
| Less than $5,000 | 101 (3.8%) | 38 (3.6%) |
| $5,000 to $9,999 | 46 (1.7%) | 35 (3.3%) |
| $10,000 to $14,999 | 67 (2.5%) | 95 (9.1%) |
| $15,000 to $19,999 | 102 (3.9%) | 86 (8.2%) |
| $20,000 to $24,999 | 79 (3.0%) | 24 (2.3%) |
| $25,000 to $34,999 | 178 (6.8%) | 120 (11.4%) |
| $35,000 to $49,999 | 304 (11.5%) | 250 (23.8%) |
| $50,000 to $74,999 | 483 (18.3%) | 202 (19.3%) |
| $75,000 to $99,999 | 458 (17.4%) | 107 (10.2%) |
| $100,000 to $149,999 | 566 (21.5%) | 57 (5.4%) |
| $150,000 or more | 253 (9.6%) | 35 (3.3%) |
| Total | 2,637 (100.0%) | 1,049 (100.0%) |
Monthly Housing Cost Tiers in Love County
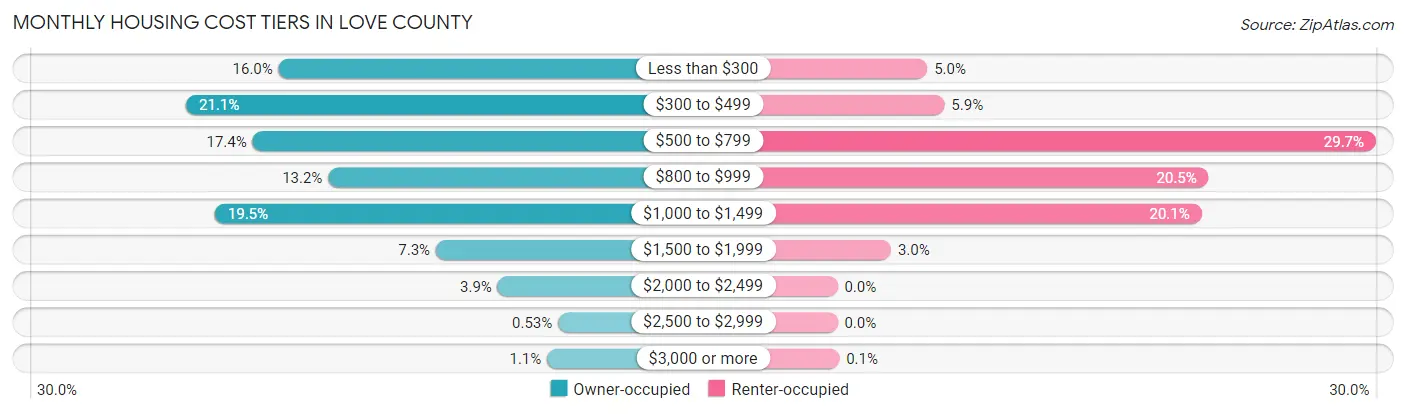
| Monthly Cost | Owner-occupied | Renter-occupied |
| Less than $300 | 421 (16.0%) | 52 (5.0%) |
| $300 to $499 | 556 (21.1%) | 62 (5.9%) |
| $500 to $799 | 459 (17.4%) | 312 (29.7%) |
| $800 to $999 | 349 (13.2%) | 215 (20.5%) |
| $1,000 to $1,499 | 514 (19.5%) | 211 (20.1%) |
| $1,500 to $1,999 | 192 (7.3%) | 31 (3.0%) |
| $2,000 to $2,499 | 102 (3.9%) | 0 (0.0%) |
| $2,500 to $2,999 | 14 (0.5%) | 0 (0.0%) |
| $3,000 or more | 30 (1.1%) | 1 (0.1%) |
| Total | 2,637 (100.0%) | 1,049 (100.0%) |
Physical Housing Characteristics in Love County
Housing Structures in Love County
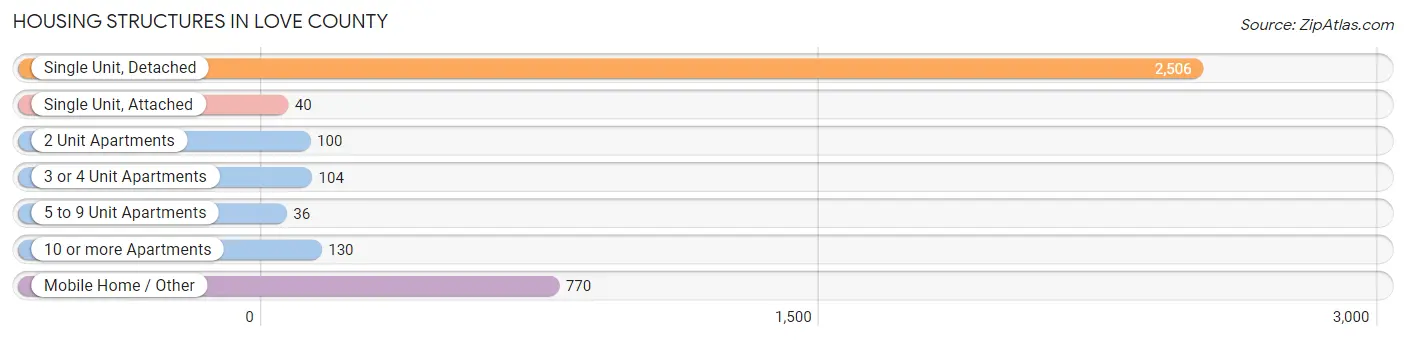
| Structure Type | # Housing Units | % Housing Units |
| Single Unit, Detached | 2,506 | 68.0% |
| Single Unit, Attached | 40 | 1.1% |
| 2 Unit Apartments | 100 | 2.7% |
| 3 or 4 Unit Apartments | 104 | 2.8% |
| 5 to 9 Unit Apartments | 36 | 1.0% |
| 10 or more Apartments | 130 | 3.5% |
| Mobile Home / Other | 770 | 20.9% |
| Total | 3,686 | 100.0% |
Housing Structures by Occupancy in Love County
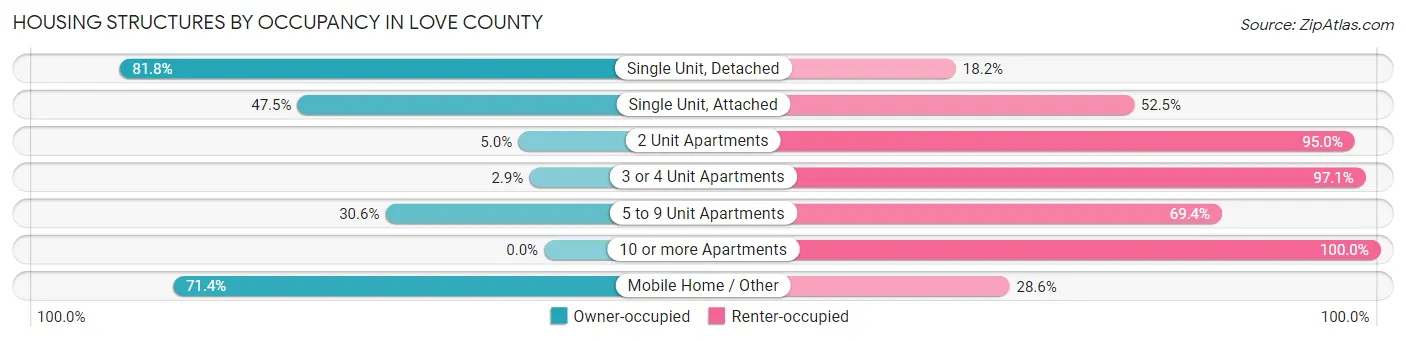
| Structure Type | Owner-occupied | Renter-occupied |
| Single Unit, Detached | 2,049 (81.8%) | 457 (18.2%) |
| Single Unit, Attached | 19 (47.5%) | 21 (52.5%) |
| 2 Unit Apartments | 5 (5.0%) | 95 (95.0%) |
| 3 or 4 Unit Apartments | 3 (2.9%) | 101 (97.1%) |
| 5 to 9 Unit Apartments | 11 (30.6%) | 25 (69.4%) |
| 10 or more Apartments | 0 (0.0%) | 130 (100.0%) |
| Mobile Home / Other | 550 (71.4%) | 220 (28.6%) |
| Total | 2,637 (71.5%) | 1,049 (28.5%) |
Housing Structures by Number of Rooms in Love County
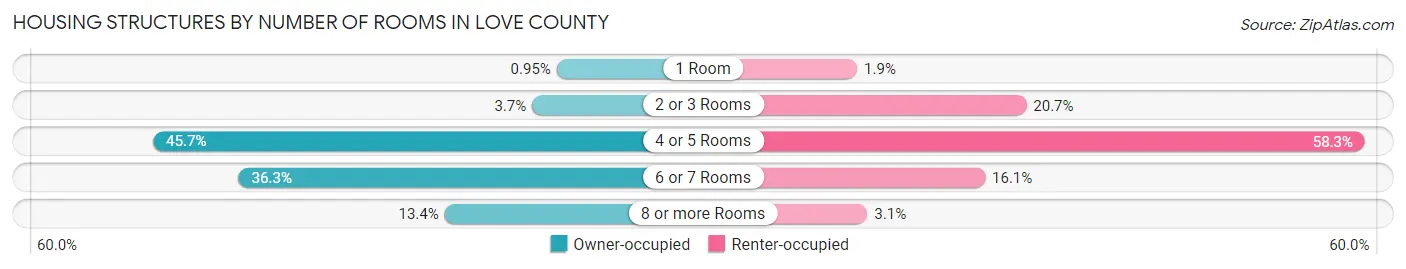
| Number of Rooms | Owner-occupied | Renter-occupied |
| 1 Room | 25 (0.9%) | 20 (1.9%) |
| 2 or 3 Rooms | 97 (3.7%) | 217 (20.7%) |
| 4 or 5 Rooms | 1,206 (45.7%) | 611 (58.3%) |
| 6 or 7 Rooms | 956 (36.2%) | 169 (16.1%) |
| 8 or more Rooms | 353 (13.4%) | 32 (3.0%) |
| Total | 2,637 (100.0%) | 1,049 (100.0%) |
Housing Structure by Heating Type in Love County

| Heating Type | Owner-occupied | Renter-occupied |
| Utility Gas | 285 (10.8%) | 131 (12.5%) |
| Bottled, Tank, or LP Gas | 101 (3.8%) | 25 (2.4%) |
| Electricity | 2,097 (79.5%) | 851 (81.1%) |
| Fuel Oil or Kerosene | 3 (0.1%) | 0 (0.0%) |
| Coal or Coke | 0 (0.0%) | 0 (0.0%) |
| All other Fuels | 144 (5.5%) | 42 (4.0%) |
| No Fuel Used | 7 (0.3%) | 0 (0.0%) |
| Total | 2,637 (100.0%) | 1,049 (100.0%) |
Household Vehicle Usage in Love County
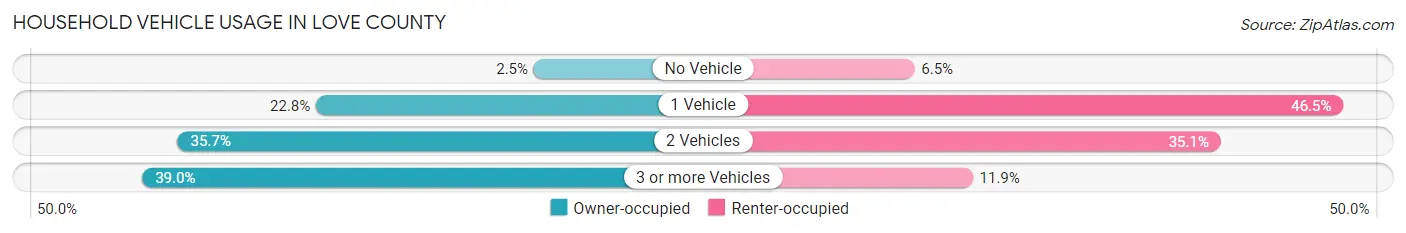
| Vehicles per Household | Owner-occupied | Renter-occupied |
| No Vehicle | 65 (2.5%) | 68 (6.5%) |
| 1 Vehicle | 601 (22.8%) | 488 (46.5%) |
| 2 Vehicles | 942 (35.7%) | 368 (35.1%) |
| 3 or more Vehicles | 1,029 (39.0%) | 125 (11.9%) |
| Total | 2,637 (100.0%) | 1,049 (100.0%) |
Real Estate & Mortgages in Love County
Real Estate and Mortgage Overview in Love County
| Characteristic | Without Mortgage | With Mortgage |
| Housing Units | 1,474 | 1,163 |
| Median Property Value | $126,900 | $180,700 |
| Median Household Income | $63,629 | $178 |
| Monthly Housing Costs | $399 | $19 |
| Real Estate Taxes | $767 | $44 |
Property Value by Mortgage Status in Love County
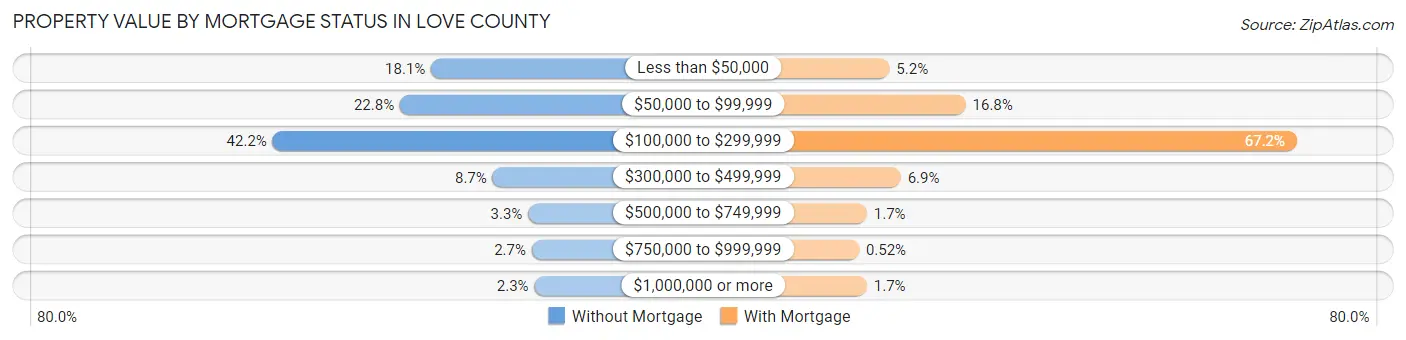
| Property Value | Without Mortgage | With Mortgage |
| Less than $50,000 | 266 (18.0%) | 60 (5.2%) |
| $50,000 to $99,999 | 336 (22.8%) | 195 (16.8%) |
| $100,000 to $299,999 | 622 (42.2%) | 782 (67.2%) |
| $300,000 to $499,999 | 128 (8.7%) | 80 (6.9%) |
| $500,000 to $749,999 | 48 (3.3%) | 20 (1.7%) |
| $750,000 to $999,999 | 40 (2.7%) | 6 (0.5%) |
| $1,000,000 or more | 34 (2.3%) | 20 (1.7%) |
| Total | 1,474 (100.0%) | 1,163 (100.0%) |
Household Income by Mortgage Status in Love County
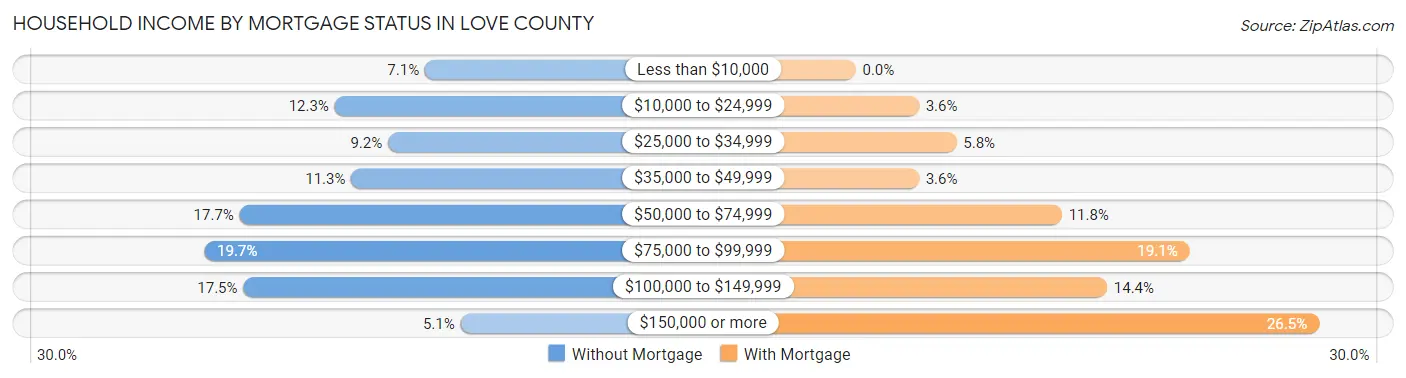
| Household Income | Without Mortgage | With Mortgage |
| Less than $10,000 | 105 (7.1%) | 0 (0.0%) |
| $10,000 to $24,999 | 181 (12.3%) | 42 (3.6%) |
| $25,000 to $34,999 | 136 (9.2%) | 67 (5.8%) |
| $35,000 to $49,999 | 167 (11.3%) | 42 (3.6%) |
| $50,000 to $74,999 | 261 (17.7%) | 137 (11.8%) |
| $75,000 to $99,999 | 291 (19.7%) | 222 (19.1%) |
| $100,000 to $149,999 | 258 (17.5%) | 167 (14.4%) |
| $150,000 or more | 75 (5.1%) | 308 (26.5%) |
| Total | 1,474 (100.0%) | 1,163 (100.0%) |
Property Value to Household Income Ratio in Love County
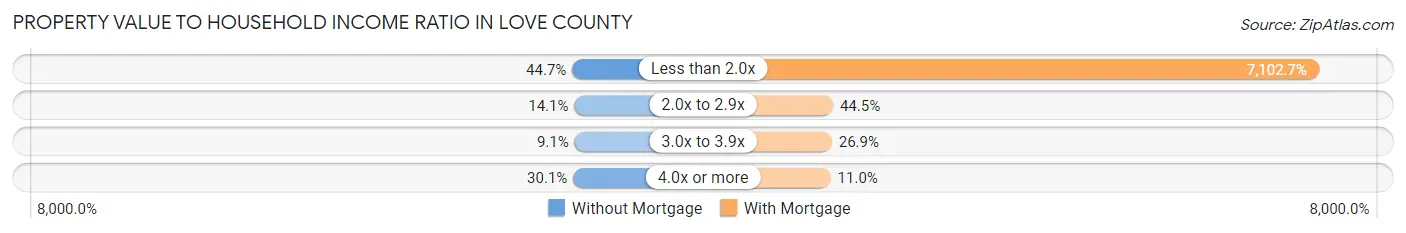
| Value-to-Income Ratio | Without Mortgage | With Mortgage |
| Less than 2.0x | 659 (44.7%) | 82,604 (7,102.7%) |
| 2.0x to 2.9x | 208 (14.1%) | 518 (44.5%) |
| 3.0x to 3.9x | 134 (9.1%) | 313 (26.9%) |
| 4.0x or more | 444 (30.1%) | 128 (11.0%) |
| Total | 1,474 (100.0%) | 1,163 (100.0%) |
Real Estate Taxes by Mortgage Status in Love County
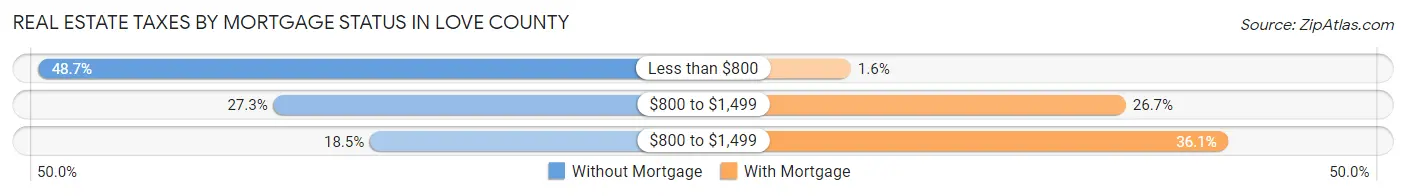
| Property Taxes | Without Mortgage | With Mortgage |
| Less than $800 | 718 (48.7%) | 19 (1.6%) |
| $800 to $1,499 | 402 (27.3%) | 311 (26.7%) |
| $800 to $1,499 | 272 (18.4%) | 420 (36.1%) |
| Total | 1,474 (100.0%) | 1,163 (100.0%) |
Health & Disability in Love County
Health Insurance Coverage by Age in Love County
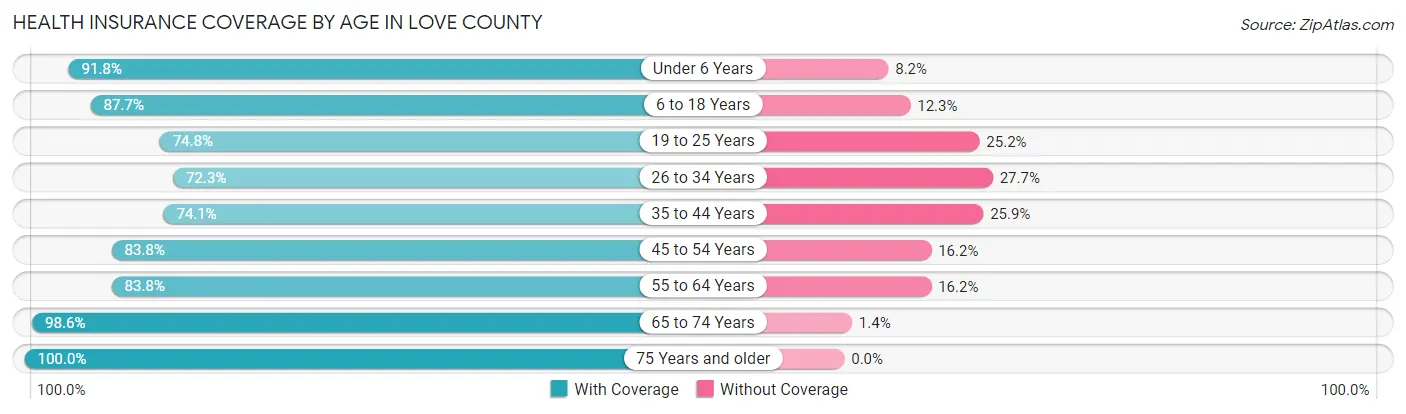
| Age Bracket | With Coverage | Without Coverage |
| Under 6 Years | 694 (91.8%) | 62 (8.2%) |
| 6 to 18 Years | 1,654 (87.7%) | 232 (12.3%) |
| 19 to 25 Years | 659 (74.8%) | 222 (25.2%) |
| 26 to 34 Years | 784 (72.3%) | 300 (27.7%) |
| 35 to 44 Years | 824 (74.1%) | 288 (25.9%) |
| 45 to 54 Years | 1,065 (83.8%) | 206 (16.2%) |
| 55 to 64 Years | 1,080 (83.8%) | 209 (16.2%) |
| 65 to 74 Years | 1,042 (98.6%) | 15 (1.4%) |
| 75 Years and older | 732 (100.0%) | 0 (0.0%) |
| Total | 8,534 (84.8%) | 1,534 (15.2%) |
Health Insurance Coverage by Citizenship Status in Love County
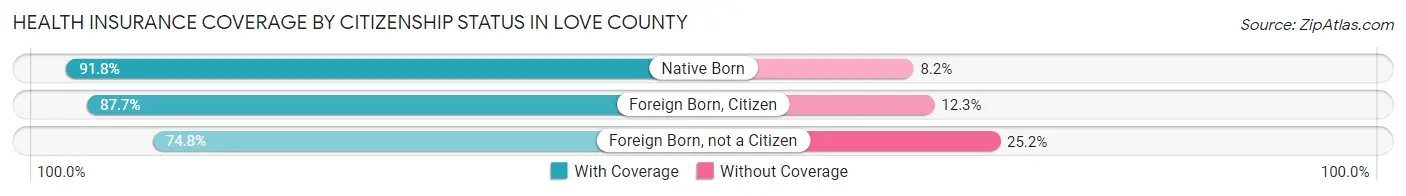
| Citizenship Status | With Coverage | Without Coverage |
| Native Born | 694 (91.8%) | 62 (8.2%) |
| Foreign Born, Citizen | 1,654 (87.7%) | 232 (12.3%) |
| Foreign Born, not a Citizen | 659 (74.8%) | 222 (25.2%) |
Health Insurance Coverage by Household Income in Love County
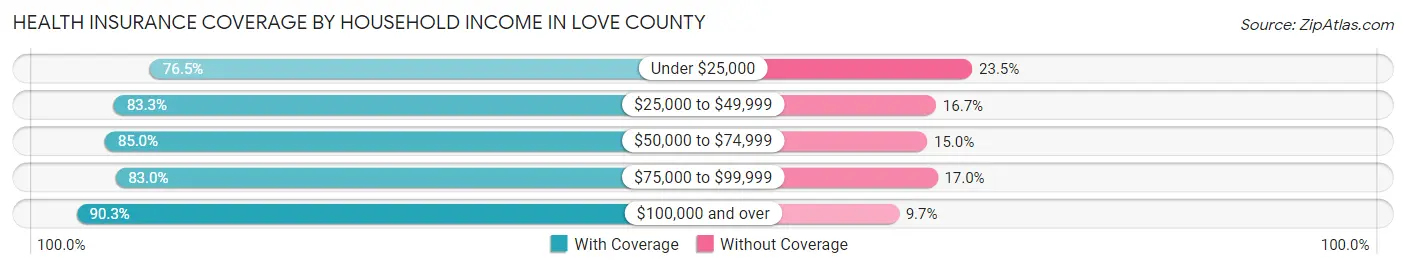
| Household Income | With Coverage | Without Coverage |
| Under $25,000 | 909 (76.5%) | 279 (23.5%) |
| $25,000 to $49,999 | 1,821 (83.3%) | 365 (16.7%) |
| $50,000 to $74,999 | 1,841 (85.0%) | 326 (15.0%) |
| $75,000 to $99,999 | 1,423 (83.0%) | 291 (17.0%) |
| $100,000 and over | 2,518 (90.3%) | 271 (9.7%) |
Public vs Private Health Insurance Coverage by Age in Love County
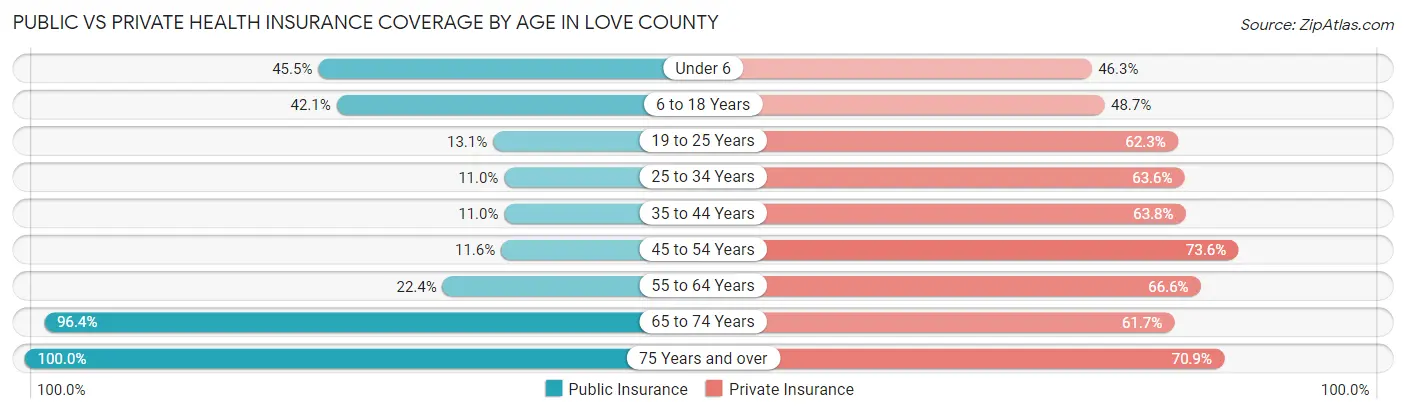
| Age Bracket | Public Insurance | Private Insurance |
| Under 6 | 344 (45.5%) | 350 (46.3%) |
| 6 to 18 Years | 794 (42.1%) | 918 (48.7%) |
| 19 to 25 Years | 115 (13.1%) | 549 (62.3%) |
| 25 to 34 Years | 119 (11.0%) | 689 (63.6%) |
| 35 to 44 Years | 122 (11.0%) | 709 (63.8%) |
| 45 to 54 Years | 147 (11.6%) | 935 (73.6%) |
| 55 to 64 Years | 289 (22.4%) | 858 (66.6%) |
| 65 to 74 Years | 1,019 (96.4%) | 652 (61.7%) |
| 75 Years and over | 732 (100.0%) | 519 (70.9%) |
| Total | 3,681 (36.6%) | 6,179 (61.4%) |
Disability Status by Sex by Age in Love County
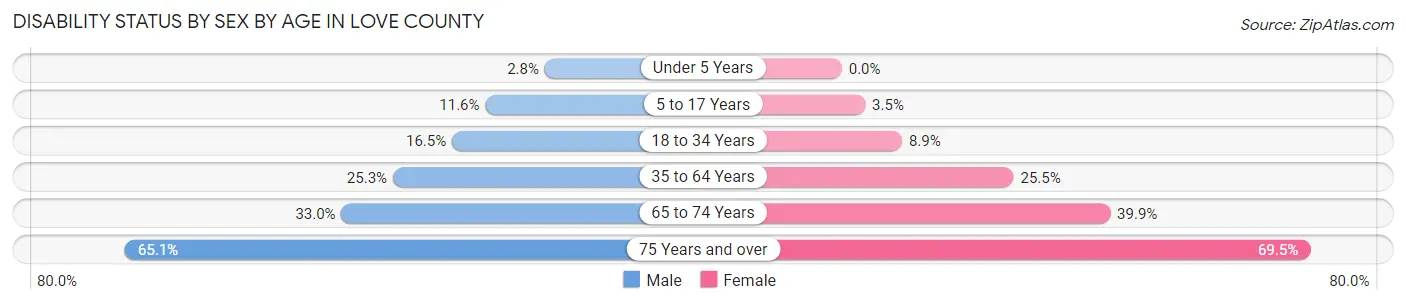
| Age Bracket | Male | Female |
| Under 5 Years | 9 (2.8%) | 0 (0.0%) |
| 5 to 17 Years | 104 (11.6%) | 33 (3.5%) |
| 18 to 34 Years | 184 (16.5%) | 91 (8.9%) |
| 35 to 64 Years | 468 (25.3%) | 465 (25.5%) |
| 65 to 74 Years | 173 (33.0%) | 212 (39.9%) |
| 75 Years and over | 250 (65.1%) | 242 (69.5%) |
Disability Class by Sex by Age in Love County
Disability Class: Hearing Difficulty
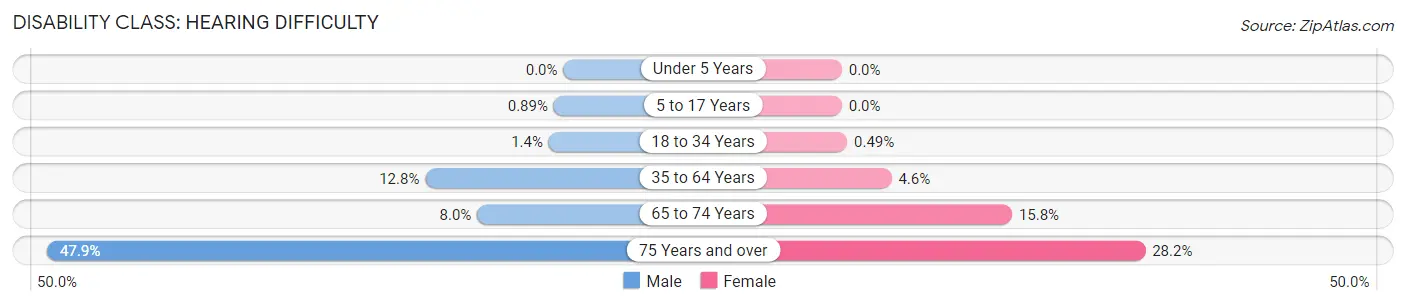
| Age Bracket | Male | Female |
| Under 5 Years | 0 (0.0%) | 0 (0.0%) |
| 5 to 17 Years | 8 (0.9%) | 0 (0.0%) |
| 18 to 34 Years | 15 (1.3%) | 5 (0.5%) |
| 35 to 64 Years | 237 (12.8%) | 84 (4.6%) |
| 65 to 74 Years | 42 (8.0%) | 84 (15.8%) |
| 75 Years and over | 184 (47.9%) | 98 (28.2%) |
Disability Class: Vision Difficulty
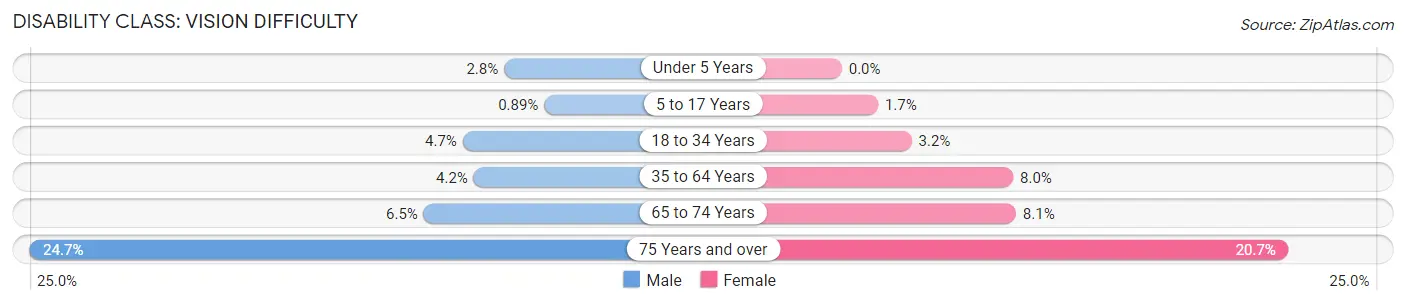
| Age Bracket | Male | Female |
| Under 5 Years | 9 (2.8%) | 0 (0.0%) |
| 5 to 17 Years | 8 (0.9%) | 16 (1.7%) |
| 18 to 34 Years | 52 (4.7%) | 33 (3.2%) |
| 35 to 64 Years | 77 (4.2%) | 145 (8.0%) |
| 65 to 74 Years | 34 (6.5%) | 43 (8.1%) |
| 75 Years and over | 95 (24.7%) | 72 (20.7%) |
Disability Class: Cognitive Difficulty
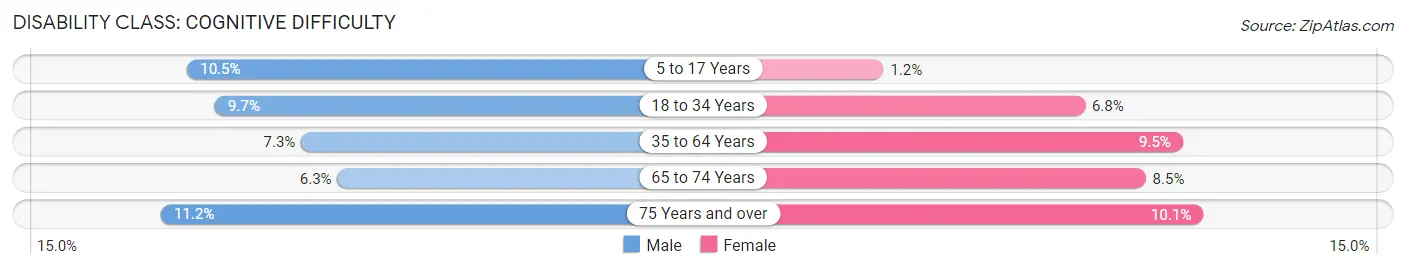
| Age Bracket | Male | Female |
| 5 to 17 Years | 94 (10.5%) | 11 (1.2%) |
| 18 to 34 Years | 108 (9.7%) | 69 (6.8%) |
| 35 to 64 Years | 135 (7.3%) | 173 (9.5%) |
| 65 to 74 Years | 33 (6.3%) | 45 (8.5%) |
| 75 Years and over | 43 (11.2%) | 35 (10.1%) |
Disability Class: Ambulatory Difficulty
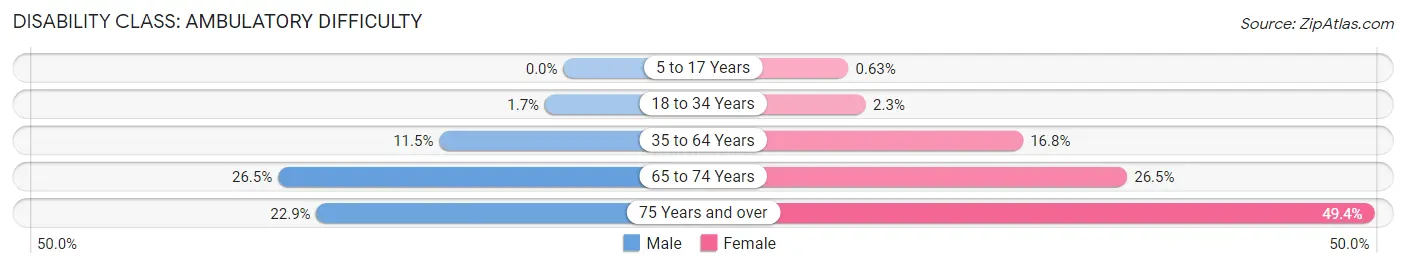
| Age Bracket | Male | Female |
| 5 to 17 Years | 0 (0.0%) | 6 (0.6%) |
| 18 to 34 Years | 19 (1.7%) | 23 (2.3%) |
| 35 to 64 Years | 213 (11.5%) | 307 (16.8%) |
| 65 to 74 Years | 139 (26.5%) | 141 (26.5%) |
| 75 Years and over | 88 (22.9%) | 172 (49.4%) |
Disability Class: Self-Care Difficulty
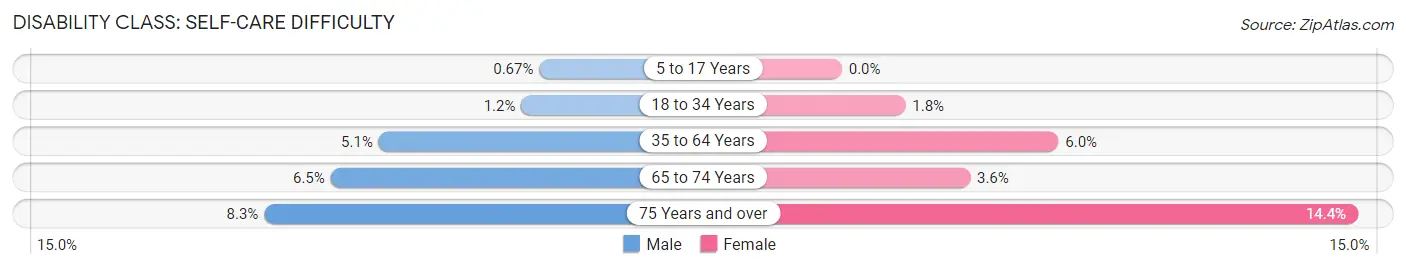
| Age Bracket | Male | Female |
| 5 to 17 Years | 6 (0.7%) | 0 (0.0%) |
| 18 to 34 Years | 13 (1.2%) | 18 (1.8%) |
| 35 to 64 Years | 95 (5.1%) | 110 (6.0%) |
| 65 to 74 Years | 34 (6.5%) | 19 (3.6%) |
| 75 Years and over | 32 (8.3%) | 50 (14.4%) |
Technology Access in Love County
Computing Device Access in Love County
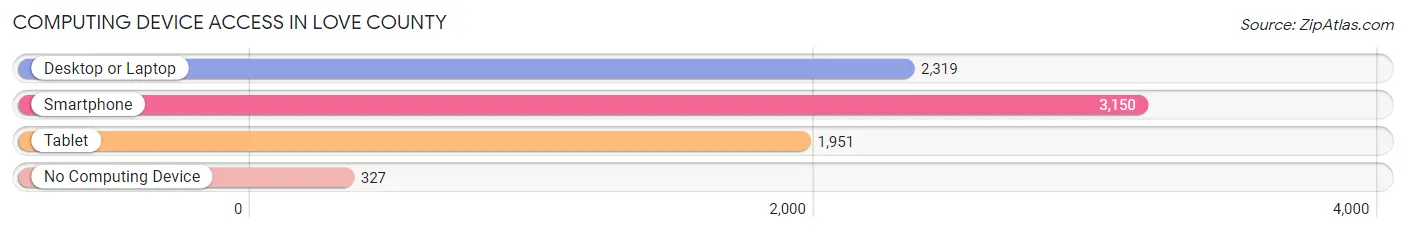
| Device Type | # Households | % Households |
| Desktop or Laptop | 2,319 | 62.9% |
| Smartphone | 3,150 | 85.5% |
| Tablet | 1,951 | 52.9% |
| No Computing Device | 327 | 8.9% |
| Total | 3,686 | 100.0% |
Internet Access in Love County
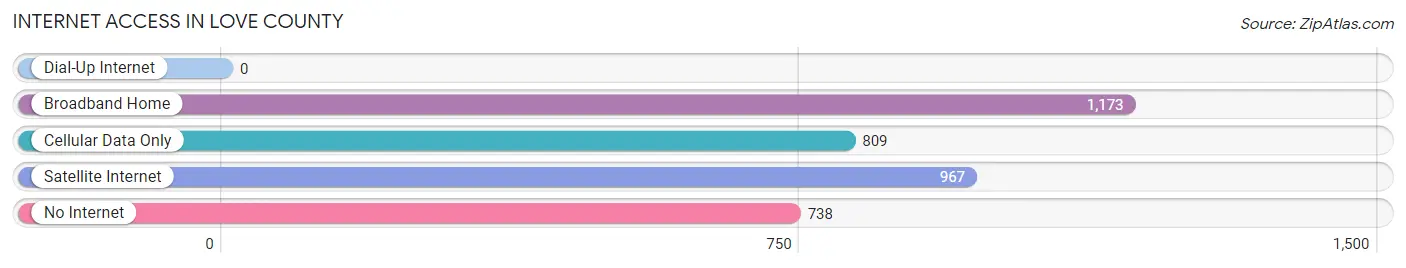
| Internet Type | # Households | % Households |
| Dial-Up Internet | 0 | 0.0% |
| Broadband Home | 1,173 | 31.8% |
| Cellular Data Only | 809 | 22.0% |
| Satellite Internet | 967 | 26.2% |
| No Internet | 738 | 20.0% |
| Total | 3,686 | 100.0% |
Love County Summary
County History
Love County is located in the south-central region of Oklahoma and is part of the Arbuckle Country region. The county was created in 1907 and was named after Overton Love, a prominent local rancher and businessman. The county was originally part of the Chickasaw Nation, and the area was home to several Native American tribes, including the Choctaw, Chickasaw, and Caddo.
The first settlers in the area were ranchers and farmers, who began to move into the area in the late 1800s. The first town in the county was Marietta, which was established in 1887. The town was named after Marietta Love, the daughter of Overton Love.
The county experienced rapid growth in the early 1900s, as the oil industry began to boom in the area. Oil was discovered in the county in 1912, and by the 1920s, the county was one of the leading oil-producing counties in the state. The oil industry brought a great deal of wealth to the county, and many of the towns in the county experienced a period of rapid growth.
Geography
Love County is located in the south-central region of Oklahoma and is bordered by Marshall County to the north, Carter County to the east, Johnston County to the south, and Jefferson County to the west. The county covers an area of 576 square miles and is home to several small towns, including Marietta, Thackerville, and Overbrook.
The terrain of the county is mostly flat, with some rolling hills in the northern part of the county. The county is drained by the Washita River, which flows through the county from north to south. The county is also home to several small lakes, including Lake Murray and Lake Texoma.
Economy
Love County has a diverse economy, with a mix of agriculture, manufacturing, and tourism. The county is home to several large agricultural operations, including cattle ranches, poultry farms, and vegetable farms. The county is also home to several manufacturing companies, including a furniture factory and a plastics plant.
Tourism is also an important part of the county’s economy. The county is home to several popular tourist attractions, including the Lake Murray State Park, the Chickasaw National Recreation Area, and the Turner Falls Park.
Demographics
As of the 2010 census, Love County had a population of 11,621. The population was spread out, with 48.3% male and 51.7% female. The median age was 38.7 years. The racial makeup of the county was 87.2% White, 8.2% Native American, 0.7% Asian, 0.3% African American, and 3.6% from other races.
The median household income in the county was $37,945, and the median family income was $45,945. The per capita income was $19,945. About 11.2% of the population was below the poverty line.
Common Questions
What is Per Capita Income in Love County?
Per Capita income in Love County is $28,560.
What is the Median Family Income in Love County?
Median Family Income in Love County is $70,952.
What is the Median Household income in Love County?
Median Household Income in Love County is $60,758.
What is Income or Wage Gap in Love County?
Income or Wage Gap in Love County is 37.1%.
Women in Love County earn 62.9 cents for every dollar earned by a man.
What is Family Income Deficit in Love County?
Family Income Deficit in Love County is $10,496.
Families that are below poverty line in Love County earn $10,496 less on average than the poverty threshold level.
What is Inequality or Gini Index in Love County?
Inequality or Gini Index in Love County is 0.41.
What is the Total Population of Love County?
Total Population of Love County is 10,158.
What is the Total Male Population of Love County?
Total Male Population of Love County is 5,137.
What is the Total Female Population of Love County?
Total Female Population of Love County is 5,021.
What is the Ratio of Males per 100 Females in Love County?
There are 102.31 Males per 100 Females in Love County.
What is the Ratio of Females per 100 Males in Love County?
There are 97.74 Females per 100 Males in Love County.
What is the Median Population Age in Love County?
Median Population Age in Love County is 39.0 Years.
What is the Average Family Size in Love County
Average Family Size in Love County is 3.4 People.
What is the Average Household Size in Love County
Average Household Size in Love County is 2.7 People.
How Large is the Labor Force in Love County?
There are 4,645 People in the Labor Forcein in Love County.
What is the Percentage of People in the Labor Force in Love County?
58.3% of People are in the Labor Force in Love County.
What is the Unemployment Rate in Love County?
Unemployment Rate in Love County is 5.4%.