Latimer County, OK Map & Demographics
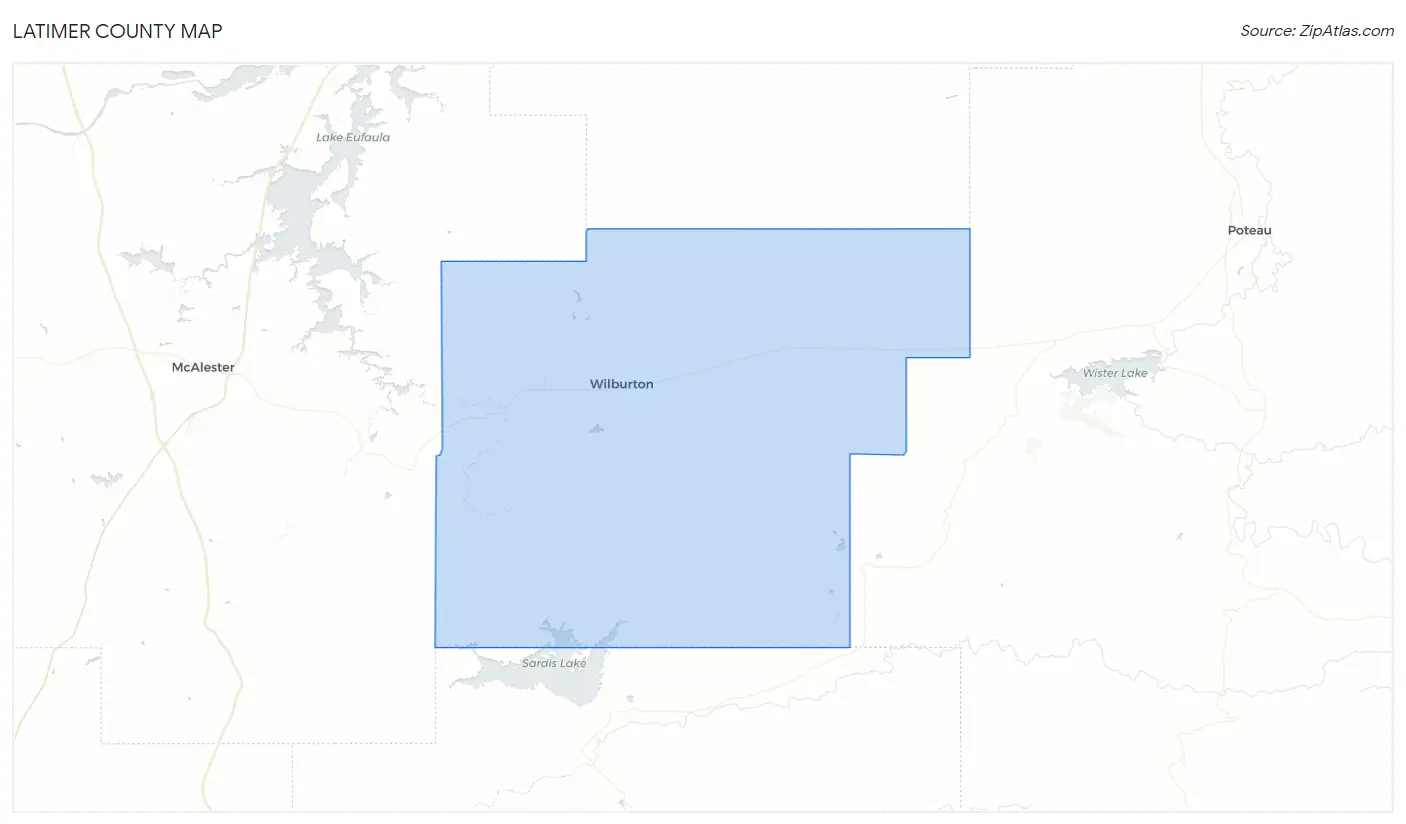
Latimer County Map
Latimer County Overview
$25,189
PER CAPITA INCOME
$57,564
AVG FAMILY INCOME
$42,735
AVG HOUSEHOLD INCOME
30.2%
WAGE / INCOME GAP [ % ]
69.8¢/ $1
WAGE / INCOME GAP [ $ ]
$10,438
FAMILY INCOME DEFICIT
0.45
INEQUALITY / GINI INDEX
9,537
TOTAL POPULATION
4,838
MALE POPULATION
4,699
FEMALE POPULATION
102.96
MALES / 100 FEMALES
97.13
FEMALES / 100 MALES
40.9
MEDIAN AGE
2.8
AVG FAMILY SIZE
2.4
AVG HOUSEHOLD SIZE
3,864
LABOR FORCE [ PEOPLE ]
50.6%
PERCENT IN LABOR FORCE
7.8%
UNEMPLOYMENT RATE
Latimer County Area Codes
Income in Latimer County
Income Overview in Latimer County
Per Capita Income in Latimer County is $25,189, while median incomes of families and households are $57,564 and $42,735 respectively.
| Characteristic | Number | Measure |
| Per Capita Income | 9,537 | $25,189 |
| Median Family Income | 2,715 | $57,564 |
| Mean Family Income | 2,715 | $69,799 |
| Median Household Income | 3,852 | $42,735 |
| Mean Household Income | 3,852 | $60,758 |
| Income Deficit | 2,715 | $10,438 |
| Wage / Income Gap (%) | 9,537 | 30.20% |
| Wage / Income Gap ($) | 9,537 | 69.80¢ per $1 |
| Gini / Inequality Index | 9,537 | 0.45 |
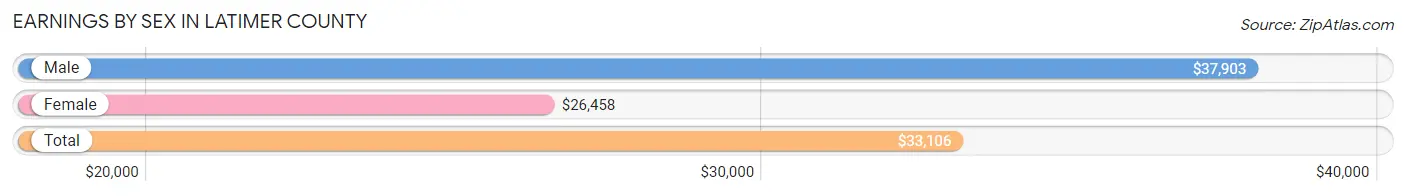
Earnings by Sex in Latimer County
Average Earnings in Latimer County are $33,106, $37,903 for men and $26,458 for women, a difference of 30.2%.
| Sex | Number | Average Earnings |
| Male | 2,158 (54.0%) | $37,903 |
| Female | 1,839 (46.0%) | $26,458 |
| Total | 3,997 (100.0%) | $33,106 |
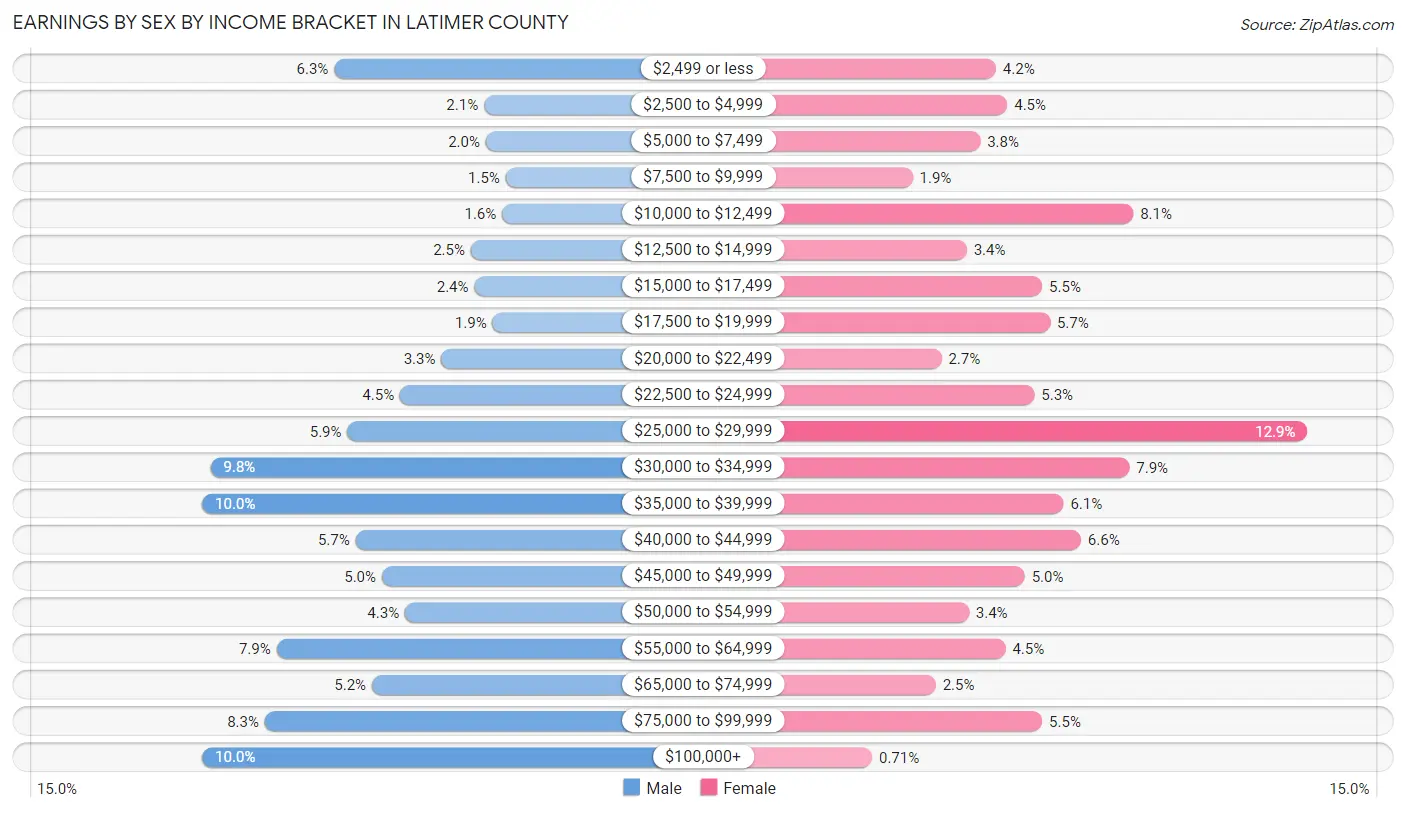
Earnings by Sex by Income Bracket in Latimer County
The most common earnings brackets in Latimer County are $35,000 to $39,999 for men (216 | 10.0%) and $25,000 to $29,999 for women (238 | 12.9%).
| Income | Male | Female |
| $2,499 or less | 136 (6.3%) | 77 (4.2%) |
| $2,500 to $4,999 | 45 (2.1%) | 83 (4.5%) |
| $5,000 to $7,499 | 44 (2.0%) | 69 (3.7%) |
| $7,500 to $9,999 | 32 (1.5%) | 34 (1.8%) |
| $10,000 to $12,499 | 34 (1.6%) | 148 (8.1%) |
| $12,500 to $14,999 | 53 (2.5%) | 62 (3.4%) |
| $15,000 to $17,499 | 51 (2.4%) | 101 (5.5%) |
| $17,500 to $19,999 | 40 (1.8%) | 105 (5.7%) |
| $20,000 to $22,499 | 71 (3.3%) | 49 (2.7%) |
| $22,500 to $24,999 | 96 (4.4%) | 97 (5.3%) |
| $25,000 to $29,999 | 128 (5.9%) | 238 (12.9%) |
| $30,000 to $34,999 | 211 (9.8%) | 146 (7.9%) |
| $35,000 to $39,999 | 216 (10.0%) | 112 (6.1%) |
| $40,000 to $44,999 | 123 (5.7%) | 121 (6.6%) |
| $45,000 to $49,999 | 107 (5.0%) | 92 (5.0%) |
| $50,000 to $54,999 | 93 (4.3%) | 63 (3.4%) |
| $55,000 to $64,999 | 171 (7.9%) | 82 (4.5%) |
| $65,000 to $74,999 | 113 (5.2%) | 46 (2.5%) |
| $75,000 to $99,999 | 178 (8.3%) | 101 (5.5%) |
| $100,000+ | 216 (10.0%) | 13 (0.7%) |
| Total | 2,158 (100.0%) | 1,839 (100.0%) |
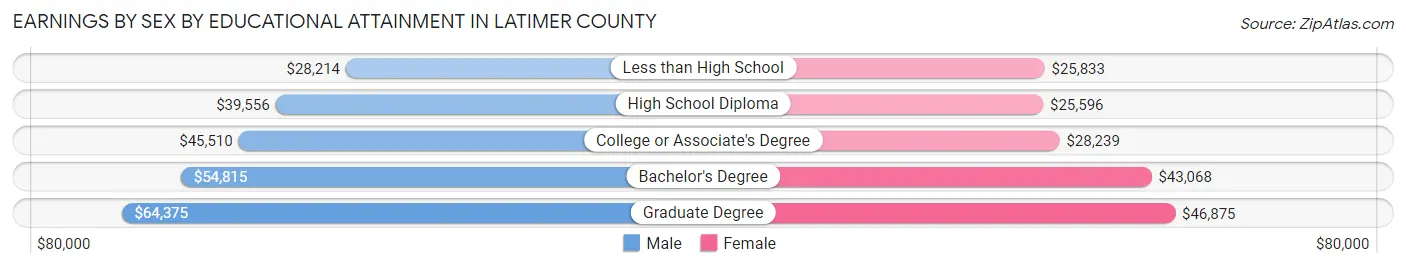
Earnings by Sex by Educational Attainment in Latimer County
Average earnings in Latimer County are $43,390 for men and $28,857 for women, a difference of 33.5%. Men with an educational attainment of graduate degree enjoy the highest average annual earnings of $64,375, while those with less than high school education earn the least with $28,214. Women with an educational attainment of graduate degree earn the most with the average annual earnings of $46,875, while those with high school diploma education have the smallest earnings of $25,596.
| Educational Attainment | Male Income | Female Income |
| Less than High School | $28,214 | $25,833 |
| High School Diploma | $39,556 | $25,596 |
| College or Associate's Degree | $45,510 | $28,239 |
| Bachelor's Degree | $54,815 | $43,068 |
| Graduate Degree | $64,375 | $46,875 |
| Total | $43,390 | $28,857 |
Family Income in Latimer County
Family Income Brackets in Latimer County
According to the Latimer County family income data, there are 605 families falling into the $50,000 to $74,999 income range, which is the most common income bracket and makes up 22.3% of all families. Conversely, the $200,000+ income bracket is the least frequent group with only 76 families (2.8%) belonging to this category.
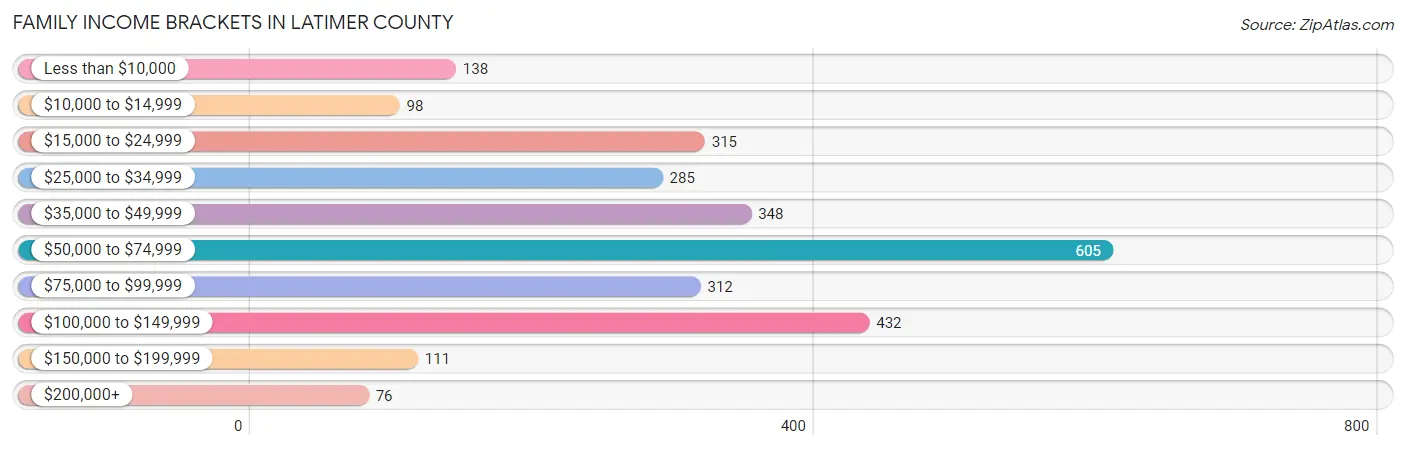
| Income Bracket | # Families | % Families |
| Less than $10,000 | 138 | 5.1% |
| $10,000 to $14,999 | 98 | 3.6% |
| $15,000 to $24,999 | 315 | 11.6% |
| $25,000 to $34,999 | 285 | 10.5% |
| $35,000 to $49,999 | 348 | 12.8% |
| $50,000 to $74,999 | 605 | 22.3% |
| $75,000 to $99,999 | 312 | 11.5% |
| $100,000 to $149,999 | 432 | 15.9% |
| $150,000 to $199,999 | 111 | 4.1% |
| $200,000+ | 76 | 2.8% |
Family Income by Famaliy Size in Latimer County
5-person families (229 | 8.4%) account for the highest median family income in Latimer County with $68,264 per family, while 2-person families (1,473 | 54.2%) have the highest median income of $25,356 per family member.
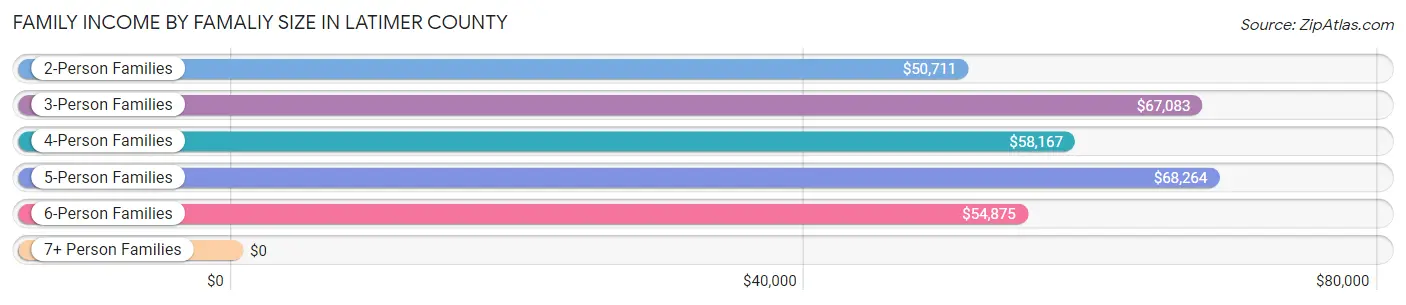
| Income Bracket | # Families | Median Income |
| 2-Person Families | 1,473 (54.2%) | $50,711 |
| 3-Person Families | 435 (16.0%) | $67,083 |
| 4-Person Families | 536 (19.7%) | $58,167 |
| 5-Person Families | 229 (8.4%) | $68,264 |
| 6-Person Families | 19 (0.7%) | $54,875 |
| 7+ Person Families | 23 (0.9%) | $0 |
| Total | 2,715 (100.0%) | $57,564 |
Family Income by Number of Earners in Latimer County
The median family income in Latimer County is $57,564, with families comprising 3+ earners (144) having the highest median family income of $112,500, while families with no earners (679) have the lowest median family income of $33,945, accounting for 5.3% and 25.0% of families, respectively.
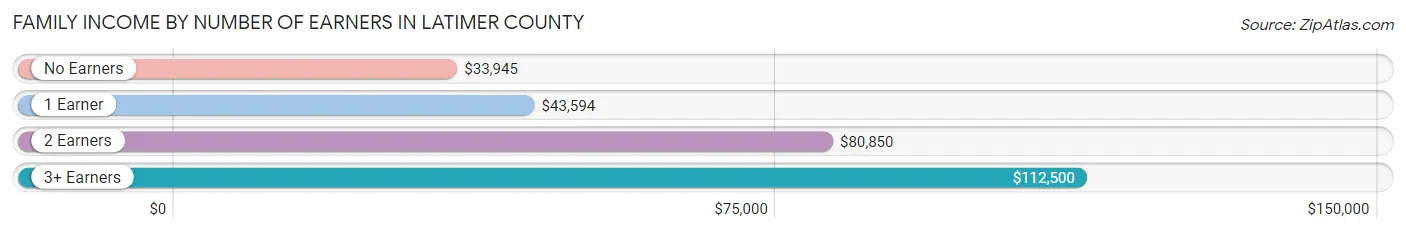
| Number of Earners | # Families | Median Income |
| No Earners | 679 (25.0%) | $33,945 |
| 1 Earner | 955 (35.2%) | $43,594 |
| 2 Earners | 937 (34.5%) | $80,850 |
| 3+ Earners | 144 (5.3%) | $112,500 |
| Total | 2,715 (100.0%) | $57,564 |
Household Income in Latimer County
Household Income Brackets in Latimer County
With 701 households falling in the category, the $50,000 to $74,999 income range is the most frequent in Latimer County, accounting for 18.2% of all households. In contrast, only 89 households (2.3%) fall into the $200,000+ income bracket, making it the least populous group.
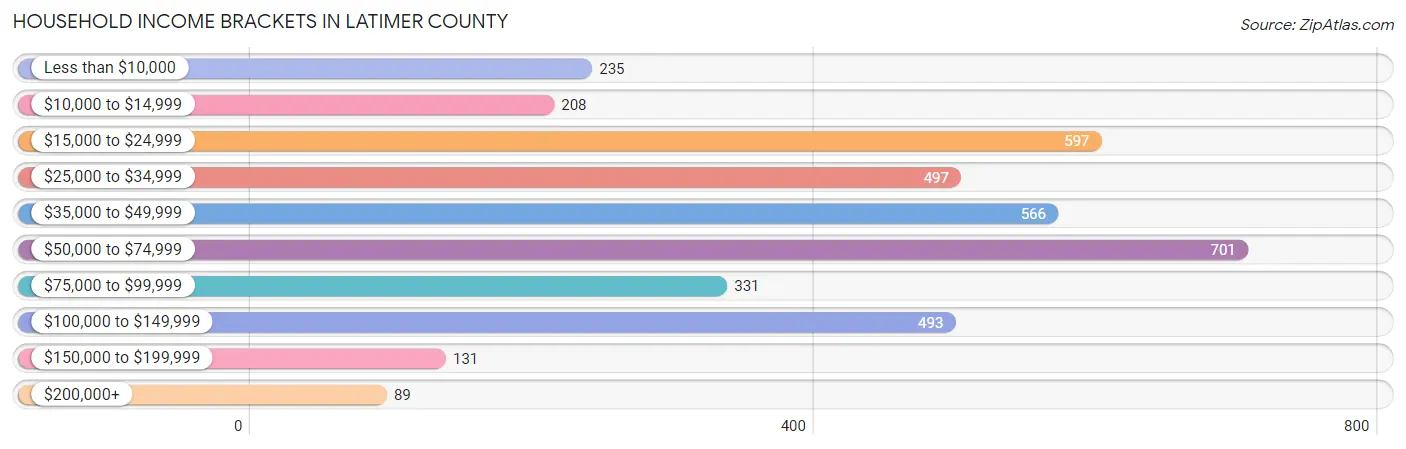
| Income Bracket | # Households | % Households |
| Less than $10,000 | 235 | 6.1% |
| $10,000 to $14,999 | 208 | 5.4% |
| $15,000 to $24,999 | 597 | 15.5% |
| $25,000 to $34,999 | 497 | 12.9% |
| $35,000 to $49,999 | 566 | 14.7% |
| $50,000 to $74,999 | 701 | 18.2% |
| $75,000 to $99,999 | 331 | 8.6% |
| $100,000 to $149,999 | 493 | 12.8% |
| $150,000 to $199,999 | 131 | 3.4% |
| $200,000+ | 89 | 2.3% |
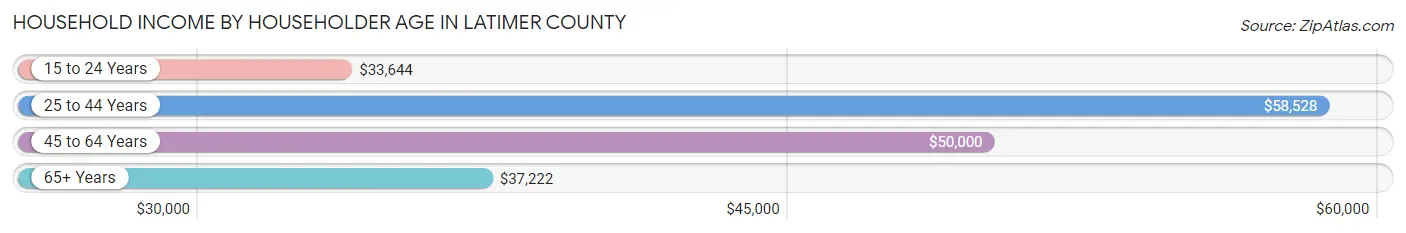
Household Income by Householder Age in Latimer County
The median household income in Latimer County is $42,735, with the highest median household income of $58,528 found in the 25 to 44 years age bracket for the primary householder. A total of 1,063 households (27.6%) fall into this category. Meanwhile, the 15 to 24 years age bracket for the primary householder has the lowest median household income of $33,644, with 235 households (6.1%) in this group.
| Income Bracket | # Households | Median Income |
| 15 to 24 Years | 235 (6.1%) | $33,644 |
| 25 to 44 Years | 1,063 (27.6%) | $58,528 |
| 45 to 64 Years | 1,308 (34.0%) | $50,000 |
| 65+ Years | 1,246 (32.4%) | $37,222 |
| Total | 3,852 (100.0%) | $42,735 |
Poverty in Latimer County
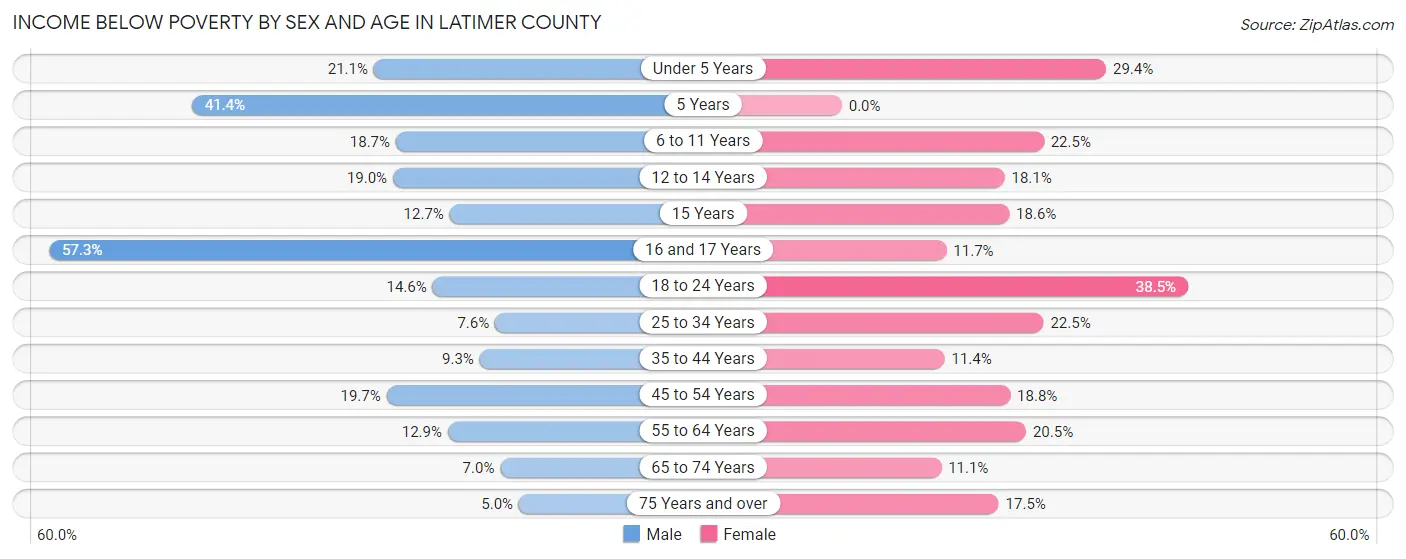
Income Below Poverty by Sex and Age in Latimer County
With 13.8% poverty level for males and 19.6% for females among the residents of Latimer County, 16 and 17 year old males and 18 to 24 year old females are the most vulnerable to poverty, with 59 males (57.3%) and 116 females (38.5%) in their respective age groups living below the poverty level.
| Age Bracket | Male | Female |
| Under 5 Years | 57 (21.1%) | 88 (29.4%) |
| 5 Years | 12 (41.4%) | 0 (0.0%) |
| 6 to 11 Years | 69 (18.6%) | 76 (22.5%) |
| 12 to 14 Years | 41 (19.0%) | 31 (18.1%) |
| 15 Years | 10 (12.7%) | 11 (18.6%) |
| 16 and 17 Years | 59 (57.3%) | 12 (11.7%) |
| 18 to 24 Years | 66 (14.6%) | 116 (38.5%) |
| 25 to 34 Years | 34 (7.6%) | 126 (22.5%) |
| 35 to 44 Years | 56 (9.3%) | 62 (11.4%) |
| 45 to 54 Years | 103 (19.7%) | 96 (18.8%) |
| 55 to 64 Years | 78 (12.9%) | 129 (20.5%) |
| 65 to 74 Years | 35 (7.0%) | 57 (11.1%) |
| 75 Years and over | 22 (5.0%) | 76 (17.5%) |
| Total | 642 (13.8%) | 880 (19.6%) |
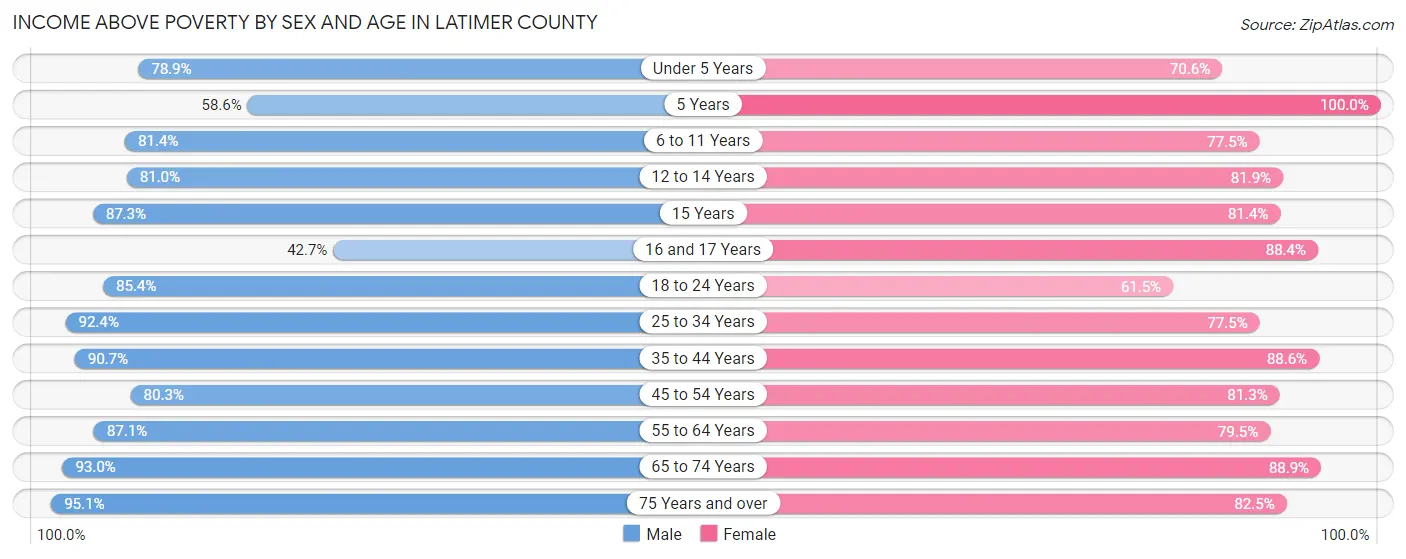
Income Above Poverty by Sex and Age in Latimer County
According to the poverty statistics in Latimer County, males aged 75 years and over and females aged 5 years are the age groups that are most secure financially, with 95.1% of males and 100.0% of females in these age groups living above the poverty line.
| Age Bracket | Male | Female |
| Under 5 Years | 213 (78.9%) | 211 (70.6%) |
| 5 Years | 17 (58.6%) | 32 (100.0%) |
| 6 to 11 Years | 301 (81.4%) | 262 (77.5%) |
| 12 to 14 Years | 175 (81.0%) | 140 (81.9%) |
| 15 Years | 69 (87.3%) | 48 (81.4%) |
| 16 and 17 Years | 44 (42.7%) | 91 (88.3%) |
| 18 to 24 Years | 387 (85.4%) | 185 (61.5%) |
| 25 to 34 Years | 413 (92.4%) | 435 (77.5%) |
| 35 to 44 Years | 545 (90.7%) | 480 (88.6%) |
| 45 to 54 Years | 420 (80.3%) | 416 (81.2%) |
| 55 to 64 Years | 528 (87.1%) | 500 (79.5%) |
| 65 to 74 Years | 463 (93.0%) | 458 (88.9%) |
| 75 Years and over | 422 (95.1%) | 359 (82.5%) |
| Total | 3,997 (86.2%) | 3,617 (80.4%) |
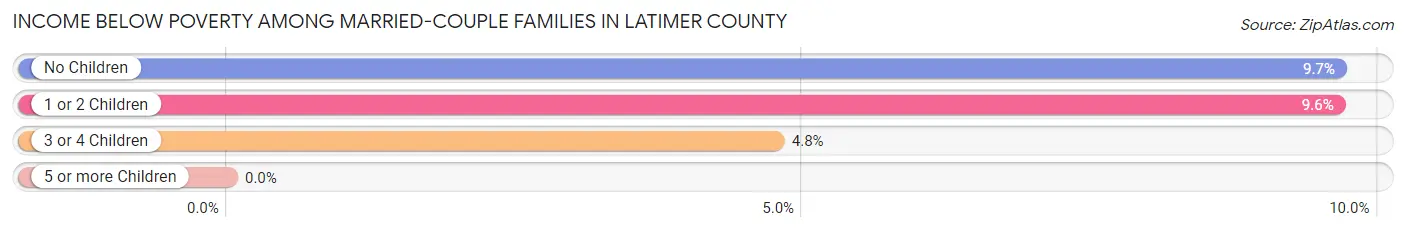
Income Below Poverty Among Married-Couple Families in Latimer County
The poverty statistics for married-couple families in Latimer County show that 9.3% or 190 of the total 2,039 families live below the poverty line. Families with no children have the highest poverty rate of 9.7%, comprising of 123 families. On the other hand, families with 5 or more children have the lowest poverty rate of 0.0%, which includes 0 families.
| Children | Above Poverty | Below Poverty |
| No Children | 1,152 (90.3%) | 123 (9.7%) |
| 1 or 2 Children | 581 (90.4%) | 62 (9.6%) |
| 3 or 4 Children | 100 (95.2%) | 5 (4.8%) |
| 5 or more Children | 16 (100.0%) | 0 (0.0%) |
| Total | 1,849 (90.7%) | 190 (9.3%) |
Income Below Poverty Among Single-Parent Households in Latimer County
According to the poverty data in Latimer County, 23.0% or 58 single-father households and 43.6% or 185 single-mother households are living below the poverty line. Among single-father households, those with 3 or 4 children have the highest poverty rate, with 11 households (78.6%) experiencing poverty. Likewise, among single-mother households, those with 5 or more children have the highest poverty rate, with 2 households (100.0%) falling below the poverty line.
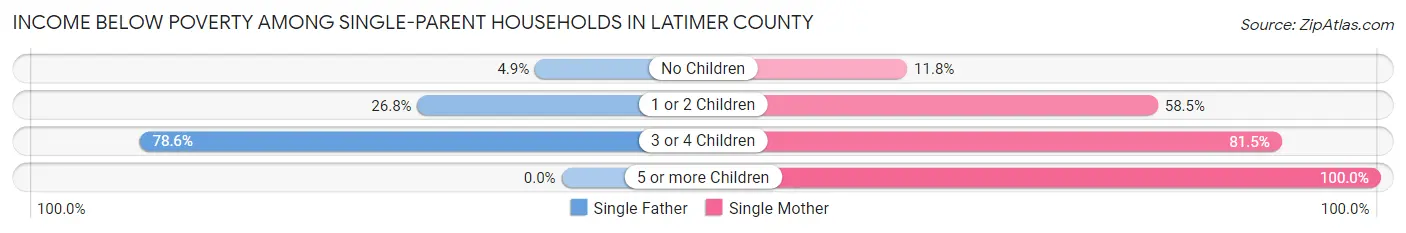
| Children | Single Father | Single Mother |
| No Children | 3 (4.9%) | 20 (11.8%) |
| 1 or 2 Children | 44 (26.8%) | 110 (58.5%) |
| 3 or 4 Children | 11 (78.6%) | 53 (81.5%) |
| 5 or more Children | 0 (0.0%) | 2 (100.0%) |
| Total | 58 (23.0%) | 185 (43.6%) |
Income Below Poverty Among Married-Couple vs Single-Parent Households in Latimer County
The poverty data for Latimer County shows that 190 of the married-couple family households (9.3%) and 243 of the single-parent households (35.9%) are living below the poverty level. Within the married-couple family households, those with no children have the highest poverty rate, with 123 households (9.7%) falling below the poverty line. Among the single-parent households, those with 3 or 4 children have the highest poverty rate, with 64 household (81.0%) living below poverty.
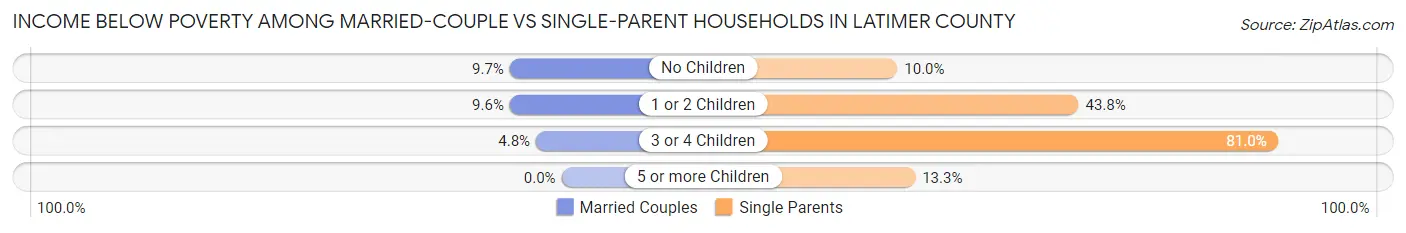
| Children | Married-Couple Families | Single-Parent Households |
| No Children | 123 (9.7%) | 23 (10.0%) |
| 1 or 2 Children | 62 (9.6%) | 154 (43.8%) |
| 3 or 4 Children | 5 (4.8%) | 64 (81.0%) |
| 5 or more Children | 0 (0.0%) | 2 (13.3%) |
| Total | 190 (9.3%) | 243 (35.9%) |
Race in Latimer County
The most populous races in Latimer County are White / Caucasian (6,036 | 63.3%), Native / Alaskan (2,297 | 24.1%), and Two or more Races (908 | 9.5%).
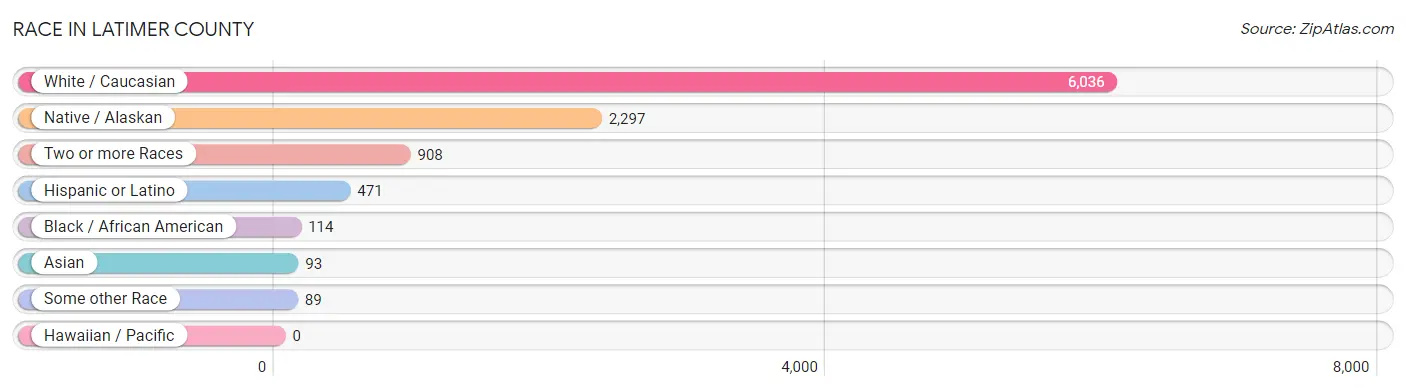
| Race | # Population | % Population |
| Asian | 93 | 1.0% |
| Black / African American | 114 | 1.2% |
| Hawaiian / Pacific | 0 | 0.0% |
| Hispanic or Latino | 471 | 4.9% |
| Native / Alaskan | 2,297 | 24.1% |
| White / Caucasian | 6,036 | 63.3% |
| Two or more Races | 908 | 9.5% |
| Some other Race | 89 | 0.9% |
| Total | 9,537 | 100.0% |
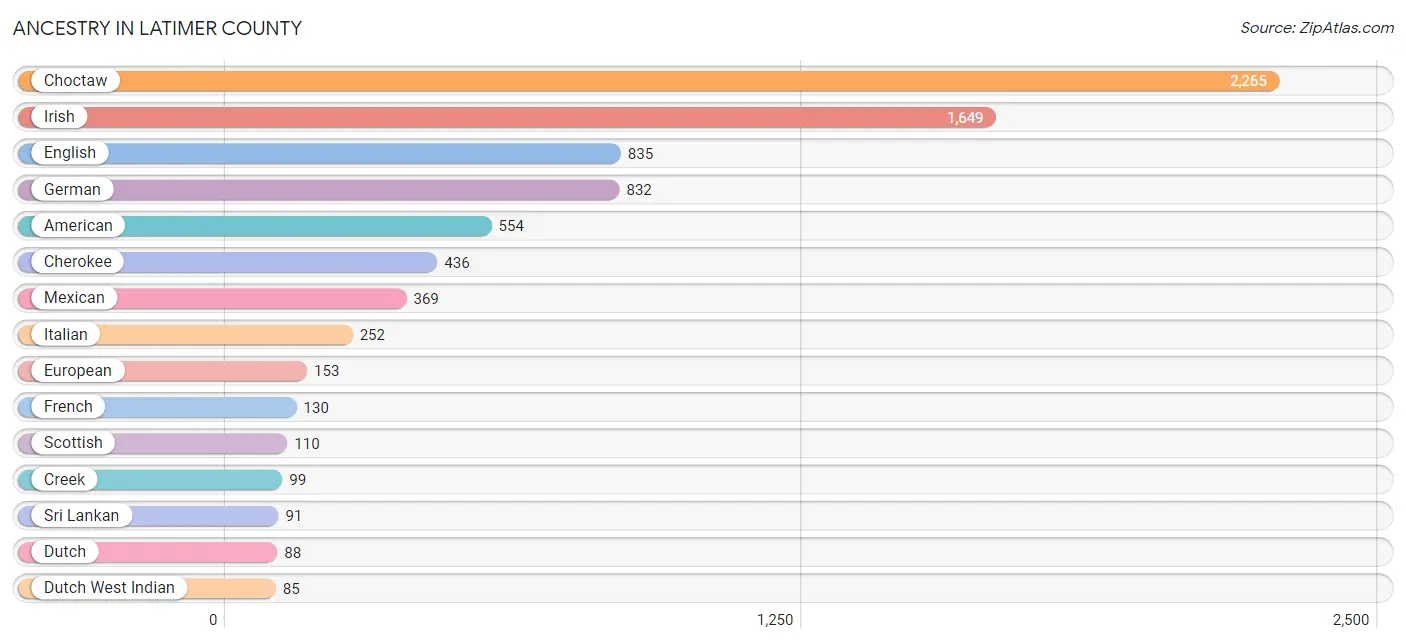
Ancestry in Latimer County
The most populous ancestries reported in Latimer County are Choctaw (2,265 | 23.7%), Irish (1,649 | 17.3%), English (835 | 8.8%), German (832 | 8.7%), and American (554 | 5.8%), together accounting for 64.3% of all Latimer County residents.
| Ancestry | # Population | % Population |
| African | 25 | 0.3% |
| American | 554 | 5.8% |
| Apache | 2 | 0.0% |
| Arab | 5 | 0.1% |
| Bhutanese | 3 | 0.0% |
| Blackfeet | 23 | 0.2% |
| British | 34 | 0.4% |
| Cajun | 3 | 0.0% |
| Cherokee | 436 | 4.6% |
| Chickasaw | 32 | 0.3% |
| Choctaw | 2,265 | 23.7% |
| Comanche | 3 | 0.0% |
| Creek | 99 | 1.0% |
| Cuban | 5 | 0.1% |
| Czech | 18 | 0.2% |
| Czechoslovakian | 7 | 0.1% |
| Danish | 4 | 0.0% |
| Dutch | 88 | 0.9% |
| Dutch West Indian | 85 | 0.9% |
| English | 835 | 8.8% |
| European | 153 | 1.6% |
| Finnish | 9 | 0.1% |
| French | 130 | 1.4% |
| French Canadian | 7 | 0.1% |
| German | 832 | 8.7% |
| Irish | 1,649 | 17.3% |
| Iroquois | 17 | 0.2% |
| Italian | 252 | 2.6% |
| Korean | 3 | 0.0% |
| Lebanese | 5 | 0.1% |
| Lithuanian | 7 | 0.1% |
| Mexican | 369 | 3.9% |
| Navajo | 15 | 0.2% |
| Norwegian | 12 | 0.1% |
| Osage | 6 | 0.1% |
| Pakistani | 16 | 0.2% |
| Peruvian | 17 | 0.2% |
| Polish | 6 | 0.1% |
| Portuguese | 16 | 0.2% |
| Potawatomi | 20 | 0.2% |
| Puerto Rican | 4 | 0.0% |
| Russian | 2 | 0.0% |
| Scandinavian | 20 | 0.2% |
| Scotch-Irish | 55 | 0.6% |
| Scottish | 110 | 1.1% |
| Seminole | 8 | 0.1% |
| Sioux | 15 | 0.2% |
| Slovene | 10 | 0.1% |
| South American | 17 | 0.2% |
| Spanish | 40 | 0.4% |
| Sri Lankan | 91 | 0.9% |
| Subsaharan African | 25 | 0.3% |
| Swedish | 54 | 0.6% |
| Swiss | 3 | 0.0% |
| Thai | 2 | 0.0% |
| Ukrainian | 15 | 0.2% |
| Welsh | 20 | 0.2% |
| Yaqui | 5 | 0.1% | View All 58 Rows |
Immigrants in Latimer County
The most numerous immigrant groups reported in Latimer County came from Central America (75 | 0.8%), Latin America (75 | 0.8%), Mexico (71 | 0.7%), Asia (61 | 0.6%), and South Eastern Asia (59 | 0.6%), together accounting for 3.6% of all Latimer County residents.
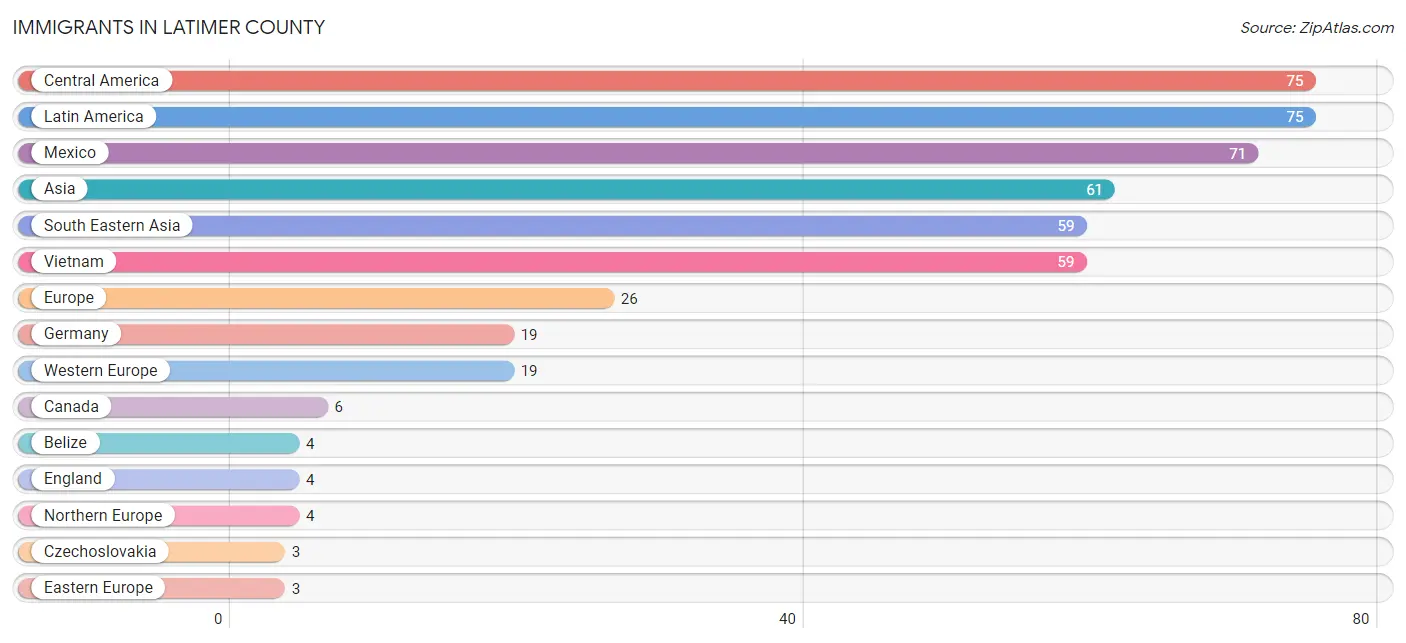
| Immigration Origin | # Population | % Population |
| Asia | 61 | 0.6% |
| Belize | 4 | 0.0% |
| Canada | 6 | 0.1% |
| Central America | 75 | 0.8% |
| Czechoslovakia | 3 | 0.0% |
| Eastern Europe | 3 | 0.0% |
| England | 4 | 0.0% |
| Europe | 26 | 0.3% |
| Germany | 19 | 0.2% |
| India | 2 | 0.0% |
| Latin America | 75 | 0.8% |
| Mexico | 71 | 0.7% |
| Northern Europe | 4 | 0.0% |
| South Central Asia | 2 | 0.0% |
| South Eastern Asia | 59 | 0.6% |
| Vietnam | 59 | 0.6% |
| Western Europe | 19 | 0.2% | View All 17 Rows |
Sex and Age in Latimer County
Sex and Age in Latimer County
The most populous age groups in Latimer County are 35 to 39 Years (365 | 7.5%) for men and 10 to 14 Years (334 | 7.1%) for women.
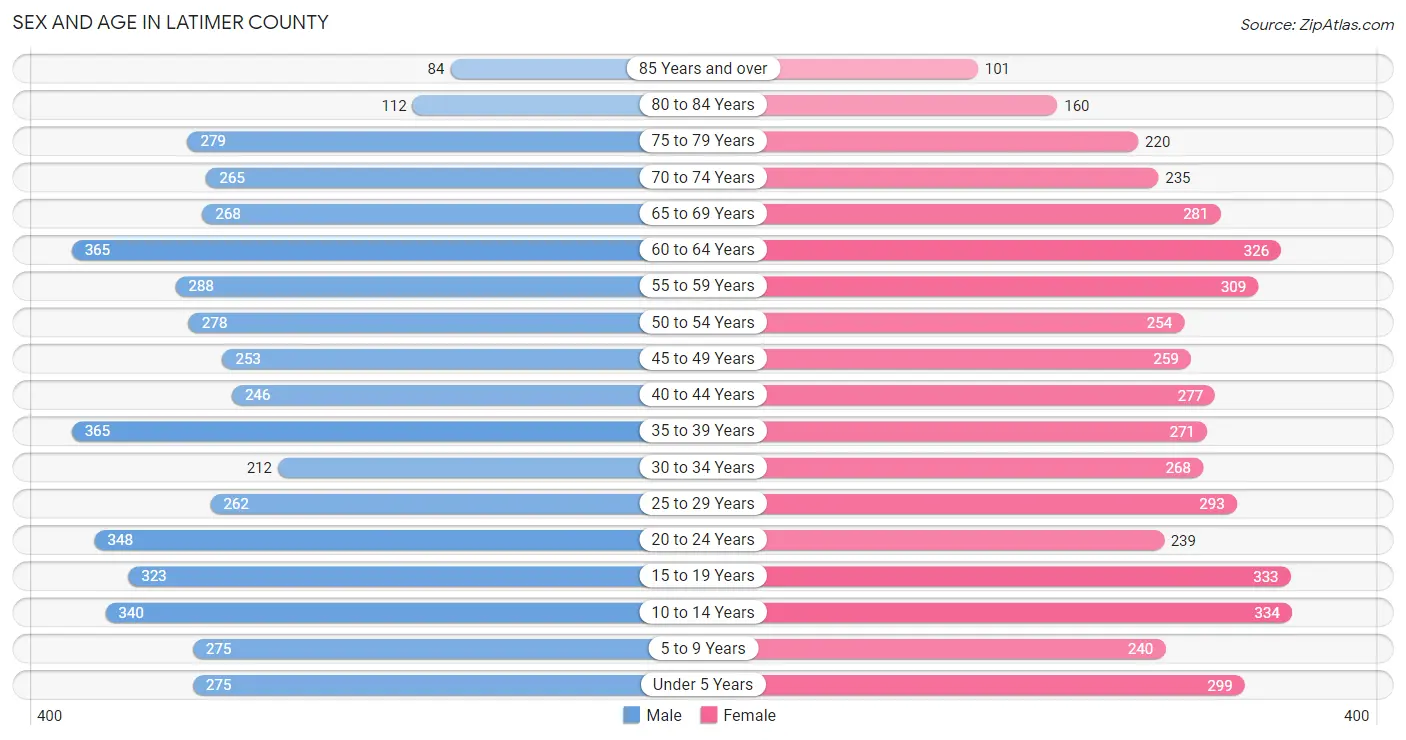
| Age Bracket | Male | Female |
| Under 5 Years | 275 (5.7%) | 299 (6.4%) |
| 5 to 9 Years | 275 (5.7%) | 240 (5.1%) |
| 10 to 14 Years | 340 (7.0%) | 334 (7.1%) |
| 15 to 19 Years | 323 (6.7%) | 333 (7.1%) |
| 20 to 24 Years | 348 (7.2%) | 239 (5.1%) |
| 25 to 29 Years | 262 (5.4%) | 293 (6.2%) |
| 30 to 34 Years | 212 (4.4%) | 268 (5.7%) |
| 35 to 39 Years | 365 (7.5%) | 271 (5.8%) |
| 40 to 44 Years | 246 (5.1%) | 277 (5.9%) |
| 45 to 49 Years | 253 (5.2%) | 259 (5.5%) |
| 50 to 54 Years | 278 (5.8%) | 254 (5.4%) |
| 55 to 59 Years | 288 (5.9%) | 309 (6.6%) |
| 60 to 64 Years | 365 (7.5%) | 326 (6.9%) |
| 65 to 69 Years | 268 (5.5%) | 281 (6.0%) |
| 70 to 74 Years | 265 (5.5%) | 235 (5.0%) |
| 75 to 79 Years | 279 (5.8%) | 220 (4.7%) |
| 80 to 84 Years | 112 (2.3%) | 160 (3.4%) |
| 85 Years and over | 84 (1.7%) | 101 (2.1%) |
| Total | 4,838 (100.0%) | 4,699 (100.0%) |
Families and Households in Latimer County
Median Family Size in Latimer County
The median family size in Latimer County is 2.84 persons per family, with married-couple families (2,039 | 75.1%) accounting for the largest median family size of 2.86 persons per family. On the other hand, single female/mother families (424 | 15.6%) represent the smallest median family size with 2.75 persons per family.
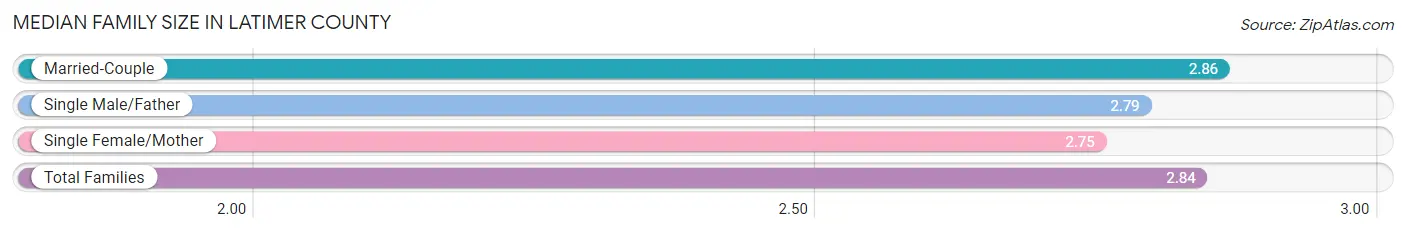
| Family Type | # Families | Family Size |
| Married-Couple | 2,039 (75.1%) | 2.86 |
| Single Male/Father | 252 (9.3%) | 2.79 |
| Single Female/Mother | 424 (15.6%) | 2.75 |
| Total Families | 2,715 (100.0%) | 2.84 |
Median Household Size in Latimer County
The median household size in Latimer County is 2.37 persons per household, with single male/father households (252 | 6.5%) accounting for the largest median household size of 3.21 persons per household. non-family households (1,137 | 29.5%) represent the smallest median household size with 1.08 persons per household.
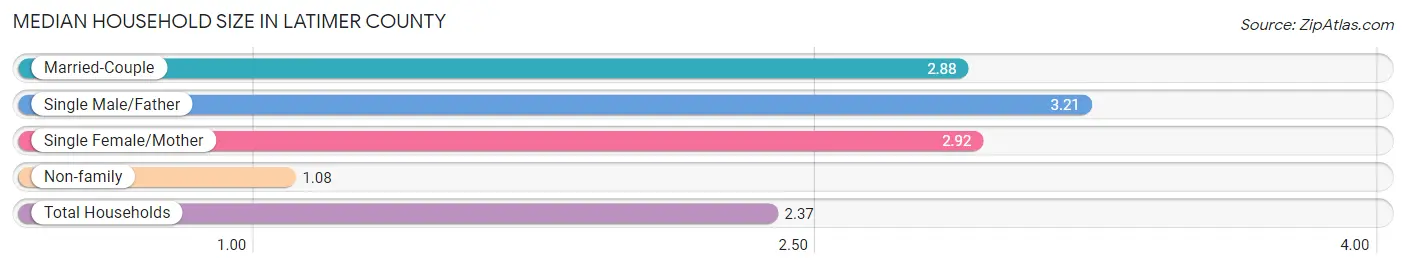
| Household Type | # Households | Household Size |
| Married-Couple | 2,039 (52.9%) | 2.88 |
| Single Male/Father | 252 (6.5%) | 3.21 |
| Single Female/Mother | 424 (11.0%) | 2.92 |
| Non-family | 1,137 (29.5%) | 1.08 |
| Total Households | 3,852 (100.0%) | 2.37 |
Household Size by Marriage Status in Latimer County
Out of a total of 3,852 households in Latimer County, 2,715 (70.5%) are family households, while 1,137 (29.5%) are nonfamily households. The most numerous type of family households are 2-person households, comprising 1,382, and the most common type of nonfamily households are 1-person households, comprising 1,038.
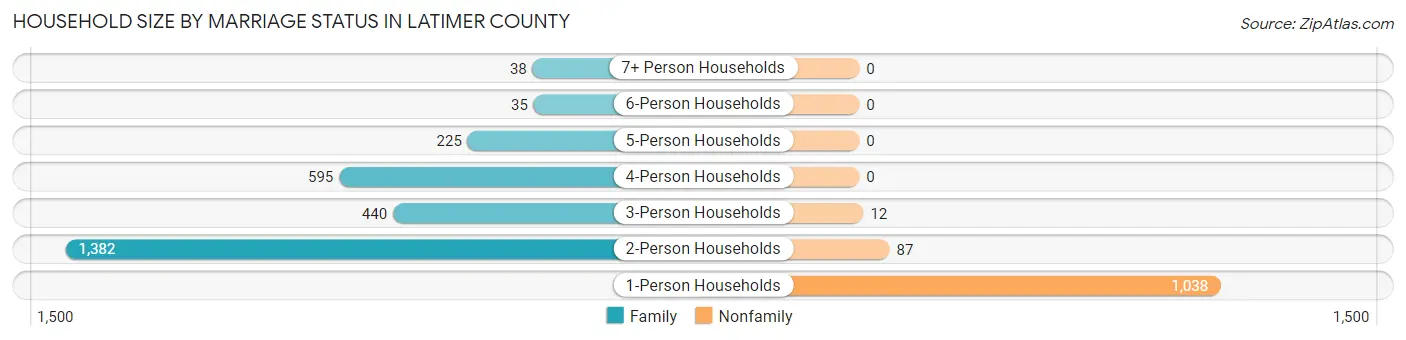
| Household Size | Family Households | Nonfamily Households |
| 1-Person Households | - | 1,038 (27.0%) |
| 2-Person Households | 1,382 (35.9%) | 87 (2.3%) |
| 3-Person Households | 440 (11.4%) | 12 (0.3%) |
| 4-Person Households | 595 (15.4%) | 0 (0.0%) |
| 5-Person Households | 225 (5.8%) | 0 (0.0%) |
| 6-Person Households | 35 (0.9%) | 0 (0.0%) |
| 7+ Person Households | 38 (1.0%) | 0 (0.0%) |
| Total | 2,715 (70.5%) | 1,137 (29.5%) |
Female Fertility in Latimer County
Fertility by Age in Latimer County
Average fertility rate in Latimer County is 51.0 births per 1,000 women. Women in the age bracket of 20 to 34 years have the highest fertility rate with 106.0 births per 1,000 women. Women in the age bracket of 20 to 34 years acount for 85.0% of all women with births.
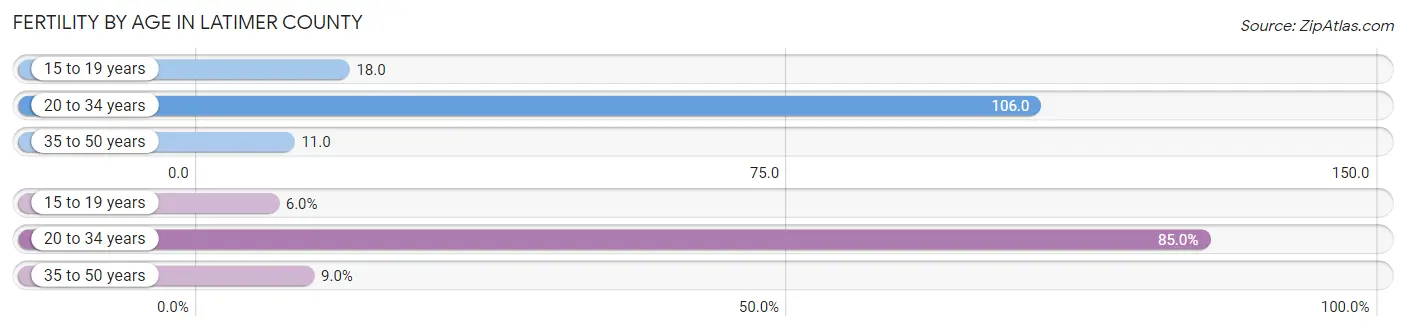
| Age Bracket | Women with Births | Births / 1,000 Women |
| 15 to 19 years | 6 (6.0%) | 18.0 |
| 20 to 34 years | 85 (85.0%) | 106.0 |
| 35 to 50 years | 9 (9.0%) | 11.0 |
| Total | 100 (100.0%) | 51.0 |
Fertility by Age by Marriage Status in Latimer County
77.0% of women with births (100) in Latimer County are married. The highest percentage of unmarried women with births falls into 15 to 19 years age bracket with 100.0% of them unmarried at the time of birth, while the lowest percentage of unmarried women with births belong to 35 to 50 years age bracket with 0.0% of them unmarried.
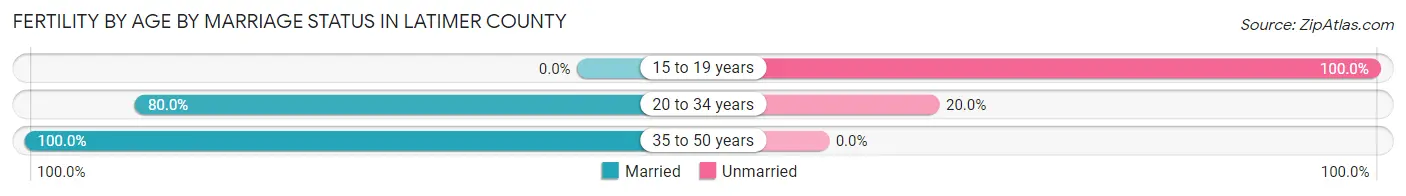
| Age Bracket | Married | Unmarried |
| 15 to 19 years | 0 (0.0%) | 6 (100.0%) |
| 20 to 34 years | 68 (80.0%) | 17 (20.0%) |
| 35 to 50 years | 9 (100.0%) | 0 (0.0%) |
| Total | 77 (77.0%) | 23 (23.0%) |
Fertility by Education in Latimer County
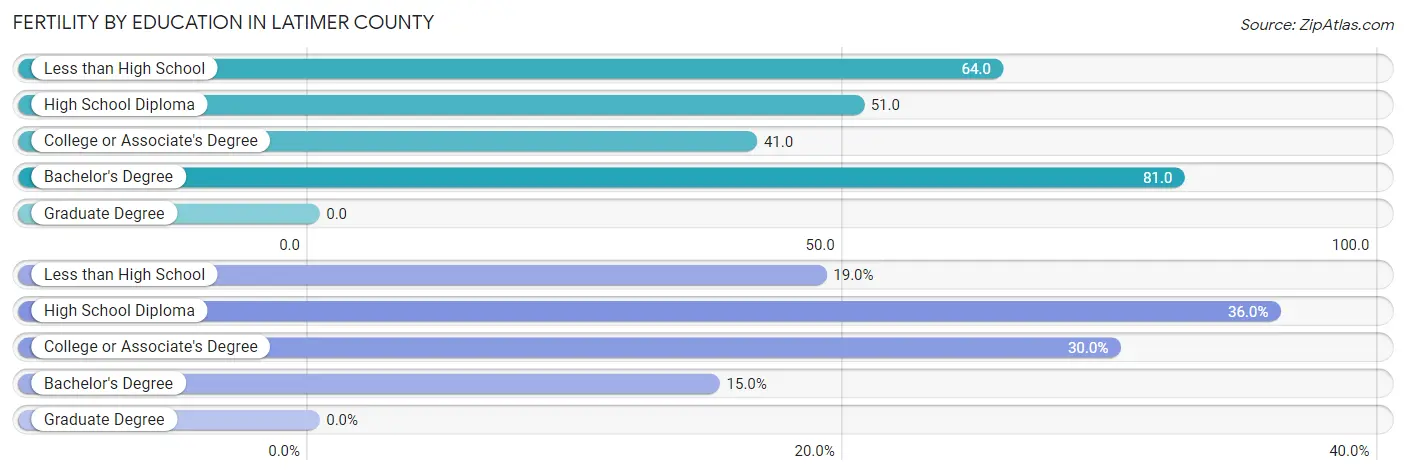
| Educational Attainment | Women with Births | Births / 1,000 Women |
| Less than High School | 19 (19.0%) | 64.0 |
| High School Diploma | 36 (36.0%) | 51.0 |
| College or Associate's Degree | 30 (30.0%) | 41.0 |
| Bachelor's Degree | 15 (15.0%) | 81.0 |
| Graduate Degree | 0 (0.0%) | 0.0 |
| Total | 100 (100.0%) | 51.0 |
Fertility by Education by Marriage Status in Latimer County
23.0% of women with births in Latimer County are unmarried. Women with the educational attainment of college or associate's degree are most likely to be married with 100.0% of them married at childbirth, while women with the educational attainment of high school diploma are least likely to be married with 47.2% of them unmarried at childbirth.
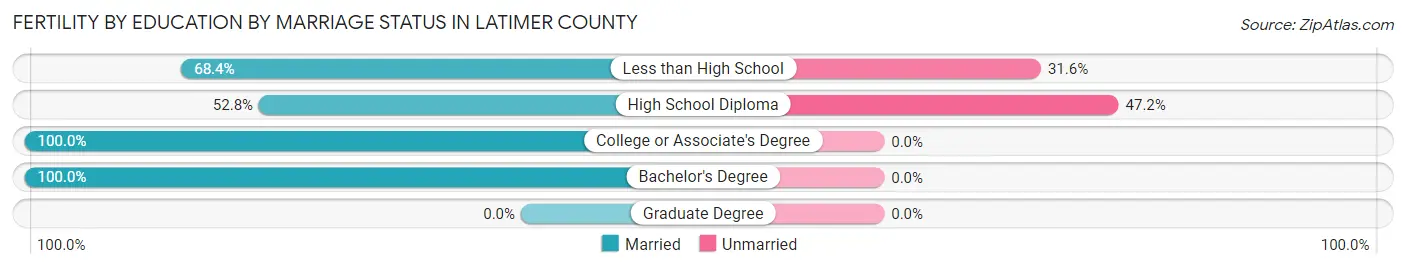
| Educational Attainment | Married | Unmarried |
| Less than High School | 13 (68.4%) | 6 (31.6%) |
| High School Diploma | 19 (52.8%) | 17 (47.2%) |
| College or Associate's Degree | 30 (100.0%) | 0 (0.0%) |
| Bachelor's Degree | 15 (100.0%) | 0 (0.0%) |
| Graduate Degree | 0 (0.0%) | 0 (0.0%) |
| Total | 77 (77.0%) | 23 (23.0%) |
Employment Characteristics in Latimer County
Employment by Class of Employer in Latimer County
Among the 3,509 employed individuals in Latimer County, private company employees (2,026 | 57.7%), local government employees (375 | 10.7%), and state government employees (311 | 8.9%) make up the most common classes of employment.
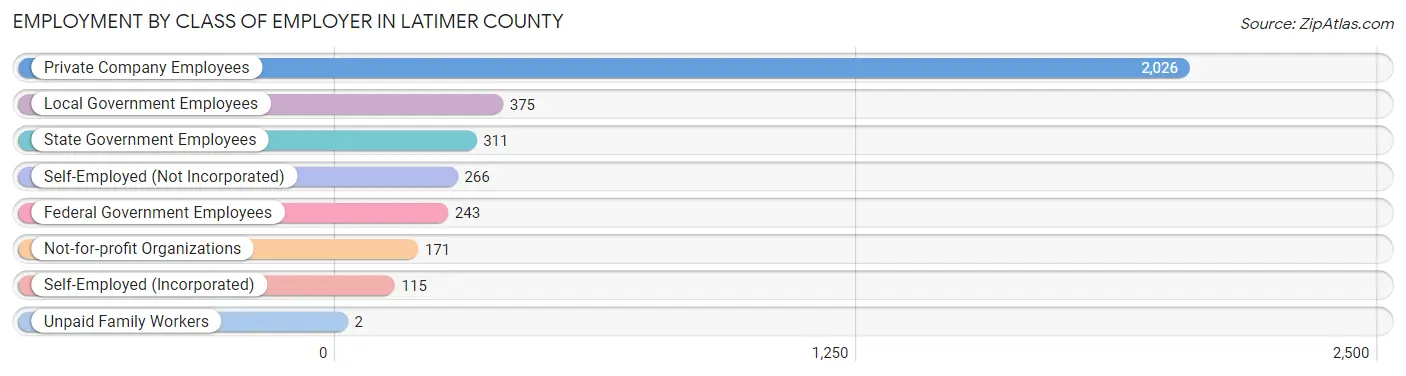
| Employer Class | # Employees | % Employees |
| Private Company Employees | 2,026 | 57.7% |
| Self-Employed (Incorporated) | 115 | 3.3% |
| Self-Employed (Not Incorporated) | 266 | 7.6% |
| Not-for-profit Organizations | 171 | 4.9% |
| Local Government Employees | 375 | 10.7% |
| State Government Employees | 311 | 8.9% |
| Federal Government Employees | 243 | 6.9% |
| Unpaid Family Workers | 2 | 0.1% |
| Total | 3,509 | 100.0% |
Employment Status by Age in Latimer County
According to the labor force statistics for Latimer County, out of the total population over 16 years of age (7,636), 50.6% or 3,864 individuals are in the labor force, with 7.8% or 301 of them unemployed. The age group with the highest labor force participation rate is 35 to 44 years, with 77.3% or 896 individuals in the labor force. Within the labor force, the 16 to 19 years age range has the highest percentage of unemployed individuals, with 28.2% or 51 of them being unemployed.
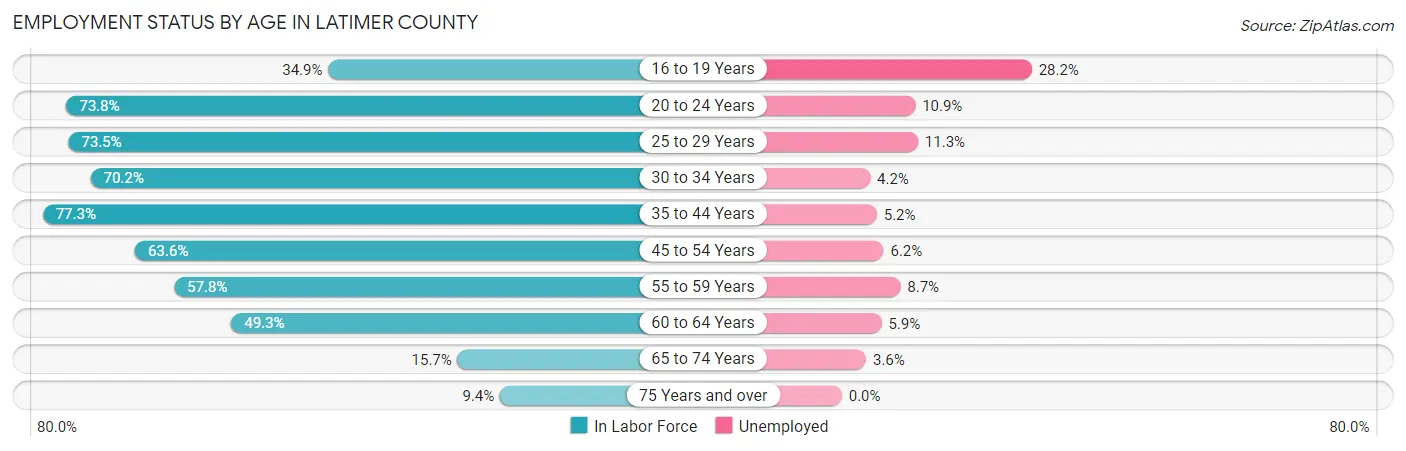
| Age Bracket | In Labor Force | Unemployed |
| 16 to 19 Years | 181 (34.9%) | 51 (28.2%) |
| 20 to 24 Years | 433 (73.8%) | 47 (10.9%) |
| 25 to 29 Years | 408 (73.5%) | 46 (11.3%) |
| 30 to 34 Years | 337 (70.2%) | 14 (4.2%) |
| 35 to 44 Years | 896 (77.3%) | 47 (5.2%) |
| 45 to 54 Years | 664 (63.6%) | 41 (6.2%) |
| 55 to 59 Years | 345 (57.8%) | 30 (8.7%) |
| 60 to 64 Years | 341 (49.3%) | 20 (5.9%) |
| 65 to 74 Years | 165 (15.7%) | 6 (3.6%) |
| 75 Years and over | 90 (9.4%) | 0 (0.0%) |
| Total | 3,864 (50.6%) | 301 (7.8%) |
Employment Status by Educational Attainment in Latimer County
According to labor force statistics for Latimer County, 66.1% of individuals (2,992) out of the total population between 25 and 64 years of age (4,526) are in the labor force, with 6.6% or 197 of them being unemployed. The group with the highest labor force participation rate are those with the educational attainment of bachelor's degree or higher, with 77.4% or 458 individuals in the labor force. Within the labor force, individuals with less than high school education have the highest percentage of unemployment, with 11.3% or 35 of them being unemployed.
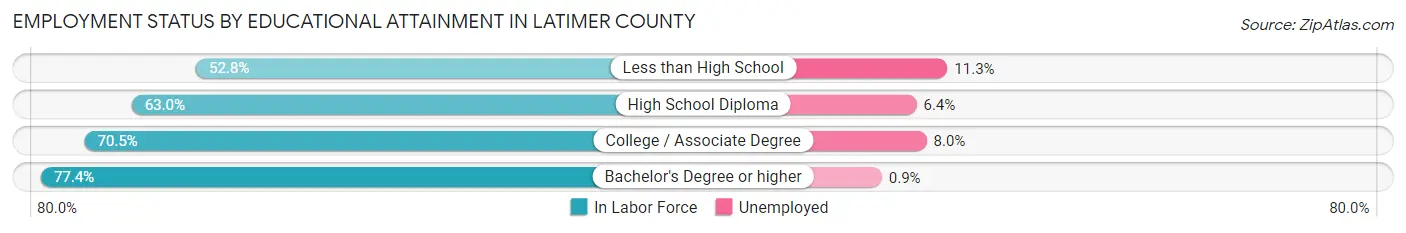
| Educational Attainment | In Labor Force | Unemployed |
| Less than High School | 310 (52.8%) | 66 (11.3%) |
| High School Diploma | 1,143 (63.0%) | 116 (6.4%) |
| College / Associate Degree | 1,080 (70.5%) | 123 (8.0%) |
| Bachelor's Degree or higher | 458 (77.4%) | 5 (0.9%) |
| Total | 2,992 (66.1%) | 299 (6.6%) |
Employment Occupations by Sex in Latimer County
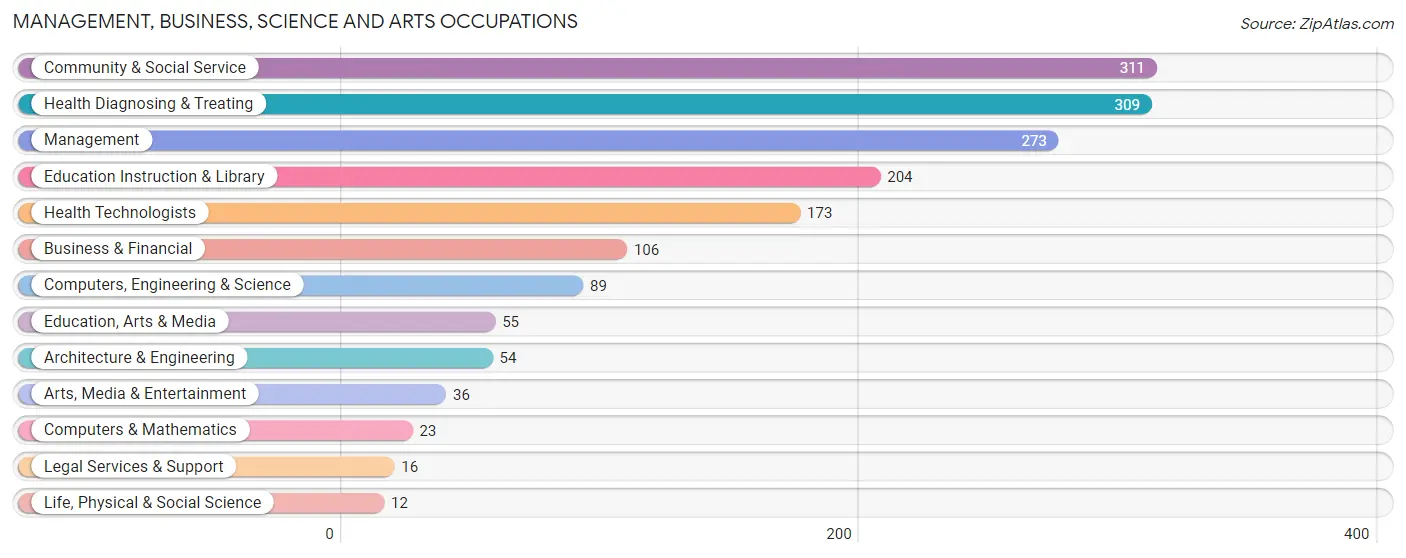
Management, Business, Science and Arts Occupations
The most common Management, Business, Science and Arts occupations in Latimer County are Community & Social Service (311 | 8.7%), Health Diagnosing & Treating (309 | 8.7%), Management (273 | 7.7%), Education Instruction & Library (204 | 5.7%), and Health Technologists (173 | 4.9%).
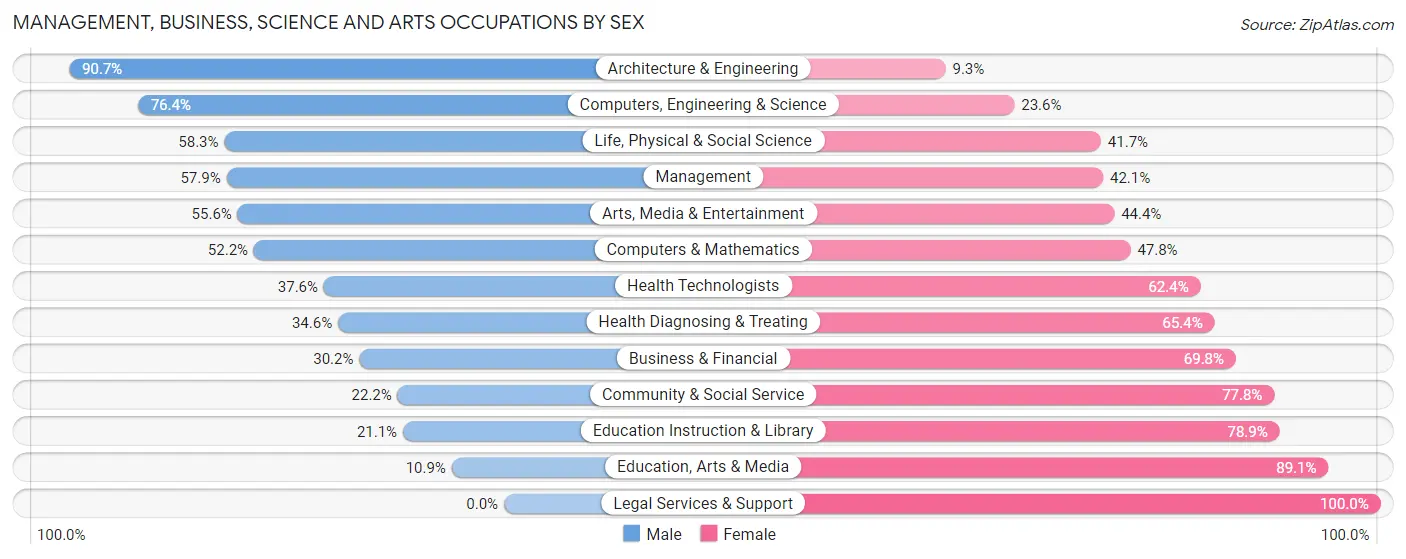
Management, Business, Science and Arts Occupations by Sex
Within the Management, Business, Science and Arts occupations in Latimer County, the most male-oriented occupations are Architecture & Engineering (90.7%), Computers, Engineering & Science (76.4%), and Life, Physical & Social Science (58.3%), while the most female-oriented occupations are Legal Services & Support (100.0%), Education, Arts & Media (89.1%), and Education Instruction & Library (78.9%).
| Occupation | Male | Female |
| Management | 158 (57.9%) | 115 (42.1%) |
| Business & Financial | 32 (30.2%) | 74 (69.8%) |
| Computers, Engineering & Science | 68 (76.4%) | 21 (23.6%) |
| Computers & Mathematics | 12 (52.2%) | 11 (47.8%) |
| Architecture & Engineering | 49 (90.7%) | 5 (9.3%) |
| Life, Physical & Social Science | 7 (58.3%) | 5 (41.7%) |
| Community & Social Service | 69 (22.2%) | 242 (77.8%) |
| Education, Arts & Media | 6 (10.9%) | 49 (89.1%) |
| Legal Services & Support | 0 (0.0%) | 16 (100.0%) |
| Education Instruction & Library | 43 (21.1%) | 161 (78.9%) |
| Arts, Media & Entertainment | 20 (55.6%) | 16 (44.4%) |
| Health Diagnosing & Treating | 107 (34.6%) | 202 (65.4%) |
| Health Technologists | 65 (37.6%) | 108 (62.4%) |
| Total (Category) | 434 (39.9%) | 654 (60.1%) |
| Total (Overall) | 1,929 (54.2%) | 1,629 (45.8%) |
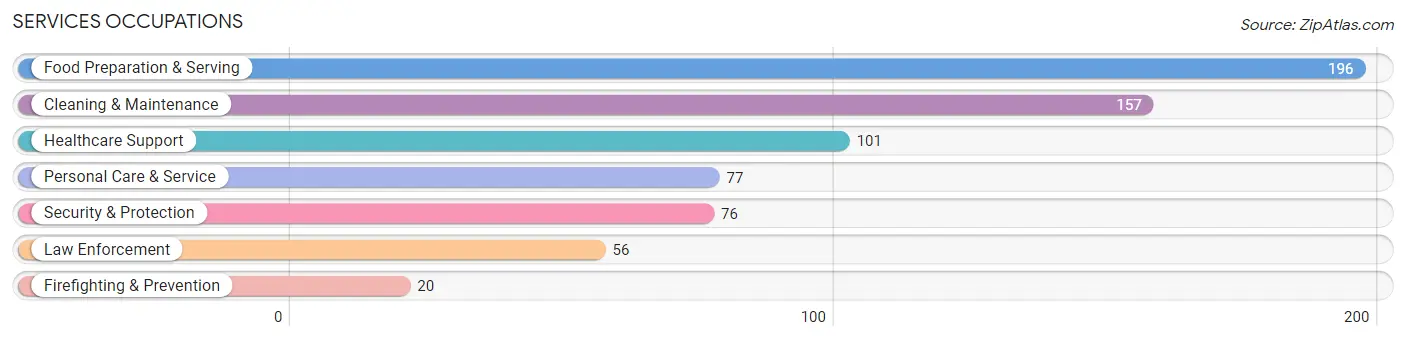
Services Occupations
The most common Services occupations in Latimer County are Food Preparation & Serving (196 | 5.5%), Cleaning & Maintenance (157 | 4.4%), Healthcare Support (101 | 2.8%), Personal Care & Service (77 | 2.2%), and Security & Protection (76 | 2.1%).
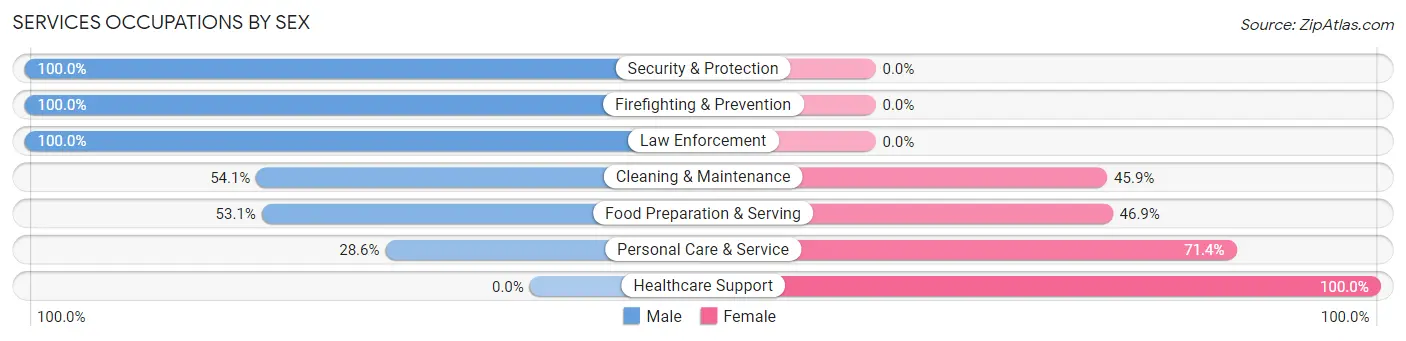
Services Occupations by Sex
Within the Services occupations in Latimer County, the most male-oriented occupations are Security & Protection (100.0%), Firefighting & Prevention (100.0%), and Law Enforcement (100.0%), while the most female-oriented occupations are Healthcare Support (100.0%), Personal Care & Service (71.4%), and Food Preparation & Serving (46.9%).
| Occupation | Male | Female |
| Healthcare Support | 0 (0.0%) | 101 (100.0%) |
| Security & Protection | 76 (100.0%) | 0 (0.0%) |
| Firefighting & Prevention | 20 (100.0%) | 0 (0.0%) |
| Law Enforcement | 56 (100.0%) | 0 (0.0%) |
| Food Preparation & Serving | 104 (53.1%) | 92 (46.9%) |
| Cleaning & Maintenance | 85 (54.1%) | 72 (45.9%) |
| Personal Care & Service | 22 (28.6%) | 55 (71.4%) |
| Total (Category) | 287 (47.3%) | 320 (52.7%) |
| Total (Overall) | 1,929 (54.2%) | 1,629 (45.8%) |
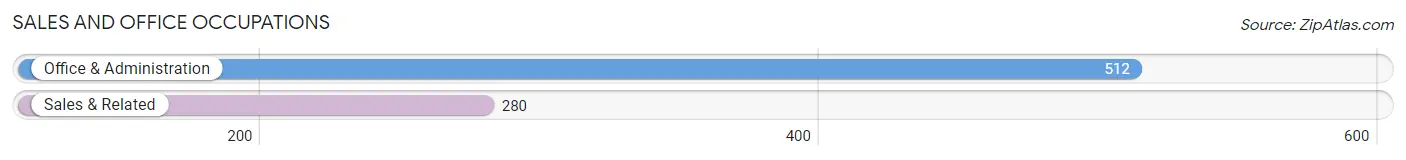
Sales and Office Occupations
The most common Sales and Office occupations in Latimer County are Office & Administration (512 | 14.4%), and Sales & Related (280 | 7.9%).
Sales and Office Occupations by Sex
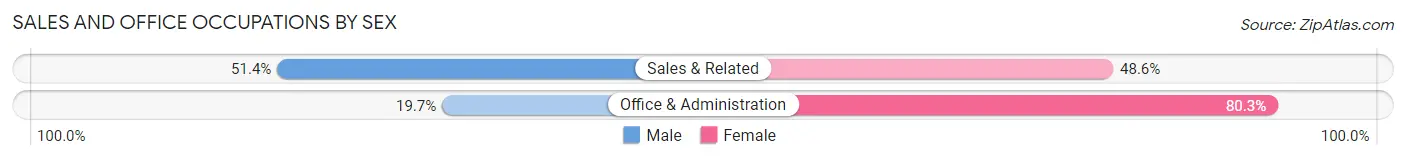
| Occupation | Male | Female |
| Sales & Related | 144 (51.4%) | 136 (48.6%) |
| Office & Administration | 101 (19.7%) | 411 (80.3%) |
| Total (Category) | 245 (30.9%) | 547 (69.1%) |
| Total (Overall) | 1,929 (54.2%) | 1,629 (45.8%) |
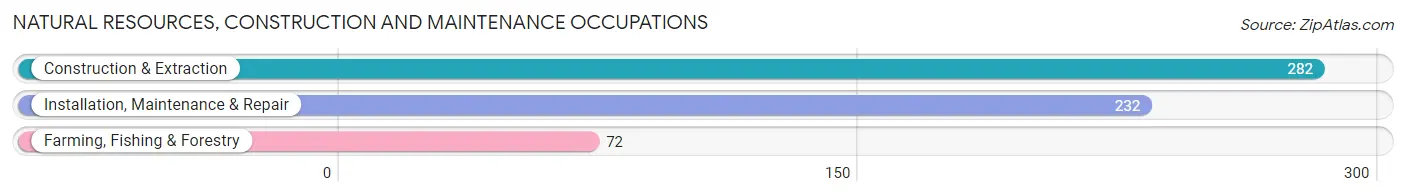
Natural Resources, Construction and Maintenance Occupations
The most common Natural Resources, Construction and Maintenance occupations in Latimer County are Construction & Extraction (282 | 7.9%), Installation, Maintenance & Repair (232 | 6.5%), and Farming, Fishing & Forestry (72 | 2.0%).
Natural Resources, Construction and Maintenance Occupations by Sex
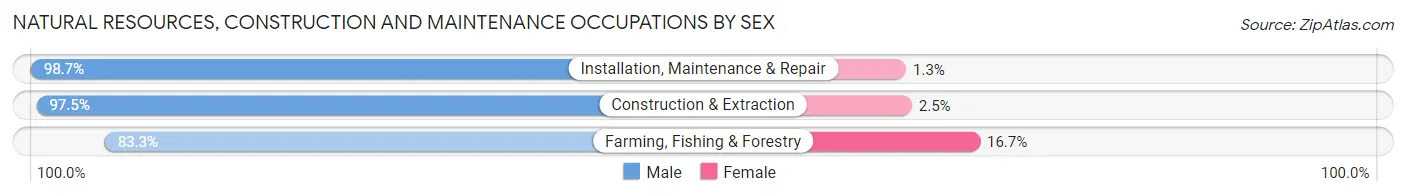
| Occupation | Male | Female |
| Farming, Fishing & Forestry | 60 (83.3%) | 12 (16.7%) |
| Construction & Extraction | 275 (97.5%) | 7 (2.5%) |
| Installation, Maintenance & Repair | 229 (98.7%) | 3 (1.3%) |
| Total (Category) | 564 (96.3%) | 22 (3.7%) |
| Total (Overall) | 1,929 (54.2%) | 1,629 (45.8%) |
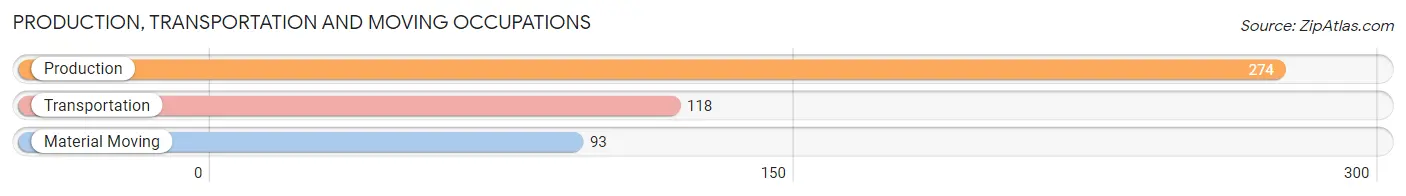
Production, Transportation and Moving Occupations
The most common Production, Transportation and Moving occupations in Latimer County are Production (274 | 7.7%), Transportation (118 | 3.3%), and Material Moving (93 | 2.6%).
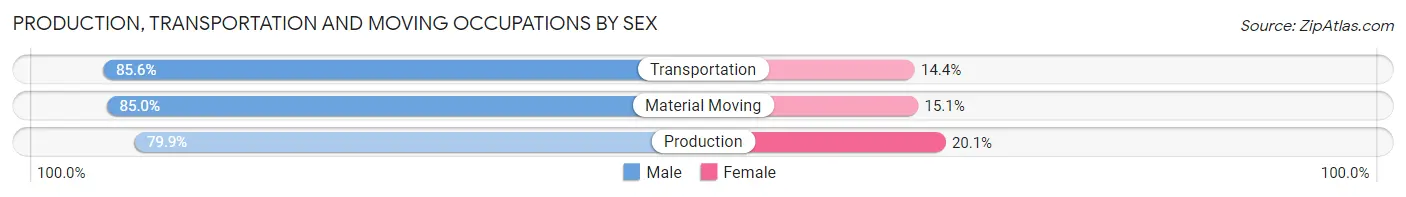
Production, Transportation and Moving Occupations by Sex
| Occupation | Male | Female |
| Production | 219 (79.9%) | 55 (20.1%) |
| Transportation | 101 (85.6%) | 17 (14.4%) |
| Material Moving | 79 (85.0%) | 14 (15.0%) |
| Total (Category) | 399 (82.3%) | 86 (17.7%) |
| Total (Overall) | 1,929 (54.2%) | 1,629 (45.8%) |
Employment Industries by Sex in Latimer County
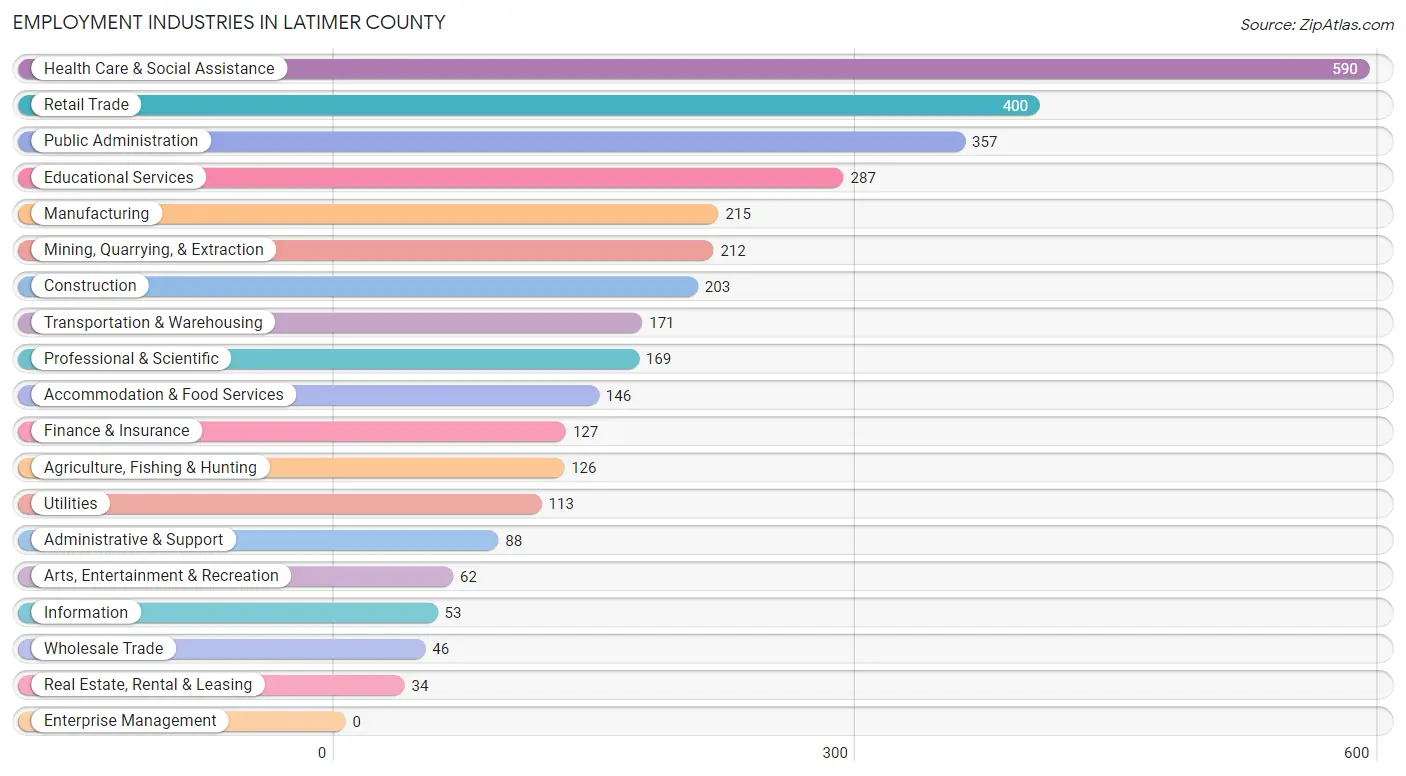
Employment Industries in Latimer County
The major employment industries in Latimer County include Health Care & Social Assistance (590 | 16.6%), Retail Trade (400 | 11.2%), Public Administration (357 | 10.0%), Educational Services (287 | 8.1%), and Manufacturing (215 | 6.0%).
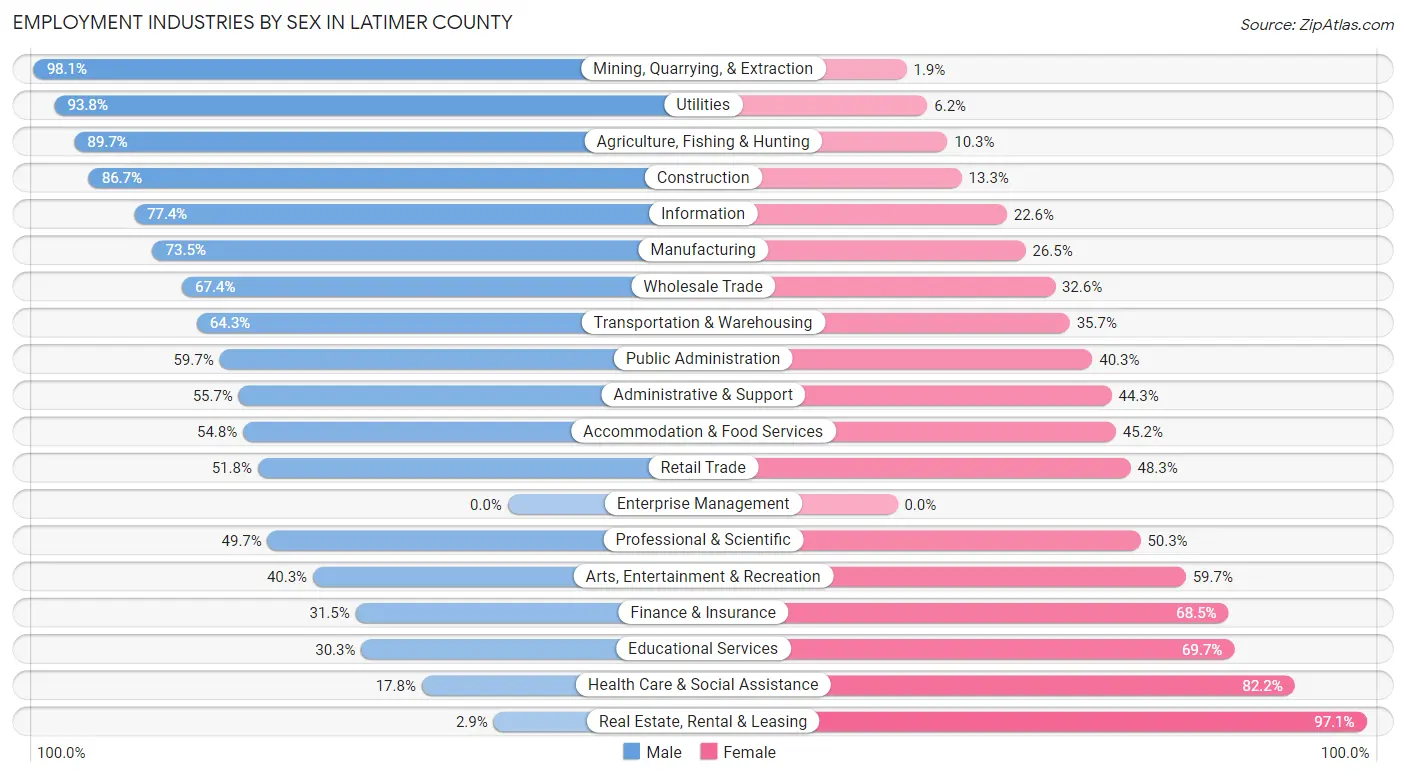
Employment Industries by Sex in Latimer County
The Latimer County industries that see more men than women are Mining, Quarrying, & Extraction (98.1%), Utilities (93.8%), and Agriculture, Fishing & Hunting (89.7%), whereas the industries that tend to have a higher number of women are Real Estate, Rental & Leasing (97.1%), Health Care & Social Assistance (82.2%), and Educational Services (69.7%).
| Industry | Male | Female |
| Agriculture, Fishing & Hunting | 113 (89.7%) | 13 (10.3%) |
| Mining, Quarrying, & Extraction | 208 (98.1%) | 4 (1.9%) |
| Construction | 176 (86.7%) | 27 (13.3%) |
| Manufacturing | 158 (73.5%) | 57 (26.5%) |
| Wholesale Trade | 31 (67.4%) | 15 (32.6%) |
| Retail Trade | 207 (51.7%) | 193 (48.2%) |
| Transportation & Warehousing | 110 (64.3%) | 61 (35.7%) |
| Utilities | 106 (93.8%) | 7 (6.2%) |
| Information | 41 (77.4%) | 12 (22.6%) |
| Finance & Insurance | 40 (31.5%) | 87 (68.5%) |
| Real Estate, Rental & Leasing | 1 (2.9%) | 33 (97.1%) |
| Professional & Scientific | 84 (49.7%) | 85 (50.3%) |
| Enterprise Management | 0 (0.0%) | 0 (0.0%) |
| Administrative & Support | 49 (55.7%) | 39 (44.3%) |
| Educational Services | 87 (30.3%) | 200 (69.7%) |
| Health Care & Social Assistance | 105 (17.8%) | 485 (82.2%) |
| Arts, Entertainment & Recreation | 25 (40.3%) | 37 (59.7%) |
| Accommodation & Food Services | 80 (54.8%) | 66 (45.2%) |
| Public Administration | 213 (59.7%) | 144 (40.3%) |
| Total | 1,929 (54.2%) | 1,629 (45.8%) |
Education in Latimer County
School Enrollment in Latimer County
The most common levels of schooling among the 1,990 students in Latimer County are elementary school (481 | 24.2%), middle school (457 | 23.0%), and high school (438 | 22.0%).
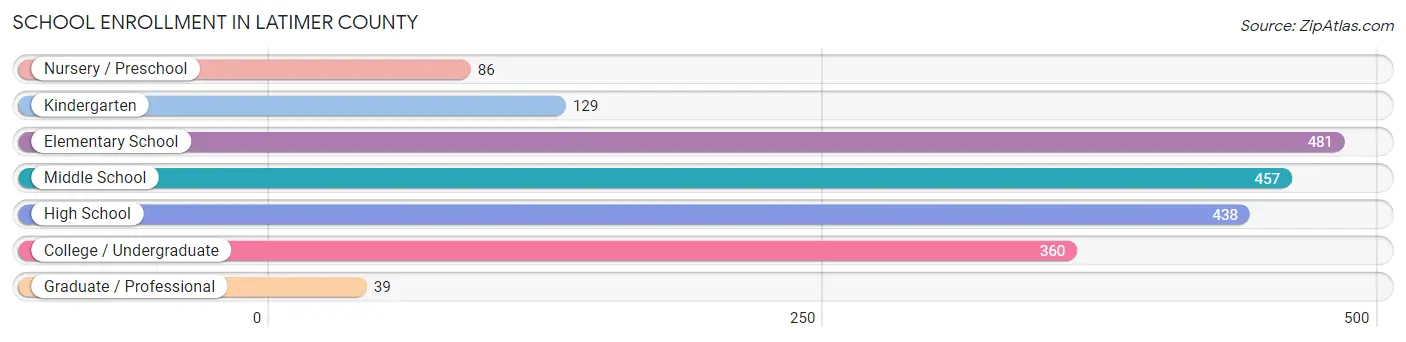
| School Level | # Students | % Students |
| Nursery / Preschool | 86 | 4.3% |
| Kindergarten | 129 | 6.5% |
| Elementary School | 481 | 24.2% |
| Middle School | 457 | 23.0% |
| High School | 438 | 22.0% |
| College / Undergraduate | 360 | 18.1% |
| Graduate / Professional | 39 | 2.0% |
| Total | 1,990 | 100.0% |
School Enrollment by Age by Funding Source in Latimer County
Out of a total of 1,990 students who are enrolled in schools in Latimer County, 121 (6.1%) attend a private institution, while the remaining 1,869 (93.9%) are enrolled in public schools. The age group of 20 to 24 year olds has the highest likelihood of being enrolled in private schools, with 53 (29.9% in the age bracket) enrolled. Conversely, the age group of 35 years and over has the lowest likelihood of being enrolled in a private school, with 40 (100.0% in the age bracket) attending a public institution.
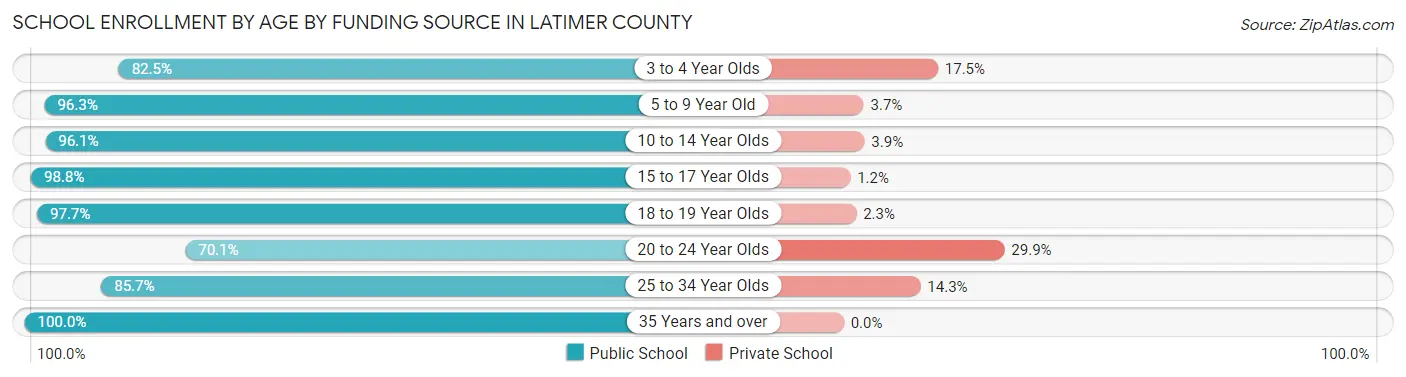
| Age Bracket | Public School | Private School |
| 3 to 4 Year Olds | 47 (82.5%) | 10 (17.5%) |
| 5 to 9 Year Old | 467 (96.3%) | 18 (3.7%) |
| 10 to 14 Year Olds | 623 (96.1%) | 25 (3.9%) |
| 15 to 17 Year Olds | 323 (98.8%) | 4 (1.2%) |
| 18 to 19 Year Olds | 209 (97.7%) | 5 (2.3%) |
| 20 to 24 Year Olds | 124 (70.1%) | 53 (29.9%) |
| 25 to 34 Year Olds | 36 (85.7%) | 6 (14.3%) |
| 35 Years and over | 40 (100.0%) | 0 (0.0%) |
| Total | 1,869 (93.9%) | 121 (6.1%) |
Educational Attainment by Field of Study in Latimer County
Education (363 | 40.4%), science & technology (130 | 14.5%), business (104 | 11.6%), computers & mathematics (56 | 6.2%), and bio, nature & agricultural (56 | 6.2%) are the most common fields of study among 898 individuals in Latimer County who have obtained a bachelor's degree or higher.
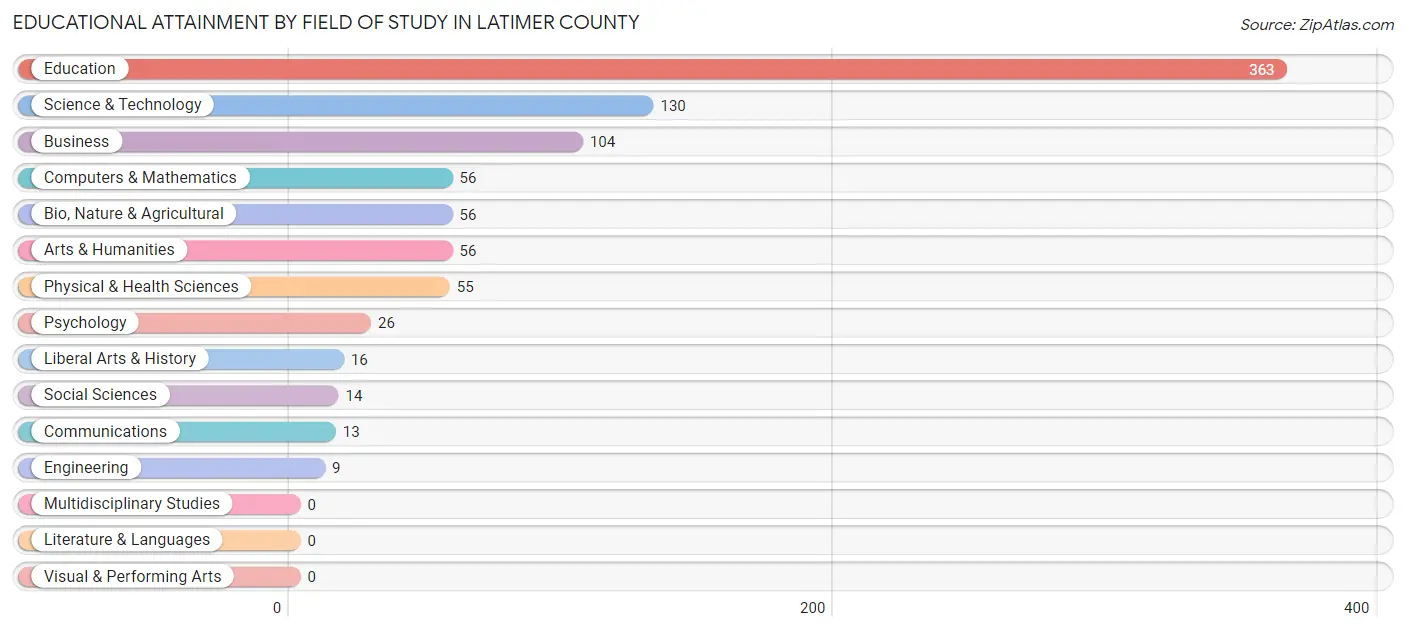
| Field of Study | # Graduates | % Graduates |
| Computers & Mathematics | 56 | 6.2% |
| Bio, Nature & Agricultural | 56 | 6.2% |
| Physical & Health Sciences | 55 | 6.1% |
| Psychology | 26 | 2.9% |
| Social Sciences | 14 | 1.6% |
| Engineering | 9 | 1.0% |
| Multidisciplinary Studies | 0 | 0.0% |
| Science & Technology | 130 | 14.5% |
| Business | 104 | 11.6% |
| Education | 363 | 40.4% |
| Literature & Languages | 0 | 0.0% |
| Liberal Arts & History | 16 | 1.8% |
| Visual & Performing Arts | 0 | 0.0% |
| Communications | 13 | 1.5% |
| Arts & Humanities | 56 | 6.2% |
| Total | 898 | 100.0% |
Transportation & Commute in Latimer County
Vehicle Availability by Sex in Latimer County
The most prevalent vehicle ownership categories in Latimer County are males with 2 vehicles (768, accounting for 40.4%) and females with 2 vehicles (660, making up 48.6%).
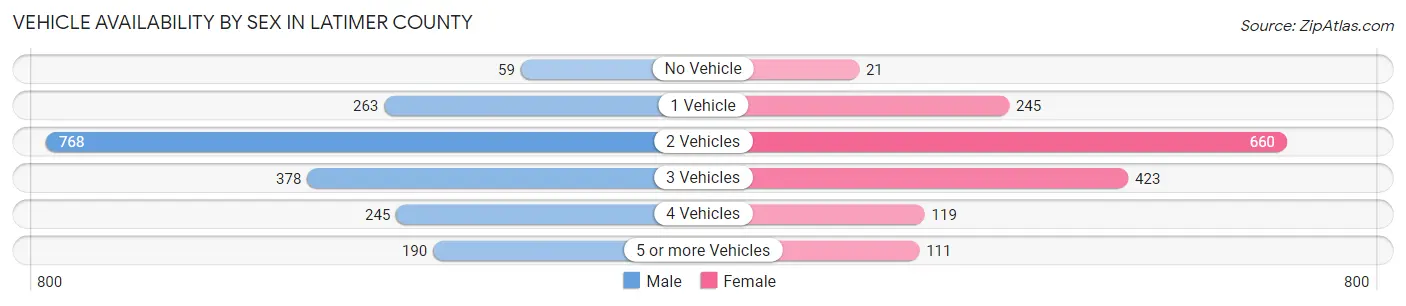
| Vehicles Available | Male | Female |
| No Vehicle | 59 (3.1%) | 21 (1.3%) |
| 1 Vehicle | 263 (13.8%) | 245 (15.5%) |
| 2 Vehicles | 768 (40.4%) | 660 (41.8%) |
| 3 Vehicles | 378 (19.9%) | 423 (26.8%) |
| 4 Vehicles | 245 (12.9%) | 119 (7.5%) |
| 5 or more Vehicles | 190 (10.0%) | 111 (7.0%) |
| Total | 1,903 (100.0%) | 1,579 (100.0%) |
Commute Time in Latimer County
The most frequently occuring commute durations in Latimer County are 5 to 9 minutes (780 commuters, 23.1%), 15 to 19 minutes (515 commuters, 15.3%), and 30 to 34 minutes (341 commuters, 10.1%).
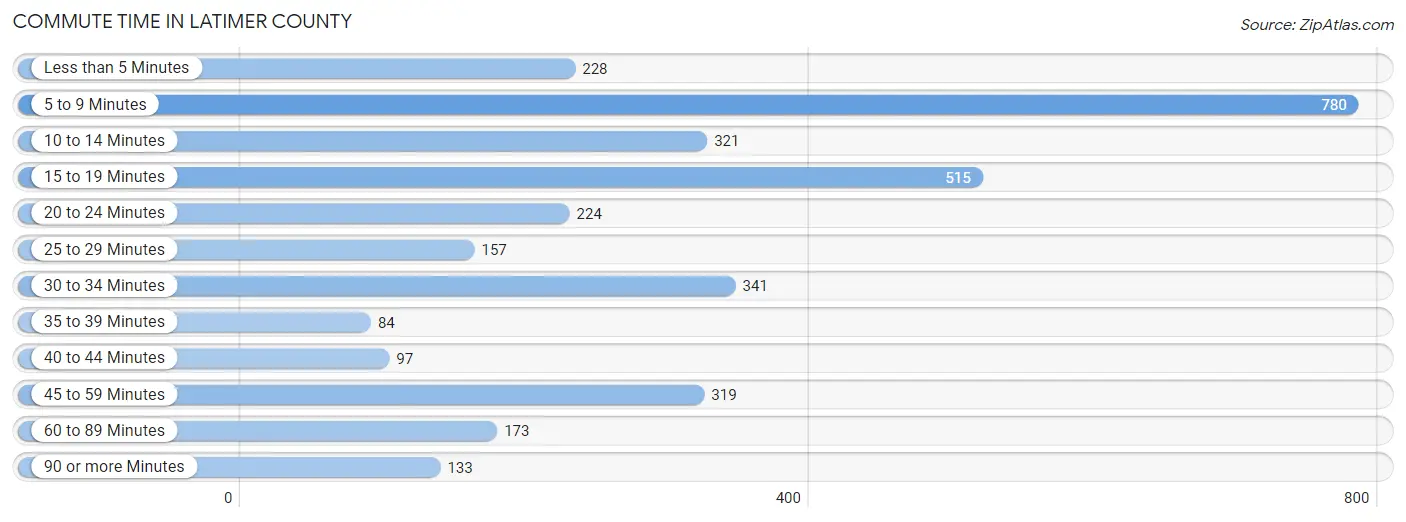
| Commute Time | # Commuters | % Commuters |
| Less than 5 Minutes | 228 | 6.8% |
| 5 to 9 Minutes | 780 | 23.1% |
| 10 to 14 Minutes | 321 | 9.5% |
| 15 to 19 Minutes | 515 | 15.3% |
| 20 to 24 Minutes | 224 | 6.6% |
| 25 to 29 Minutes | 157 | 4.7% |
| 30 to 34 Minutes | 341 | 10.1% |
| 35 to 39 Minutes | 84 | 2.5% |
| 40 to 44 Minutes | 97 | 2.9% |
| 45 to 59 Minutes | 319 | 9.5% |
| 60 to 89 Minutes | 173 | 5.1% |
| 90 or more Minutes | 133 | 3.9% |
Commute Time by Sex in Latimer County
The most common commute times in Latimer County are 5 to 9 minutes (394 commuters, 21.1%) for males and 5 to 9 minutes (386 commuters, 25.6%) for females.
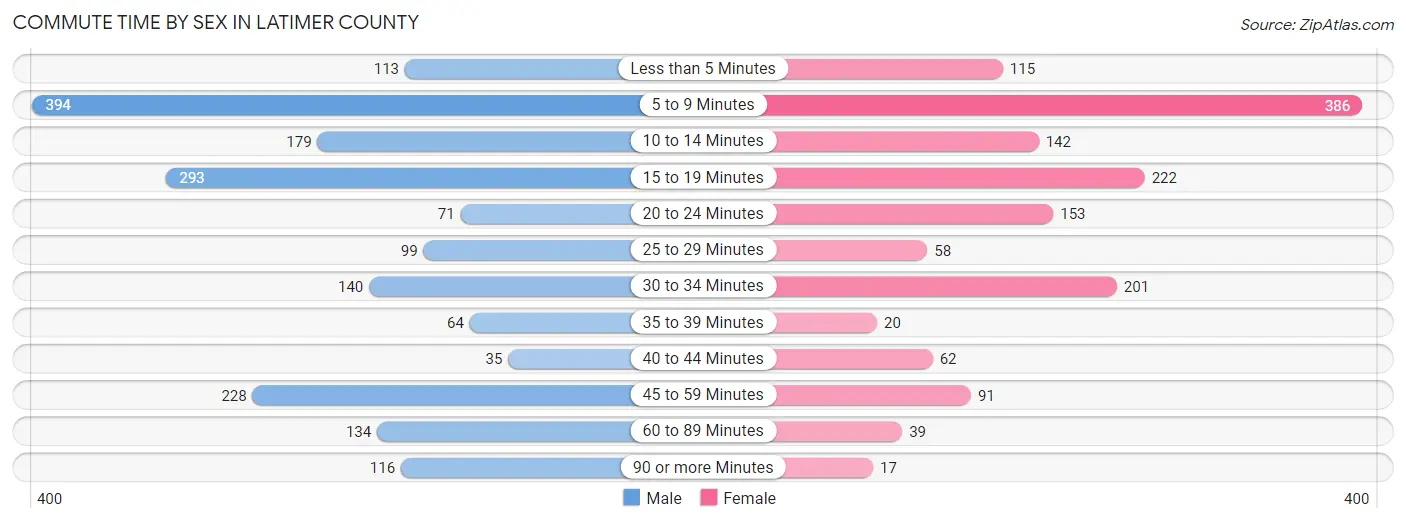
| Commute Time | Male | Female |
| Less than 5 Minutes | 113 (6.1%) | 115 (7.6%) |
| 5 to 9 Minutes | 394 (21.1%) | 386 (25.6%) |
| 10 to 14 Minutes | 179 (9.6%) | 142 (9.4%) |
| 15 to 19 Minutes | 293 (15.7%) | 222 (14.7%) |
| 20 to 24 Minutes | 71 (3.8%) | 153 (10.2%) |
| 25 to 29 Minutes | 99 (5.3%) | 58 (3.8%) |
| 30 to 34 Minutes | 140 (7.5%) | 201 (13.4%) |
| 35 to 39 Minutes | 64 (3.4%) | 20 (1.3%) |
| 40 to 44 Minutes | 35 (1.9%) | 62 (4.1%) |
| 45 to 59 Minutes | 228 (12.2%) | 91 (6.0%) |
| 60 to 89 Minutes | 134 (7.2%) | 39 (2.6%) |
| 90 or more Minutes | 116 (6.2%) | 17 (1.1%) |
Time of Departure to Work by Sex in Latimer County
The most frequent times of departure to work in Latimer County are 7:00 AM to 7:29 AM (307, 16.5%) for males and 7:00 AM to 7:29 AM (390, 25.9%) for females.
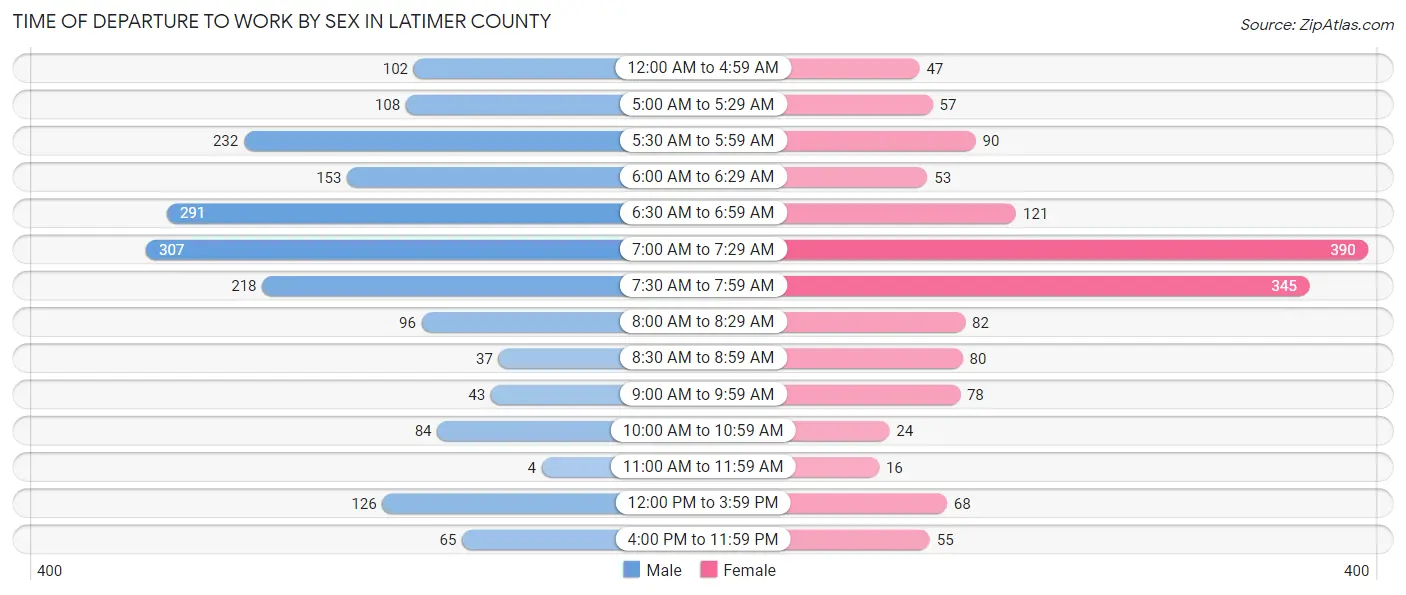
| Time of Departure | Male | Female |
| 12:00 AM to 4:59 AM | 102 (5.5%) | 47 (3.1%) |
| 5:00 AM to 5:29 AM | 108 (5.8%) | 57 (3.8%) |
| 5:30 AM to 5:59 AM | 232 (12.4%) | 90 (6.0%) |
| 6:00 AM to 6:29 AM | 153 (8.2%) | 53 (3.5%) |
| 6:30 AM to 6:59 AM | 291 (15.6%) | 121 (8.0%) |
| 7:00 AM to 7:29 AM | 307 (16.5%) | 390 (25.9%) |
| 7:30 AM to 7:59 AM | 218 (11.7%) | 345 (22.9%) |
| 8:00 AM to 8:29 AM | 96 (5.1%) | 82 (5.4%) |
| 8:30 AM to 8:59 AM | 37 (2.0%) | 80 (5.3%) |
| 9:00 AM to 9:59 AM | 43 (2.3%) | 78 (5.2%) |
| 10:00 AM to 10:59 AM | 84 (4.5%) | 24 (1.6%) |
| 11:00 AM to 11:59 AM | 4 (0.2%) | 16 (1.1%) |
| 12:00 PM to 3:59 PM | 126 (6.8%) | 68 (4.5%) |
| 4:00 PM to 11:59 PM | 65 (3.5%) | 55 (3.6%) |
| Total | 1,866 (100.0%) | 1,506 (100.0%) |
Housing Occupancy in Latimer County
Occupancy by Ownership in Latimer County
Of the total 3,852 dwellings in Latimer County, owner-occupied units account for 2,673 (69.4%), while renter-occupied units make up 1,179 (30.6%).
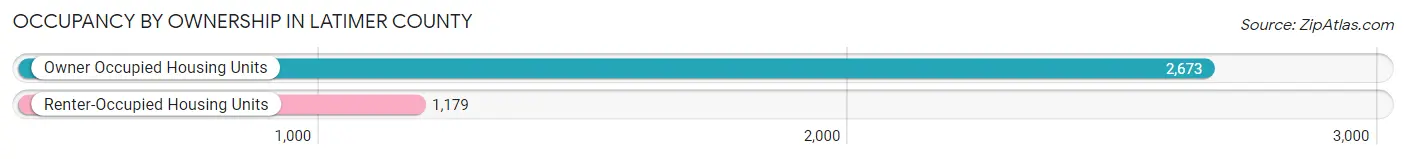
| Occupancy | # Housing Units | % Housing Units |
| Owner Occupied Housing Units | 2,673 | 69.4% |
| Renter-Occupied Housing Units | 1,179 | 30.6% |
| Total Occupied Housing Units | 3,852 | 100.0% |
Occupancy by Household Size in Latimer County
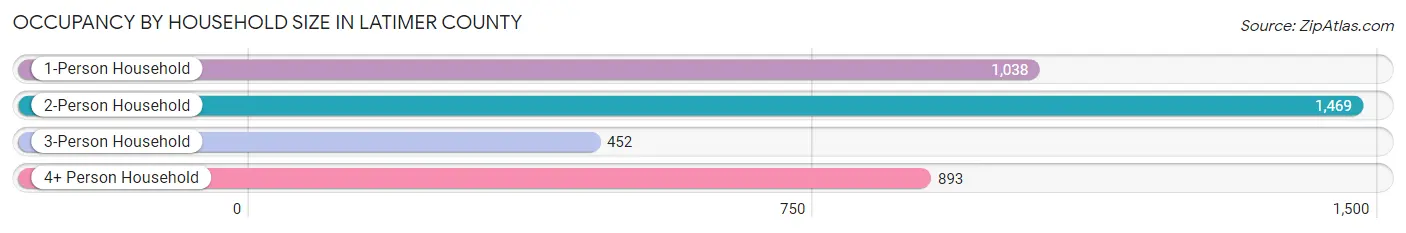
| Household Size | # Housing Units | % Housing Units |
| 1-Person Household | 1,038 | 27.0% |
| 2-Person Household | 1,469 | 38.1% |
| 3-Person Household | 452 | 11.7% |
| 4+ Person Household | 893 | 23.2% |
| Total Housing Units | 3,852 | 100.0% |
Occupancy by Ownership by Household Size in Latimer County
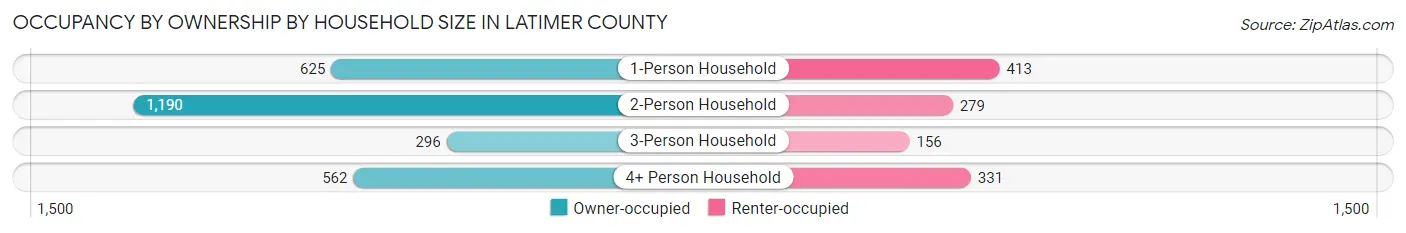
| Household Size | Owner-occupied | Renter-occupied |
| 1-Person Household | 625 (60.2%) | 413 (39.8%) |
| 2-Person Household | 1,190 (81.0%) | 279 (19.0%) |
| 3-Person Household | 296 (65.5%) | 156 (34.5%) |
| 4+ Person Household | 562 (62.9%) | 331 (37.1%) |
| Total Housing Units | 2,673 (69.4%) | 1,179 (30.6%) |
Occupancy by Educational Attainment in Latimer County
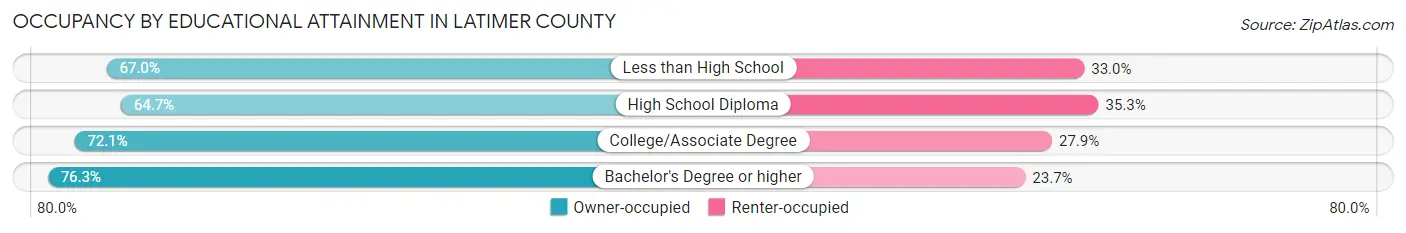
| Household Size | Owner-occupied | Renter-occupied |
| Less than High School | 349 (67.0%) | 172 (33.0%) |
| High School Diploma | 877 (64.7%) | 478 (35.3%) |
| College/Associate Degree | 1,044 (72.1%) | 404 (27.9%) |
| Bachelor's Degree or higher | 403 (76.3%) | 125 (23.7%) |
Occupancy by Age of Householder in Latimer County
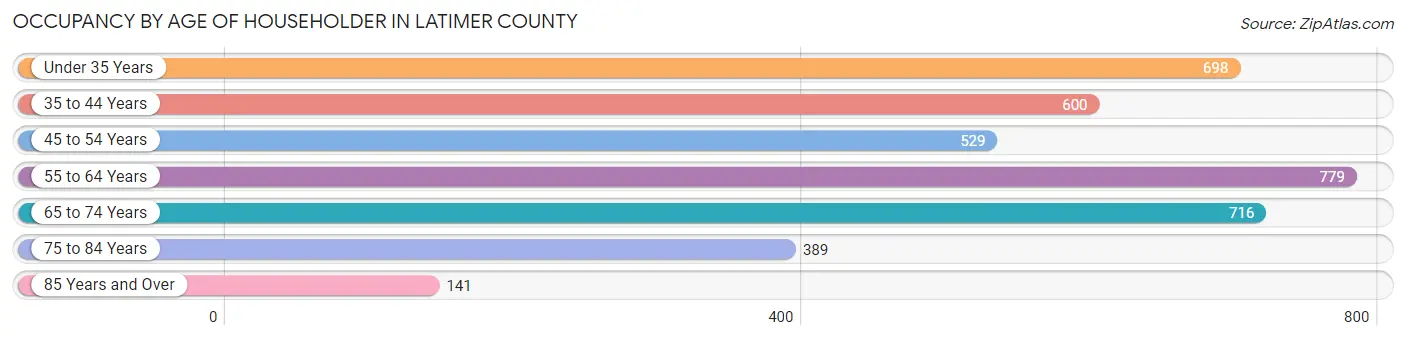
| Age Bracket | # Households | % Households |
| Under 35 Years | 698 | 18.1% |
| 35 to 44 Years | 600 | 15.6% |
| 45 to 54 Years | 529 | 13.7% |
| 55 to 64 Years | 779 | 20.2% |
| 65 to 74 Years | 716 | 18.6% |
| 75 to 84 Years | 389 | 10.1% |
| 85 Years and Over | 141 | 3.7% |
| Total | 3,852 | 100.0% |
Housing Finances in Latimer County
Median Income by Occupancy in Latimer County
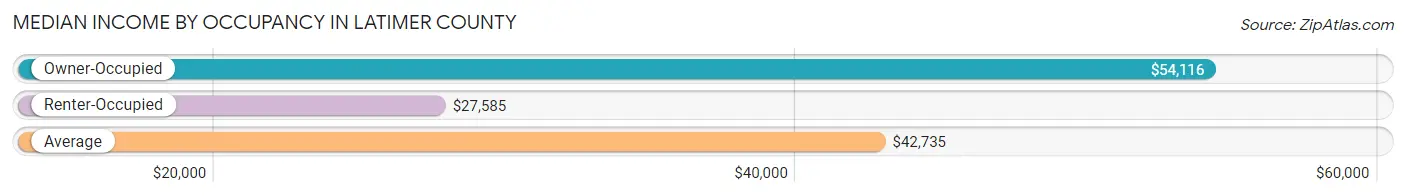
| Occupancy Type | # Households | Median Income |
| Owner-Occupied | 2,673 (69.4%) | $54,116 |
| Renter-Occupied | 1,179 (30.6%) | $27,585 |
| Average | 3,852 (100.0%) | $42,735 |
Occupancy by Householder Income Bracket in Latimer County
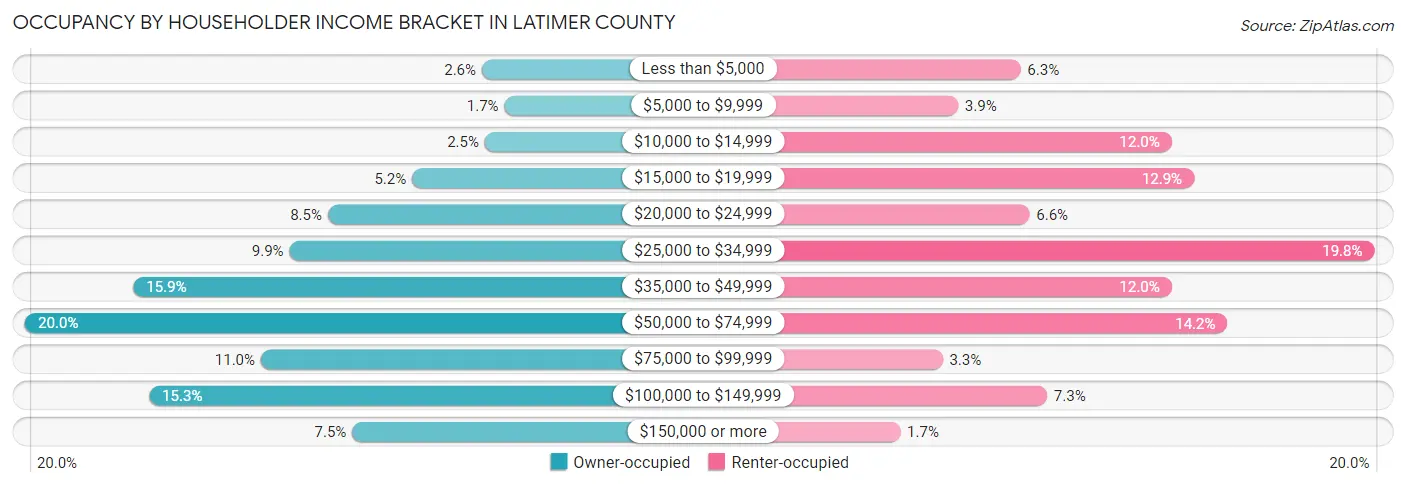
| Income Bracket | Owner-occupied | Renter-occupied |
| Less than $5,000 | 69 (2.6%) | 74 (6.3%) |
| $5,000 to $9,999 | 46 (1.7%) | 46 (3.9%) |
| $10,000 to $14,999 | 66 (2.5%) | 142 (12.0%) |
| $15,000 to $19,999 | 140 (5.2%) | 152 (12.9%) |
| $20,000 to $24,999 | 226 (8.5%) | 78 (6.6%) |
| $25,000 to $34,999 | 265 (9.9%) | 233 (19.8%) |
| $35,000 to $49,999 | 424 (15.9%) | 142 (12.0%) |
| $50,000 to $74,999 | 534 (20.0%) | 167 (14.2%) |
| $75,000 to $99,999 | 294 (11.0%) | 39 (3.3%) |
| $100,000 to $149,999 | 408 (15.3%) | 86 (7.3%) |
| $150,000 or more | 201 (7.5%) | 20 (1.7%) |
| Total | 2,673 (100.0%) | 1,179 (100.0%) |
Monthly Housing Cost Tiers in Latimer County
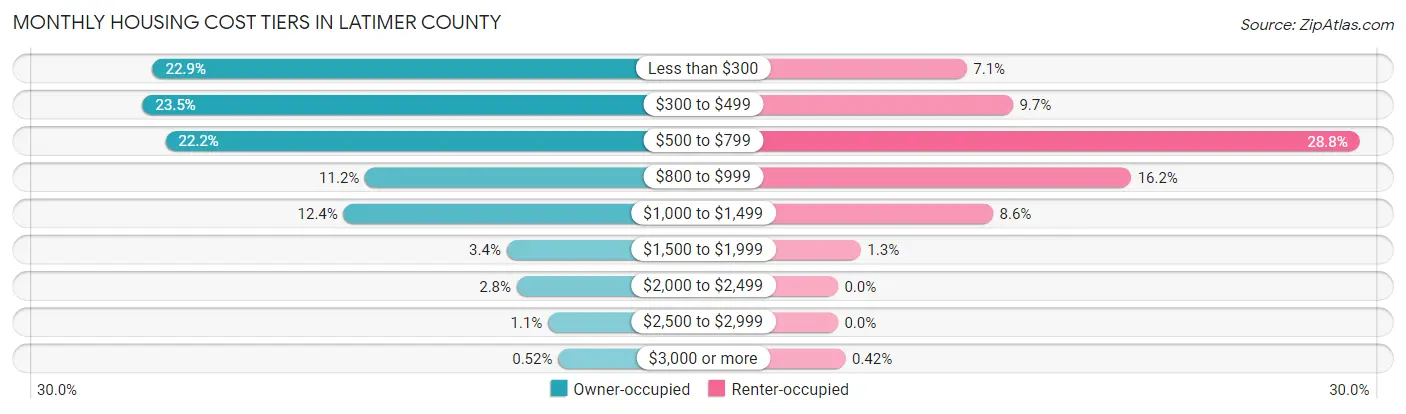
| Monthly Cost | Owner-occupied | Renter-occupied |
| Less than $300 | 613 (22.9%) | 84 (7.1%) |
| $300 to $499 | 628 (23.5%) | 114 (9.7%) |
| $500 to $799 | 594 (22.2%) | 340 (28.8%) |
| $800 to $999 | 299 (11.2%) | 191 (16.2%) |
| $1,000 to $1,499 | 331 (12.4%) | 101 (8.6%) |
| $1,500 to $1,999 | 90 (3.4%) | 15 (1.3%) |
| $2,000 to $2,499 | 75 (2.8%) | 0 (0.0%) |
| $2,500 to $2,999 | 29 (1.1%) | 0 (0.0%) |
| $3,000 or more | 14 (0.5%) | 5 (0.4%) |
| Total | 2,673 (100.0%) | 1,179 (100.0%) |
Physical Housing Characteristics in Latimer County
Housing Structures in Latimer County
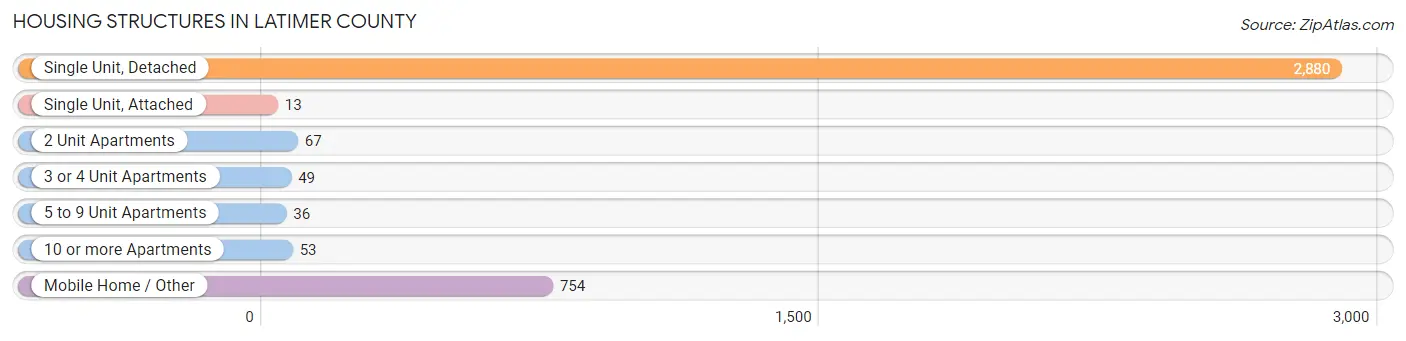
| Structure Type | # Housing Units | % Housing Units |
| Single Unit, Detached | 2,880 | 74.8% |
| Single Unit, Attached | 13 | 0.3% |
| 2 Unit Apartments | 67 | 1.7% |
| 3 or 4 Unit Apartments | 49 | 1.3% |
| 5 to 9 Unit Apartments | 36 | 0.9% |
| 10 or more Apartments | 53 | 1.4% |
| Mobile Home / Other | 754 | 19.6% |
| Total | 3,852 | 100.0% |
Housing Structures by Occupancy in Latimer County
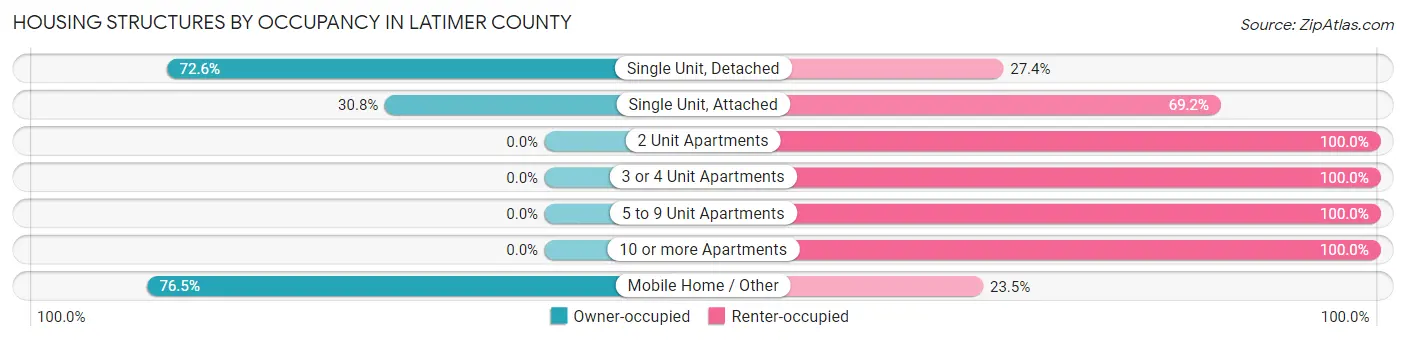
| Structure Type | Owner-occupied | Renter-occupied |
| Single Unit, Detached | 2,092 (72.6%) | 788 (27.4%) |
| Single Unit, Attached | 4 (30.8%) | 9 (69.2%) |
| 2 Unit Apartments | 0 (0.0%) | 67 (100.0%) |
| 3 or 4 Unit Apartments | 0 (0.0%) | 49 (100.0%) |
| 5 to 9 Unit Apartments | 0 (0.0%) | 36 (100.0%) |
| 10 or more Apartments | 0 (0.0%) | 53 (100.0%) |
| Mobile Home / Other | 577 (76.5%) | 177 (23.5%) |
| Total | 2,673 (69.4%) | 1,179 (30.6%) |
Housing Structures by Number of Rooms in Latimer County
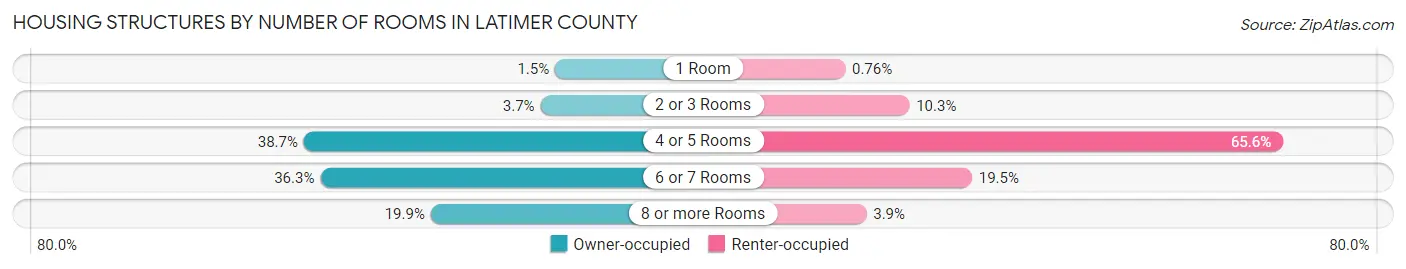
| Number of Rooms | Owner-occupied | Renter-occupied |
| 1 Room | 40 (1.5%) | 9 (0.8%) |
| 2 or 3 Rooms | 98 (3.7%) | 121 (10.3%) |
| 4 or 5 Rooms | 1,034 (38.7%) | 773 (65.6%) |
| 6 or 7 Rooms | 969 (36.2%) | 230 (19.5%) |
| 8 or more Rooms | 532 (19.9%) | 46 (3.9%) |
| Total | 2,673 (100.0%) | 1,179 (100.0%) |
Housing Structure by Heating Type in Latimer County
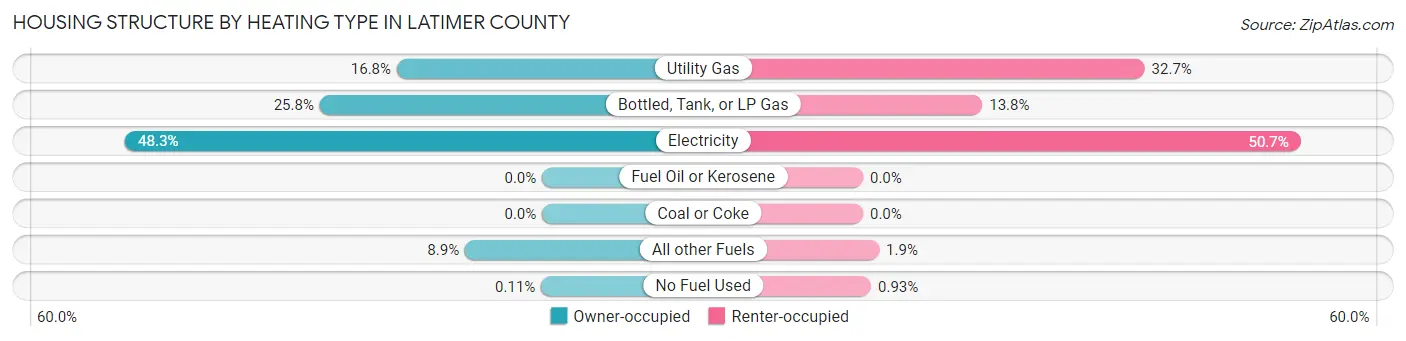
| Heating Type | Owner-occupied | Renter-occupied |
| Utility Gas | 450 (16.8%) | 385 (32.7%) |
| Bottled, Tank, or LP Gas | 689 (25.8%) | 163 (13.8%) |
| Electricity | 1,292 (48.3%) | 598 (50.7%) |
| Fuel Oil or Kerosene | 0 (0.0%) | 0 (0.0%) |
| Coal or Coke | 0 (0.0%) | 0 (0.0%) |
| All other Fuels | 239 (8.9%) | 22 (1.9%) |
| No Fuel Used | 3 (0.1%) | 11 (0.9%) |
| Total | 2,673 (100.0%) | 1,179 (100.0%) |
Household Vehicle Usage in Latimer County
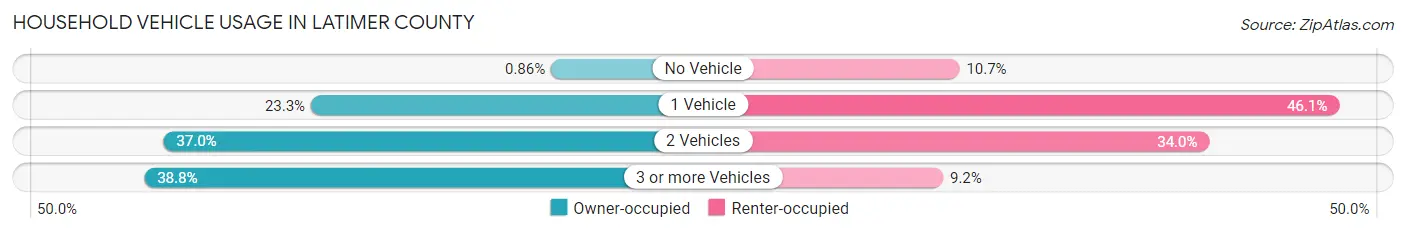
| Vehicles per Household | Owner-occupied | Renter-occupied |
| No Vehicle | 23 (0.9%) | 126 (10.7%) |
| 1 Vehicle | 622 (23.3%) | 544 (46.1%) |
| 2 Vehicles | 990 (37.0%) | 401 (34.0%) |
| 3 or more Vehicles | 1,038 (38.8%) | 108 (9.2%) |
| Total | 2,673 (100.0%) | 1,179 (100.0%) |
Real Estate & Mortgages in Latimer County
Real Estate and Mortgage Overview in Latimer County
| Characteristic | Without Mortgage | With Mortgage |
| Housing Units | 1,636 | 1,037 |
| Median Property Value | $82,800 | $122,800 |
| Median Household Income | $39,894 | $120 |
| Monthly Housing Costs | $359 | $14 |
| Real Estate Taxes | $416 | $50 |
Property Value by Mortgage Status in Latimer County
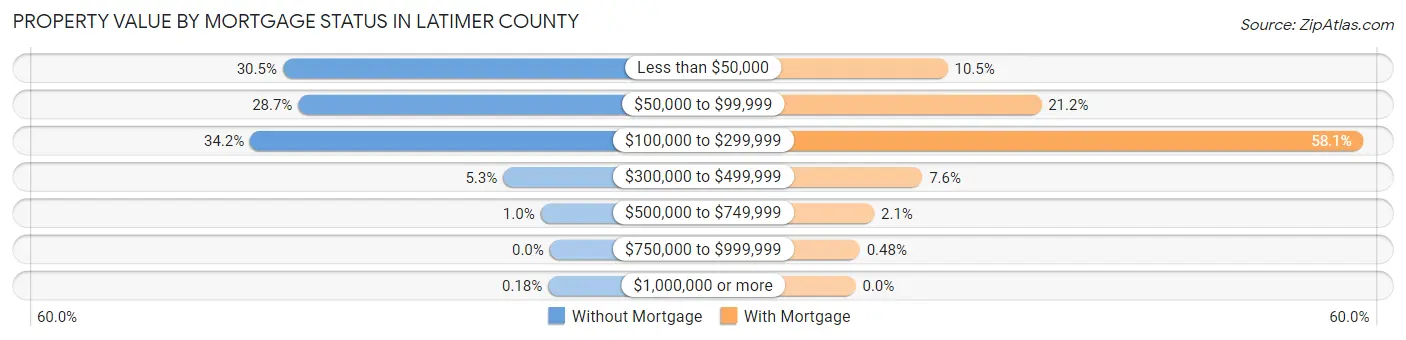
| Property Value | Without Mortgage | With Mortgage |
| Less than $50,000 | 499 (30.5%) | 109 (10.5%) |
| $50,000 to $99,999 | 470 (28.7%) | 220 (21.2%) |
| $100,000 to $299,999 | 560 (34.2%) | 602 (58.1%) |
| $300,000 to $499,999 | 87 (5.3%) | 79 (7.6%) |
| $500,000 to $749,999 | 17 (1.0%) | 22 (2.1%) |
| $750,000 to $999,999 | 0 (0.0%) | 5 (0.5%) |
| $1,000,000 or more | 3 (0.2%) | 0 (0.0%) |
| Total | 1,636 (100.0%) | 1,037 (100.0%) |
Household Income by Mortgage Status in Latimer County
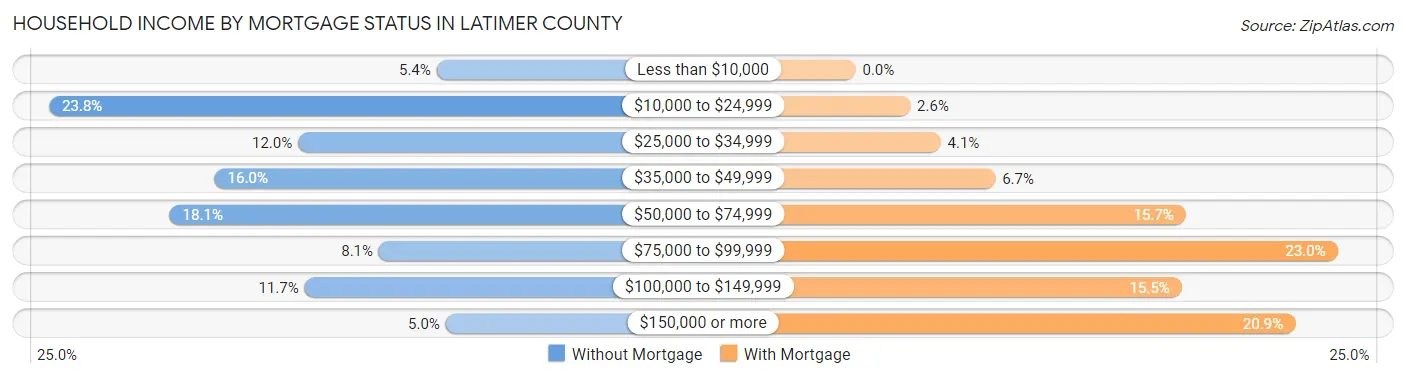
| Household Income | Without Mortgage | With Mortgage |
| Less than $10,000 | 88 (5.4%) | 0 (0.0%) |
| $10,000 to $24,999 | 390 (23.8%) | 27 (2.6%) |
| $25,000 to $34,999 | 196 (12.0%) | 42 (4.1%) |
| $35,000 to $49,999 | 261 (16.0%) | 69 (6.7%) |
| $50,000 to $74,999 | 296 (18.1%) | 163 (15.7%) |
| $75,000 to $99,999 | 133 (8.1%) | 238 (23.0%) |
| $100,000 to $149,999 | 191 (11.7%) | 161 (15.5%) |
| $150,000 or more | 81 (5.0%) | 217 (20.9%) |
| Total | 1,636 (100.0%) | 1,037 (100.0%) |
Property Value to Household Income Ratio in Latimer County
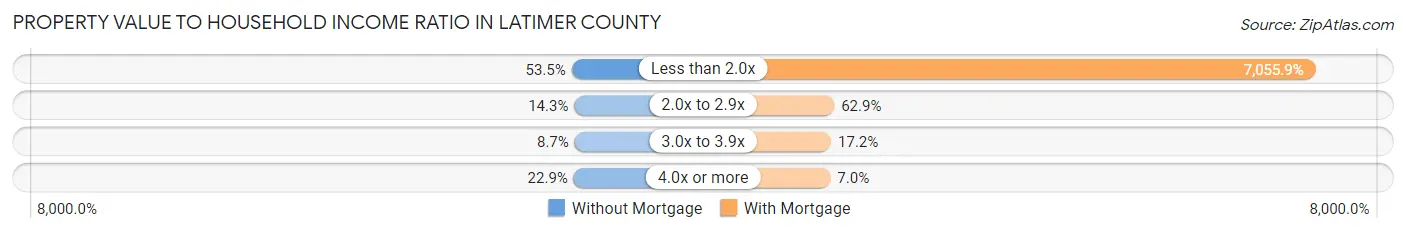
| Value-to-Income Ratio | Without Mortgage | With Mortgage |
| Less than 2.0x | 875 (53.5%) | 73,170 (7,055.9%) |
| 2.0x to 2.9x | 234 (14.3%) | 652 (62.9%) |
| 3.0x to 3.9x | 143 (8.7%) | 178 (17.2%) |
| 4.0x or more | 374 (22.9%) | 73 (7.0%) |
| Total | 1,636 (100.0%) | 1,037 (100.0%) |
Real Estate Taxes by Mortgage Status in Latimer County
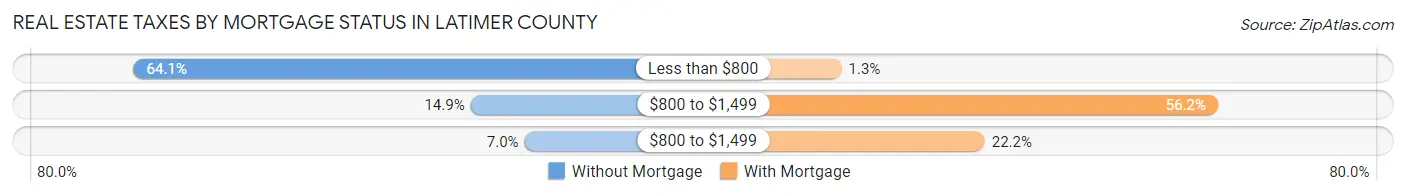
| Property Taxes | Without Mortgage | With Mortgage |
| Less than $800 | 1,048 (64.1%) | 13 (1.3%) |
| $800 to $1,499 | 243 (14.8%) | 583 (56.2%) |
| $800 to $1,499 | 114 (7.0%) | 230 (22.2%) |
| Total | 1,636 (100.0%) | 1,037 (100.0%) |
Health & Disability in Latimer County
Health Insurance Coverage by Age in Latimer County
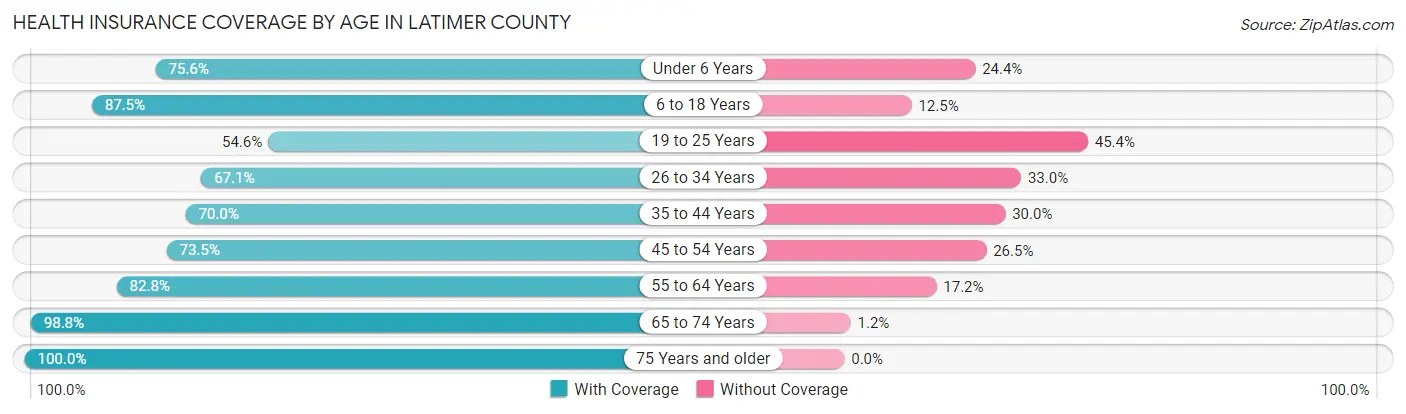
| Age Bracket | With Coverage | Without Coverage |
| Under 6 Years | 483 (75.6%) | 156 (24.4%) |
| 6 to 18 Years | 1,424 (87.5%) | 204 (12.5%) |
| 19 to 25 Years | 427 (54.6%) | 355 (45.4%) |
| 26 to 34 Years | 635 (67.0%) | 312 (33.0%) |
| 35 to 44 Years | 800 (70.0%) | 343 (30.0%) |
| 45 to 54 Years | 761 (73.5%) | 274 (26.5%) |
| 55 to 64 Years | 1,023 (82.8%) | 212 (17.2%) |
| 65 to 74 Years | 1,001 (98.8%) | 12 (1.2%) |
| 75 Years and older | 879 (100.0%) | 0 (0.0%) |
| Total | 7,433 (79.9%) | 1,868 (20.1%) |
Health Insurance Coverage by Citizenship Status in Latimer County
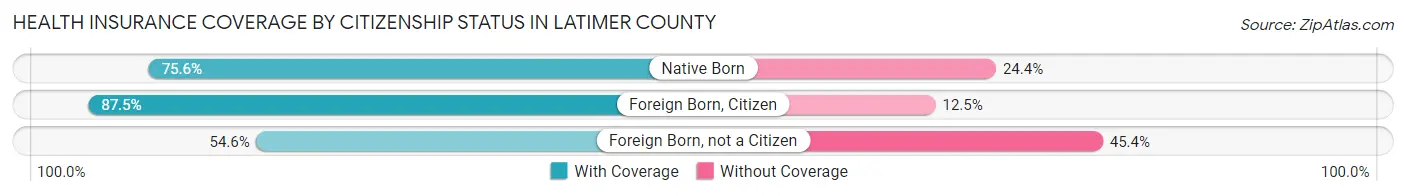
| Citizenship Status | With Coverage | Without Coverage |
| Native Born | 483 (75.6%) | 156 (24.4%) |
| Foreign Born, Citizen | 1,424 (87.5%) | 204 (12.5%) |
| Foreign Born, not a Citizen | 427 (54.6%) | 355 (45.4%) |
Health Insurance Coverage by Household Income in Latimer County
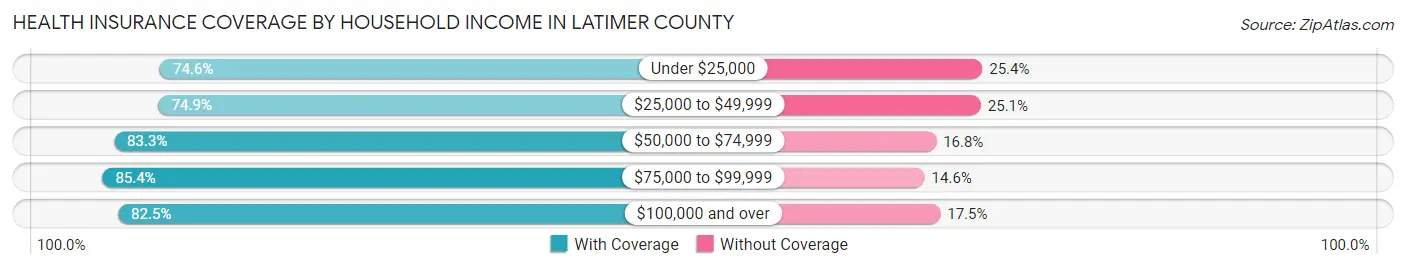
| Household Income | With Coverage | Without Coverage |
| Under $25,000 | 1,337 (74.6%) | 455 (25.4%) |
| $25,000 to $49,999 | 1,648 (74.9%) | 553 (25.1%) |
| $50,000 to $74,999 | 1,685 (83.3%) | 339 (16.8%) |
| $75,000 to $99,999 | 855 (85.4%) | 146 (14.6%) |
| $100,000 and over | 1,748 (82.5%) | 371 (17.5%) |
Public vs Private Health Insurance Coverage by Age in Latimer County
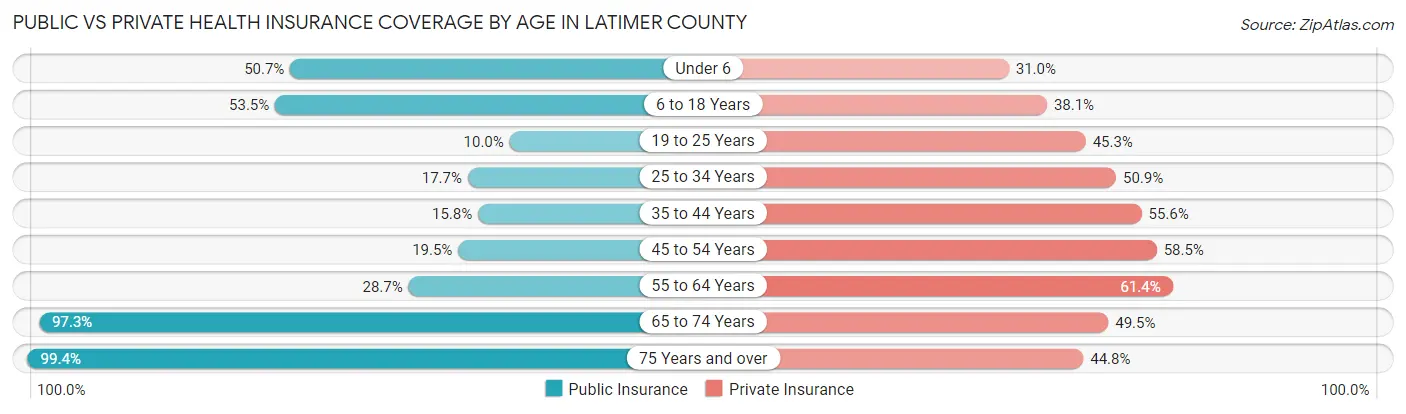
| Age Bracket | Public Insurance | Private Insurance |
| Under 6 | 324 (50.7%) | 198 (31.0%) |
| 6 to 18 Years | 871 (53.5%) | 620 (38.1%) |
| 19 to 25 Years | 78 (10.0%) | 354 (45.3%) |
| 25 to 34 Years | 168 (17.7%) | 482 (50.9%) |
| 35 to 44 Years | 181 (15.8%) | 636 (55.6%) |
| 45 to 54 Years | 202 (19.5%) | 605 (58.5%) |
| 55 to 64 Years | 355 (28.7%) | 758 (61.4%) |
| 65 to 74 Years | 986 (97.3%) | 501 (49.5%) |
| 75 Years and over | 874 (99.4%) | 394 (44.8%) |
| Total | 4,039 (43.4%) | 4,548 (48.9%) |
Disability Status by Sex by Age in Latimer County
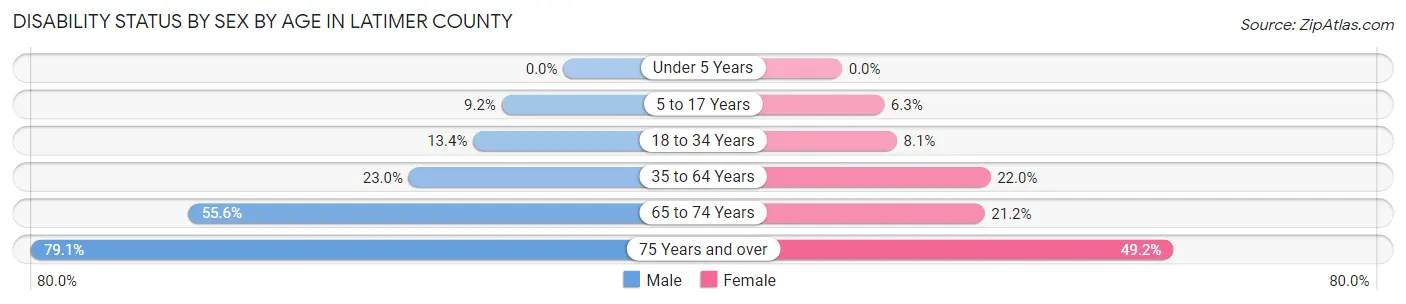
| Age Bracket | Male | Female |
| Under 5 Years | 0 (0.0%) | 0 (0.0%) |
| 5 to 17 Years | 73 (9.2%) | 46 (6.2%) |
| 18 to 34 Years | 123 (13.4%) | 79 (8.1%) |
| 35 to 64 Years | 397 (23.0%) | 371 (22.0%) |
| 65 to 74 Years | 277 (55.6%) | 109 (21.2%) |
| 75 Years and over | 351 (79.0%) | 214 (49.2%) |
Disability Class by Sex by Age in Latimer County
Disability Class: Hearing Difficulty
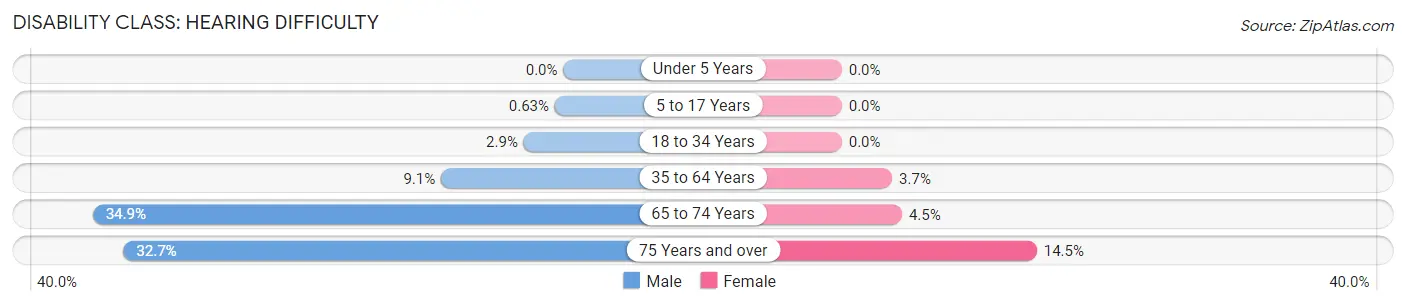
| Age Bracket | Male | Female |
| Under 5 Years | 0 (0.0%) | 0 (0.0%) |
| 5 to 17 Years | 5 (0.6%) | 0 (0.0%) |
| 18 to 34 Years | 27 (2.9%) | 0 (0.0%) |
| 35 to 64 Years | 157 (9.1%) | 63 (3.7%) |
| 65 to 74 Years | 174 (34.9%) | 23 (4.5%) |
| 75 Years and over | 145 (32.7%) | 63 (14.5%) |
Disability Class: Vision Difficulty
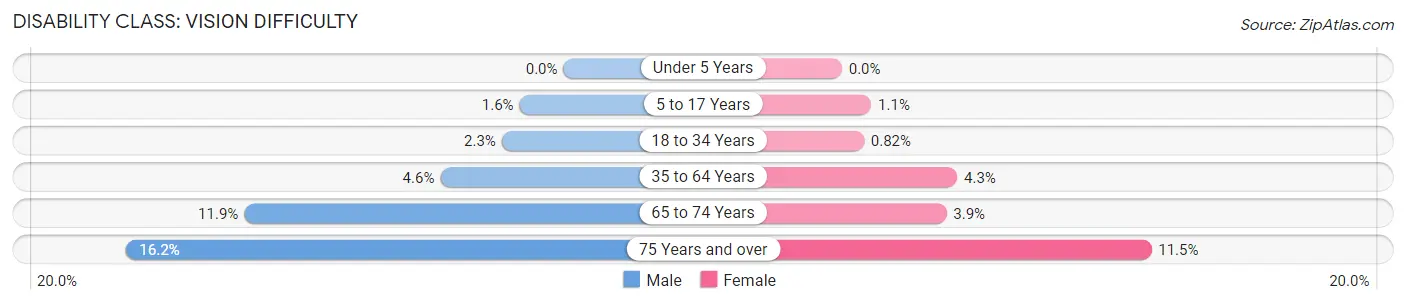
| Age Bracket | Male | Female |
| Under 5 Years | 0 (0.0%) | 0 (0.0%) |
| 5 to 17 Years | 13 (1.6%) | 8 (1.1%) |
| 18 to 34 Years | 21 (2.3%) | 8 (0.8%) |
| 35 to 64 Years | 79 (4.6%) | 72 (4.3%) |
| 65 to 74 Years | 59 (11.8%) | 20 (3.9%) |
| 75 Years and over | 72 (16.2%) | 50 (11.5%) |
Disability Class: Cognitive Difficulty
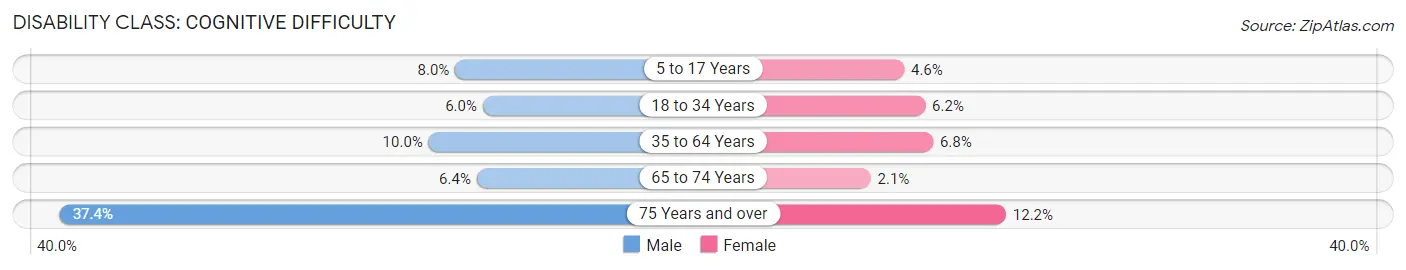
| Age Bracket | Male | Female |
| 5 to 17 Years | 64 (8.0%) | 34 (4.6%) |
| 18 to 34 Years | 55 (6.0%) | 60 (6.2%) |
| 35 to 64 Years | 173 (10.0%) | 114 (6.8%) |
| 65 to 74 Years | 32 (6.4%) | 11 (2.1%) |
| 75 Years and over | 166 (37.4%) | 53 (12.2%) |
Disability Class: Ambulatory Difficulty
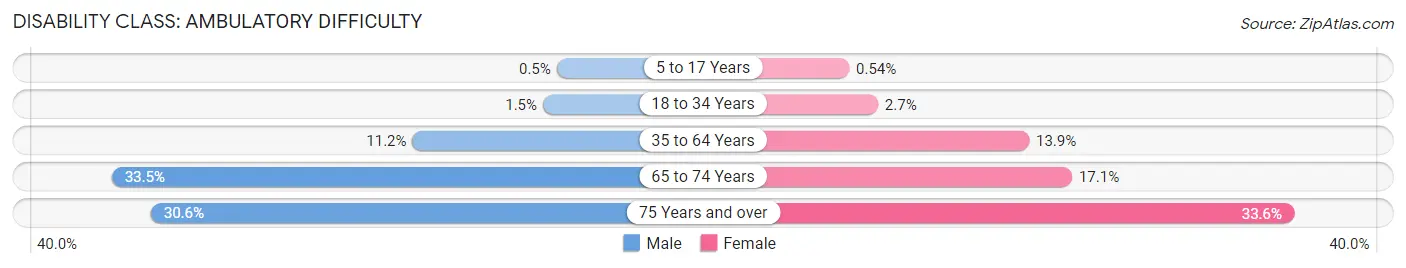
| Age Bracket | Male | Female |
| 5 to 17 Years | 4 (0.5%) | 4 (0.5%) |
| 18 to 34 Years | 14 (1.5%) | 26 (2.7%) |
| 35 to 64 Years | 194 (11.2%) | 234 (13.9%) |
| 65 to 74 Years | 167 (33.5%) | 88 (17.1%) |
| 75 Years and over | 136 (30.6%) | 146 (33.6%) |
Disability Class: Self-Care Difficulty
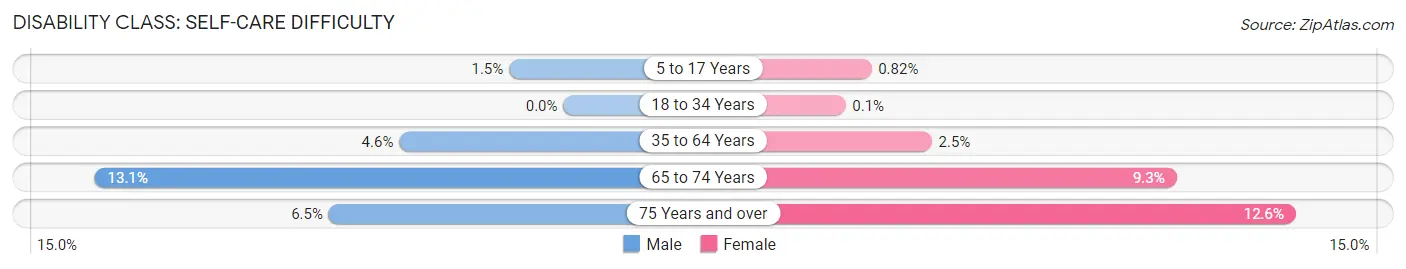
| Age Bracket | Male | Female |
| 5 to 17 Years | 12 (1.5%) | 6 (0.8%) |
| 18 to 34 Years | 0 (0.0%) | 1 (0.1%) |
| 35 to 64 Years | 79 (4.6%) | 42 (2.5%) |
| 65 to 74 Years | 65 (13.1%) | 48 (9.3%) |
| 75 Years and over | 29 (6.5%) | 55 (12.6%) |
Technology Access in Latimer County
Computing Device Access in Latimer County
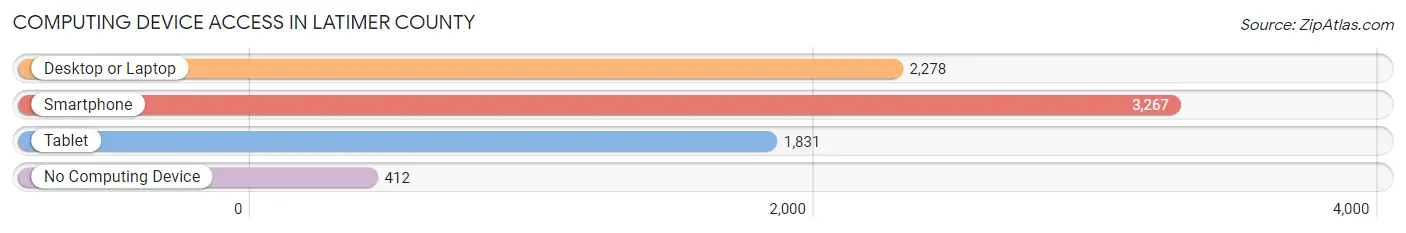
| Device Type | # Households | % Households |
| Desktop or Laptop | 2,278 | 59.1% |
| Smartphone | 3,267 | 84.8% |
| Tablet | 1,831 | 47.5% |
| No Computing Device | 412 | 10.7% |
| Total | 3,852 | 100.0% |
Internet Access in Latimer County
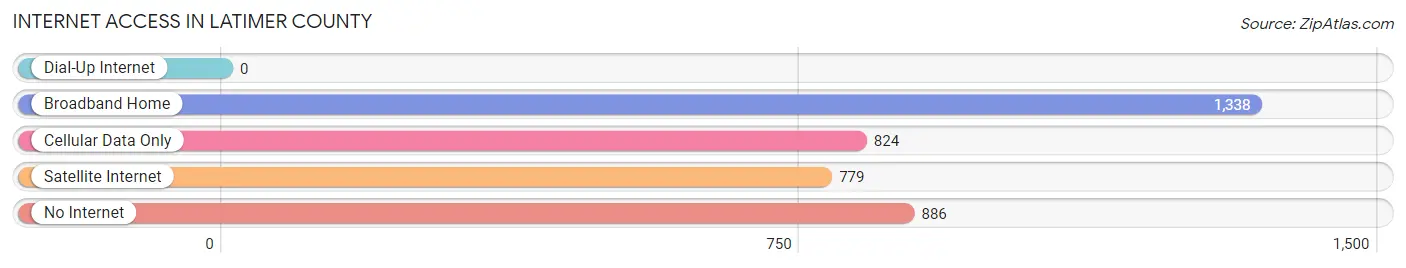
| Internet Type | # Households | % Households |
| Dial-Up Internet | 0 | 0.0% |
| Broadband Home | 1,338 | 34.7% |
| Cellular Data Only | 824 | 21.4% |
| Satellite Internet | 779 | 20.2% |
| No Internet | 886 | 23.0% |
| Total | 3,852 | 100.0% |
Latimer County Summary
Latimer County is located in the southeastern corner of Oklahoma, and is bordered by Pittsburg County to the north, LeFlore County to the east, Haskell County to the south, and Pushmataha County to the west. The county seat is Wilburton, and the county was named for James L. Latimer, a member of the Oklahoma Constitutional Convention.
Geography
Latimer County covers an area of 590 square miles, and is located in the Ouachita Mountains region of Oklahoma. The terrain is mostly hilly, with elevations ranging from 500 to 1,000 feet above sea level. The county is drained by the Kiamichi River, which flows through the county from north to south. The county is mostly forested, with the majority of the land being used for timber production.
Economy
The economy of Latimer County is largely based on agriculture and timber production. The county is home to several large timber companies, including Weyerhaeuser, Georgia-Pacific, and Potlatch. The county also has a large cattle industry, with several large ranches located in the area.
In addition to agriculture and timber production, Latimer County is home to several manufacturing companies, including a paper mill, a furniture factory, and a plastics plant. The county also has a large tourism industry, with several popular attractions, such as Robbers Cave State Park, the Kiamichi Mountains, and the Talimena Scenic Drive.
Demographics
As of the 2010 census, the population of Latimer County was 11,154. The population is largely white (90.2%), with small percentages of African American (4.2%), Native American (2.2%), and Asian (1.2%) residents. The median household income in the county is $37,945, and the median age is 41.
Latimer County is served by the Wilburton Public School District, which includes four elementary schools, one middle school, and one high school. The county is also home to Eastern Oklahoma State College, a two-year college located in Wilburton.
Conclusion
Latimer County is a rural county located in the southeastern corner of Oklahoma. The county is largely agricultural and timber-based, with a large cattle industry and several manufacturing companies. The population of the county is largely white, with a median household income of $37,945 and a median age of 41. The county is served by the Wilburton Public School District and Eastern Oklahoma State College.
Common Questions
What is Per Capita Income in Latimer County?
Per Capita income in Latimer County is $25,189.
What is the Median Family Income in Latimer County?
Median Family Income in Latimer County is $57,564.
What is the Median Household income in Latimer County?
Median Household Income in Latimer County is $42,735.
What is Income or Wage Gap in Latimer County?
Income or Wage Gap in Latimer County is 30.2%.
Women in Latimer County earn 69.8 cents for every dollar earned by a man.
What is Family Income Deficit in Latimer County?
Family Income Deficit in Latimer County is $10,438.
Families that are below poverty line in Latimer County earn $10,438 less on average than the poverty threshold level.
What is Inequality or Gini Index in Latimer County?
Inequality or Gini Index in Latimer County is 0.45.
What is the Total Population of Latimer County?
Total Population of Latimer County is 9,537.
What is the Total Male Population of Latimer County?
Total Male Population of Latimer County is 4,838.
What is the Total Female Population of Latimer County?
Total Female Population of Latimer County is 4,699.
What is the Ratio of Males per 100 Females in Latimer County?
There are 102.96 Males per 100 Females in Latimer County.
What is the Ratio of Females per 100 Males in Latimer County?
There are 97.13 Females per 100 Males in Latimer County.
What is the Median Population Age in Latimer County?
Median Population Age in Latimer County is 40.9 Years.
What is the Average Family Size in Latimer County
Average Family Size in Latimer County is 2.8 People.
What is the Average Household Size in Latimer County
Average Household Size in Latimer County is 2.4 People.
How Large is the Labor Force in Latimer County?
There are 3,864 People in the Labor Forcein in Latimer County.
What is the Percentage of People in the Labor Force in Latimer County?
50.6% of People are in the Labor Force in Latimer County.
What is the Unemployment Rate in Latimer County?
Unemployment Rate in Latimer County is 7.8%.